
Discrete-Element-Method-Based Determination of Particle-Level Inputs for the Continuum Theory of Flows with Moderately Cohesive Particles

Department of Chemical and Biological Engineering, University of Colorado Boulder, Boulder, CO 80309, USA
*
Author to whom correspondence should be addressed.
†
Current address: Core R&D, The Dow Chemical Company, Lake Jackson, TX 77566, USA.
Processes 2023, 11(9), 2553; https://doi.org/10.3390/pr11092553
Submission received: 23 June 2023
/
Revised: 26 July 2023
/
Accepted: 1 August 2023
/
Published: 25 August 2023
(This article belongs to the Special Issue Computational and Experimental Study of Granulation in Fluidized Beds)
Abstract
:In this work, the cohesion-specific inputs for a recent continuum theory for cohesive particles are estimated for moderately cohesive particles that form larger agglomerates via discrete element method (DEM) simulations of an oscillating shear flow. In prior work, these inputs (critical velocities of agglomeration and breakage and collision cylinder diameters) were determined for lightly cohesive particles via the DEM of simple shear flow—i.e., a system dominated by singlets and doublets. Here, the DEM is again used to extract the continuum theory inputs, as experimental measurements are infeasible (i.e., collisions between particles of a diameter of <100 μm). However, simulations of simple shear flow are no longer feasible since the rate of agglomeration grows uncontrollably at higher cohesion levels. Instead, oscillating shear flow DEM simulations are used here to circumvent this issue, allowing for the continuum theory inputs of larger agglomerate sizes to be determined efficiently. The resulting inputs determined from oscillating shear flow are then used as inputs for continuum predictions of an unbounded, gas–solid riser flow. Although the theory has been previously applied to gas–solid flows of lightly cohesive particles, an extension to the theory is needed since moderately cohesive particles give rise to larger agglomerates (that still readily break). Specifically, the wider distribution of agglomerate sizes necessitates the use of polydisperse kinetic-theory-based closures for the terms in the solids momentum and granular energy balances. The corresponding continuum predictions of entrainment rate and agglomerate size distribution were compared against DEM simulations of the same system with good results. The DEM simulations were again used for validation, as it is currently extremely challenging to detect agglomerate sizes and the number of fractions in an experimental riser flow.
1. Introduction
Cohesion between solid particles arises from van der Waals or capillary forces, among others [1,2,3]. These cohesive forces may cause the particles to stick together and form agglomerates [4]. Such agglomeration has been shown to decrease the entrainment of particles in fluidized beds [5], affect the segregation and mixing of particles [6], and cause other effects [3,6,7]. Empirical correlations for the entrainment rate of particles from fluidized beds vary by orders of magnitude [8], even for non-cohesive particles. For systems with cohesive particles, semi-physical estimates of agglomerate size may vary up to an order of magnitude when applied to the same system [9]. A better physical understanding of the effects of cohesion is necessary to better predict flows involving cohesive particles. Such predictions are important for the optimization and design of unit operations such as fluidized catalytic crackers, tumblers used to season food, or the mixing of pharmaceuticals.
One technique for the prediction of flows with cohesive particles is the discrete element method (DEM). In the DEM, each particle is tracked using Newton’s second law, and cohesion is incorporated directly [10]. Although the DEM has been widely used for cohesive flows (e.g., [3,11,12,13,14,15,16,17,18]), it is computationally expensive when compared to other methods, such as the continuum theory [19]. The DEM is therefore less useful for direct application to commercial units as well as most lab-scale flows [20,21].
An alternative to the DEM for the prediction of cohesive flows is the continuum approach, which can be applied to unit operations. Continuum theories utilize mass, momentum, and granular energy balances for the solids with closures based on a kinetic-theory analogy. Cohesion is accounted for within this continuum framework via a force balance or a population balance that is coupled to the kinetic-theory balances. In the force-balance approach, the forces acting on an agglomerate are balanced, leading to an algebraic equation for a single, local agglomerate size [22,23]. Although the advantage of this force balance approach is the simplicity of solving an algebraic equation, one disadvantage is the limitation of only a single agglomerate size locally. In contrast, the population balance approach involves a differential balance on the number density of agglomerates, with source and sink terms representing the birth and death of an agglomerate size due to aggregation and breakage, which is solved for each agglomerate size. Accordingly, the population balance approach has the advantage of allowing for the rigorous solution of a distribution of agglomerate sizes at a given location but also has the disadvantage of requiring constitutive equations for the birth and death terms due to aggregation and breakage.
Many previous works with population balances of cohesive-particle flows have involved simple rates of aggregation and breakage that are proportional to the number density of pairs of aggregating or breaking particles (for a review, see Cameron et al. [24]). This approach ignores the dependency of the agglomeration and breakage rate on the frequency of collisions, which will be granular temperature Ts (a measure of the variance of velocities from the mean solids velocity) dependent and, therefore, non-constant. Several previous works express the source and sink terms in the population balance more fundamentally as the product of the collision frequency with the fraction of collisions resulting in agglomeration or breakage—i.e., the success factors of agglomeration in breakage [25,26,27]. The collision frequency is dependent on the collisional cylinder diameter between colliding agglomerate sizes. Several works have utilized constant success factors of agglomeration and breakage [27,28,29], empirical fits of system properties [30,31], or empirical fits of cohesion properties [7,32,33]. These approaches do not account for the effect of impact velocity on the collisional outcome—i.e., high impact velocities between agglomerates lead to breakage or rebound, while low impact velocities lead to aggregation [30,34,35,36]. We recently developed novel closures for the success factors of agglomeration and breakage, where both are expressed as functions of the granular temperature and critical velocities of agglomeration and breakage [25]. These critical velocities of agglomeration and breakage and collision cylinder diameters, which depend on the cohesion and material properties of the particles, are thus required as inputs to the recent continuum theory for cohesive particles.
In several previous works, the critical velocities of agglomeration and breakage and collision cylinder diameters were determined. Several researchers have used pendulum-based experiments to determine the critical velocities of particles subject to capillary forces [35,36,37]. For systems with fine particles (≤100 µm diameter), as are common in fluidized beds, it is infeasible to use these experimental apparatuses due to the small size of the particles. In other work, the critical velocity of aggregation was determined analytically [34,38,39], though this approach is only applicable for collisions of two primary particles when a particle–particle cohesive force model is known and the particles are subject to simple contact mechanics. The DEM has also been employed to determine the critical velocities of agglomeration and breakage [25,40,41,42] via simulation of two agglomerates colliding under controlled conditions and a known cohesion force. One issue with this approach is that there are many collision orientations that give different critical velocities of agglomeration and breakage [40], but the prevalence of a given orientation in a flow is not known a priori. Another disadvantage of using the DEM is that a particle-level cohesive force model is needed, which may be complicated to develop from fundamentals or particle-level experiments [43]. This disadvantage can be overcome by using a simple force model with inputs extracted from bulk experiments [44]. In our previous work, the critical velocity of breakage and collision cylinder diameter were determined from a DEM simple shear flow of many lightly cohesive particles [25]. This approach was advantageous in that it allowed for critical velocities to be determined from a distribution of impact orientations. However, this approach was only able to be used to determine the critical velocity of breakage for singlet-doublet collisions because uncontrolled aggregation occurred when the shear rate was decreased in order to allow agglomerates larger than doublets to form. More recently, DEM simulations of simple shear flow have also been used to calibrate a population balance model applied to a mixer [45].
In the current work, we seek to extend the range of cohesion for which DEM simulations can be used to extract inputs for the recent continuum theory for cohesive particles [25,46]. Specifically, we aim to apply the new continuum theory to systems with agglomerate sizes larger than doublets. DEM simulations of an oscillating shear flow of granular material (no gas phase) are used to determine the critical velocities of agglomeration and breakage and collision cylinder diameters for a range of agglomerate sizes. The current work improves upon previous work where simple shear flow was considered [25] since stable agglomerate sizes beyond doublets are attainable in oscillating shear flow. Next, these cohesion-specific quantities are used as inputs to the continuum theory and applied to unbounded gas–solid riser flow. Here, the continuum theory for cohesive, gas–solid flows developed for lightly cohesive particles [46] is extended to moderately cohesive particles that form larger agglomerates. Specifically, polydisperse kinetic-theory-based closures are used in the solids momentum and granular energy balances. Good agreement is found when the continuum predictions of the entrainment rate and fraction of particles in agglomerates are compared to the DEM results of the unbounded riser. This agreement provides support for the validity of using oscillating shear flow to determine cohesion-specific quantities for more cohesive particles, as well as additional support for the validity of the extended continuum theory.
2. Methods
2.1. Extraction of Inputs to the Continuum Theory for Cohesive Particles
2.1.1. System Overview: Oscillating Shear Flow
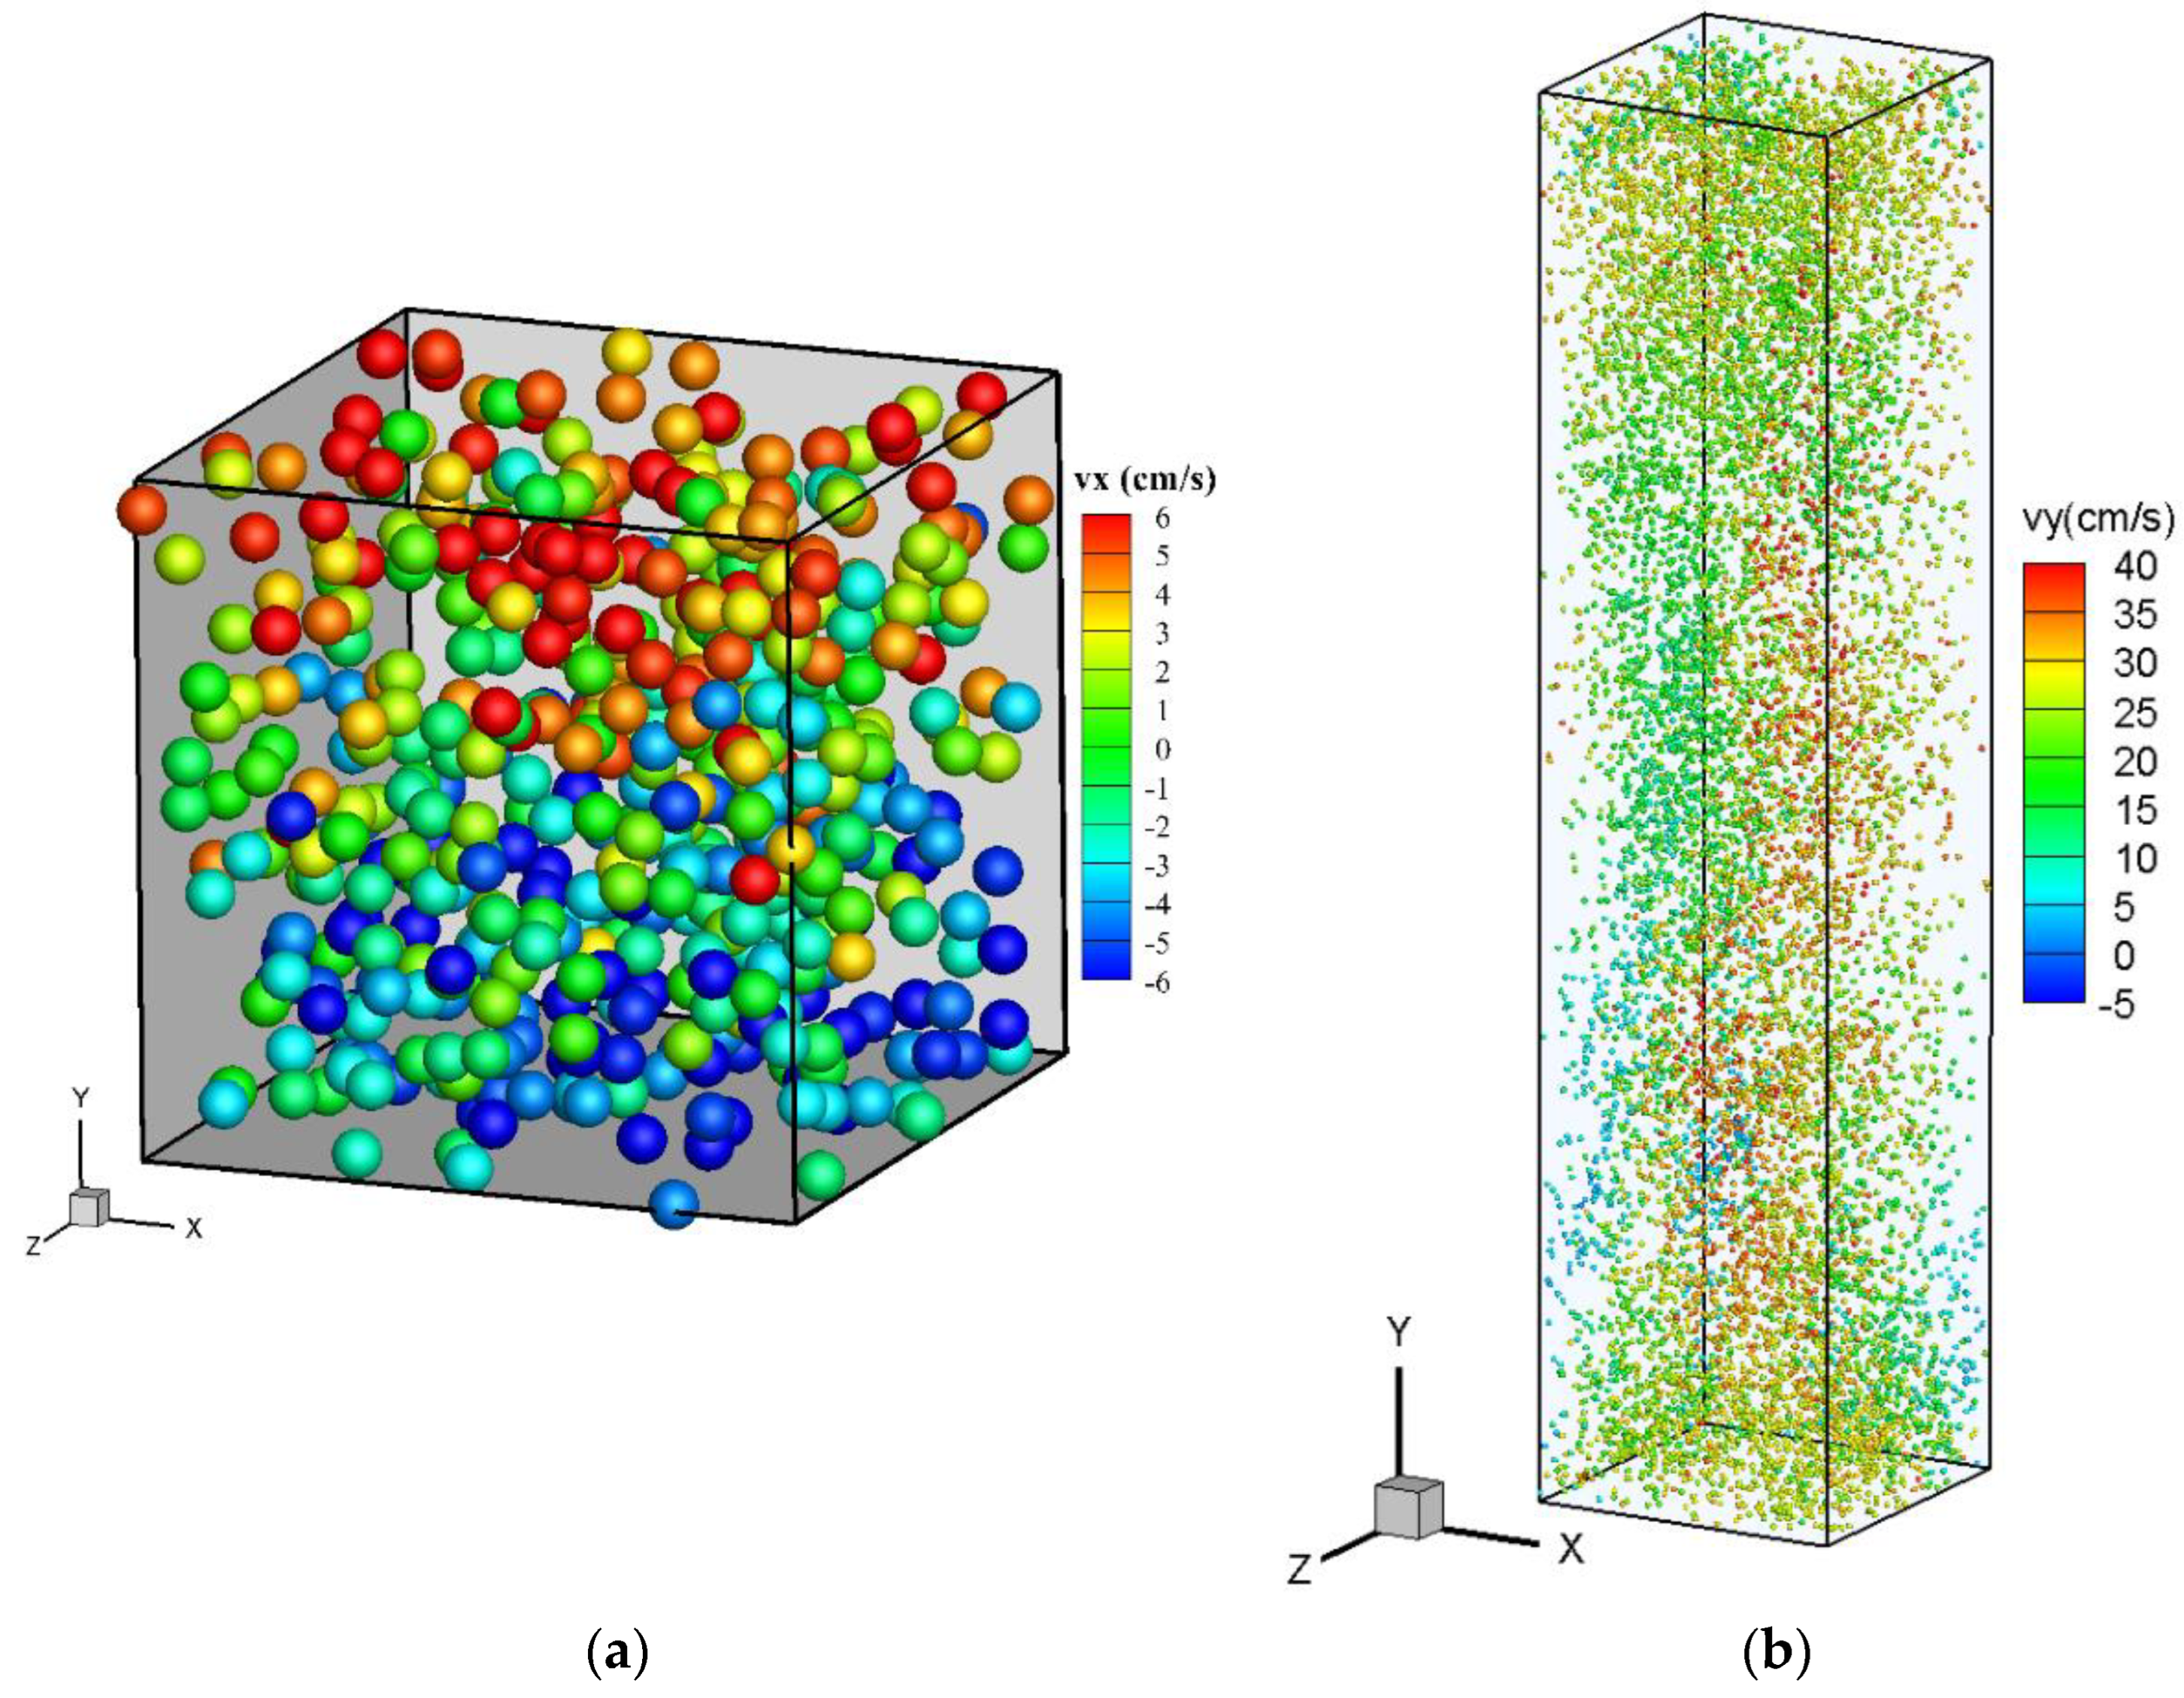
A schematic of the oscillating shear flow system is shown in Figure 1a. This system is a granular gas (particles only, no fluid phase) in a gravity-free environment. Periodic boundary conditions are used on all sides, which are of equal length. The domain size was chosen based on a compromise between sufficient samples of agglomerates and computational expense; a systematic investigation of the effect of the domain size is documented elsewhere [47]. The top and bottom boundaries are Lees Edwards boundary conditions [48], which ensure a constant shear rate. The shear of x velocity in the y direction in the system is oscillated in instantaneous step changes of shear rate between 1 s intervals of 75/s and 1 s intervals of 200/s. Intervals of 1 s were selected since longer periods sometimes led to uncontrolled aggregation during the 75/s intervals.
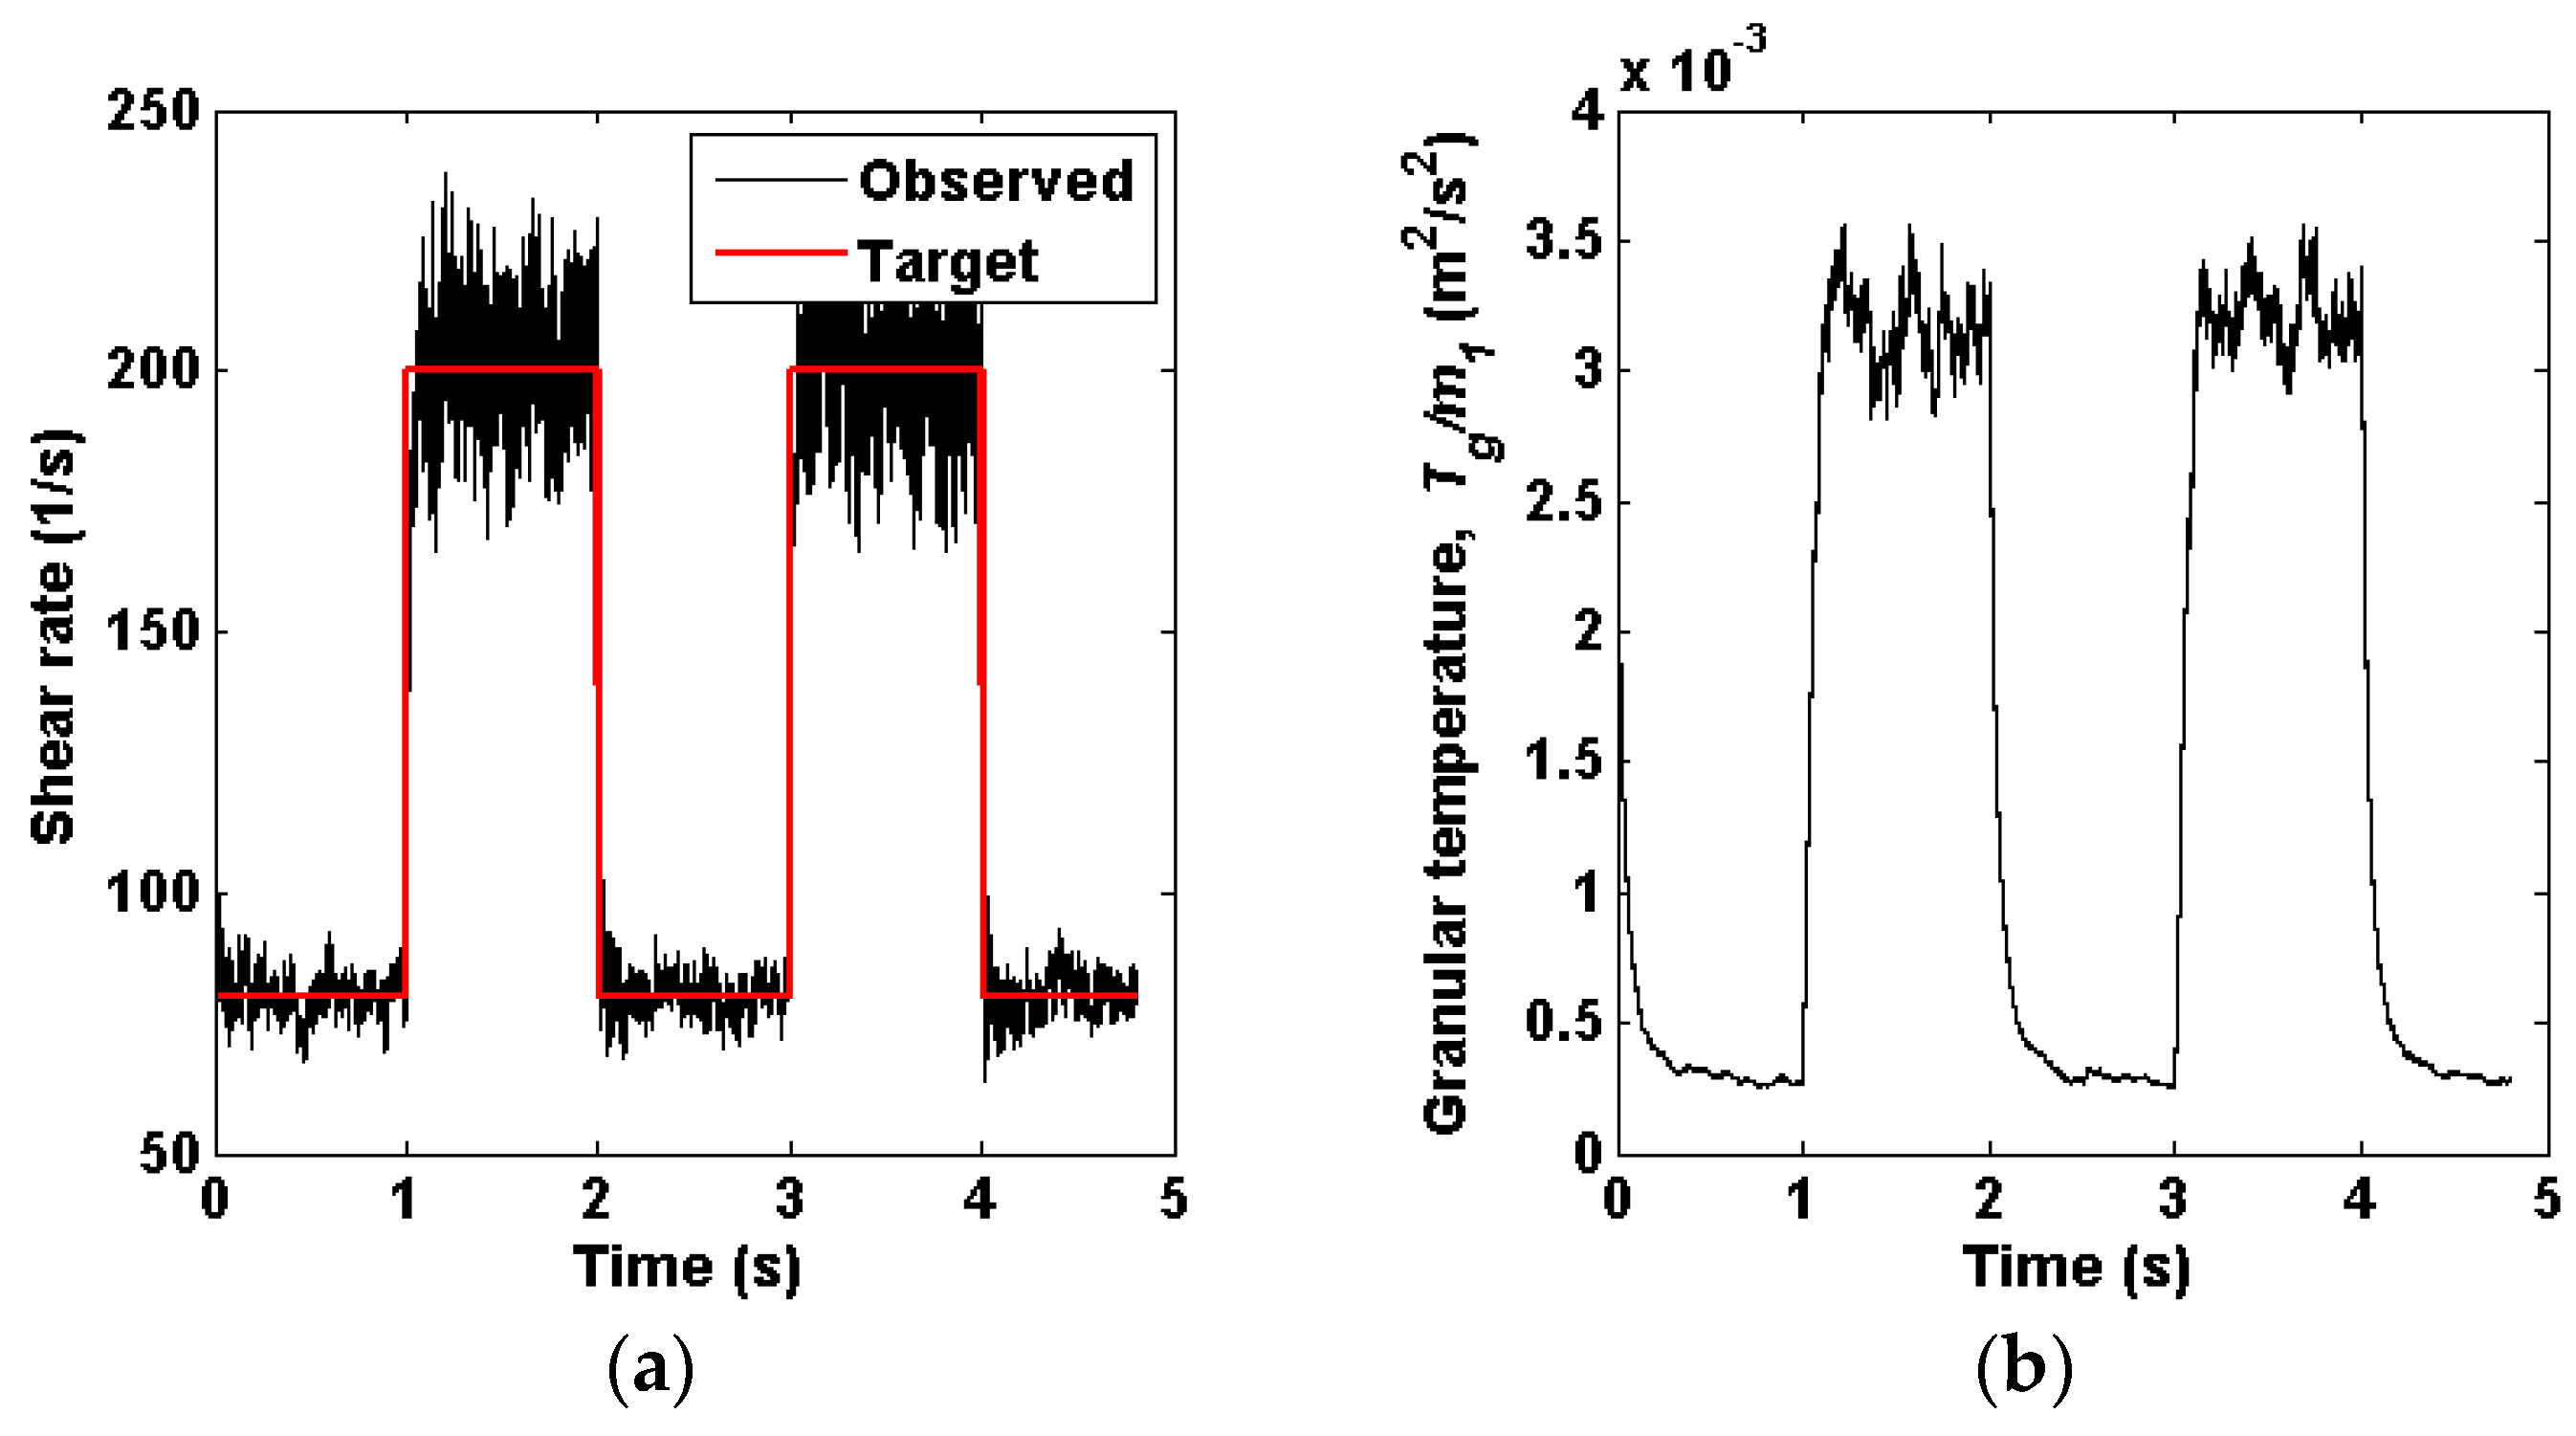
The relationship between the oscillating shear rate and agglomerate size is exemplified in Figure 2 for particles with material and cohesion properties as summarized in Table 1. When the shear rate is low, the granular temperature is also low, and little random motion between particles in the system is observed. Consequently, the collisions between particles occur at low impact velocities, and larger agglomerates form. When the shear rate is high, the granular temperature is also high, and greater random motion between particles in the system is observed. Under these conditions, agglomerates collide with high-impact velocities, causing the agglomerates to break up, and preventing uncontrolled agglomeration. The granular temperature approaches a pseudo-steady state between steps. (If the simulations were run longer at the lower shear rate, uncontrolled agglomeration would eventually occur [25] and the granular temperature would approach zero; therefore, a slight decrease in the granular temperature is observed).
2.1.2. DEM Simulation of Oscillating Shear Flow
An in-house code was used for the DEM simulations of oscillating shear flow. Euler integration was used to solve for the position and velocity of each particle at each time step according to Newton’s second law for each particle:
where m is the particle mass, v is the velocity, t is time, F is the total force, Fcoh is the cohesive force, and Fcont is the contact force. The contact forces were solved using the Hertzian contact model [49], as summarized in Table 2, with the particle properties summarized in Table 1. In Table 2, the subscripts i and j refer to the two interacting particles. The cohesive forces considered here are capillary forces, modeled as [50]:
where a1 is the bridge curvature, a2 is the bridge thickness, D is the separation distance between particles, R is the particle radius, rs is the radius of the small-scale surface asperity [51], ρl is the density of the liquid, RH is the relative humidity, Rg is the ideal gas constant, and T is the thermodynamic temperature. The particle and capillary properties are summarized in Table 1; these properties are characteristic of silica glass beads experiencing 10% relative humidity [51]. It should be noted that the relative humidity in this work is only an input parameter that affects the particle–particle cohesive force model. The relative humidity is not coupled with the fluid phase (which is non-existent in the oscillating shear flow simulations). The half angle of the capillary bridge β was solved for numerically from Equations (4)–(7) and subsequently used to calculate a1, a2, and the cohesive force in Equation (2). A fifth-order polynomial fit of the numerical solution for the cohesive force as a function of separation distance D in Equation (2) was then used for the cohesive force in the DEM simulations [51]. Young’s modulus is artificially soft relative to glass for computational efficiency, as the intent of this work is proof of concept. When using DEM simulations to extract the input parameters needed for continuum theory, the actual values of particle properties should be used, as they can impact the extracted quantities. For example, for the particles explored here, the use of Young’s modulus below 10 MPa can lead to substantially increased cohesive interactions between particles [15] and consequently increased critical velocities of aggregation and breakage.
2.1.3. DEM Extraction of Cohesion-Specific Inputs for Continuum Theory
The results of the DEM oscillating shear flow simulations were used to determine the cohesion-specific inputs for the new continuum theory—i.e., critical velocities of agglomeration and breakage and collision cylinder diameters. First, the granular temperature (instantaneous mean square difference of the velocities with respect to the instantaneous spatial average of velocities), number density of each agglomerate size, collision frequency between each pair of agglomerate sizes, and the agglomeration and breakage frequencies were collected in 10 replicate DEM oscillating shear flow simulations with different random initial conditions. Each simulation was run for five oscillations. These results were time-averaged over all 10 replicate simulations to yield a single granular temperature, number density for each agglomerate size, and collision frequency between each pair of agglomerate sizes. The success factors of agglomeration and breakage were then calculated as the ratio of the number of agglomeration and breakage frequencies to the collision frequency, respectively. Using this calculated success factor and the observed granular temperature in the DEM, the critical velocities of agglomeration and breakage were calculated from the continuum theory expressions for the success factors (Equations (18) and (19) below). Next, the continuum expression for collision frequency (Equation (17) below) was rearranged and the granular temperature and collision frequency observed in the DEM were used in this equation to calculate the collision cylinder diameters.
It should be noted that in addition to using the oscillating shear flow system to determine the critical velocities and the collision cylinder diameters, oscillating shear flow can be used to determine the daughter distribution functions as a function of agglomerate size, particle properties, and granular temperature. For the particles and agglomerates explored here, over 99% of the breakages resulted in all singlets. Therefore, in the continuum simulations of the unbounded riser system used for validation, it was assumed that all daughters were singlets.
2.2. Testing of the Continuum Theory for Cohesive Particles and DEM-Based Inputs
2.2.1. System Description: Unbounded Riser
A schematic of the unbounded riser flow is shown in Figure 1b. Periodic boundary conditions were used on all sides. Gravity acted in the downward vertical direction with a value of g = −9.81 m/s2. A pressure gradient equal to the weight of the system normalized by the cross-sectional area of the system was instituted in the upward direction to counteract gravity and yield a system with a constant velocity and no net acceleration. Both the DEM and continuum simulations were initialized with no particles in agglomerates and with zero mean velocity for the gas and solids. The particles simulated in the unbounded riser have the same properties as in the oscillating shear flow simulations, as summarized in Table 1. The simulations were run for 2 s, considerably beyond the time at which the system (mean particle speed and fraction of agglomerates) had reached a steady state. The solid volume fraction was varied from εs = 0.0075 to 0.02. A computational fluid dynamics grid size of Δx/d1 = 2 was used as this is near the finest grid size allowable in the DEM (if this ratio is lower, the solid volume fraction in a cell can exceed 1).
2.2.2. Continuum Theory Simulations
The population balance equation for the number density ni of each agglomerate size i (i = 1 to 5 for singlets through quintets, as <1% of agglomerates were observed to be in agglomerates larger than quintets in the DEM unbounded riser simulations) is given by [25]:
where the first term on the left is the transient term and the second term is the convective term. On the right are the birth due to aggregation, death due to aggregation, birth due to breakage, and death due to breakage terms, which are given by [25]:
respectively, with the Kronecker delta function given by:
The daughter distribution function is approximated here as:
The aggregation and breakage kernels are:
with the collision frequency given by:
and the success factors of agglomeration and breakage given by:
respectively. Here, ui is the mean velocity of agglomerate size i. Ti is the granular temperature of agglomerate size i, which represents the random fluctuating energy of the particles and is proportional to the variance of the velocities from the local mean velocity of the agglomerate size i. g0,i,j is the radial distribution function [52]. va,crit,i,j is the critical velocity of agglomeration, and vb,crit,i,j is the critical velocity of breakage between agglomerate sizes i and j. dofi is the degrees of freedom of agglomerate size i (3 for singlets, 5 for doublets, and 6 for agglomerates larger than doublets). Note that in Equation (13), the daughter distribution function b assumes that all of the particles in agglomerates that undergo agglomeration are in daughters of size singlets. This assumption was made since over 99% of the breakages observed in the oscillating shear flow showed complete breakage.
In addition to the population balance, a momentum balance is performed on each agglomerate size [52]:
where Pc and Pk are the collisional and kinetic granular stress tensors, respectively, Kgi is the gas–solid interphase momentum exchange (drag) coefficient given as an extension [53] of Koch–Hill–Ladd [54] (summarized in Appendix A), g is the gravity vector (−9.81 m/s2 in the downward y-direction), and FDip is the solid–solid drag force vector, which represents momentum exchange between agglomerates of different sizes due to collisions. s is the number of agglomerate sizes considered. The closures for Pc, Pk, and FDip are derived from polydisperse kinetic theory [52], are summarized in Appendix B, and utilize the diameter of a sphere with the equivalent volume of each agglomerate size and the effective coefficient of restitution <eeff>. The coefficient of restitution, which is the ratio of the post-collisional impact velocity to the pre-collisional impact velocity, is a measure of how much energy is dissipated during an inelastic collision. The first term on the left side of this equation is the transient term. The second term on the left side is the convective term. The term εi∆Pg/H refers to the pressure gradient, where εi is the solids volume fraction of agglomerate size i and ∆Pg/H is equal to the weight of the system divided by the volume of the system, so the net force acting on the system is zero and the system as a whole does not accelerate. The εi∆Pg/H term is specific to the unbounded riser flow with the periodic top and bottom boundary conditions applied here. This term is applied as a uniform volumetric force and therefore does not violate the periodicity of the gas nor the solids pressure. The second term on the right side of the equation is the divergence of the stress tensor. The third term on the left side represents gas–solid drag. The fourth term on the right side of the equation represents gravity. The FDip term represents solid–solid momentum exchange due to collisions between different agglomerate sizes. The Dimiui term represents the loss of momentum due to death of agglomerate size i, and the final term Di→pmpup represents the gain of momentum due to birth of agglomerate size i from the death of agglomerate size p.
In addition to the solids momentum balances, granular energy must also be balanced. In previous work [46], only lightly cohesive particles that formed singlets and doublets were considered. Correspondingly, a single granular energy balance was solved as the systems were mostly singlets with some doublets. On the other hand, the particles in the current work are moderately cohesive and form agglomerates larger than doublets. Since a wider distribution of agglomerate sizes is considered, polydisperse kinetic-theory-based closures are employed here, and a granular energy balance is performed on each agglomerate size [52]:
where the first term on the left is the transient term and the second term on the left is the convective term. On the right, the terms with qc and qk are the collisional and kinetic diffusion of granular energy, respectively; the second term on the right side represents the generation of granular energy due to shear; the term with Nip represents the dissipation of granular energy due to collisions; and ui∙FDip represents the generation of granular energy due to collisions between the different agglomerate sizes. The mean effective coefficient of restitution <eeff> used in the closures for the momentum and granular energy balances is given by [25]:
The effective coefficient of restitution is less than the intrinsic coefficient of restitution since cohesive particles undergo additional dissipation during collision relative to their non-cohesive counterparts [34,39,55,56]. The value of the effective coefficient of restitution is dependent on the mechanism and magnitude of cohesion acting on the particles, as well as the particle properties. For simplicity, the effective coefficient of restitution eeff as a function of impact velocity vn is approximated here using a closure given by the square well model [39]:
This closure allows for different mechanisms and magnitudes of cohesion to be captured via the well depth term Dwell, which is related to the critical velocity of aggregation. The effective coefficient of restitution as a function of impact velocity could also be determined numerically from the DEM for a given cohesion model. The Heaviside function is given as:
the well depth is related to cohesion through the critical velocity by [39]:
and the impact velocity distribution is:
Finally, continuity and momentum balances are solved for the gas phase:
with gas density ρg = 0.97 kg/m3 and gas viscosity μg = 1.8335 × 10⁻⁵ Pa∙s, which are characteristic of air under local, ambient conditions. The leftmost term in Equations (27) and (28) is the transient term; the second term is the convective term. On the right side of Equation (28), the first term applies the pressure drop to the system, the second term is the divergence of the stress tensor and gives the diffusion of momentum, the third term represents gravity, and the final term represents the drag force exerted by each of the agglomerate sizes in the system.
The continuum theory simulations were solved using the multiphase Eulerian–Eulerian framework of ANSYS Fluent 17.0. The primary phase was the gas phase, with five secondary phases representing five agglomerate sizes. Many of the closures used in this work (especially the rates of agglomeration and breakage and the effective coefficient of restitution [25]) are not available off-the-shelf in any commercial computational fluid dynamics software. Therefore, the closures used in this work were calculated using in-house user-defined subroutines. The implementation of each term into Fluent was verified via manual calculations. In the continuum simulations, periodic boundary conditions were used for the gas phase on the top and bottom boundaries, with a pressure gradient equal to the weight of the system normalized by the area applied throughout the system in the upwards y-direction. Since the top and bottom boundary conditions were fully periodic in the continuum simulations, the system could be viewed as a moving reference frame. Identical boundary conditions were not available in the software package used for the DEM simulations, which had a fixed reference frame. Therefore, the velocity of the gas and each agglomerate size obtained from the continuum simulations were adjusted by the same amount so that the average gas velocity in the continuum simulations matched the average gas velocity in the DEM simulation (the gas and solid profiles were flat in both the DEM and continuum simulations). In the continuum simulations, the initial granular temperature used was Ti/mi = 10−4 m2/s2. The user-defined function utilized in ANSYS Fluent, along with an example case and data file, are provided as Supplementary Information.
2.2.3. DEM Simulations
For the DEM simulations of the unbounded riser, Newton’s second law is again solved on each particle in the system:
where Fg is the gravitational force and Fdrag is the gas–solid drag force (given by an extension [53] of Koch–Hill–Ladd [54] given in Appendix A). The cohesive and contact forces are identical to those described for the oscillating shear flow simulations (Equations (2)–(7) and Table 2). In addition to Newton’s second law on the particles, the equations of continuity and momentum balance are solved for the gas phase:
The DEM riser flow simulations were performed using MFiX 2016-1 computational fluid dynamics software [57]. The solids phase had periodic boundary conditions across the top and bottom boundary conditions for the DEM, as was used in the continuum simulations. In the DEM simulations, the bottom boundary condition was a pressure inlet with the inlet pressure adjusted at each time-step in order to reach the target average gas velocity summarized in Table 3. The top boundary condition in the DEM simulations was a pressure outflow. The initial positions of the particles in the DEM simulations were randomized, and the particles were all initially at rest. An example setup file from MFiX for unbounded riser flow with a solids fraction of 0.1 is provided as Supplementary Information.
3. Results and Discussion
3.1. Extraction of Continuum (Population Balance) Inputs from the DEM of Oscillating Shear Flow
Oscillating shear flow simulations were used to calculate all of the critical velocities and collision cylinder diameters for simulations of agglomerates of size up to quintets, as shown in Figure 3. Each agglomerate-pair combination is represented in Figure 3, with one agglomerate size given on the x-axis and the size of its collision partner given by the different markers. Duplicate combinations are not shown. More specifically, a specific pair combination is found via the larger agglomerate size on the x-axis and the lesser or equal agglomerate size according to the marker type (e.g., for doublet–quadruplet collisions, see the red diamond data point at x = 4). Exceptions to the trends noted here (e.g., quadruplet–quintet collisions for the critical velocity of agglomeration and doublet-triplet collisions for the collision cylinder diameter) are discussed below.
As shown in Figure 3a, the critical velocity of aggregation shows a general decreasing trend with increasing agglomerate size (except for collisions involving singlets), as expected. This trend can be explained via consideration of what happens after initial contact. When agglomerates collide, two outcomes are possible if they stick together. First, the agglomerates may undergo significant rearrangement during a collision (e.g., two roughly spherical agglomerates change shape during a collision to form a single roughly spherical agglomerate). Alternatively, the agglomerates may collide at a single point, and then each one rotates such that multiple points of contact result in no significant rearrangement of the colliding agglomerates themselves (e.g., two roughly spherical agglomerates collide and rotate to form an agglomerate shaped like two contacting spheres). In the DEM portion of this work, the latter occurs—i.e., colliding agglomerates are observed to rotate and then contact at multiple points. As the size of the colliding agglomerates increases, the final number of contacts between the colliding pair is expected to remain relatively constant. Because the maximum cohesive force between the colliding agglomerates is proportional to the number of contacts they share after collision and rotation, the maximum cohesive force between colliding agglomerates is also expected to remain relatively constant. Moreover, since the cohesive energy between agglomerates (the integral of the cohesive force over the separation distance from contact to infinite separation) is proportional to the maximum cohesive force, the cohesive energy also stays constant with the agglomerate size. Finally, for two agglomerates to separate during a collision, the cohesive energy between the two agglomerates must be overcome by the kinetic energy of the two colliding agglomerates which is proportional to meffva,crit2 (Equation (25)). As the agglomerate size increases, meff increases, and therefore, va,crit must decrease for the cohesive energy (and therefore meffva,crit2) to remain constant (Figure 3a).
With regard to collisions involving singlets, Figure 3a indicates a general increasing trend of the critical velocity of agglomeration with increasing agglomerate size. For such collisions, the number of contacts after collision and rotation between the singlet and the colliding agglomerate increases as the agglomerate size increases. Therefore, the maximum cohesive force between the singlet and agglomerates increases with the increasing agglomerate size, as does the cohesive energy. For the singlet to separate from the agglomerate during a collision, the singlet-agglomerate pair must have kinetic energy proportional to meffva,crit2, which is proportional to the cohesive energy (Equation (25)). Meff also increases as the agglomerate pair size increases. Meff is the hyperbolic mean mass of the singlet and the agglomerate pair size, so it increases less quickly than the cohesive energy increases, which scales approximately with the agglomerate pair size (approximately one additional contact after collision and rotation per additional particle in an agglomerate pair). Therefore, the critical velocity va,crit is thus expected to increase for singlet-agglomerate collisions as the agglomerate size increases, which is consistent with Figure 3a.
In Figure 3b, the critical velocity of breakage shows a general downward trend for agglomerate-agglomerate collisions (collisions not including singlets). Note that breakage occurs if any number of particles (even a singlet) break off either of the original agglomerates. The cohesive energy holding a single particle to an agglomerate is approximately constant with increasing agglomerate size, so the kinetic energy needed to break a single particle off of an agglomerate is assumed constant. Therefore, as the agglomerate size and mass increase, the critical velocity of breakage must decrease (the kinetic energy is proportional to the product of the mass and the square of the critical velocity of breakage). Some exceptions to this trend are noted below. Further investigation is merited to explore why the critical velocity of breakage between singlets and agglomerates remains relatively constant with increasing agglomerate pair size.
As the agglomerate size increases, the collision cylinder diameter generally also increases, as shown in Figure 3c. This observation stems from the increase in the collision area with the agglomerate size.
The critical velocities of agglomeration and breakage and collision cylinder diameters shown in Figure 3 have increasing uncertainty as the agglomerate size increases. More specifically, as the agglomerate size increases, the number density of that agglomerate size decreases, and the collision frequency with these larger agglomerates decreases. Therefore, some combinations of collisions with larger agglomerates are not observed frequently or at all. This uncertainty may explain exceptions to the trends observed above (e.g., quadruplet–quintet collisions have a higher critical velocity of agglomeration than quadruplet–quadruplet collisions, doublet–quadruplet collisions have a lower critical velocity of breakage than doublet–quintet collisions, and doublet–doublet collisions have similar collision cylinder diameters to doublet–triplet collisions). No quintet–quintet collisions were observed that resulted in full agglomeration. Therefore, no critical velocity of agglomerates for quintet–quintet collisions can be calculated. Since only agglomerates as large as quintets are considered in the continuum theory simulations, the quintet–quintet agglomeration mechanism is not included in the theory, and the critical velocity of agglomeration for quintet–quintet collisions was not used. Furthermore, all triplet–quintet, quadruplet–quadruplet, and quintet–quintet collisions that were observed resulted in breakage. These observed collisions led to a calculated value of the critical velocity of breakage of 0 for each of these collision combinations, though physically it is expected that the critical velocity of breakage must be non-zero (otherwise agglomerates could spontaneously break).
3.2. Testing of the Continuum Theory in the Unbounded Riser
Quantities extracted from the oscillating shear flow simulations were used as inputs to the continuum simulations of unbounded riser flow. The resulting predictions from the continuum theory for the unbounded riser flow (Equation (8) coupled with Equations (9)–(28) are summarized in Figure 4, along with DEM simulations of the same system (Equation (9)). In Figure 4a, the fraction of particles in agglomerates remains relatively constant for both the DEM and continuum simulations as the solid volume fraction changes. This trend makes sense since the agglomeration and breakage rates did not change significantly in this work with changes in solid volume fraction. More specifically, the rates of agglomeration and breakage are proportional to the collision frequency and the corresponding success factors. The collision frequency scales with the solid volume fraction (Equation (17)), causing both the rates of agglomeration and breakage to scale with the solid volume fraction and hence having no net effect on the fraction of particles in agglomerated. However, the success factors of agglomeration and breakage depend on the granular temperature (Equations (18) and (19)), which is coupled to the solid volume fraction. In particular, the two terms in the granular energy balance that depend on the solid volume fraction are the generation of granular energy due to collisions between different agglomerate sizes (ui∙FDip term in Equation (21)) and the dissipation of granular energy due to inelastic collisions (Nip in Equation (21)). Both of these terms are roughly proportional to the square of the solid volume fraction [52]. Therefore, as the solid volume fraction is changed, both of these terms scale similarly, thereby canceling the effects of the solids fraction. It is also worth noting that both the ui∙FDip and Nip terms also depend on the granular temperature [52], which is only independent of the solid volume fraction when the effective coefficient of restitution is roughly independent of the granular temperature. At higher values of Ts as observed here, f(vn) is biased toward high vn according to Equation (26). Consequently, the mean coefficient of restitution <eeff> (Equation (22)) will be biased toward the value of eeff(vn) at higher vn, which is approximately equal to the constant intrinsic coefficient of restitution (Equation (23)). Under these conditions, small changes in the solid volume fraction do not affect the granular temperature, the success factors, the rates of agglomeration and breakage, or the fraction of particles in agglomerates (Figure 4a).
It should be noted that the result of the fraction of particles in agglomerates being insensitive to the solid volume fraction observed here (Figure 4a) was not observed in previous work [46]. In that previous work, the particles were less cohesive, and the agglomerates were smaller and therefore had a smaller range of terminal slip velocities (the difference between gas and agglomerate velocities). Consequently, there was a smaller relative velocity between the agglomerate sizes compared to the current work. The smaller relative velocity in the previous work led to lower generation of granular energy due to collisions (ui∙FDip term in Equation (21)), and hence a smaller granular temperature. Under those conditions (at lower Ts), the impact velocity distribution f(vn) shifts towards lower vn, leading to lower values of eeff that are sensitive to Ts according to Equations (22) and (26) (at higher Ts, eeff is approximately eint and independent of Ts). The dissipation term (Nip in Equation (21)) depends on the effective coefficient of restitution [52] and is therefore sensitive to the granular temperature as well. The dissipation term Nip also affects the granular temperature, exacerbating the effect of small perturbations in the granular temperature. Therefore, small changes in granular temperature (like those caused by small changes in the solid volume fraction) ultimately lead to larger changes in granular temperature. This sensitivity of the granular temperature to the solid volume fraction in previous work when the granular temperature was low led to significant changes in the success factors of agglomeration and breakage (Equations (18) and (19)) as well as the collision frequencies between agglomerates (Equation (17)). Therefore, the agglomeration and breakage rates (the product of the success factors and collision frequencies) changed significantly as the solid volume fraction changed, and the fraction of particles in each agglomerate size changed significantly in the previous work as the solid volume fraction was changed.
Qualitatively, the DEM results show that the fraction of particles in each agglomerate size decreases as the agglomerate size increases, as seen in Figure 4a. In the current work, the granular temperature is sufficiently high that the success factor of breakage is high and the success factor of agglomeration is low (Equations (18) and (19)). The high success factor of breakage and low success factor of agglomeration lead to significant breakage and little agglomeration. The significant breakage and lack of agglomeration limit the agglomerate size such that most of the particles are in primary particles, with fewer particles in each increasing agglomerate size. The continuum theory gives a similar trend of decreasing fraction of particles in agglomerates with increasing agglomerate size, though it greatly under-predicts the fraction of particles in quadruplets, which is predicted to be even less than the fraction of particles in quintets. This non-monotonic trend in the continuum prediction will be addressed below.
Quantitatively, the results between the DEM and continuum theory are in decent agreement (within a factor of 2) except in the case of quadruplets. Recall that fewer collisions were observed with larger agglomerates than smaller agglomerates in the simulations of oscillating shear flow. The lack of collisions with larger agglomerates leads to larger uncertainty in the critical velocities of agglomeration and breakage and collision cylinder diameters calculated for collisions of larger agglomerates and, consequently, larger uncertainty in the rates of aggregation and breakage for larger agglomerates. It is therefore expected that the continuum prediction of the fraction of particles in agglomerates should become less accurate as the agglomerate size increases; this discrepancy is observed and increases for doublets, triplets, and quadruplets. Surprisingly, the continuum theory appears to give a relatively good quantitative prediction of the fraction of particles in quintets. A plausible explanation for this agreement is that two major competing sources of error have canceled out. First, uncertainty in the critical velocities of agglomeration and breakage for the quintets should lead to under-prediction of the fraction of particles in agglomerates, as was the case for quadruplets (Figure 4a). Second, all of the terms that lead to the death of quintets due to agglomeration are neglected in the continuum theory (since no agglomerates larger than quintets are included here). Without this sink term, the fraction of particles in quintets is expected to be over-predicted. Conversely, introducing sextets would introduce the term representing the death of quintets due to aggregation with singlets into the population balance for quintets. This term would be a major sink of quintets and we speculate that this sink would consequently lead to under-prediction of the fraction of particles in quintets.
Similar to previous work [46], the total entrainment rate in Figure 4b increases nearly linearly with the total solid volume fraction (εs,total) in both the DEM and continuum theory since the entrainment flux Js,I = us,iεs,iρs,I = us,iφiρs,iεs,total, where φi is the fraction of particles in agglomerate size i. Similarly, the entrainment rate of each agglomerate size varies linearly with the solid volume fraction of each agglomerate size (φiεs,total). Consequently, the same trends and associated errors for the fraction of particles in agglomerates propagate into the entrainment rate prediction. Nonetheless, the error between the continuum theory and the DEM results for the total entrainment rate shown here is less than 11%. This error is notably less than the error in our previous work with lightly cohesive particles in an unbounded riser flow, which yielded over-prediction of the entrainment rate by up to 35% for stable systems [46]. In the current work, less than 5% of particles in the DEM simulations are in agglomerates larger than quintets, which is the largest agglomerate size considered in the continuum theory here. The presence of these larger agglomerates in the DEM but not in the continuum theory is a source of error. In the previous work, only doublets and singlets were considered in the continuum theory, and in some cases, more than 5% of the particles were in agglomerates larger than doublets. Therefore, fewer errors can be expected in the current work, which includes more agglomerate sizes and thus neglects fewer of the total particles in the system. It should also be noted that other empirical entrainment rate correlations vary in the prediction of the entrainment rate by up to ten orders of magnitude for a given system [58], which this work improves upon greatly.
The agreement between the continuum theory and DEM results shown here provides support for the validity of the determination of the critical velocities of agglomeration and breakage and collision cylinder diameters from oscillating shear flow simulations. Furthermore, this agreement provides preliminary support for the validity of the continuum theory for cohesive particles for use with more than two agglomerate sizes, as well as for use with a polydisperse kinetic theory.
4. Conclusions
In this work, the critical velocities of agglomeration and breakage and the collision cylinder diameters are calculated from a DEM oscillating shear flow. For the first time, this method allows for the continuum theory of particle-level inputs for moderately cohesive particles that form agglomerates larger than doublets to be determined from DEM simulations, compared to past work which was restricted to lightly cohesive particles [46]. The critical velocities of agglomeration and breakage and collision cylinder diameters that are calculated in this work from the DEM simulations of oscillating shear flow are then used as inputs for continuum simulations of an unbounded, gas–solid riser flow. DEM simulations of an unbounded riser flow were again performed for validation of the continuum theory and oscillating shear flow method of determining the critical velocities of agglomeration and breakage, as it is extremely difficult to detect agglomerates in an experimental riser flow. Agglomerate sizes up to quintets were explored. The continuum results were compared to the DEM simulations of the same riser system and show qualitatively and quantitatively decent agreement for the fraction of particles in agglomerates and the entrainment rate for all agglomerate sizes except quadruplets, which the continuum theory greatly under-predicts. Some of the errors in the current work are due to truncated mechanisms of death due to aggregation for larger agglomerates since only five agglomerate sizes were considered. Another source of error is the uncertainty in the critical velocities of agglomeration and breakage and collision cylinder diameters calculated for collisions involving larger agglomerates. Nevertheless, it should be noted that previous works give entrainment rate correlations that vary by up to 10 orders of magnitude, which the current work improves upon greatly.
The good agreement between the continuum and DEM results for the entrainment rate and agglomerate size distribution provides support for the method of extracting critical velocities of agglomeration and breakage and collision cylinder diameters from DEM oscillating shear flow simulations. Furthermore, this good agreement also provides preliminary support for the validity of the continuum theory for cohesive particles in a multiphase system with more than one agglomerate size.
In future work, systems with gradients should be explored. This exploration is important as the homogeneous system considered here does not have spatial gradients in the flow variables needed to test the shear stress terms in the solids momentum balance and diffusion of granular energy terms in the granular energy balance. Additionally, the dataset of critical velocities of agglomeration and breakage as well as the collision cylinder diameters presented here should be made more robust by exploring systems with larger agglomerates and wider ranges of agglomerate sizes. Finally, different levels and types of cohesion should be explored.
Supplementary Materials
The following supporting information can be downloaded at: https://www.mdpi.com/article/10.3390/pr11092553/s1.
Author Contributions
Conceptualization, C.M.H.; Methodology, K.M.K., P.L. and C.M.H.; Software, K.M.K. and P.L.; Validation, K.M.K. and P.L.; Formal analysis, K.M.K. and P.L.; Investigation, K.M.K. and P.L.; Writing—original draft, K.M.K.; Writing—review & editing, P.L. and C.M.H.; Visualization, K.M.K. and P.L.; Supervision, C.M.H.; Project administration, C.M.H.; Funding acquisition, C.M.H. All authors have read and agreed to the published version of the manuscript.
Funding
The authors are grateful for the financial support provided by the Dow Corning Corporation, a wholly owned subsidiary of the Dow Chemical Company, and the National Science Foundation (CBET-1707046). The authors thank Casey LaMarche for stimulating discussions. This work utilized the RMACC Summit supercomputer, which is supported by the National Science Foundation (Awards ACI-1532235 and ACI-1532236), the University of Colorado Boulder, and Colorado State University. The Summit supercomputer is a joint effort between the University of Colorado Boulder and Colorado State University.
Conflicts of Interest
The authors declare no conflict of interest.
Appendix A. Drag Closures from Extension [53] of Koch–Hill–Ladd [54]
Appendix B. Continuum Theory Closures from Iddir and Arastoopour [52]
References
- Visser, J. Van der Waals and other cohesive forces affecting powder fluidization. Powder Technol. 1989, 58, 1–10. [Google Scholar] [CrossRef]
- Henthorne, K.; Hrenya, C. Particle cohesion. In Particle Theory and Applications; CRC Press: Boca Raton, FL, USA, 2012. [Google Scholar]
- Galvin, J.E.; Benyahia, S. The effect of cohesive forces on the fluidization of aeratable powders. AIChE J. 2013, 60, 473–484. [Google Scholar] [CrossRef]
- Castellanos, A.; Valverde, J.M.; Quintanilla, M.A.S. Aggregation and sedimentation in gas-fluidized beds of cohesive powders. Phys. Rev. E 2001, 64, 041304. [Google Scholar] [CrossRef] [PubMed]
- Geldart, D.; Harnby, N.; Wong, A. Fluidization of cohesive powders. Powder Technol. 1984, 37, 25–37. [Google Scholar] [CrossRef]
- Tomas, J. Fundamentals of cohesive powder consolidation and flow. Granul. Matter 2004, 6, 75–86. [Google Scholar] [CrossRef]
- Calvert, G.; Ghadiri, M.; Tweedie, R. Aerodynamic dispersion of cohesive powders: A review of understanding and technology. Adv. Powder Technol. 2009, 20, 4–16. [Google Scholar] [CrossRef]
- Chew, J.W.; Cahyadi, A.; Hrenya, C.M.; Karri, R.; Cocco, R.A. Review of entrainment correlations in gas–solid fluidization. Chem. Eng. J. 2015, 260, 152–171. [Google Scholar] [CrossRef]
- Shabanian, J.; Jafari, R.; Chaouki, J. Fluidization of Ultrafine Powders. Int. Rev. Chem. Eng. 2012, 4, 16–50. [Google Scholar]
- Mikami, T.; Kamiya, H.; Horio, M. Numerical simulation of cohesive powder behavior in a fluidized bed. Chem. Eng. Sci. 1998, 53, 1927–1940. [Google Scholar] [CrossRef]
- Chaudhuri, B.; Mehrotra, A.; Muzzio, F.J.; Tomassone, M.S. Cohesive effects in powder mixing in a tumbling blender. Powder Technol. 2006, 165, 105–114. [Google Scholar] [CrossRef]
- Anand, A.; Curtis, J.S.; Wassgren, C.R.; Hancock, B.C.; Ketterhagen, W.R. Predicting discharge dynamics of wet cohesive particles from a rectangular hopper using the discrete element method (DEM). Chem. Eng. Sci. 2009, 64, 5268–5275. [Google Scholar] [CrossRef]
- Figueroa, I.; Li, H.; McCarthy, J. Predicting the impact of adhesive forces on particle mixing and segregation. Powder Technol. 2009, 195, 203–212. [Google Scholar] [CrossRef]
- Hou, Q.; Zhou, Z.; Yu, A. Micromechanical modeling and analysis of different flow regimes in gas fluidization. Chem. Eng. Sci. 2012, 84, 449–468. [Google Scholar] [CrossRef]
- Liu, P.; LaMarche, C.Q.; Kellogg, K.M.; Hrenya, C.M. Fine-particle defluidization: Interaction between cohesion, Young’s modulus and static bed height. Chem. Eng. Sci. 2016, 145, 266–278. [Google Scholar] [CrossRef]
- Gu, Y.; Ozel, A.; Sundaresan, S. A modified cohesion model for CFD–DEM simulations of fluidization. Powder Technol. 2016, 296, 17–28. [Google Scholar] [CrossRef]
- Ucgul, M.; Fielke, J.M.; Saunders, C. Three-dimensional discrete element modelling (DEM) of tillage: Accounting for soil cohesion and adhesion. Biosyst. Eng. 2015, 129, 298–306. [Google Scholar] [CrossRef]
- Hou, Q.; Dong, K.; Yu, A. DEM study of the flow of cohesive particles in a screw feeder. Powder Technol. 2014, 256, 529–539. [Google Scholar] [CrossRef]
- van der Hoef, M.; Annaland, M.v.S.; Deen, N.; Kuipers, J. Numerical Simulation of Dense Gas-Solid Fluidized Beds: A Multiscale Modeling Strategy. Annu. Rev. Fluid Mech. 2008, 40, 47–70. [Google Scholar] [CrossRef]
- Fullmer, W.D.; Hrenya, C.M. The Clustering Instability in Rapid Granular and Gas-Solid Flows. Annu. Rev. Fluid Mech. 2017, 49, 485–510. [Google Scholar] [CrossRef]
- Cocco, R.; Fullmer, W.; Liu, P.; Hrenya, C. CFD-DEM: Modeling the small to understand the large. Chem. Eng. Prog. 2017, 113, 38–45. [Google Scholar]
- van Wachem, B.; Sasic, S. Derivation, simulation and validation of a cohesive particle flow CFD model. AIChE J. 2008, 54, 9–19. [Google Scholar] [CrossRef]
- Motlagh, A.; Grace, J.; Salcudean, M.; Hrenya, C. New structure-based model for Eulerian simulation of hydrodynamics in gas–solid fluidized beds of Geldart group “A” particles. Chem. Eng. Sci. 2014, 120, 22–36. [Google Scholar] [CrossRef]
- Cameron, I.; Wang, F.; Immanuel, C.; Stepanek, F. Process systems modelling and applications in granulation: A review. Chem. Eng. Sci. 2005, 60, 3723–3750. [Google Scholar] [CrossRef]
- Kellogg, K.M.; Liu, P.; LaMarche, C.Q.; Hrenya, C.M. Continuum theory for rapid cohesive-particle flows: General balance equations and discrete-element-method-based closure of cohesion-specific quantities. J. Fluid Mech. 2017, 832, 345–382. [Google Scholar] [CrossRef]
- Goldschmidt, M.J.V. Hydrodynamic Modelling of Fluidised Bed Spray Granulation. Ph.D. Thesis, University of Twente, Enschede, The Netherlands, 2001. [Google Scholar]
- Fan, R.; Marchisio, D.L.; Fox, R.O. Application of the direct quadrature method of moments to polydisperse gas–solid fluidized beds. Powder Technol. 2004, 139, 7–20. [Google Scholar] [CrossRef]
- Costa, A.; Folch, A.; Macedonio, G. A model for wet aggregation of ash particles in volcanic plumes and clouds: 1. Theoretical formulation. J. Geophys. Res. Atmos. 2010, 115. [Google Scholar] [CrossRef]
- Rabinovich, Y.I.; Adler, J.J.; Ata, A.; Singh, R.K.; Moudgil, B.M. Adhesion between Nanoscale Rough Surfaces. J. Colloid Interface Sci. 2000, 232, 17–24. [Google Scholar] [CrossRef]
- Gantt, J.A.; Gatzke, E.P. A stochastic technique for multidimensional granulation modeling. AIChE J. 2006, 52, 3067–3077. [Google Scholar] [CrossRef]
- Fadda, S.; Cincotti, A.; Concas, A.; Pisu, M.; Cao, G. Modelling breakage and reagglomeration during fine dry grinding in ball milling devices. Powder Technol. 2009, 194, 207–216. [Google Scholar] [CrossRef]
- Le, P.; Avontuur, P.; Hounslow, M.; Salman, A. The kinetics of the granulation process: Right from the early stages. Powder Technol. 2009, 189, 149–157. [Google Scholar] [CrossRef]
- Braumann, A.; Kraft, M.; Mort, P.R. Parameter estimation in a multidimensional granulation model. Powder Technol. 2010, 197, 196–210. [Google Scholar] [CrossRef]
- Seville, J.; Willett, C.; Knight, P. Interparticle forces in fluidisation: A review. Powder Technol. 2000, 113, 261–268. [Google Scholar] [CrossRef]
- Donahue, C.M.; Davis, R.H.; Kantak, A.A.; Hrenya, C.M. Mechanisms for agglomeration and deagglomeration following oblique collisions of wet particles. Phys. Rev. E 2012, 86, 021303. [Google Scholar] [CrossRef] [PubMed]
- Donahue, C.M.; Hrenya, C.M.; Davis, R.H.; Nakagawa, K.J.; Zelinskaya, A.P.; Joseph, G.G. Stokes’ cradle: Normal three-body collisions between wetted particles. J. Fluid Mech. 2010, 650, 479–504. [Google Scholar] [CrossRef]
- Davis, R.H.; Rager, D.A.; Good, B.T. Elastohydrodynamic rebound of spheres from coated surfaces. J. Fluid Mech. 2002, 468, 107–119. [Google Scholar] [CrossRef]
- Ennis, G.B.J.; Pfeffer, R. A microlevel-based characterization of granular phenomena. Powder Technol. 1991, 65, 257–272. [Google Scholar] [CrossRef]
- Weber, M.W.; Hoffman, D.K.; Hrenya, C.M. Discrete-particle simulations of cohesive granular flow using a square-well potential. Granul. Matter 2004, 6, 239–354. [Google Scholar] [CrossRef]
- Liu, P.; Kellogg, K.M.; LaMarche, C.Q.; Hrenya, C.M. Dynamics of singlet-doublet collisions of cohesive particles. Chem. Eng. J. 2017, 324, 380–391. [Google Scholar] [CrossRef]
- Kafui, K.D.; Thornton, C. Numerical simulations of impact breakage of a spherical crystalline agglomerate. Powder Technol. 2000, 109, 113–132. [Google Scholar] [CrossRef]
- Ringl, C.; Bringa, E.M.; Bertoldi, D.S.; Urbassek, H.M. Collisions of porous clusters: A granular-mechanics study of compaction and fragmentation. Astrophys. J. 2012, 752, 151. [Google Scholar] [CrossRef]
- Liu, P.; LaMarche, C.Q.; Kellogg, K.M.; Leadley, S.; Hrenya, C.M. Cohesive grains: Bridging microlevel measurements to macrolevel flow behavior via surface roughness. AIChE J. 2016, 62, 3529–3537. [Google Scholar] [CrossRef]
- Liu, P.; LaMarche, C.Q.; Kellogg, K.M.; Hrenya, C.M. A square-force cohesion model and its extraction from bulk measurements. AIChE J. 2018, 64, 2329–2339. [Google Scholar] [CrossRef]
- Frungieri, G.; Boccardo, G.; Buffo, A.; Karimi-Varzaneh, H.A.; Vanni, M. CFD-DEM characterization and population balance modelling of a dispersive mixing process. Chem. Eng. Sci. 2022, 260, 117859. [Google Scholar] [CrossRef]
- Kellogg, K.; Liu, P.; Hrenya, C. Continuum predicton of entrainment rates and agglomeration of gas-fluidized, lightly cohesive particles. Chem. Eng. J. 2019, 199, 249–257. [Google Scholar] [CrossRef]
- Liu, P.; Hrenya, C.M. Cluster-Induced Deagglomeration in Dilute Gravity-Driven Gas-Solid Flows of Cohesive Grains. Phys. Rev. Lett. 2018, 121, 238001. [Google Scholar] [CrossRef]
- Lees, A.W.; Edwards, S.F. The computer study of transport processes under extreme conditions. J. Phys. C Solid State Phys. 1972, 5, 1921–1928. [Google Scholar] [CrossRef]
- Antypov, D.; Elliott, J.A. On an analytical solution for the damped Hertzian spring. Europhys. Lett. 2011, 94, 50004. [Google Scholar] [CrossRef]
- Orr, F.M.; Scriven, L.E.; Rivas, A.P. Pendular rings between solids: Meniscus properties and capillary force. J. Fluid Mech. 1975, 67, 723–742. [Google Scholar] [CrossRef]
- LaMarche, C.Q.; Miller, A.W.; Liu, P.; Hrenya, C.M. Linking micro-scale predictions of capillary forces to macro-scale fluidization experiments in humid environments. AIChE J. 2016, 62, 3585–3597. [Google Scholar] [CrossRef]
- Iddir, H.; Arastoopour, H. Modeling of multitype particle flow using the kinetic theory approach. AIChE J. 2005, 51, 1620–1632. [Google Scholar] [CrossRef]
- Benyahia, S.; Syamlal, M.; O’Brien, T.J. Extension of Hill–Koch–Ladd drag correlation over all ranges of Reynolds number and solids volume fraction. Powder Technol. 2006, 162, 166–174. [Google Scholar] [CrossRef]
- Hill, R.J.; Koch, D.L.; Ladd, A.J.C. Moderate-Reynolds-number flows in ordered and random arrays of spheres. J. Fluid Mech. 2001, 448, 243–278. [Google Scholar] [CrossRef]
- Gollwitzer, F.; Rehberg, I.; Kruelle, C.A.; Huang, K. Coefficient of restitution for wet particles. Phys. Rev. E 2012, 86, 011303. [Google Scholar] [CrossRef] [PubMed]
- Murphy, E.; Subramaniam, S. Freely cooling granular gases with short-ranged attractive potentials. Phys. Fluids 2015, 27, 043301. [Google Scholar] [CrossRef]
- Syamlal, M.; Rogers, W.; OBrien, T.J. MFIX Documentation Theory Guide; National Energy Techonology Laboratory, Department of Energy: Morgantown, WV, USA, 1993. [Google Scholar]
- Cahyadi, A.; Neumayer, A.H.; Hrenya, C.M.; Cocco, R.A.; Chew, J.W. Comparative study of Transport Disengaging Height (TDH) correlations in gas–solid fluidization. Powder Technol. 2015, 275, 220–238. [Google Scholar] [CrossRef]
Figure 1.
(a) Schematic of oscillating shear flow. (b) Schematic of unbounded riser flow.

Figure 2.
DEM simulations of oscillating shear flow: (a) the shear rate and (b) granular temperature both oscillate, reaching approximately a pseudo-steady-state between steps.
Figure 2.
DEM simulations of oscillating shear flow: (a) the shear rate and (b) granular temperature both oscillate, reaching approximately a pseudo-steady-state between steps.

Figure 3.
DEM simulations of oscillating shear flow: (a) critical velocities of aggregation, (b) critical velocities of breakage, and (c) collision cylinder diameters. The color and shape of the data point give the size of one of the agglomerates colliding in the pair, and the x-axis gives the size of other agglomerates.

Figure 4.
Unbounded riser flow results from the continuum theory and the DEM for (a) agglomerate size distribution and (b) entrainment rates.
Figure 4.
Unbounded riser flow results from the continuum theory and the DEM for (a) agglomerate size distribution and (b) entrainment rates.


Table 1.
System and particle properties used in the oscillating shear flow simulations.
| Property | Symbol | Value | Units |
|---|---|---|---|
| Young’s modulus | E | 10 | MPa |
| Poisson ratio | 0.3 | - | |
| Primary particle diameter | d1 | 64 | μm |
| Particle density | ρs | 2500 | kg/m3 |
| Intrinsic coefficient of restitution | eint | 0.97 | - |
| Small-scale wavelength | λS | 369 | nm |
| Small-scale roughness | rmsS | 2.411 | nm |
| Minimum separation distance | Dmin | 0.15 | nm |
| Relative humidity | RH | 0.1 | - |
| System side length | L/d | 13.51 | - |
| Solid volume fraction | εs | 0.1 | - |
| Number of particles | - | 471 | - |
| Shear rate | 75, 200 | 1/s | |
| Ideal gas constant | Rg | 8.314 | J/(mol∙K) |
| Thermodynamic temperature | T | 300 | K |
| Molar density of water | 5.56 × 10⁴ | mol/m3 | |
| Surface tension of water | σ | 72 × 10−3 | N/m |
| Asperity geometric constant | k1 | 1.817 | - |
Table 2.
Auxiliary equations used for the DEM.
Table 3.
System properties used in the unbounded riser flow simulations.
| Property | Symbol | Value | Units |
|---|---|---|---|
| Gas (air) density | ρg | 0.97 | kg/m3 |
| Gas (air) viscosity | μg | 1.8335 × 10⁻⁵ | Pa∙s |
| Target gas velocity | ug,y | 0.515 | m/s |
| System width and depth | W = L | 0.3234375 | cm |
| System height | H | 1.4375 | cm |
| Grid size | ∆x/d1 | 2 | - |
Disclaimer/Publisher’s Note: The statements, opinions and data contained in all publications are solely those of the individual author(s) and contributor(s) and not of MDPI and/or the editor(s). MDPI and/or the editor(s) disclaim responsibility for any injury to people or property resulting from any ideas, methods, instructions or products referred to in the content. |
© 2023 by the authors. Licensee MDPI, Basel, Switzerland. This article is an open access article distributed under the terms and conditions of the Creative Commons Attribution (CC BY) license (https://creativecommons.org/licenses/by/4.0/).
Share and Cite
MDPI and ACS Style
Kellogg, K.M.; Liu, P.; Hrenya, C.M. Discrete-Element-Method-Based Determination of Particle-Level Inputs for the Continuum Theory of Flows with Moderately Cohesive Particles. Processes 2023, 11, 2553. https://doi.org/10.3390/pr11092553
AMA Style
Kellogg KM, Liu P, Hrenya CM. Discrete-Element-Method-Based Determination of Particle-Level Inputs for the Continuum Theory of Flows with Moderately Cohesive Particles. Processes. 2023; 11(9):2553. https://doi.org/10.3390/pr11092553
Chicago/Turabian StyleKellogg, Kevin M., Peiyuan Liu, and Christine M. Hrenya. 2023. "Discrete-Element-Method-Based Determination of Particle-Level Inputs for the Continuum Theory of Flows with Moderately Cohesive Particles" Processes 11, no. 9: 2553. https://doi.org/10.3390/pr11092553
Note that from the first issue of 2016, this journal uses article numbers instead of page numbers. See further details here.