Article

Effect of High-Voltage Electric Field on Thawing Kinetics and Quality Characteristics of Frozen Beef

College of Science, Inner Mongolia University of Technology, Hohhot 010051, China
*
Author to whom correspondence should be addressed.
Processes 2023, 11(9), 2567; https://doi.org/10.3390/pr11092567
Submission received: 3 August 2023 / Revised: 23 August 2023 / Accepted: 25 August 2023 / Published: 27 August 2023
(This article belongs to the Special Issue Non-thermal Technologies in Food Science, Volume II)

Abstract

:
This study investigated the impact of high-voltage electric field (HVEF) thawing technology on the thawing rate, water retention characteristics, microstructure, and nutritional composition of thawed beef. Compared with the control group, in which thawing occurred under natural conditions, the experimental group, in which beef was thawed under HVEF (12 kV, 16 kV, 20 kV, 24 kV, 28 kV), showed a significantly shorter thawing time, and the higher the voltage was, the faster the thawing rate. The total loss rate of thawed beef reached its minimum value of (54.2 ± 0.62) % at 28 kV, and the water retention of the experimental group was significantly better than that of the control group (p < 0.05). Therefore, it can be concluded that HVEF thawing enhances the water retention ability of beef. In a color comparison, it was evident that the color of the beef thawed by HVEF was significantly better than that of the control group. The results of scanning electron microscopy (SEM) indicated that thawing beef by HVEF can reduce the damage to the myofibril structure. Low-field nuclear magnetic resonance (LF-NMR) showed that beef thawed by HVEF had a significantly increased bound water content. According to the determination of malondialdehyde content, beef thawed by HVEF had a reduced degree of lipid oxidation; the content at 16 kV was 2.4 mg/kg, and the degree of lipid oxidation was the lowest. Fourier transform infrared (FTIR) spectroscopy analysis revealed that the absorption peak positions of the beef samples did not show significant changes under different conditions. However, the absorption peak intensity in the experimental group was generally higher than that in the control group. Examination of the protein secondary structure via infrared spectroscopy revealed that, compared with the control group, HVEF thawing transformed the proteins from an ordered structure to a disordered structure. The increase in disordered structure reduced the fiber gap of the sample and improved the water retention of the beef. The above experimental results indicate that HVEF thawing can improve the water-holding capacity of the sample and reduce the thawing damage to the quality of the sample.

1. Introduction

Meat is an essential food for a healthy human diet; it has high nutritional value and is an indispensable part of the dietary lives of many humans. In the future, the demand for meat will increase, with projections that global meat consumption will increase by 1.2% by 2028 compared with the baseline period (2016–2018). By then, the demand for high-nutrition, high-protein meats such as beef is expected to grow more than those for other types of meat [1]. However, meat spoilage often occurs during storage, processing, and transportation, which causes large economic losses and harms human health. In order to ensure the quality of food and economic value, meat is often stored and transported by freezing [2].
Freezing is a commonly used method to extend the shelf lives of meat and meat products by inhibiting microbial growth and other biochemical reactions [3]. Freezing is one of the most widely used methods of food preservation and plays a crucial role in the meat industry [4]. Meat and meat products are typically preserved by freezing, which effectively reduces microbial spoilage and preserves the nutritional contents of the food. Both freezing and thawing are significant processes to ensure the final quality of food products, and the thawing process may lead to deterioration of product quality. During the thawing process, product quality may deteriorate due to changes in myofibril structure, protein, and lipid oxidation, greatly affecting the texture, flavor, color, nutritional value, and other aspects of the product [5] and resulting in losses.
Thawing methods currently employed include traditional thawing methods in air, water, and refrigerators [6,7,8], as well as many emerging thawing methods, such as ohmic thawing [9], ultrasonic thawing [10], radio frequency thawing [11], microwave thawing [12], and far-infrared thawing. The most widely used traditional thawing methods have significant drawbacks, as they not only require large amounts of time but also can cause serious damage to product quality. The poor penetration of ultrasonic thawing can lead to local overheating on the surface of the product. Microwave thawing can easily cause uneven thawing and inevitable thermal damage to the product [13]. The disadvantages of far-infrared thawing are similar to the drawbacks of microwave thawing and include uneven thawing, excessive surface temperature, and product dehydration [14]. Therefore, it is necessary to develop a new type of thawing method to reduce the impact of the thawing process on product quality.
HVEF thawing is an emerging nonthermal and energy-saving thawing technology that is a feasible alternative to pyrolysis thawing. In the process of high-voltage electric field thawing, electrons and positive ions move towards the two opposite electrodes under the action of electric field force, driving the movement of air molecules, thus forming ionic wind [15]. A large number of particles produce a complex collision process with the surface of the material, which occurs in the transfer and transformation of energy, increasing the kinetic energy of the water molecules and the heat transfer in and around the material, thus accelerating the thawing of the material. The water-holding capacity of muscle tissue in meat is related to the degree of thermal denaturation of the myofibrillar proteins during thermal processing [16]. High-voltage electric field thawing has the characteristics of keeping the sample from heating up and reducing the temperature difference between the center and surface of the sample to minimize the damage to the sample [17]. Orlowska et al. found that applying an HVEF increases the nucleation temperature of cooled distilled water with increasing electric field strength, and appropriate electric field strength can promote nucleation [18]. Rahbari et al. found that HVEF thawing significantly shortened the freeze–thaw time, improved the solubility and water-holding capacity of myofibrillar proteins, and reduced protein denaturation [19]. Amiri et al. found that different numbers of electrode needles have varying effects on the degree of lipid oxidation. As the number of needle electrodes increases, the degree of lipid oxidation also increases, and the degree of damage to the sample increases [20]. Kantono et al. discovered that HVEF thawing can improve the sensory characteristics of beef, such as its color and tenderness [21]. Ding et al. discovered that a high-voltage electric field can shorten the thawing time of tofu and that certain electric field conditions at different voltages and pole spacings can increase the water-holding capacity [22].
In this study, an HVEF was applied to the beef thawing process. The optimization quality degree of beef thawed by HVEF was then evaluated and compared according to the thawing rate, total loss, water-holding capacity, color, and malondialdehyde content of the beef thawed by HVEF and natural conditions. Utilizing scanning electron microscopy (SEM), Fourier transform infrared (FTIR) spectroscopy, evaluations of protein secondary structure, and low-field nuclear magnetic resonance (LF-NMR), the myofibril structure, protein conversion, and water migration in thawed beef were studied in depth to understand the potential mechanism of HVEF thawing, combining physics and food science, microscopic and macroscopic analysis, and revealing the mechanism of high-voltage electric field thawing from multiple levels and angles. The research content, methods, and ideas have certain innovation and potential application value, providing an experimental and theoretical basis and practical guidance for the wider application of high-voltage electric field thawing technology.

2. Materials and Methods

2.1. Sample Preparation and Processing

In this study, all the beef used (beef tenderloin, kept fresh at 0 °C–4 °C) was purchased from Hualian Supermarket, Genghis Khan Square Branch (Hohhot, Inner Mongolia Autonomous Region, China). After removing all visible connective tissue and external fat from the surface of the meat, the beef was cut (perpendicular to the fiber direction) into cubes with a volume of 3 cm × 3 cm × 3.5 cm and a mass of (40 ± 0.5) g. After packaging the samples with transparent polyethylene film, they were immediately placed in a freezer at −20 °C for 24 h for freezing before being used in the thawing experiments.

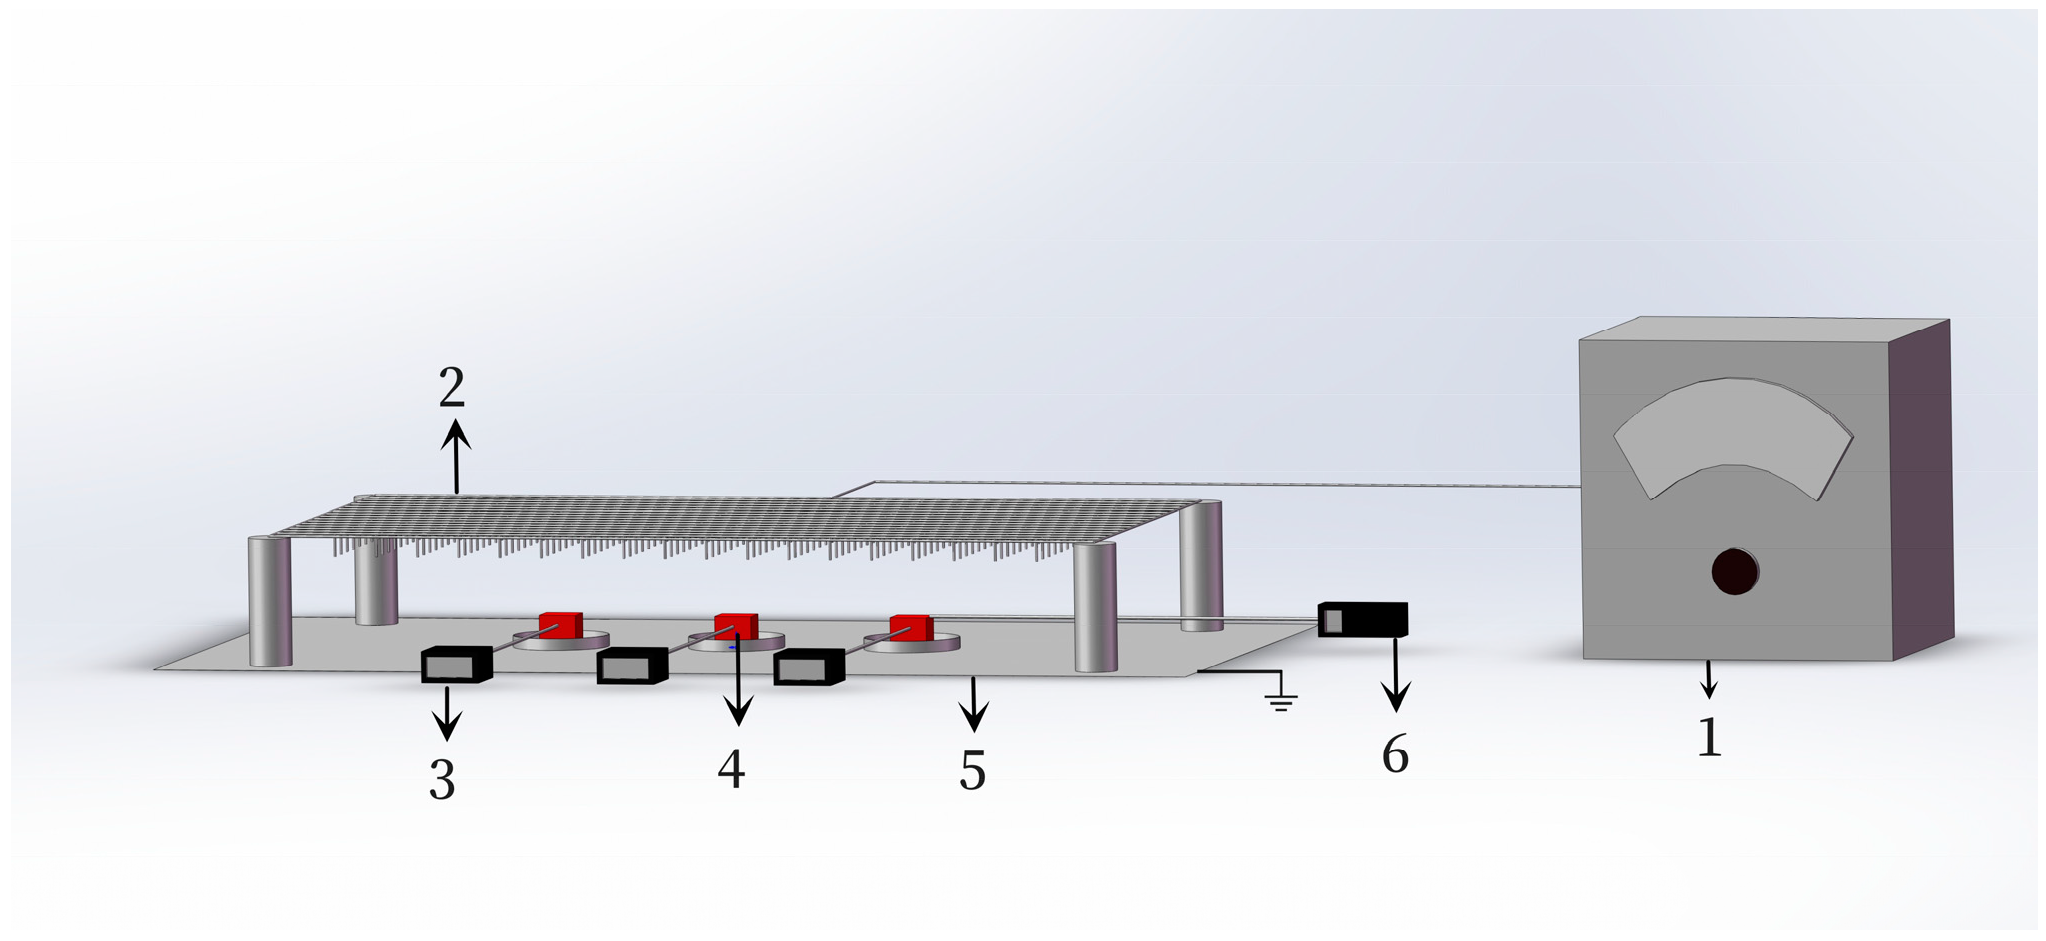
2.2. Experimental Equipment and Instruments

The HVEF thawing device (as shown in Figure 1) consisted of a high-voltage power control system (YD (JZ) 1.5/50, Wuhan, China), a voltage controller (KZX-1.5 KVA, Wuhan, China), and a multiple needle-to-plate electrode system [23]. The BS124S electronic balance was from Sartorius Scientific Instruments Co., Ltd., Beijing, China; the HH-4 constant temperature water bath was from Ronghua Instrument Manufacturing Co., Ltd., Changzhou, China; the TDZ4-WS centrifuge was from Xiangyi Centrifuge Instrument Co., Ltd., Shenzhen, China; and the 3nh-NR60CP automatic colorimeter was from Wusu Industrial Development Co., Ltd., Shenzhen, China.
The high-voltage power supply control system was capable of outputting AC voltages ranging from 0 to 50 kV using a voltage controller, with the needle electrode connected to the high-voltage power control system. The frequency was set at 50 Hz. The needle electrode was made of stainless steel, with a length of 20 mm and a diameter of 1 mm. The distance between the two needle electrodes was 40 mm. The ground electrode was a stainless-steel plate measuring 1000 mm × 550 mm. The distance between the needle tip and the ground electrode was 100 mm.

2.3. Experimental Method

The thawing experiment was conducted under conditions of an ambient temperature of (18 ± 1) °C, a relative humidity of (26 ± 1) % RH, and an ambient wind speed of 0 m/s. The beef was thawed in an HVEF environment with thawing voltages of 0 (control group), 12, 16, 20, 24, and 28 kV. Before the start of the thawing experiment, the mass of each frozen beef block was measured using an electronic balance, and the linear probe of a temperature sensor was inserted into the geometric center of the beef to measure the central temperature during the thawing process. The recording of the central temperature of the beef was started when the geometric center temperature reached −10 °C. Throughout the thawing process, the central temperature was recorded every 5 min. The thawing process was considered complete when the geometric center temperature of the beef reached 4 °C, and the thawing time was recorded. The total mass of the thawed beef and liquid was recorded using an electronic balance. All thawing experiments were conducted independently three times, and the results are expressed as the average value ± standard deviation (SD).

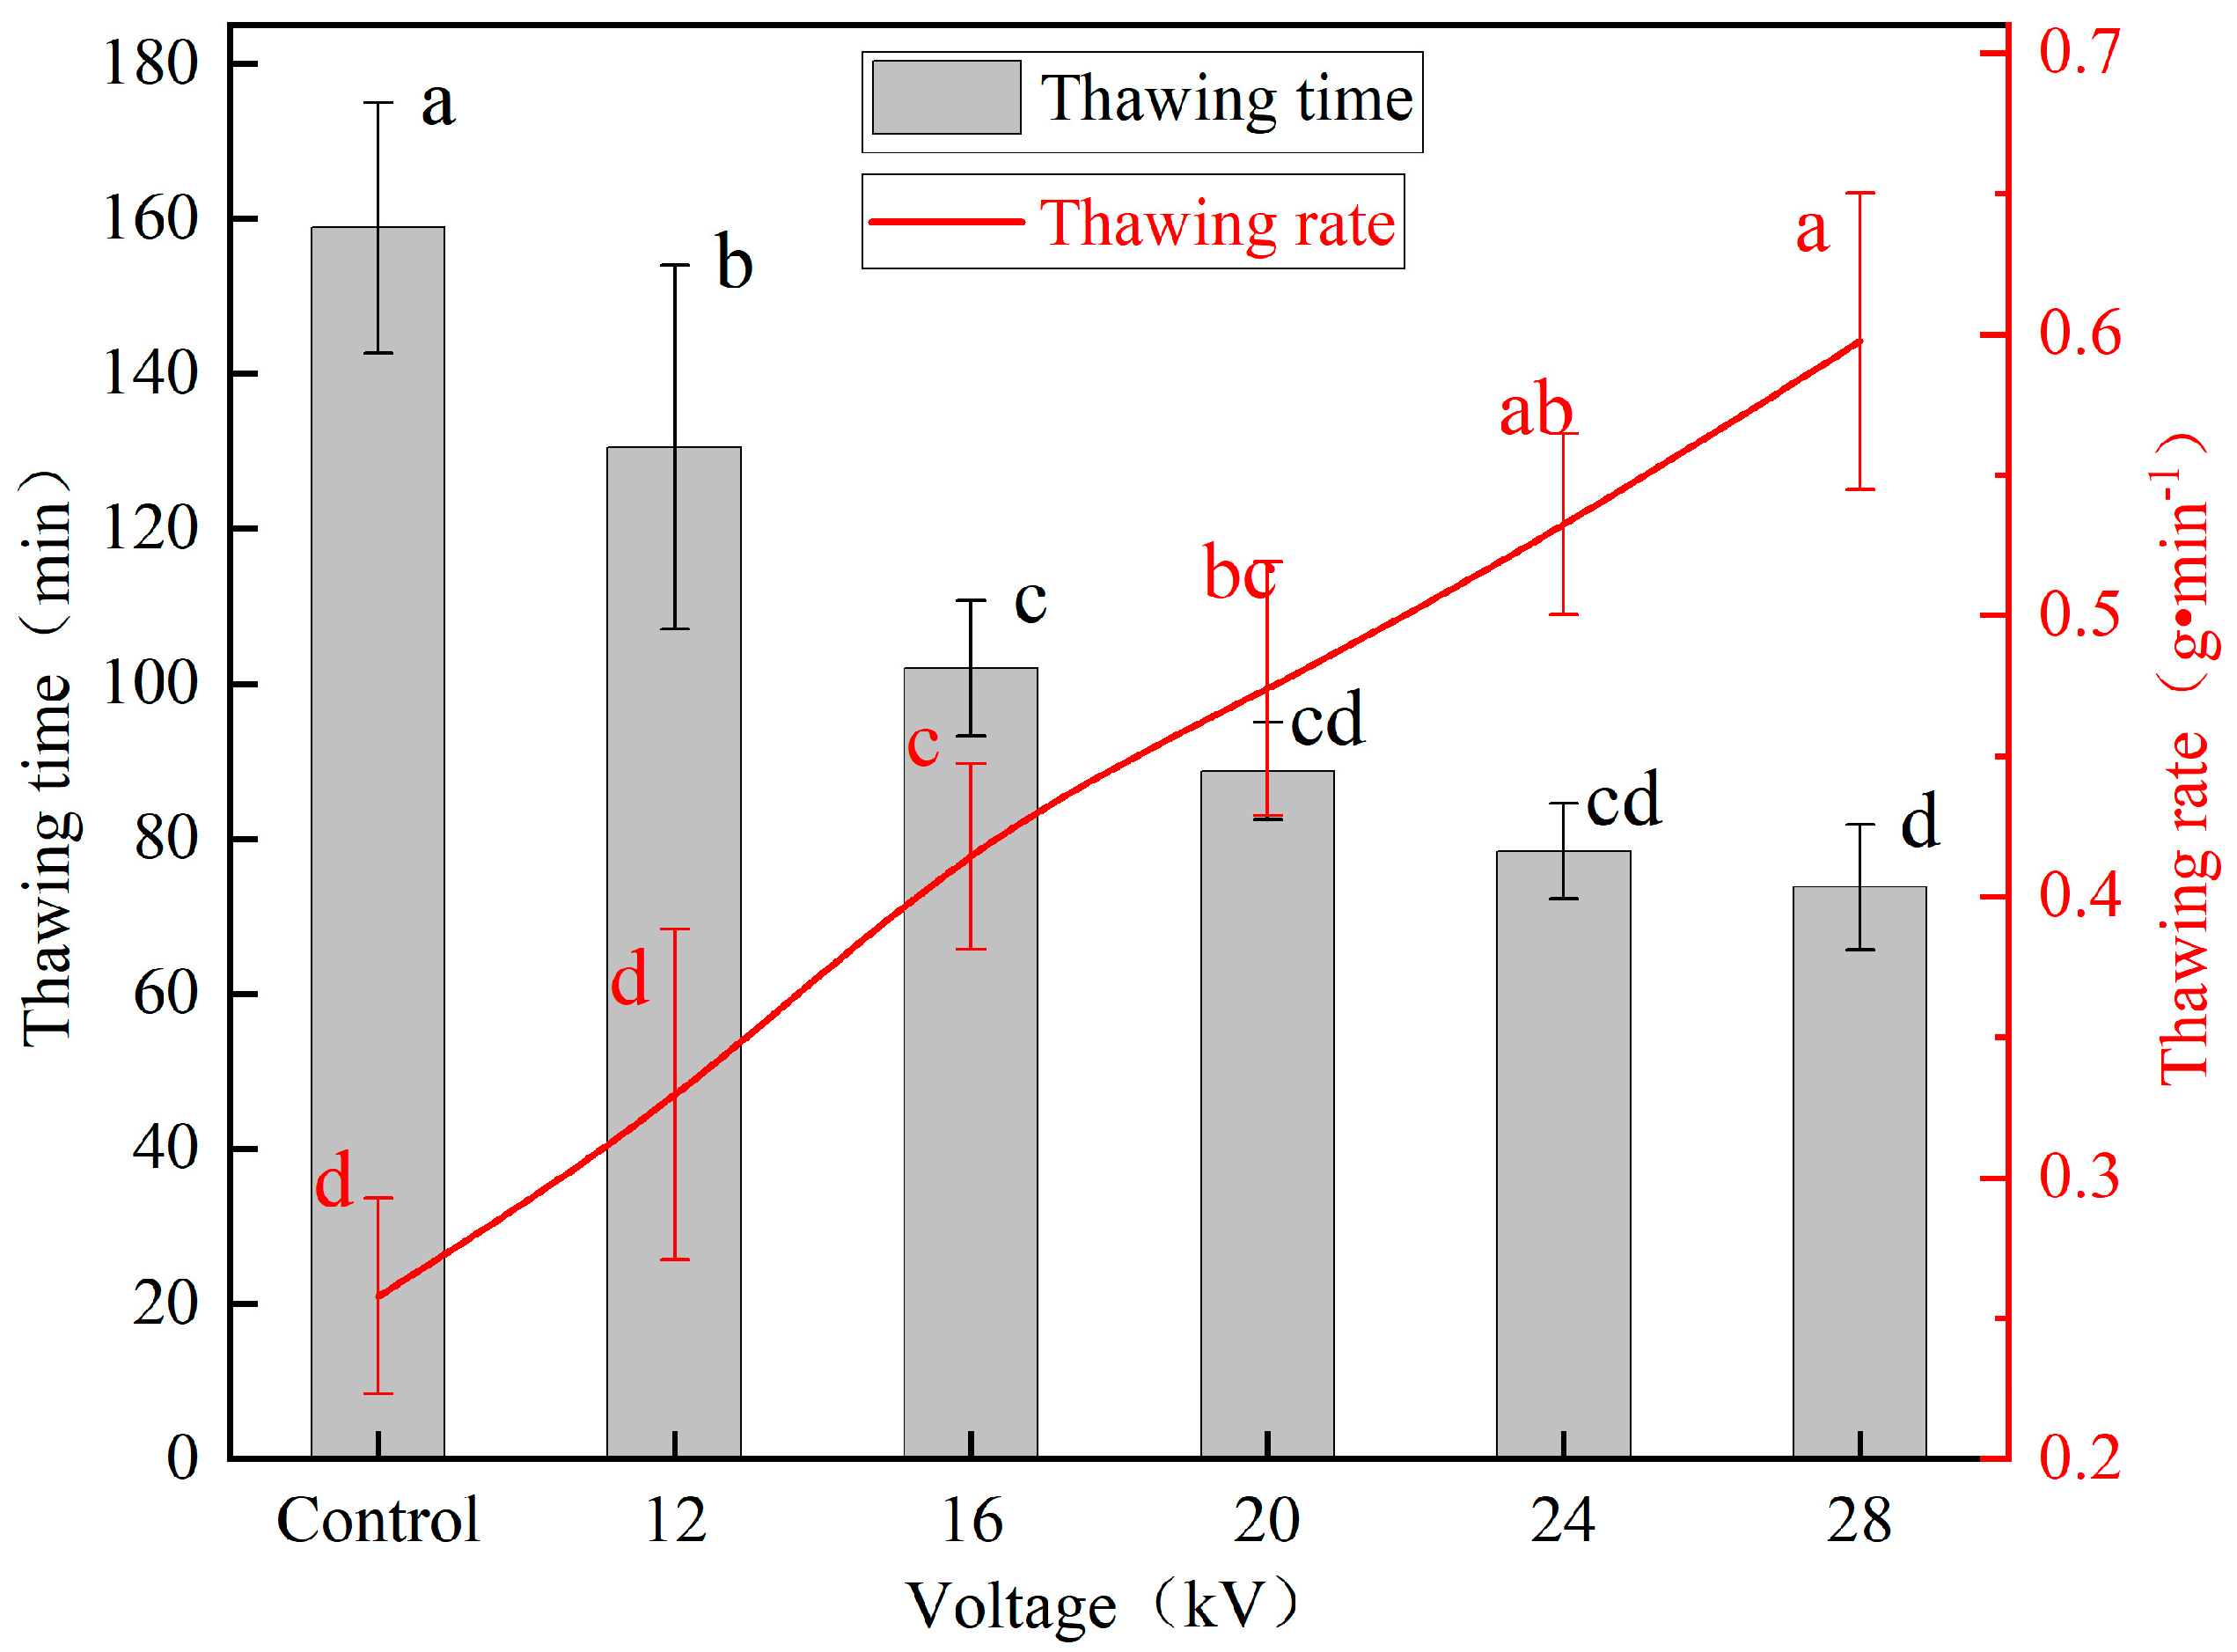
2.4. Thawing Rate and Thawing Time

The time it took to increase the geometric center temperature of beef from −10 °C to 4 °C was defined as the thawing time, and the thawing rate was calculated. The formula for calculating the thawing rate of beef during the thawing process [24] is:
t h a w i n g   r a t e = m t
where m is the mass of frozen beef (g) and t is the thawing time (min).

2.5. Evaporation Loss

After thawing, the total mass m1 of the beef and liquid was recorded, and the evaporation loss rate of the beef was calculated using the formula [24]:
E = m m 1 m × 100 %
where E is the evaporation loss of the beef (%), m is the mass of the frozen beef (g), and m1 is the total mass of the thawed beef and liquid (g).

2.6. Drip Loss

Filter paper was used to absorb liquid from the surface of the beef, after which the thawed beef was weighed. The formula for the loss of beef liquid [25] is:
D = m 1 m 2 m × 100 %
where D is the drip loss of the beef (%), m is the mass of the frozen beef (g), m1 is the total mass of the thawed beef and liquid (g), and m2 is the mass of the thawed beef (g).

2.7. Cooking Loss

The thawed beef was placed in a polyethylene bag and heated in a constant-temperature water bath (HH-4, China) at 96.8 °C for 40 min. The beef was then cooled naturally at room temperature for 30 min, and filter paper was used to absorb the surface moisture from the beef. An electronic balance was then used to weigh the steamed beef. The calculation formula for the cooking loss rate [26] is:
C = m 3 m 4 m 3 × 100 %
where C is the cooking loss of the beef (%), m3 is the mass of the beef before steaming (g), and m4 is the mass of the beef after steaming (g).

2.8. Total Loss

Total Loss = Evaporation Loss + Drip Loss + Cooking Loss.

2.9. WHC

A portion of the thawed beef close to the upper surface (i.e., the surface with the largest contact area with the ion wind) was measured to determine its mass using an electronic balance, placed in a 10 mL centrifuge tube, and centrifuged at a speed of 4000 r/min for 30 min using a low-speed desktop centrifuge (TDZ4-WS, China). After centrifugation, the surface liquid was absorbed with filter paper. The mass was then weighed after centrifugation using an electronic balance. The calculation formula for the water-holding capacity [27] is:
E M = m a m b m a × 100 %
where EM is the water-holding capacity of the beef (%), ma is the mass of the beef before centrifugation (g), and mb is the mass of the beef after centrifugation (g).

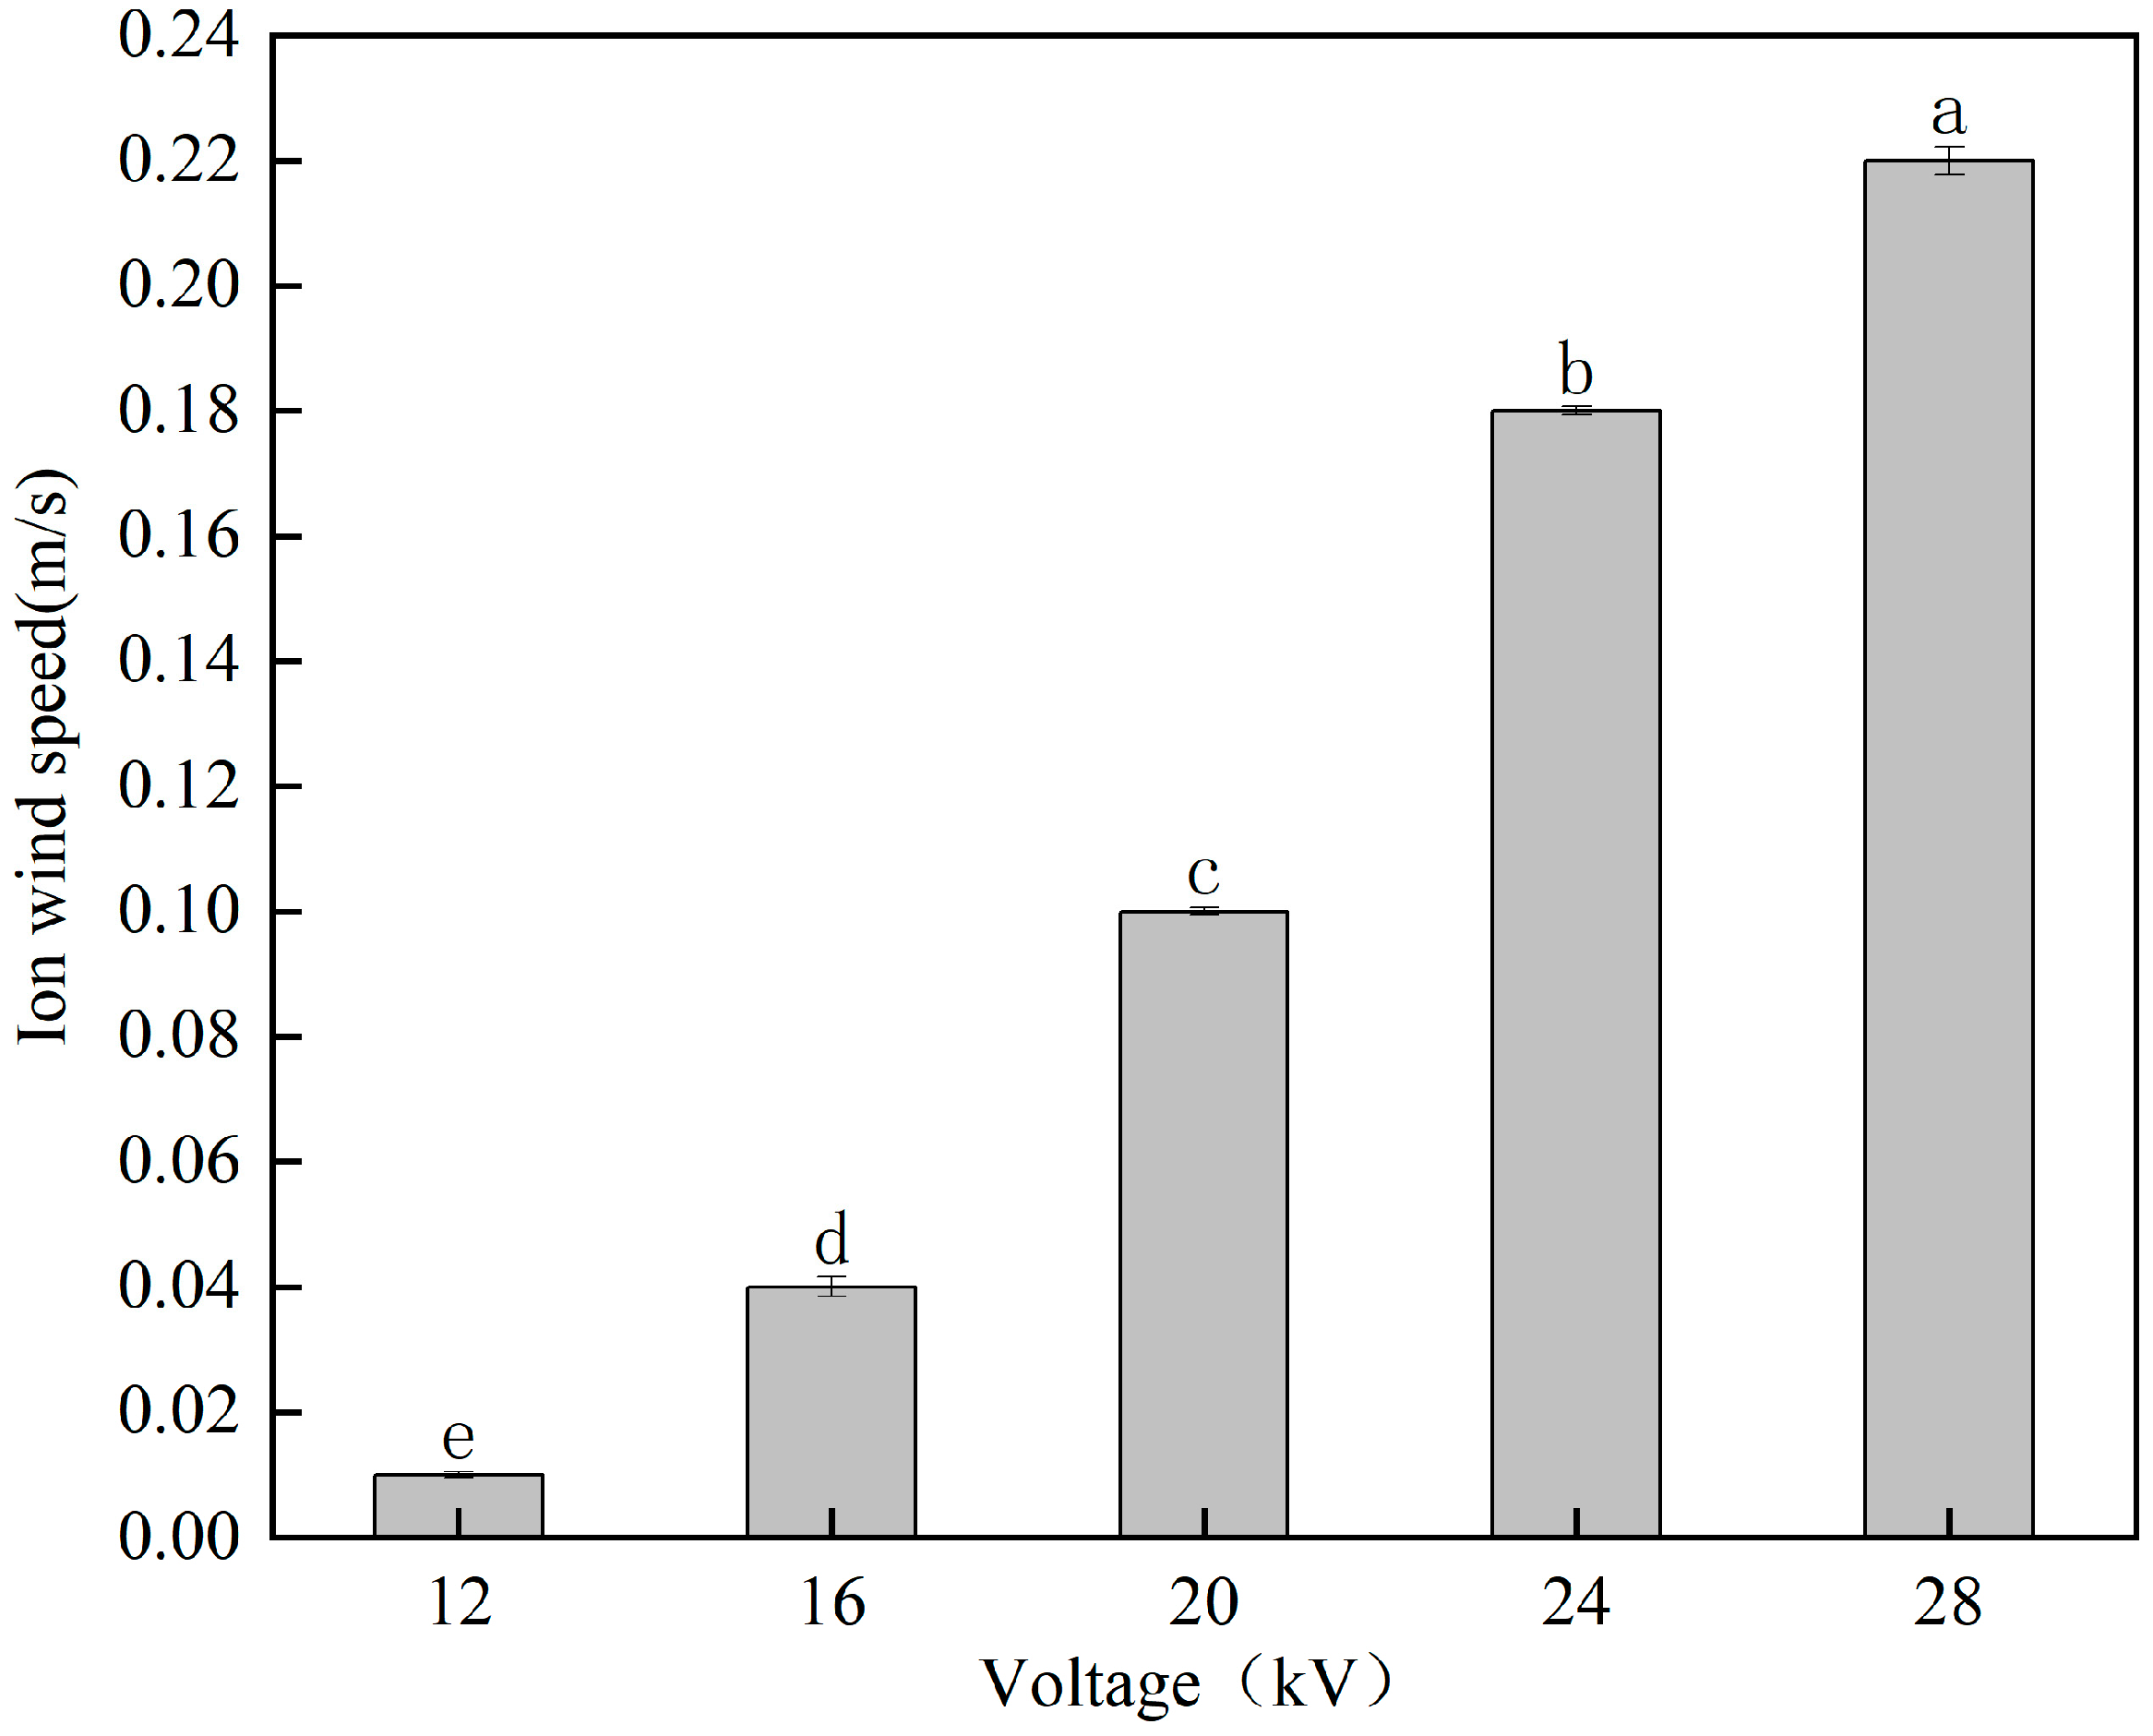
2.10. Ion Wind Speed

A thermal anemometer probe (Testo 405i, TESTO, Titisee-Neustadt, Baden Wurttemberg State, Germany) was used to measure the ion wind speed under different thawing voltages. The measurement position selected for the thermal wind speed probe was approximately 7 cm away from the upper electrode needle plate (roughly parallel to the surface position of the beef).

2.11. Color

Before the experiment, a fully automatic color difference instrument (3nh-NR60CP, Sanenshi Intelligent Technology Co., Ltd., Shenzhen, China) was used to measure the color parameters of the surfaces of the fresh beef samples, recording the L (brightness), a (redness), and b (yellowness) values. The color test surface was marked as the upper surface for the thawing experiment (i.e., the surface with the largest contact area with the ion wind). After the thawing process was completed, the fully automatic color difference instrument was used again to measure the color parameters of the upper surface of the beef. Before each test, a blackboard correction was performed on the fully automatic color difference instrument, and the measurements were repeated five times on each piece of beef (at the four corners and on the center of the upper surface), with the average value taken. The beef color saturation C and the hue angle (0° and 360° are red, 270° is blue, 180° is green, and 90° is yellow) were recorded, and the total color difference was calculated as ΔE. The calculation formulas [28] are:
L = L 1 L 0
a = a 1 a 0
b = b 1 b 0
C = a 1 2 + b 1 2 a 0 2 + b 0 2
α ° = t a n 1 b 1 a 1 t a n 1 ( b 0 a 0 )
E = ( L 1 L 0 ) 2 + ( a 1 a 0 ) 2 + ( b 1 b 0 ) 2
where L0a0, and b0 are the brightness, redness, and yellowness values of fresh beef, respectively, and L1, a1, and b1 are the brightness, redness, and yellowness values of thawed beef, respectively.

2.12. Malondialdehyde Content

The degrees of fat oxidation of beef under different thawing voltages were determined by calculating the malondialdehyde content in thawed beef, referring to the first method for using high-performance liquid chromatography to determine the content of malondialdehyde in food [29]. The determination principle involved extracting the sample with an acid solution and then reacting the extract with thiobarbituric acid (TBA) to generate colored compounds that were then measured using high-performance liquid chromatography with a secondary tube array detector for determination and an external standard method for quantification.

2.13. Scanning Electron Microscopy (SEM)

The scanning electron microscopy method referred to the method of Paka [30]. A cube of approximately 1 cm3 from the upper surface of the thawed beef was used as the test sample and was placed in 2.5% glutaraldehyde solution precooled at 4 °C and fixed at 4 °C for 12 h. The fixative was then removed, and the sample was washed three times with 0.1 mol/L phosphate buffer solution for 10 min each time. Gradient dehydration was performed using ethanol solutions with different volume fractions (30%, 50%, 70%, 80%, 90%, 95%, and 100%), with each concentration of ethanol solution applied twice for dehydration for 15 min each time. The processed samples were then subjected to freeze-fracture testing in liquid nitrogen and then dried in a supercritical CO2 dryer for 30 min. The cross-section of the upper surface of the sample was then pasted in the upwards orientation on a scanning electron microscope sample table and was then sputtered with gold with an ion sputter coater (MC1000, HITACHI, Tokyo, Japan). The samples were then observed and photographed under a field emission environment scanning electron microscope (SU8020, HITACHI, Tokyo, Japan) with an acceleration voltage of 5 kV and a magnification of 500×.

2.14. FTIR Spectroscopy

Approximately 1 g of the thawed beef upper surface was placed into an oven at 40 °C to dry at low temperature for 24 h, after which the sample was ground and crushed. Potassium bromide powder was added at a ratio of 1:100, and the sample was placed into an agate mortar and ground to less than 2 microns. The sample was ground in one direction. Then, the ground sample was poured into a mold and pressed into pieces with a tablet press (HY-12, Norray Xinda Technology Co., Ltd., Tianjing, China). The sample was then placed in a Fourier transform infrared spectrometer (Nicolet IS10, Thermo Fisher Scientific, Waltham, MA, USA) and preheated for 30 min before scanning, with a scanning range of 400–4000 cm−1. The obtained curve was processed to remove the interference peaks from water and carbon dioxide, yielding the infrared spectrum of the thawed beef [23].

2.15. Protein Secondary Structure

Peakfit 4.12 software was used to extract data ranging from 1600 cm−1 to 1700 cm−1 for Gaussian fitting. The changes in the protein secondary structure were further analyzed.

2.16. Low-Field Nuclear Magnetic Resonance (LF-NMR)

The water content and distribution of beef samples were calculated using low-field nuclear magnetic resonance (LF-NMR) relaxation measurements using an LF-NMR imaging analyzer (JNM-ECZ400/L1, JEOL, Tokyo, Japan). The experimental parameters were as follows: magnetic field strength of (0.5 ± 0.3) T, operating temperature of 25 °C, and spectrometer frequency of 21 MHz. The thawed beef was cut into cylindrical shapes with dimensions of 1 cm × 1 cm × 2 cm and allowed to equilibrate at room temperature (25 ± 1 °C) for 1 h to ensure that the sample temperature was close to the operating temperature. The samples were then placed in a 15 mm nuclear magnetic resonance tube. The transverse relaxation time (T2) of the samples was determined using the CPMG pulse sequence.

2.17. Statistical Analysis

Each experiment was repeated three times, and the results are expressed as the mean ± standard deviation. The data were evaluated using one-way analysis of variance (ANOVA) with a significance level set at p < 0.05.

3. Results and Discussion

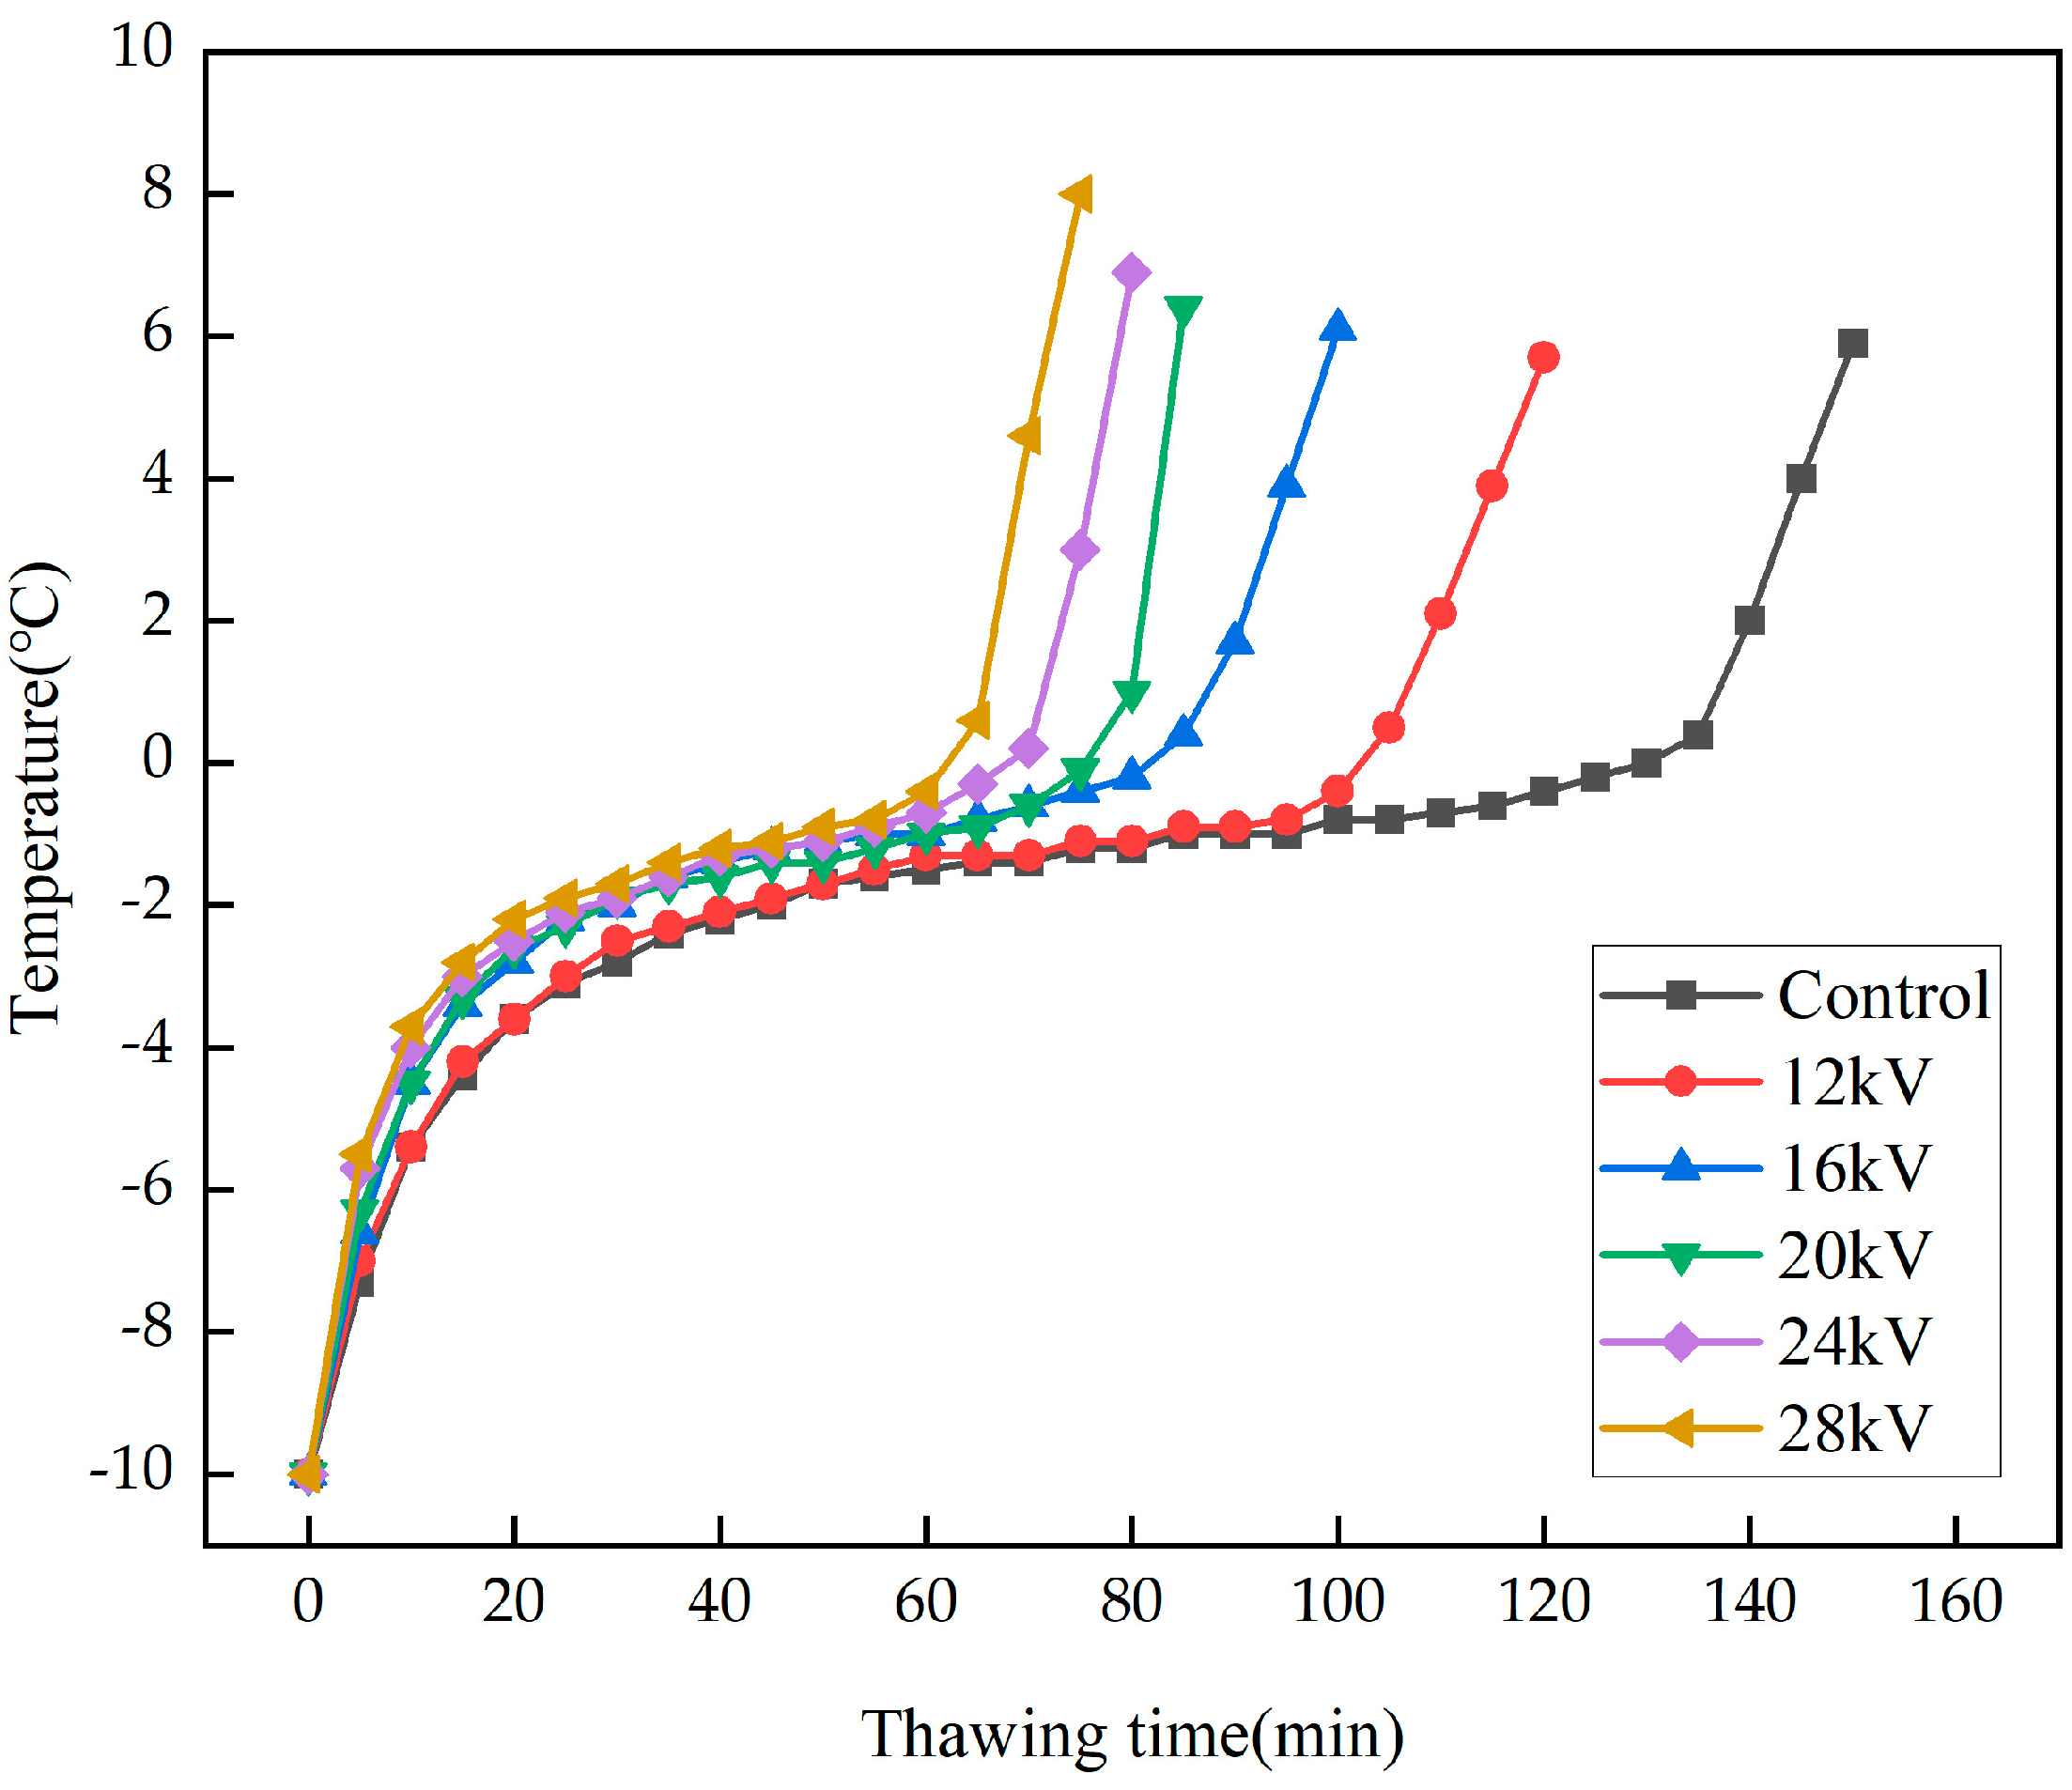
3.1. Analysis of the Thawing Process

The geometric center temperatures of beef samples thawed under different experimental conditions are shown in Figure 2. The temperature change curve trend under different experimental conditions is mainly divided into three stages: the first stage extends from −10 °C to −5 °C, where the temperature curve shows a sharp increase; the second stage is from −5 °C to 0 °C, where the temperature curve changes more gradually; and the third stage is above 0 °C, where the temperature curve once again shows a sharp upward trend. The first and third-stage temperatures were strongly influenced by the temperature gradient [31], and at an ambient temperature of (18 ± 1) °C, the large temperature difference caused the temperature to rise rapidly. The temperature change trend and thawing times in the first and third stages tended to be similar, with no significant differences observed among the different experimental conditions. The thawing time of the control group thawed under natural conditions and the experimental group thawed under different voltages was concentrated around 10 min in the first stage and around 15 min in the third stage.
The main changes occurred in the second stage, in the control group thawed under natural conditions and at thawing voltages of 12, 16, 20, 24, and 28 kV, with thawing times of 115, 90, 75, 70, 60, and 55 min, respectively. In the second stage, where the geometric center temperature of the beef in the experimental group subjected to HVEF reached 0 °C in a significantly reduced time, and as the voltage increased, the time for the center temperature of the beef to reach 0 °C became shorter. In the study by He et al. on HVEF thawing in pork tenderloin, it was found that the application of an electric field had a significant impact within the range of −5 °C to 0 °C [32], which is consistent with the results of this experiment. The temperature range of −5 °C to −1 °C is characterized by the largest formation of ice crystals in the food freezing industry, and this stage of thawing has a longer duration, greatly affecting the entire thawing process and meat quality [33]. A phase change occurs at the second stage, which requires more heat [34], and latent heat makes a contribution at this stage. However, it can be concluded from Figure 2 that applying different voltages at the same ambient temperature has a greater effect on the thawing time, which shows that the high-voltage electric field makes a greater contribution to the thawing efficiency. From a holistic perspective, the experimental group that was subjected to an HVEF had a significantly shorter thawing time compared with the control group thawed under natural conditions. Additionally, as the voltage increased and the electric field intensity became stronger, the thawing time decreased. Bai et al. reached the same conclusion in their study on the thawing effect of high-voltage electric fields on shrimp [35]. The main reason for the impact on the thawing rate is the generation of ion wind under the influence of an HVEF. High-voltage electric discharges can ionize neutral fluids and create a plasma region around the electrodes [36]. In cases where the electrode voltage is high, localized breakdown occurs in the surrounding air medium, leading to phenomena such as corona discharge. This causes the charged particles scattered in the air to move in a directed manner and gain energy, resulting in the formation of “ion wind.” As shown in Figure 3, the velocity of the ion wind increases with increasing voltage. Jia et al. concluded in their research that changes in ion wind speed are related to changes in voltage [37]. The higher the ion wind speed is, the shorter the thawing time. When the ion wind comes into contact with the food, it accelerates the heat transfer of frozen food [38]. Due to the vortices and turbulence generated by the ion wind, the heat transfer coefficient on the surface of the object is increased, enhancing the thawing rate [39]. This conclusion can be demonstrated by shortening the time of the second stage as the thawing voltage increases.
As shown in Figure 4, the experimental group with applied high-voltage electric fields had a significantly shorter thawing time compared with the control group thawed under natural conditions. The thawing rate of the experimental group was significantly higher than that of the control group, and as the voltage increased, the thawing time showed a decreasing trend while the thawing rate showed an increasing trend.
The time for thawing was reduced by a minimum of 1.22 times and a maximum of 2.15 times. Likewise, the thawing rate increased by a minimum of 1.28 times and a maximum of 2.32 times. Hsieh et al. found in their study on the thawing of chicken thigh meat under HVEF that the thawing time under the action of HVEF was only 2/3 of that of ordinary refrigerators [40], consistent with the results of this experiment. The results of this study indicated that the application of a high-voltage electric field significantly affected the thawing time and thawing rate (p < 0.05), having positive effects on reducing the thawing time and increasing the thawing rate.

3.2. Thawing Loss

Table 1 shows the evaporation loss, drip loss, cooking loss, and total loss of beef samples under different thawing voltages. The experimental results showed that the evaporation loss of beef increased with increasing voltage. Mousakhani-Ganjeh et al. discovered that the evaporation loss rate increased with increasing voltage during the HVEF thawing process of tuna [39], consistent with the results of this experiment. During the thawing process, the cell membranes and tissue structures are damaged, and muscle cells become unable to absorb the water that migrates to the outside of the cells, resulting in liquid loss [41]. The drip loss rate of beef decreases with increasing voltage, possibly because as the voltage increases, the ion wind speed also increases, causing a large amount of water to evaporate from the surface of the beef, resulting in some cells on the beef surface drying out due to dehydration. Jia et al. reported similar experimental results when studying the high-voltage electric field thawing of pork tenderloin. The drip loss of pork tenderloin under high-voltage electric field treatment was lower than that under natural thawing [37].
During cooking, beef is subjected to compression, which causes protein denaturation and muscle fiber contraction. This process results in a reduction in the space between the fibers, leading to the expulsion of water and causing steam cooking loss [42]. Cooking loss includes the loss of soluble substances and water due to the thermal deformation and destruction of muscle fiber proteins, leading to the disruption of the muscle cell structure [43]. The cooking loss rate showed a trend of first decreasing and then increasing with increasing voltage, reaching a maximum value of 45.34% at 20 kV. The decrease in steam cooking loss at voltages below 20 kV may be due to the shorter thawing time, reducing the time spent in the zone of maximum ice-crystal formation and resulting in a lower degree of ice-crystal melting, thereby reducing steam cooking loss. The slow increase in cooking loss after 20 kV may be due to the ozone generated by the HVEF causing changes in the protein structure of the beef. As the voltage increases, the amount of ozone also increases, resulting in a gradual increase in the cooking loss rate.
The total loss rate is the sum of the evaporation loss rate, drip loss rate, and cooking loss rate, which show decreasing trends with increasing voltage. The total loss rate of meat thawing can reflect its water-holding capacity, and the lower the total loss rate is, the better the water-holding capacity. The total loss rate of the experimental group treated with HVEF was significantly lower than that of the control group under natural thawing (p < 0.05). This result suggests that the HVEF improves the water-holding capacity of thawed beef, with higher voltage resulting in a lower total loss rate and better water-holding capacity.

3.3. WHC

The water-holding capacity of meat is the ability of muscles to retain their initial water content and absorb water during processing or storage, such as when subjected to pressure, heat, shredding, freezing, thawing, etc. The WHC is an important indicator for assessing meat and meat products, which can affect various aspects such as the weight, loss rate, and tenderness of meat during storage and transportation [44]. The water-holding capacity of beef mainly depends on the structure of its myofibrils, which to some extent determines the quality of thawed products [45]. Myofibrils account for a large proportion of muscle cells, with 85% of the water content stored in myofibrils [44]. In this study, the water-holding capacity of thawed beef was calculated based on the percentage of water loss after centrifugation (EM) of the samples [27]. A smaller EM value indicates better water-holding capacity. Figure 5 shows the water-holding capacity of beef samples at different thawing voltages. As shown in the figure, as the voltage increases, the EM value of beef first decreases and then increases. However, the experimental group subjected to HVEF treatment had significantly lower EM values than the control group subjected to natural thawing (p < 0.05). By observing the microstructure of beef through scanning electron microscopy, it can be found that HVEF thawing can reduce the damage to the structure of beef myofibrils caused by thawing and reduce the loss of free water between myofibrils. The experimental results indicate that HVEF thawing can significantly improve the water-holding capacity of beef (p < 0.05).

3.4. Color

The color of beef is an important indicator by which consumers assess the quality and freshness of beef and is one of the most important attributes of the meat [46]. The color change of beef during thawing is usually due to lipid oxidation and pigment degradation [47]. Table 2 shows the influence of different voltage thawing conditions on the color of beef. As shown in the table, the ΔL values for the control group and all experimental groups were negative, indicating that regardless of the thawing conditions, the brightness value L decreased. However, the ΔL value of the experimental group significantly decreased compared with that of the control group (p < 0.05), indicating that the brightness value L of beef under HVEF treatment was significantly lower than that of beef under natural thawing (p < 0.05), and the brightness value L of beef decreased gradually with increasing voltage. The decrease in the L value is related to the rate of evaporation loss. As the voltage increases, the evaporation loss rate of the beef increases, and the degree of dryness on the beef surface gradually increases. The free water content that diffuses to the beef surface decreases and the reflectivity decreases [3], resulting in a decrease in the L value of the beef surface as the voltage increases. The a value represents the redness value, which is the aspect of beef color that consumers value the most, as they usually associate the size of the a value with the freshness and quality of the beef [48]. The increase in the Δa value gradually increased with increasing voltage. A higher a value indicates a better appearance of the thawed beef. As shown in Table 2, the experimental group under high-voltage electric field thawing had a significantly higher a value compared with the control group thawed under natural conditions. The increase in the a value may be due to the binding of myoglobin with oxygen during the thawing process [32].
The value of Δb also increased with increasing voltage. When performing high-voltage electric field thawing, applying a voltage to the point electrode ionizes N2+, O2+, N+, O+, and O− plasma in the air, exciting oxygen atom electrons, thereby inducing oxygen atom cleavage. The cleaved oxygen atoms combine with other oxygen molecules to form ozone [49]. The increase in the b value may be related to the production of ozone. Beef has a high fat content, with approximately 10 g of fat per 100 g of beef. The lipids in beef are oxidized by the ozone generated during the high-voltage electric field thawing process, and the higher the voltage, the higher the ozone content produced and the higher the degree of lipid oxidation. Mousakhani-Ganjeh et al. found that lipids in tuna were oxidized by the ozone or ionized air molecules generated during the high-voltage electric field thawing process, leading to browning reactions and an increase in the b value [39].
The variable ΔC represents color saturation, and a higher value of ΔC indicates higher saturation and better color of beef. As shown in Table 2, the experimental group under HVEF thawing had significantly higher color saturation than the control group under natural thawing (p < 0.05). Moreover, as the voltage increased, the value of ΔC also increased gradually. The variable Δa° represents the hue angle, and its value decreased gradually with increasing voltage, indicating that the color of the beef shifted toward red after thawing. The variable ΔE represents the total color difference due to color changes. The total color difference in beef after HVEF thawing was significantly greater than that of beef thawed under natural conditions, with a maximum value of 11.67, indicating that the surface color of beef underwent significant changes after thawing through high-voltage electric field thawing. The experimental results demonstrate that high-voltage electric field thawing had a significant impact on the color of beef.

3.5. Malondialdehyde Content

Lipids can accelerate protein oxidation, and the reactive oxygen species produced by lipids are potential inducers of protein oxidation [50]. Malondialdehyde (MDA) is a peroxidized lipid substance that is formed after further decomposition of oxidized fats in food and is commonly used to determine whether food has undergone oxidative deterioration. Lipid oxidation can lead to changes in the color, odor, and flavor of food, resulting in food quality deterioration and the formation of toxic substances [51]. The product of lipid oxidation, malondialdehyde, can react with proteins to change their structure. Protein and lipid oxidation processes typically result in a decrease in the functionality of muscle proteins, such as reduced water-holding capacity and weakened gel strength, also negatively affecting meat tenderness [47].
Figure 6 shows the contents of malondialdehyde in thawed beef samples. At thawing voltages of 12, 16, 20, 24, and 28 kV and in the control group thawed under natural conditions, the malondialdehyde contents were 3.6, 2.4, 3.1, 3.8, 4.8, and 4.4 mg/kg, respectively. The malondialdehyde content in thawed beef decreased first and then gradually increased with increasing voltage, and the content was the lowest at 16 kV, indicating the lowest degree of lipid oxidation at this voltage. Beef is rich in heme-myoglobin and hemoglobin, and the destruction of these heme groups produces large amounts of free iron. Free iron ions catalyze the production of reactive oxygen species and play a catalytic role in lipid oxidation. During the HVEF thawing process, the air is ionized to produce atmospheric plasma. The active nitrogen and other substances rich in atmospheric plasma move oriented with the action of the electric field, and when approaching the surface of the beef, they combine with water and are injected into the beef to form nitrite. Nitrite combines with hemoglobin and myoglobin to form nitroso hemoglobin and nitroso myoglobin, forming stable compounds that reduce iron utilization and inhibit lipid oxidation [52]. Except for the malondialdehyde content in thawed beef at 28 kV, which was higher than that in the control group, the malondialdehyde contents in thawed beef at other voltages were lower than that in the control group. When the nitrite content in beef is low, the promoting effect of lipid oxidation is greater than the inhibiting effect, and the content of malondialdehyde increases. Ke et al. concluded that the TBARS value of fish increased after plasma treatment. It is possible that the increase in lipid oxidation was due to the fact that the active substances produced by the plasma treatment promoted lipid oxidation, which was less inhibited than promoted by the lower nitrite content [53]. Therefore, it can be concluded that high-voltage electric field thawing technology can inhibit the degree of lipid oxidation in beef during the thawing process under suitable voltages.

3.6. Microstructure

Scanning electron microscopy was performed to examine the microstructure of beef and any changes in the microstructure that occurred, as shown in Figure 7. With increasing voltage, the damage to the muscle fiber structure of the thawed beef gradually decreased, and the structure of the muscle fibers tended to remain intact. The tissue structure of thawed beef under natural conditions became seriously damaged, and the myofibril structure was damaged in large areas, causing a large amount of water loss between myofibrils. Compared with the control group, the experimental group treated with a high-voltage electric field had less damage to the muscle fiber structure, the gaps between the muscle fibers decreased, and the surface of the beef became smoother, reducing the loss of free water between the muscle fibers during thawing. This is because the HVEF can cause protein unfolding and form a denser and more uniform gel network of muscle fiber proteins, with proteins arranged more regularly in space. In addition, the unfolding of proteins can expose more hydrophobic groups, enhancing the interactions between proteins. Therefore, the moisture in beef myofibrils thawed by HVEF can be better preserved, and the drip loss rate and cooking loss rate of beef can be reduced. In a study of pulsed electric field-assisted thawing of duck meat, Chang et al. found that the sample thawed by electric field-assisted thawing had highly organized myofibrillar protein coagulation and protein structure, which could reduce water loss during cooking [54].

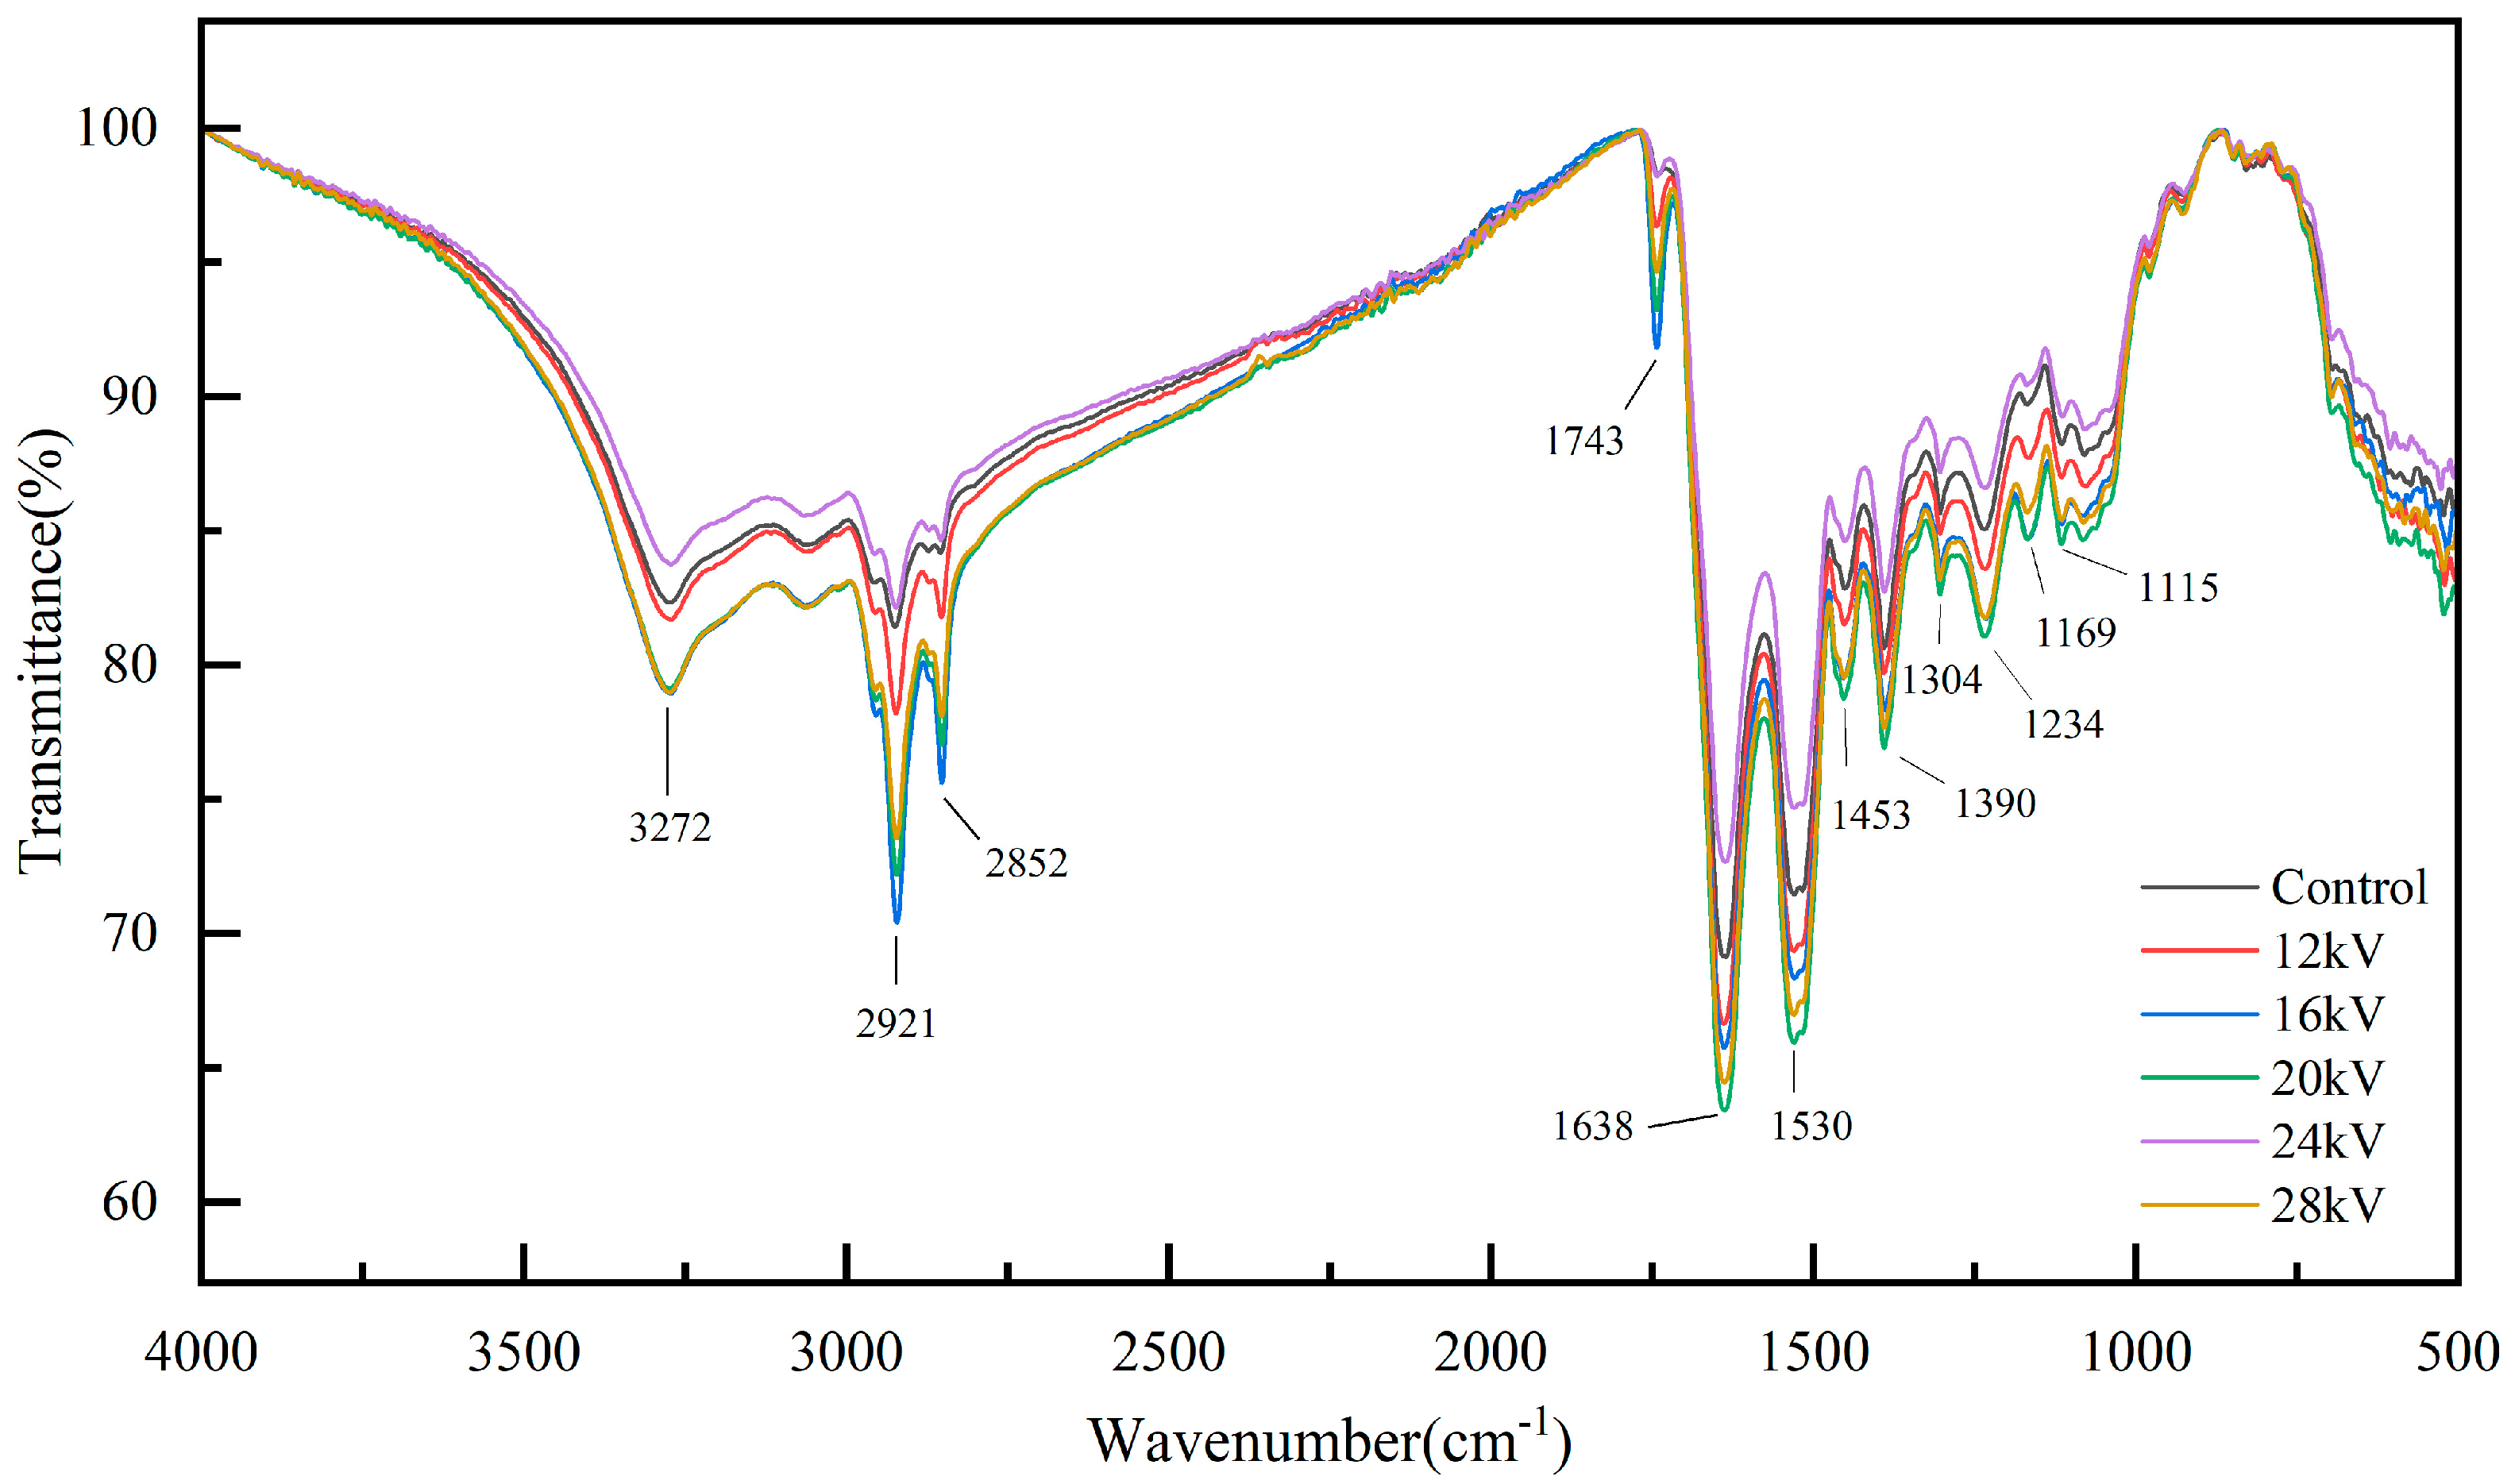
3.7. FTIR Spectroscopy

In recent years, spectroscopy techniques have become popular for assessing food quality [55]. Fourier transform infrared spectroscopy (FTIR) detection technology is commonly used on meat for adulteration detection, microbial spoilage monitoring, and detecting changes in protein and lipid composition due to its advantages of being fast, economical, nondestructive, and sensitive [56]. The Fourier transform infrared spectroscopy (FTIR) spectra of beef thawed at different voltages are presented in Figure 8. The positions of the absorption peaks for thawing at different voltages did not show obvious changes, but there were significant differences in the intensities of the absorption peaks. Except for the 24 kV treatment group, which had a lower absorption peak intensity compared with the control group, the other high-voltage electric field treatment groups exhibited higher absorption peak intensities than the control group under natural conditions. Among them, the absorption peak intensities at 16, 20, and 28 kV were similar, while the absorption peak intensity of 12 kV was smaller. As shown in Figure 8, there were 12 characteristic peaks, which were concentrated in the ranges of 1110–1750 cm−1 and 2850–3300 cm−1. In Section 2.14, it was mentioned that the interference peaks of water and carbon dioxide were removed when plotting the infrared spectrum, so the presence of water cannot be observed in the infrared spectrum. Because no characteristic peaks exist between 1750–2850 cm-1, this range is not included in the interpretation of the infrared spectra.
According to the literature [57,58,59,60,61], the absorption peak near 3272 cm−1 corresponds to the N-H stretching vibration of proteins and the O-H stretching vibration of polysaccharides, and the corresponding compounds are proteins and carbohydrates. The absorption peak near 2921 cm−1 belongs to CH2 asymmetric stretching, and the corresponding compounds are lipids. The absorption peak near 2852 cm−1 belongs to CH2 symmetric stretching, the corresponding compounds are lipids. The absorption peak near 1743 cm−1 belongs to C=O carbon-based stretching vibration, and the corresponding compounds are cholesteryl esters and triglycerides. The absorption peak near 1638 cm−1 belongs to amide I (80% C-O stretching, 10% N-H bending, and 10% C-N stretching), corresponding to protein compounds. The absorption peak near 1530 cm−1 belongs to amide II (60% N-H bending, 40% C-N stretching), corresponding to protein compounds. The absorption peak near 1453 cm−1 belongs to the C-O-H and methyl bending modes, corresponding to proteins and lipids. The absorption peak near 1390 cm−1 belongs to COO- symmetric stretching, and the corresponding compounds are fatty acids. The absorption peak near 1304 cm−1 belongs to amide III (30% C-N stretching, 30% N-H bending, 10% C=O stretching, 10% O=C-N bending, 20% others), corresponding to protein compounds. The absorption peak near 1234 cm−1 belongs to C-O stretching vibration, and the corresponding compounds are lipids. The absorption peak near 1169 cm−1 belongs to C-O stretching vibration of a serine C-OH group and C-O stretching vibration of threonine and tyrosine residues and carbohydrates, and the corresponding compounds are proteins and carbohydrates. The absorption peak near 1115 cm−1 belongs to P-O-C symmetric stretching, C-H bending vibration, and C-O stretching vibration, corresponding to compounds such as nucleic acids, fatty acids, and lipids. From the figure, it can be observed that the beef exhibited strong absorption peaks at 2921, 1638, and 1530 cm−1, indicating higher contents of proteins and lipids, which are the main components of the meat.
Comparing the beef samples treated with HVEF to the control beef subjected to natural thawing, there were no significant changes in the positions of the absorption peaks. However, the intensities of the absorption peaks in the high-pressure electric field treatment group were greater than those of the control group. Therefore, it can be concluded that high-pressure electric field thawing technology can better preserve the nutritional components of beef.

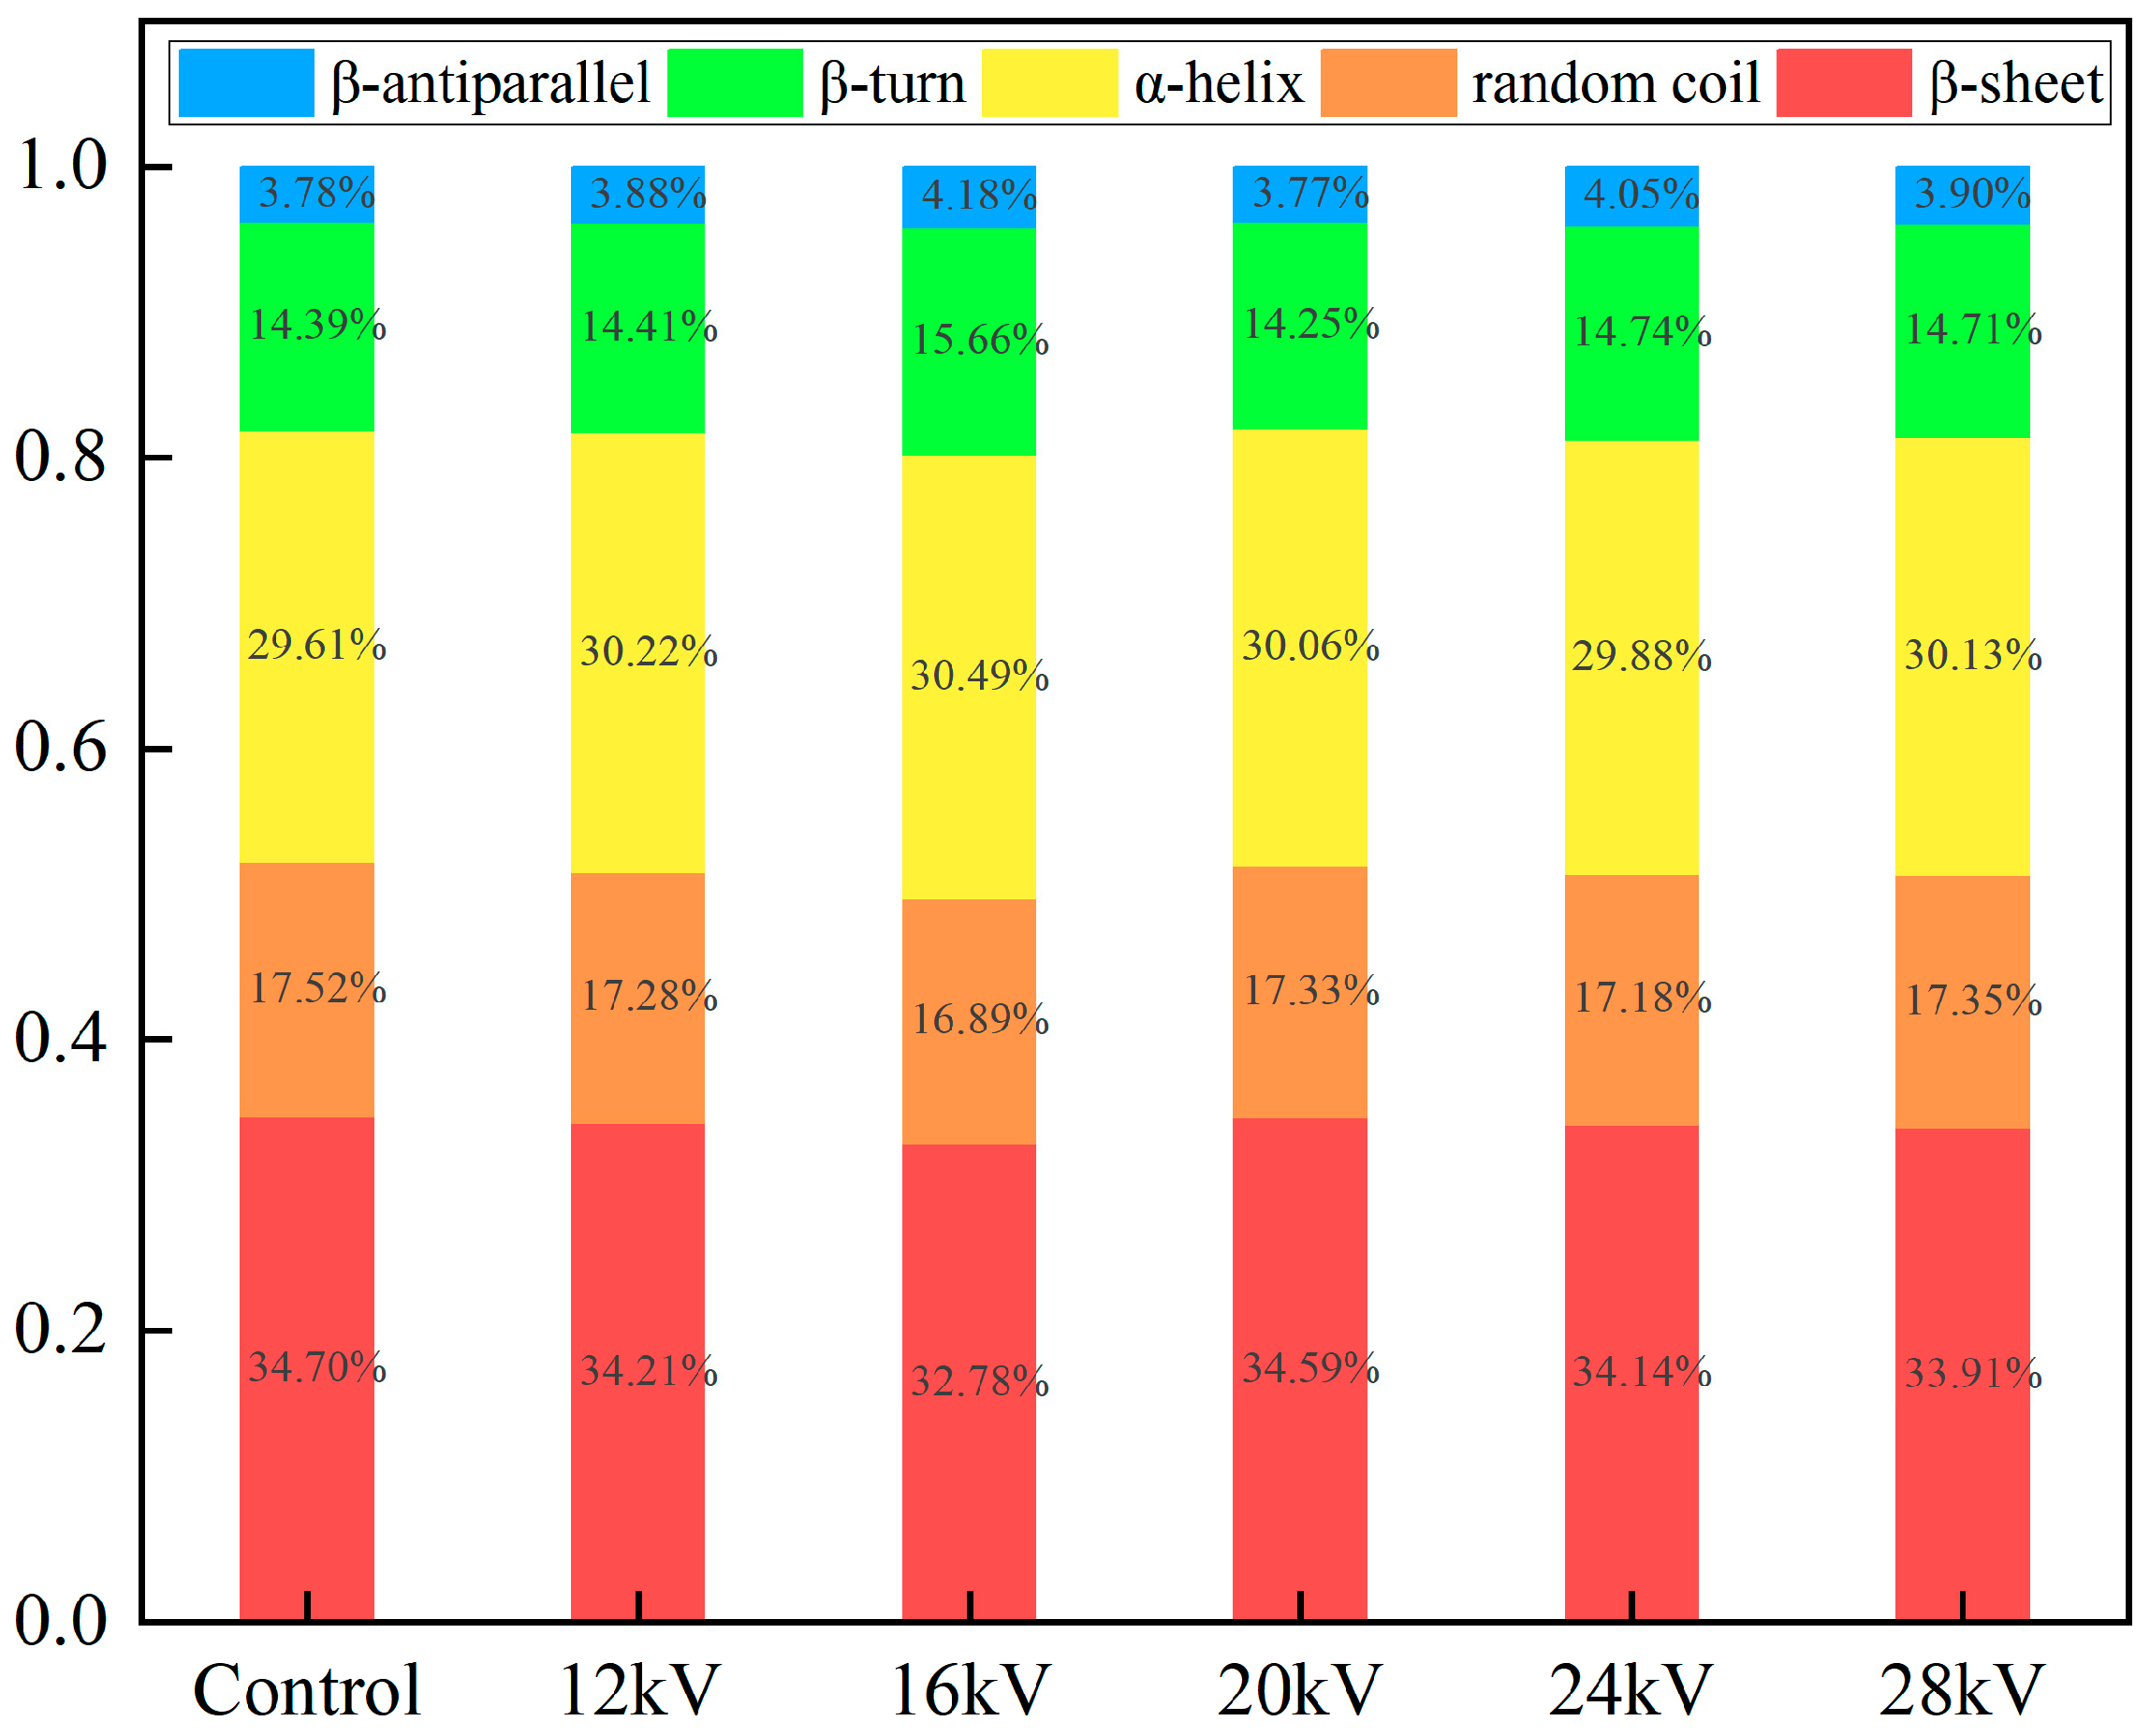
3.8. Protein Secondary Structure

It has been reported that the amide I band (1600–1700 cm−1) in the infrared spectrum mainly comes from C=O tensile vibrations, C-N tensile vibrations, and N-H bending vibrations in proteins, which are very useful for studying protein secondary structure. Every protein secondary structure is closely related to the vibration frequency of the amide I band [62]. The range 1615–1637 cm−1 corresponds to β-sheets, 1637–1645 cm−1 corresponds to random coils, 1645–1664 cm−1 corresponds to α-helices, 1664–1682 cm−1 corresponds to β-turns, and 1682–1700 cm−1 corresponds to β-antiparallel sheets [63].
The relative contents of protein secondary structure in thawed beef are presented in Figure 9. Compared to the control group under natural thawing conditions, the experimental groups with high-pressure electric field thawing had increased contents of α-helices, β-turns, and β-antiparallel sheets, while the contents of random coils and β-sheets decreased. According to a study by Yang et al., the change in β-sheet content is due to the interactions between proteins and lipids, as well as the interactions between protein molecules [64], indicating that high-pressure electric field thawing can have an impact on β-sheet content. In addition, the secondary structures of proteins can be divided into ordered and disordered structures. The α-helices and β-sheets (parallel and antiparallel) represent ordered structures, while β-turns and random coils represent disordered structures [65]. In the experimental groups thawed under voltages of 12, 16, 20, 24, and 28 kV and the control group thawed under natural conditions, the contents of ordered structures were 68.31%, 67.45%, 68.42%, 68.08%, 67.94%, and 68.09%, and the contents of disordered structures were 31.69%, 32.55%, 31.58%, 31.92%, 32.06%, and 31.91%. Thus, the experimental group of beef subjected to HVEF thawing showed a decrease in ordered structures and an increase in disordered structures. The changes in protein secondary structure are mainly related to hydrogen bonds, which are the main driving forces stabilizing protein secondary structure. The decrease in ordered structures indicates that the hydrogen bonds in the protein gel network became weakened during the beef thawing process under the action of HVEF. These results indicate that the energy generated by the HVEF causes protein unfolding and weakening of hydrogen bonds, thereby affecting the protein’s secondary structure and causing it to transition from an ordered structure to a disordered structure. The increase in disordered structure reduces the fiber gap of the sample and improves the water retention of the beef. Mohsenpour et al. reported that a decrease in α-helix content as well as an increase in β-sheet and β-turn content increased WHC [66]. Ozone can change the protein secondary structure, and the change in the protein secondary structure may be related to the large amount of ozone generated during the HVEF-mediated thawing [39].

3.9. Low-Field Nuclear Magnetic Resonance (LF-NMR)

Low-field nuclear magnetic resonance is an effective method for evaluating water distribution and mobility in meat [67]. Based on water migration rates, the T2 relaxation time can be divided into three relaxation components. The first component, T2b (0.1–1 ms), represents bound water tightly associated with macromolecules such as proteins or polysaccharides. The second component, T21 (10–100 ms), represents fixed water within the muscle fiber network. The third component, T22 (100–1000 milliseconds), represents free water in the spaces between the fiber bundles, which is more prone to loss during the thawing process. The shorter the relaxation time, the worse the mobility of water is; a longer relaxation time means that the water has better mobility and is less bound to the protein [68]. Among these, fixed water (T21) is the major component of the three types of water [69]. The peak area represents the water content.
Figure 10 shows the LF-NMR T2 relaxation curves and spin–spin relaxation times for the thawed beef samples. As shown in the figure, two types of water components were observed in the thawed beef, namely, T2b-bound water and T21-fixed water. Figure 11 and Figure 12 represent the peak areas for T2b and T21, respectively, and also indicate the contents of bound water and fixed water in the beef measured by low-field nuclear magnetic resonance. As shown in Figure 11, the experimental group subjected to HVEF treatment had higher levels of bound water compared with the control group thawed under natural conditions. Moreover, except for beef thawed at 24 kV, the remaining experimental groups showed significant increases in their bound water contents. Therefore, it can be concluded that HVEF thawing can improve the hydration ability of thawed beef. In the experiment, the experimental group with a thawing voltage of 24 kV experienced significant errors, which may be the reason for the abnormal behavior. Similar conclusions were also drawn by Li et al., who found that fish thawed under an HVEF had a stronger ability to bind with water than fish thawed under natural conditions [42]. Except for the beef thawed under an HVEF at 24 kV, the experimental groups thawed under the remaining HVEF conditions had higher water contents than the control group thawed under natural conditions. During the thawing process, a portion of the fixed water in the beef is converted into free water, which may be due to the migration of water in the myofibrils or changes in hydrogen bonds between proteins and water [70]. These results indicate that HVEF thawing improves the hydration capacity of thawed beef, reduces the loss of fixed water, and enhances the water-holding capacity of thawed beef.

4. Conclusions

These experiments conducted on beef thawed under HVEF conditions revealed that the thawing rates increased with higher voltage and were significantly higher than that of the control group. The experimental results of the total loss rate, water-holding capacity, and low-field nuclear magnetic resonance indicated that thawing under an HVEF can improve the water retention characteristics of thawed beef. The color results of the beef after thawing under an HVEF were observably better than the control group. The results of scanning electron microscopy indicated that thawing beef under HVEF can reduce the damage to the myofibrillar structure, and the higher the voltage is, the smaller the degree of damage. The measurement of malondialdehyde content revealed that HVEF thawing of beef can reduce the degree of lipid oxidation. Fourier transform infrared spectroscopy showed that the thawing conditions had little effect on the absorption peak positions of beef, but the absorption peak intensities in the experimental group were generally higher than those in the control group. Protein secondary structure analysis revealed that HVEF thawing transformed the proteins in beef from ordered to disordered structures, reducing fiber gaps and improving the water-holding capacity of beef.

Author Contributions

Y.T., conceptualization, methodology, software, validation, investigation, data curation, writing—original draft preparation; C.D., visualization, project administration. All authors have read and agreed to the published version of the manuscript.

Funding

This research was funded by National Natural Science Foundations of China (Nos. 52067017, 12365023 and 12265021), Innovation and Entrepreneurship Training Program for Chinese College Students (No.202210128003), Program for Young Talents of Science and Technology in Universities of Inner Mongolia Autonomous Region (No. NJYT23020) and Natural Science Foundation of Inner Mongolia Autonomous Region (Nos. 2022LHMS01002 and 2023LHMS05019).

Data Availability Statement

The data that support the findings of this study are available from the corresponding author upon reasonable request.

Conflicts of Interest

The authors declare no conflict of interest.

References

  1. OECD/FAO. OECD-FAO Agricultural Outlook 2019–2028; OECD: Paris, France, 2019. [Google Scholar] [CrossRef]
  2. Wu, B.; Qiu, C.; Guo, Y.; Zhang, C.; Guo, X.; Bouhile, Y.; Ma, H. Ultrasonic-assisted flowing water thawing of frozen beef with different frequency modes: Effects on thawing efficiency, quality characteristics and microstructure. Food Res. Int. 2022, 157, 111484. [Google Scholar] [CrossRef] [PubMed]
  3. Egelandsdal, B.; Abie, S.M.; Bjarnadottir, S.; Zhu, H.; Kolstad, H.; Bjerke, F.; Martinsen, Ø.G.; Mason, A.; Münch, D. Detectability of the degree of freeze damage in meat depends on analytic-tool selection. Meat Sci. 2019, 152, 8–19. [Google Scholar] [CrossRef] [PubMed]
  4. Dalvi-Isfahan, M.; Hamdami, N.; Le-Bail, A. Effect of freezing under electrostatic field on the quality of lamb meat. Innov. Food Sci. Emerg. Technol. 2016, 37, 68–73. [Google Scholar] [CrossRef]
  5. Xia, X.; Kong, B.; Liu, Q.; Liu, J. Physicochemical change and protein oxidation in porcine longissimus dorsi as influenced by different freeze–thaw cycles. Meat Sci. 2009, 83, 239–245. [Google Scholar] [CrossRef]
  6. Eui-Soo, L.; Jong-Youn, J.; Long-Hao, Y.; Ji-Hun, C.; Doo-Jeong, H.; Yun-Sang, C.; Cheon-Jei, K. Effects of Thawing Temperature on the Physicochemical and Sensory Properties of Frozen Pre-Rigor Beef Muscle. Food Sci. Biotechnol. 2007, 16, 626–631. [Google Scholar]
  7. Eastridge, J.S.; Bowker, B.C. Effect of Rapid Thawing on the Meat Quality Attributes of USDA Select Beef Strip Loin Steaks. J. Food Sci. 2011, 76, S156–S162. [Google Scholar] [CrossRef] [PubMed]
  8. Shrestha, S.; Schaffner, D.; Nummer, B.A. Sensory quality and food safety of boneless chicken breast portions thawed rapidly by submersion in hot water. Food Control 2009, 20, 706–708. [Google Scholar] [CrossRef]
  9. Icier, F.; Izzetoglu, G.T.; Bozkurt, H.; Ober, A. Effects of ohmic thawing on histological and textural properties of beef cuts. J. Food Eng. 2010, 99, 360–365. [Google Scholar] [CrossRef]
  10. Sun, Q.; Kong, B.; Liu, S.; Zheng, O.; Zhang, C. Ultrasound-assisted thawing accelerates the thawing of common carp (Cyprinus carpio) and improves its muscle quality. LWT 2021, 141, 111080. [Google Scholar] [CrossRef]
  11. Uyar, R.; Bedane, T.F.; Erdogdu, F.; Koray Palazoglu, T.; Farag, K.W.; Marra, F. Radio-frequency thawing of food products—A computational study. J. Food Eng. 2015, 146, 163–171. [Google Scholar] [CrossRef]
  12. Cai, L.; Cao, M.; Cao, A.; Regenstein, J.; Li, J.; Guan, R. Ultrasound or microwave vacuum thawing of red seabream (Pagrus major) fillets. Ultrason. Sonochem. 2018, 47, 122–132. [Google Scholar] [CrossRef]
  13. Taher, B.J.; Farid, M.M. Cyclic microwave thawing of frozen meat: Experimental and theoretical investigation. Chem. Eng. Process. Process Intensif. 2001, 40, 379–389. [Google Scholar] [CrossRef]
  14. Cai, L.; Zhang, W.; Cao, A.; Cao, M.; Li, J. Effects of ultrasonics combined with far infrared or microwave thawing on protein denaturation and moisture migration of Sciaenops ocellatus (red drum). Ultrason. Sonochem. 2019, 55, 96–104. [Google Scholar] [CrossRef] [PubMed]
  15. Lv, F.; Song, J.; Wang, P.; Ruan, H.; Geng, J. Influencing Factors of Flow Field of Ionic Wind Induced by Corona Discharge in a Multi-Needle-to-Net Electrode Structure Under Direct-Current Voltage. IEEE Access 2019, 7, 123671–123678. [Google Scholar] [CrossRef]
  16. Larick, D.K.; Turner, B.E. Aseptic Processing of Beef Particulates: Flavor Development/Stability and Texture. J. Food Sci. 1992, 57, 1046–1050. [Google Scholar] [CrossRef]
  17. He, X.; Jia, G.; Tatsumi, E.; Liu, H. Effect of corona wind, current, electric field and energy consumption on the reduction of the thawing time during the high-voltage electrostatic-field (HVEF) treatment process. Innov. Food Sci. Emerg. Technol. 2016, 34, 135–140. [Google Scholar] [CrossRef]
  18. Orlowska, M.; Havet, M.; Le-Bail, A. Controlled ice nucleation under high voltage DC electrostatic field conditions. Food Res. Int. 2009, 42, 879–884. [Google Scholar] [CrossRef]
  19. Rahbari, M.; Hamdami, N.; Mirzaei, H.; Jafari, S.M.; Kashaninejad, M.; Khomeiri, M. Effects of high voltage electric field thawing on the characteristics of chicken breast protein. J. Food Eng. 2018, 216, 98–106. [Google Scholar] [CrossRef]
  20. Amiri, A.; Mousakhani-Ganjeh, A.; Shafiekhani, S.; Mandal, R.; Singh, A.P.; Kenari, R.E. Effect of high voltage electrostatic field thawing on the functional and physicochemical properties of myofibrillar proteins. Innov. Food Sci. Emerg. Technol. 2019, 56, 102191. [Google Scholar] [CrossRef]
  21. Kantono, K.; Hamid, N.; Oey, I.; Wang, S.; Xu, Y.; Ma, Q.; Faridnia, F.; Farouk, M. Physicochemical and sensory properties of beef muscles after Pulsed Electric Field processing. Food Res. Int. 2019, 121, 1–11. [Google Scholar] [CrossRef]
  22. Ding, C.; Ni, J.; Song, Z.; Gao, Z.; Deng, S.; Xu, J.; Wang, G.; Bai, Y. High-Voltage Electric Field-Assisted Thawing of Frozen Tofu: Effect of Process Parameters and Electrode Configuration. J. Food Qual. 2018, 2018, 5191075. [Google Scholar] [CrossRef]
  23. Ni, J.; Ding, C.; Zhang, Y.; Song, Z. Impact of different pretreatment methods on drying characteristics and microstructure of goji berry under electrohydrodynamic (EHD) drying process. Innov. Food Sci. Emerg. Technol. 2020, 61, 102318. [Google Scholar] [CrossRef]
  24. Mousakhani-Ganjeh, A.; Hamdami, N.; Soltanizadeh, N. Effect of high voltage electrostatic field thawing on the lipid oxidation of frozen tuna fish (Thunnus albacares). Innov. Food Sci. Emerg. Technol. 2016, 36, 42–47. [Google Scholar] [CrossRef]
  25. Alizadeh, E.; Chapleau, N.; De Lamballerie, M.; LeBail, A. Effects of Freezing and Thawing Processes on the Quality of Atlantic Salmon (Salmo salar) Fillets. J. Food Sci. 2007, 72, E279–E284. [Google Scholar] [CrossRef]
  26. Li, C.; Wang, D.; Xu, W.; Gao, F.; Zhou, G. Effect of final cooked temperature on tenderness, protein solubility and microstructure of duck breast muscle. LWT Food Sci. Technol. 2013, 51, 266–274. [Google Scholar] [CrossRef]
  27. Jia, G.; Liu, H.; Nirasawa, S.; Liu, H. Effects of high-voltage electrostatic field treatment on the thawing rate and post-thawing quality of frozen rabbit meat. Innov. Food Sci. Emerg. Technol. 2017, 41, 348–356. [Google Scholar] [CrossRef]
  28. Jia, G.; van den Berg, F.; Hao, H.; Liu, H. Estimating the structure of sarcoplasmic proteins extracted from pork tenderloin thawed by a high-voltage electrostatic field. J. Food Sci. Technol. 2020, 57, 1574–1578. [Google Scholar] [CrossRef]
  29. Reitznerová, A.; Šuleková, M.; Nagy, J.; Marcinčák, S.; Semjon, B.; Čertík, M.; Klempová, T. Lipid Peroxidation Process in Meat and Meat Products: A Comparison Study of Malondialdehyde Determination between Modified 2-Thiobarbituric Acid Spectrophotometric Method and Reverse-Phase High-Performance Liquid Chromatography. Molecules 2017, 22, 1988. [Google Scholar] [CrossRef]
  30. Palka, K.; Daun, H. Changes in texture, cooking losses, and myofibrillar structure of bovine M. semitendinosus during heating. Meat Sci. 1999, 51, 237–243. [Google Scholar] [CrossRef]
  31. Bakal, A.; Hayakawa, K.-I. Heat Transfer During Freezing and Thawing of Foods. Adv. Food Res. 1973, 20, 217–256. [Google Scholar] [CrossRef]
  32. He, X.; Liu, R.; Nirasawa, S.; Zheng, D.; Liu, H. Effect of high voltage electrostatic field treatment on thawing characteristics and post-thawing quality of frozen pork tenderloin meat. J. Food Eng. 2013, 115, 245–250. [Google Scholar] [CrossRef]
  33. Sun, Q.; Zhang, M.; Mujumdar, A.S. Recent developments of artificial intelligence in drying of fresh food: A review. Crit. Rev. Food Sci. Nutr. 2019, 59, 2258–2275. [Google Scholar] [CrossRef] [PubMed]
  34. Ge, X.; Wang, H.; Yin, M.; Wang, X. Effect of Different Thawing Methods on the Physicochemical Properties and Microstructure of Frozen Instant Sea Cucumber. Foods 2022, 11, 2616. [Google Scholar] [CrossRef] [PubMed]
  35. Bai, Y.; Huo, Y.; Fan, X. Experiment of thawing shrimps (Penaeus vannamei) with high voltage electric field. Int. J. Appl. Electromagn. Mech. 2017, 55, 499–506. [Google Scholar] [CrossRef]
  36. Dalvi-Isfahan, M.; Hamdami, N.; Le-Bail, A.; Xanthakis, E. The principles of high voltage electric field and its application in food processing: A review. Food Res. Int. 2016, 89, 48–62. [Google Scholar] [CrossRef] [PubMed]
  37. Jia, G.; Sha, K.; Meng, J.; Liu, H. Effect of high voltage electrostatic field treatment on thawing characteristics and post-thawing quality of lightly salted, frozen pork tenderloin. LWT 2019, 99, 268–275. [Google Scholar] [CrossRef]
  38. Cai, L.; Cao, M.; Regenstein, J.; Cao, A. Recent Advances in Food Thawing Technologies. Compr. Rev. Food Sci. Food Saf. 2019, 18, 953–970. [Google Scholar] [CrossRef]
  39. Mousakhani-Ganjeh, A.; Hamdami, N.; Soltanizadeh, N. Impact of high voltage electric field thawing on the quality of frozen tuna fish (Thunnus albacares). J. Food Eng. 2015, 156, 39–44. [Google Scholar] [CrossRef]
  40. Hsieh, C.-W.; Lai, C.-H.; Ho, W.-J.; Huang, S.-C.; Ko, W.-C. Effect of Thawing and Cold Storage on Frozen Chicken Thigh Meat Quality by High-Voltage Electrostatic Field. J. Food Sci. 2010, 75, M193–M197. [Google Scholar] [CrossRef]
  41. Xie, Y.; Zhou, K.; Chen, B.; Wang, Y.; Nie, W.; Wu, S.; Wang, W.; Li, P.; Xu, B. Applying low voltage electrostatic field in the freezing process of beef steak reduced the loss of juiciness and textural properties. Innov. Food Sci. Emerg. Technol. 2021, 68, 102600. [Google Scholar] [CrossRef]
  42. Li, D.; Jia, S.; Zhang, L.; Li, Q.; Pan, J.; Zhu, B.; Prinyawiwatkul, W.; Luo, Y. Post-thawing quality changes of common carp (Cyprinus carpio) cubes treated by high voltage electrostatic field (HVEF) during chilled storage. Innov. Food Sci. Emerg. Technol. 2017, 42, 25–32. [Google Scholar] [CrossRef]
  43. Hong, H.; Luo, Y.; Zhou, Z.; Bao, Y.; Lu, H.; Shen, H. Effects of different freezing treatments on the biogenic amine and quality changes of bighead carp (Aristichthys nobilis) heads during ice storage. Food Chem. 2013, 138, 1476–1482. [Google Scholar] [CrossRef] [PubMed]
  44. Huff-Lonergan, E. 6—Fresh meat water-holding capacity. In Improving the Sensory and Nutritional Quality of Fresh Meat; Kerry, J.P., Ledward, D., Eds.; Woodhead Publishing: Sawston, UK, 2009; pp. 147–160. [Google Scholar]
  45. Li, F.; Wang, B.; Liu, Q.; Chen, Q.; Zhang, H.; Xia, X.; Kong, B. Changes in myofibrillar protein gel quality of porcine longissimus muscle induced by its stuctural modification under different thawing methods. Meat Sci. 2019, 147, 108–115. [Google Scholar] [CrossRef] [PubMed]
  46. Testa, M.L.; Grigioni, G.; Panea, B.; Pavan, E. Color and Marbling as Predictors of Meat Quality Perception of Argentinian Consumers. Foods 2021, 10, 1465. [Google Scholar] [CrossRef]
  47. Xia, X.; Kong, B.; Liu, J.; Diao, X.; Liu, Q. Influence of different thawing methods on physicochemical changes and protein oxidation of porcine longissimus muscle. LWT Food Sci. Technol. 2012, 46, 280–286. [Google Scholar] [CrossRef]
  48. Holman, B.W.B.; van de Ven, R.J.; Mao, Y.; Coombs, C.E.O.; Hopkins, D.L. Using instrumental (CIE and reflectance) measures to predict consumers’ acceptance of beef colour. Meat Sci. 2017, 127, 57–62. [Google Scholar] [CrossRef]
  49. Kim, J.-G.; Yousef, A.E.; Dave, S. Application of Ozone for Enhancing the Microbiological Safety and Quality of Foods: A Review. J. Food Prot. 1999, 62, 1071–1087. [Google Scholar] [CrossRef]
  50. Park, D.; Xiong, Y.L.; Alderton, A.L.; Ooizumi, T. Biochemical Changes in Myofibrillar Protein Isolates Exposed to Three Oxidizing Systems. J. Agric. Food Chem. 2006, 54, 4445–4451. [Google Scholar] [CrossRef]
  51. Falowo, A.B.; Fayemi, P.O.; Muchenje, V. Natural antioxidants against lipid–protein oxidative deterioration in meat and meat products: A review. Food Res. Int. 2014, 64, 171–181. [Google Scholar] [CrossRef]
  52. Domínguez, R.; Pateiro, M.; Gagaoua, M.; Barba, F.J.; Zhang, W.; Lorenzo, J.M. A Comprehensive Review on Lipid Oxidation in Meat and Meat Products. Antioxidants 2019, 8, 429. [Google Scholar] [CrossRef]
  53. Ke, Z.; Bai, Y.; Bai, Y.; Chu, Y.; Gu, S.; Xiang, X.; Ding, Y.; Zhou, X. Cold plasma treated air improves the characteristic flavor of Dry-cured black carp through facilitating lipid oxidation. Food Chem. 2022, 377, 131932. [Google Scholar] [CrossRef] [PubMed]
  54. Lung, C.T.; Chang, C.K.; Cheng, F.C.; Hou, C.Y.; Chen, M.H.; Santoso, S.P.; Yudhistira, B.; Hsieh, C.W. Effects of pulsed electric field-assisted thawing on the characteristics and quality of Pekin duck meat. Food Chem. 2022, 390, 133137. [Google Scholar] [CrossRef] [PubMed]
  55. Zhao, M.; Downey, G.; O’Donnell, C.P. Exploration of microwave dielectric and near infrared spectroscopy with multivariate data analysis for fat content determination in ground beef. Food Control 2016, 68, 260–270. [Google Scholar] [CrossRef]
  56. Candoğan, K.; Altuntas, E.G.; İğci, N. Authentication and Quality Assessment of Meat Products by Fourier-Transform Infrared (FTIR) Spectroscopy. Food Eng. Rev. 2021, 13, 66–91. [Google Scholar] [CrossRef]
  57. Chen, Y.; Zou, C.; Mastalerz, M.; Hu, S.; Gasaway, C.; Tao, X. Applications of Micro-Fourier Transform Infrared Spectroscopy (FTIR) in the Geological Sciences—A Review. Int. J. Mol. Sci. 2015, 16, 30223–30250. [Google Scholar] [CrossRef]
  58. Lucarini, M.; Durazzo, A.; Sánchez del Pulgar, J.; Gabrielli, P.; Lombardi-Boccia, G. Determination of fatty acid content in meat and meat products: The FTIR-ATR approach. Food Chem. 2018, 267, 223–230. [Google Scholar] [CrossRef]
  59. Deniz, E.; Güneş Altuntaş, E.; Ayhan, B.; İğci, N.; Özel Demiralp, D.; Candoğan, K. Differentiation of beef mixtures adulterated with chicken or turkey meat using FTIR spectroscopy. J. Food Process. Preserv. 2018, 42, e13767. [Google Scholar] [CrossRef]
  60. Pebriana, R.; Rohman, A.; Lukitaningsih, E.; Sudjadi. Development of FTIR spectroscopy in combination with chemometrics for analysis of rat meat in beef sausage employing three lipid extraction systems. Int. J. Food Prop. 2017, 20, 1–11. [Google Scholar] [CrossRef]
  61. Zhao, X.; Han, G.; Wen, R.; Xia, X.; Chen, Q.; Kong, B. Influence of lard-based diacylglycerol on rheological and physicochemical properties of thermally induced gels of porcine myofibrillar protein at different NaCl concentrations. Food Res. Int. 2020, 127, 108723. [Google Scholar] [CrossRef]
  62. Acero-Lopez, A.; Ullah, A.; Offengenden, M.; Jung, S.; Wu, J. Effect of high pressure treatment on ovotransferrin. Food Chem. 2012, 135, 2245–2252. [Google Scholar] [CrossRef]
  63. Sun, Z.; Yang, F.-W.; Li, X.; Zhang, C.-h.; Xie, X.-l. Effects of Freezing and Thawing Treatments on Beef Protein Secondary Structure Analyzed with ATR-FTIR. Guang Pu Xue Yu Guang Pu Fen Xi = Guang Pu 2016, 36, 3542–3546. [Google Scholar] [PubMed]
  64. Yang, H.; Zhang, W.; Li, T.; Zheng, H.; Khan, M.A.; Xu, X.; Sun, J.; Zhou, G. Effect of protein structure on water and fat distribution during meat gelling. Food Chem. 2016, 204, 239–245. [Google Scholar] [CrossRef] [PubMed]
  65. Zhang, Z.; Yang, Y.; Zhou, P.; Zhang, X.; Wang, J. Effects of high pressure modification on conformation and gelation properties of myofibrillar protein. Food Chem. 2017, 217, 678–686. [Google Scholar] [CrossRef]
  66. Mohsenpour, M.; Nourani, M.; Enteshary, R. Effect of thawing under an alternating magnetic field on rainbow trout (Oncorhynchus mykiss) fillet characteristics. Food Chem. 2023, 402, 134255. [Google Scholar] [CrossRef] [PubMed]
  67. Pearce, K.L.; Rosenvold, K.; Andersen, H.J.; Hopkins, D.L. Water distribution and mobility in meat during the conversion of muscle to meat and ageing and the impacts on fresh meat quality attributes—A review. Meat Sci. 2011, 89, 111–124. [Google Scholar] [CrossRef] [PubMed]
  68. Zheng, J.; Sun, D.; Liu, D.; Sun, J.; Shao, J.-H. Low-field NMR and FTIR determination relationship between water migration and protein conformation of the preparation of minced meat. Int. J. Food Sci. Technol. 2022, 57, 235–241. [Google Scholar] [CrossRef]
  69. Zhang, M.; Haili, N.; Chen, Q.; Xia, X.; Kong, B. Influence of ultrasound-assisted immersion freezing on the freezing rate and quality of porcine longissimus muscles. Meat Sci. 2018, 136, 1–8. [Google Scholar] [CrossRef]
  70. Qian, S.; Li, X.; Wang, H.; Mehmood, W.; Zhong, M.; Zhang, C.; Blecker, C. Effects of low voltage electrostatic field thawing on the changes in physicochemical properties of myofibrillar proteins of bovine Longissimus dorsi muscle. J. Food Eng. 2019, 261, 140–149. [Google Scholar] [CrossRef]
Figure 1. HVEF thawing device. 1. High-voltage power supply control system; 2. Needle electrode; 3. Thermometer; 4. Sample; 5. Ground electrode; 6. Anemometer.
Processes 11 02567 g001
Figure 2. Temperature variation curves of beef centers.
Processes 11 02567 g002
Figure 3. Average ion wind speeds at different voltages during beef thawing. Different letters indicate significant differences (p < 0.05) between sample means.
Processes 11 02567 g003
Figure 4. Average drying times and average drying rates of beef. Different letters indicate significant differences (p < 0.05) between sample means.
Processes 11 02567 g004
Figure 5. Effects of different voltages on the water-holding capacity of beef. Different letters indicate significant differences (p < 0.05) between sample means.
Processes 11 02567 g005
Figure 6. Effects of different voltages on the malondialdehyde content in beef.
Processes 11 02567 g006
Figure 7. Microstructures of thawed beef under different voltages. (A) Control; (B) 18 kV; (C) 22 kV; (D) 26 kV; (E) 30 kV; (F) 34 kV.
Processes 11 02567 g007
Figure 8. Infrared spectra of beef thawed under different conditions.
Processes 11 02567 g008
Figure 9. Relative contents of protein secondary structures in beef samples thawed under different voltages.
Processes 11 02567 g009
Figure 10. Relaxation times of beef thawed under different voltages.
Processes 11 02567 g010
Figure 11. Peak areas of T2b in beef thawed under different voltages.
Processes 11 02567 g011
Figure 12. Peak areas of T21 in beef thawed under different voltages.
Processes 11 02567 g012
Table 1. Effects of different voltages on beef evaporation loss rate, drip loss rate, cooking loss rate, and total loss rate.
LossControl12 kV16 kV20 kV24 kV28 kV
Evaporation loss1.06 ± 0.23 d1.84 ± 0.16 c2.07 ± 0.11 c2.75 ± 0.44 b3.4 ± 0.25 a3.67 ± 0.34 a
Drip loss10.61 ± 2.85 a9.09 ± 1.85 ab8.1 ± 1.83 ab6.28 ± 1.82 bc4.38 ± 1.4 c3.21 ± 0.54 c
Cooking loss48.35 ± 0.08 a47.45 ± 0.83 ab46.21 ± 1.52 bc45.34 ± 1.57 c46.77 ± 0.73 abc47.32 ± 0.89 abc
Total loss60.03 ± 2.84 a58.38 ± 2.29 ab56.38 ± 2.42 bc54.36 ± 1.62 bc55.22 ± 0.75 c54.2 ± 0.62 c
Note: Data are shown as the mean ± SD. Different letters indicate significant differences (p < 0.05) between sample means.
Table 2. Effects of different voltages on beef color.
VoltageControl12 kV16 kV20 kV24 kV28 kV
Photos of beef thawedProcesses 11 02567 i001Processes 11 02567 i002Processes 11 02567 i003Processes 11 02567 i004Processes 11 02567 i005Processes 11 02567 i006
ΔL−2.38 ± 0.3 a−3.42 ± 0.63 a−5.16 ± 0.69 b−7.6 ± 0.66 c−9.21 ± 0.16 d−10.65 ± 0.91 e
Δa−2.38 ± 0.3 d−0.06 ± 0.29 c−0.17 ± 0.22 c−0.15 ± 0.6 bc0.61 ± 0.57 ab0.72 ± 0.12 a
Δb1.67 ± 0.6 c2.66 ± 0.31 b3.46 ± 0.43 b4.41 ± 0.43 a4.39 ± 0.31 a4.71 ± 0.54 a
ΔC0.89 ± 0.29 c1.39 ± 0.1 bc1.91 ± 0.28 b3.1 ± 0.63 a3.18 ± 0.23 a3.25 ± 0.19 a
Δa°−0.23 ± 0.1 a−0.36 ± 0.06 ab−0.44 ± 0.1 b−0.47 ± 0.05 b−0.46 ± 0.04 b−0.5 ± 0.08 b
ΔE2.94 ± 0.57 f4.35 ± 0.66 e6.24 ± 0.8 d8.82 ± 0.78 c10.23 ± 0.21 b11.67 ± 1.01 a
Note: Data are shown as the mean ± SD. Different letters indicate significant differences (p < 0.05) between sample means.
Disclaimer/Publisher’s Note: The statements, opinions and data contained in all publications are solely those of the individual author(s) and contributor(s) and not of MDPI and/or the editor(s). MDPI and/or the editor(s) disclaim responsibility for any injury to people or property resulting from any ideas, methods, instructions or products referred to in the content.

