Abstract
Frequent accidents may happen during the string run-down and pull process due to the lack of accuracy in the prediction of string force analysis. In order to precisely predict the completion string axial force in horizontal wells, a new model is established, and an in-house software has been developed. The model aims to predict the multiple local resistances that occur at different points on the completion string, which makes up for the technical defects of the commonly used software. It can calculate resistance at different points of the string, which will lead to varying hook load amplification. This method can also predict the axial force of the completion string. By changing the hook load, location, and direction, the resistance can be determined more accurately. Based on the calculation and analysis, the relationship between local resistance, the blocking point, and the amplification factor is also obtained. Furthermore, this model is used to analyze the local resistance of a horizontal well with multiple external packers in the low-permeability Sadi Reservoir of Halfaya Oilfield, Iraq. The recorded data from in-site operations are compared with the predicted results from this model. The results show that the relative errors between the recorded data and model calculation are within the range of 10%, which indicates that the calculated values are reliable. Meanwhile, the results indicate the success of the subsequent completion design and the construction of the oilfield.
1. Introduction
Horizontal well drilling technology can be traced back to 1927, and it was first put into practice in the 1940s [1,2]. In the 1950s and 1960s, it experienced a small upsurge of development and then stopped. In the 1970s and 1980s, with the rise in oil prices, an improvement in drilling matching technology, horizontal well development technology, and horizontal well technology was widely seen in the United States, Canada, and France. Nowadays, almost all types of reservoirs, such as depleted reservoirs, tight gas reservoirs, low-permeability reservoirs, marginal reservoirs, and high-permeability reservoirs, can be developed using horizontal well technology. In tight low-permeability reservoirs, natural fractures act as the only oil flow channel. The advantages of horizontal wells are particularly obvious. More than 70% of the horizontal wells drilled in the mid-1990s were completed in such reservoirs [3,4,5]. The study of horizontal well reservoir fracturing stimulation technology began in the 1980s. Since the long horizontal section of horizontal wells often crosses the reservoir, it is difficult to achieve effective reservoir reconstruction by acidizing and fracturing the whole well section. Therefore, it is necessary to conduct fracturings in multiple sections to form ideal independent artificial fractures and maximize the technical advantages of horizontal wells in developing low-permeability oilfields. Compared to general fracturing of vertical wells and horizontal wells, staged fracturing can effectively induce reservoir fractures, increase the discharge area, and greatly improve the production of oil and gas wells [6,7,8]. In recent years, with the continuous expansion of shale gas, tight oil/gas, and coalbed methane, horizontal well technology has been developed on an unprecedented scale, and new horizontal well fracturing technologies have been emerging [9,10,11,12,13,14,15,16].
One-trip multi-stage fracturing completion is a comprehensive method performed in open-hole horizontal wells. It combines the completion string and fracturing string as a one-trip string and runs down together. Tools run down the well, including bidirectional anchoring hangers, expandable open-hole packers, dropping ball promotion sliding sleeves, and differential pressure opening sleeves. Open-hole packers seal the horizontal section to achieve isolation from the fracturing operation part. In this way, the whole horizontal section can be completely fractured. By 2013, 21 fractured sections in one well had been achieved in the Changqing Oilfield in China, in which tight gas accounts for 70~80% of the total gas [17]. Multi-stage acidizing technology and fracturing technology are commonly used in low-permeability reservoirs [18].
The open-hole staged fracturing completion of horizontal wells involves a long horizontal open-hole section and a number of large-diameter tools. During the construction process, it is difficult to ensure that the completion string can be smoothly run to the specific position, and this is the key to successful fracturing completion [19]. For example, one staged fracturing string stuck to the wellbore while being run down the well, and eight packers were set locally [20]. This forced the researchers to change the fracturing stage from six to three. The actual length of the horizontal section was 1169 m, while the string only entered at 439 m, with a 730 m loss.
The running resistance of the string comes from two aspects: one is the axial resistance or rotation moment caused by friction after the string comes into contact with the wellbore, and the other is the local resistance caused by the string itself or wellbore conditions. In 2020, Guo and Rashid proposed an analytical model for axial force transfer in extended-reach drilling [21]. Generally, friction refers to prior circumstances, so the model is established mainly based on the previous one developed in this work. The local blocking force is considered empirically according to the carrying capacity of rigid tools.
The investigation shows that although there is some theoretical analysis of the friction resistance of complex completion strings in horizontal wells, and the field has rich operation experience, accidents occur from time to time when the string cannot be run down to the bottom of the well. Such accidents are fatal, often leading to the abandonment of wells and huge economic losses. Running a completion string is a systematic operation, and even commercial software, such as Landmark, cannot predict the probability of resistance. Therefore, according to the field construction process, developing a new calculation method for pipe string axial force is necessary.
2. Materials and Methods
2.1. Characteristics of the String Resistance
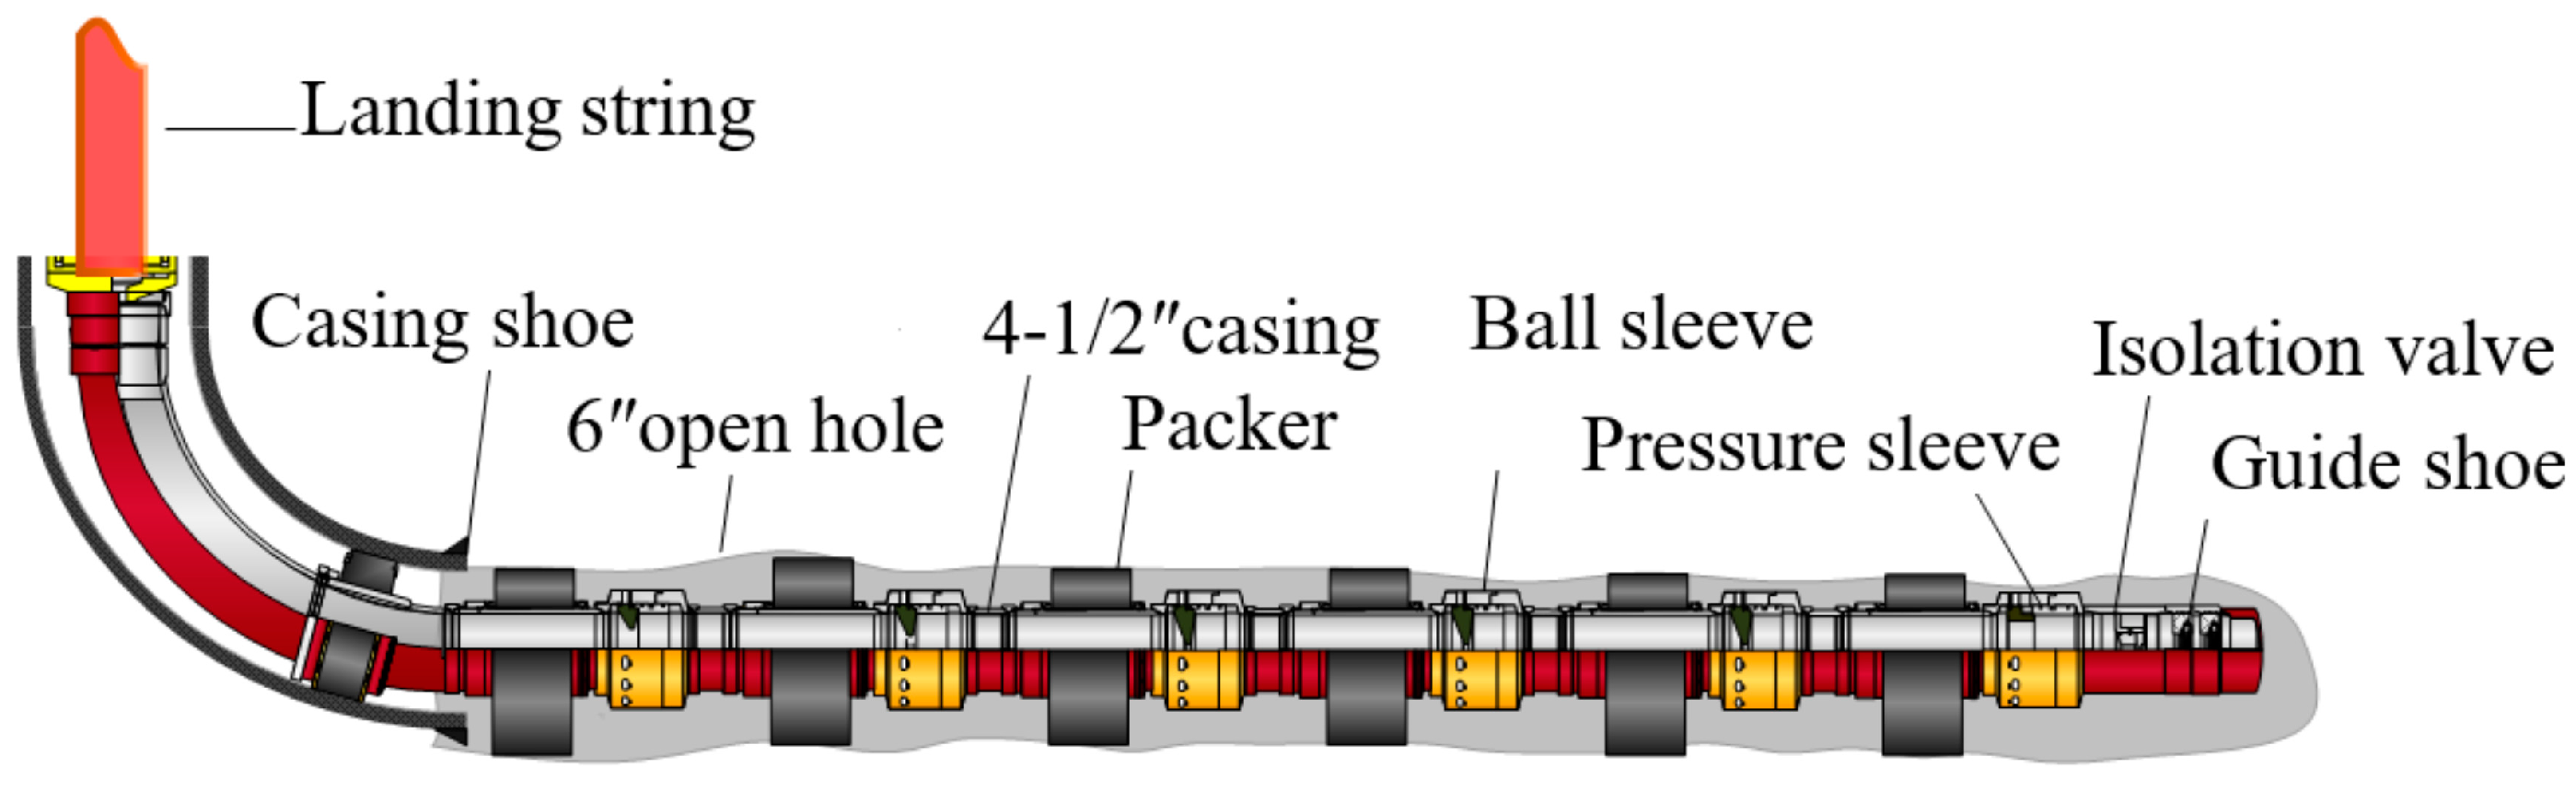
The lower multi-stage integrated fracturing string is sent into the horizontal open hole by the landing string. The overall structure of pipe string from bottom to top is as follows:
Guide shoe + ball seat + casing + differential pressure sleeve + casing + open-hole packer + casing + ball sliding sleeve + casing + ⋯ + open-hole packer + casing + hanging packer + plug back sealing barrel + release sub + landing string + ground-driven equipment.
As shown in Figure 1, during the running process, the fracturing string must pass through the vertical section, the curved section, and the horizontal section. After entering the curved section, the elastic bending deformation of the string occurs, and the friction resistance increases rapidly. After entering the horizontal open-hole section, the packer is affected by debris, shoulder, grooves, and other factors, resulting in various additional resistances. These resistances are transmitted to the wellhead, which is reflected by the change in hook load.
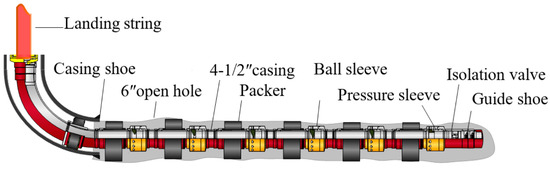
Figure 1.
Wellbore and string structure of the lower section.
2.2. Basic Model of Mechanical Analysis
2.2.1. One-Dimensional Borehole
Assuming the string is subjected to axial tension in a one-dimensional borehole, the bending effect of the string and packer is ignored due to the simple load condition. If the string unit length buoyant weight is q, the string length is L, the string outer diameter is rc, the well inclination angle is β, and the friction coefficient is μ, then
The normal contact force between the centralizer and wellbore is ;
The axial friction force is ;
The circumferential friction force is ;
Therefore, in this case, the string friction is independent of the axial force.
2.2.2. Two-Dimensional Borehole
For the horizontal well, the two-dimensional borehole focuses on friction calculation. Previous scholars have conducted several studies on the axial force and friction of the string in horizontal wells [22,23,24,25,26,27,28,29], and there is not much difference in these models.
Based on the theory of plane elastic beam, Lubinski established the elastic line differential equation of drilling strings with axial tension and axial compression [30]. However, in practical analyses, it often uses the simplified method. First of all, it is considered that the string curvature is equal to that of the borehole, a micro-segment force analysis is shown in Figure 2. Given the initial angle of the element φ, the length of the element is, the string is subjected to the axial tension P, and the string contacts with the upper side of the wellbore. In the string running process, the friction force is opposite to the moving direction. In Figure 2, R is the curvature radius of the well section, w is the weight of string line, dN is the normal contact force between the element and the wellbore, μ is the friction factor between the string and the wellbore, and M is the bending moment of string.
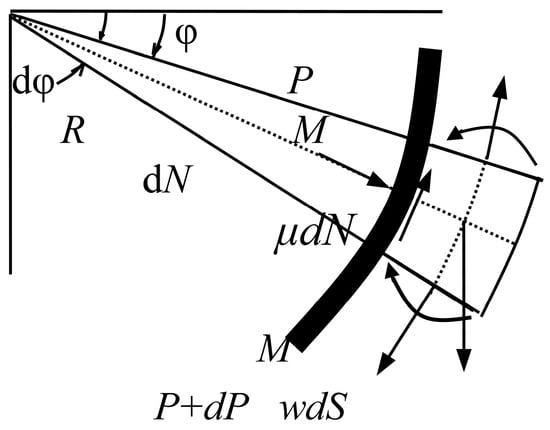
Figure 2.
Mechanical analysis of smooth string and wellbore contact.
Assuming that the element curvature is constant, the element shear force is 0, and the string bending moment is .
The normal contact force between the unit length string and the wellbore is .
For the pipe string under axial pressure, the string makes contacts with the lower side of the wellbore, and the calculation of the bending moment and normal contact force per unit length are the same as above.
2.2.3. Three-Dimensional Borehole
Choose a three-dimensional discrete string section. When the axial force at the lower side of the string and the lateral force per unit length are known, the axial force at the upper side of the string element can be calculated by the following equation:
where is the length of the string section; is the string effective weight per unit length; is the friction factor between wellbore and string, which is taken as “+” when the string moves upward and “−” when the string moves downward; is the average deviation angle; is the full angle change rate of the string element; and are the deviation angle and azimuth angle of the upper endpoint of the string element; and are the deviation angle and azimuth angle of the lower end point of the string element; and is contact force caused by the axial force of string and gravity.
For the friction torque calculation model in a three-dimensional borehole, the contact force is calculated as follow:
where is the contact force between the micro-element section of pipe string and the wellbore, is the axial force at the micro-element bottom side; is the micro-segment azimuth increment, is the deviation angle, is the deviation angle increment of micro-element, is the string unit's buoyant weight and , is the string unit weight in the air, is the liquid density, is the string density, and is the micro-segment length.
In Equation (2), when , this equation can be used to calculate the contact force of a two-dimensional well, and when , it can be considered as one-dimension.
The axial force:
where is the axial force at the bottom side of the micro-element.
Since the curve section of the horizontal well is very long and contains special well parts, the buckling problem should be considered when calculating the friction torque. After the pipe string buckles, the contact between the pipe string and the wellbore will inevitably occur. The contact force caused by buckling should also be considered when calculating friction resistance. The pipe string buckle condition can be judged by calculating and comparing whether the equivalent axial force exceeds the critical buckling force of the pipe string.
The critical string buckling forces in the inclined section and the horizontal section are calculated by the following equations:
where is the string sinusoidal critical buckling force, is the string helical buckling critical force, and is the string bending rigidity.
The critical buckling force of the string in the vertical section is calculated according to the following equations:
The micro-element contact force between the string and the wellbore caused by buckling is calculated as follows:
The total contact force between the string and the wellbore is as follows:
2.3. Multi-Point Resistance Calculation Method
2.3.1. Disadvantages of Traditional Resistance Calculation Method
The traditional models are simple and convenient for programming, but they have the following disadvantages:
- (1)
- The additional resistance caused by special tools, such as packers, cannot be accurately described;
- (2)
- The local resistance caused by wellbore grooves and debris accumulation cannot be reflected in the model;
- (3)
- It is impossible to distinguish the influence of resistance at different positions from the hook load.
At present, commercial software does not have such analytical functions. In order to overcome these shortcomings, this work establishes a precise extrapolation method based on the micro-element analysis method.
2.3.2. Establishment of the Precise Calculation Method
The axial force of the whole string is obtained by superposition calculation from the bottom section of the string. When the pipe string is blocked at some point, the local resistance is calculated separately and added to the axial force.
The specific methods and processes are as follows:
- Calculation method of overall axial force of strings
For horizontal wells, to obtain the axial force at the upper section of the string, the axial force during the run-down and pull-up processes can be calculated from the bottom of the string to the wellhead and finally verified by the hook load. The equivalent axial force at the bottom of the string is set to 0. By using the basic model, the deformation, contact force and friction resistance of each pipe section are calculated, and then the axial force of the whole string is obtained.
- 2.
- Local resistance
Whether it is caused by the string or the wellbore, once the string is subjected to local resistance, the resistance will be applied to the calculation node of the string, and its influence on the hook load can be transmitted. According to the characteristics of resistance, it can be divided into upward resistance, downward resistance, and bidirectional resistance. The upward resistance only exists when the string is pulling up, but does not exist when the string is running down; the downward resistance only exists when the string is running down, but does not exist when the string is pulling up; and the bidirectional resistance will exist whether the string is pulling up or running down.
- 3.
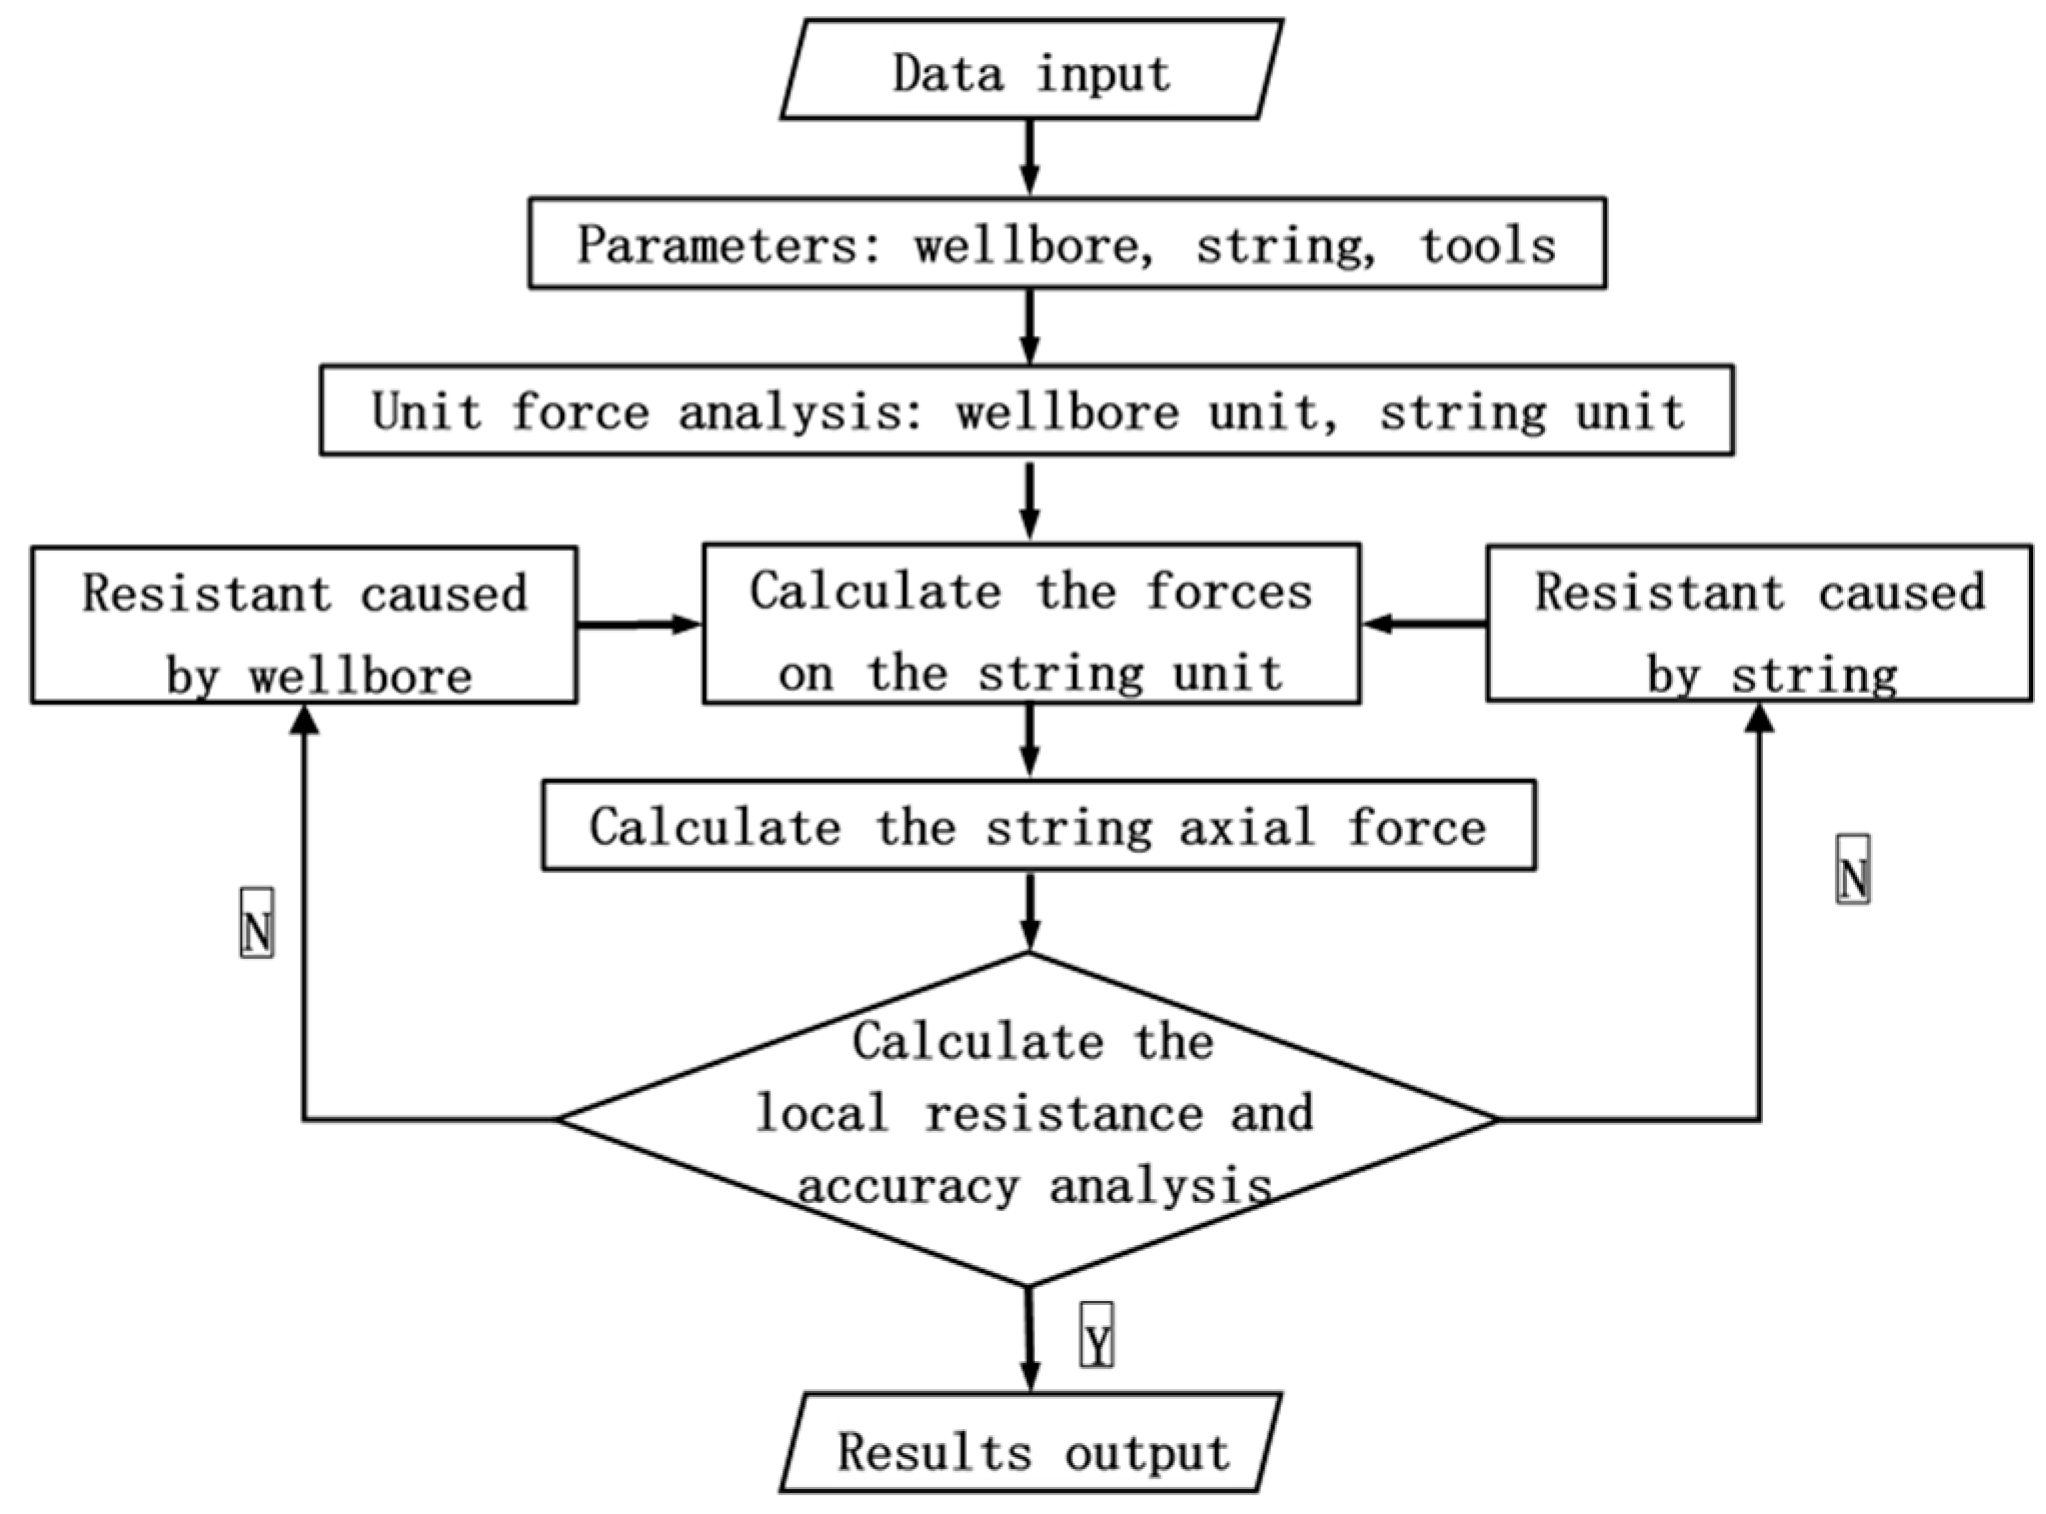
- Process of multi-point resistance calculation and analysis
The process of multi-point resistance calculation and analysis is shown in Figure 3. The corresponding calculation software is developed based on this process.

Figure 3.
Flow chart of multi-point resistance calculation.
The software used for the proposed model is based on the Python development environment, combining the optimized equations and methods with string mechanics, wellbore conditions, string structure, and construction process to calculate the axial force distribution and friction resistance when running down the string. The torsional force calculation is also added in this software, which can analyze the characteristics of hook load when some tools, such as external packers, are stuck, to provide reference values to more accurately determine the position of the stuck point and the stuck character.
- 4.
- Advantages and innovation of this method
- (1)
- The ability to accurately calculate the axial force of the whole string from the bottom to the wellhead by calculating the deformation, contact force, and friction force;
- (2)
- The division of the resistance into pull-up resistance, run-down resistance, and bi-directional resistance can describe the tool effect more accurately;
- (3)
- In the calculation of the axial force, the numerical method is used to calculate the relationship between the contact force and the axial force;
- (4)
- The description of the force and deformation of the string with the packer in the curved wellbore with the third-order differential equation, allows for the resistance of the string near the centralizer and packer to be obtained by numerical simulation;
- (5)
- The ability to quickly judge the key position and key cause in case of jamming.
3. Results
3.1. Basic Data
Based on the data of well S from the Halfaya Oilfield in Iraq, the mechanical analysis is carried out.
Wellbore parameters: the well depth is 3737 m; the kick-off point depth is 2234 m; the production casing outer diameter is 177.8 mm, the wall thickness is 10.36 mm, the running depth is 2926 m, and the well deviation is 90°. the open hole horizontal section is from 2926 m to 3737 m with a diameter of 152.4 mm.
A drill pipe and heavy-weight (HW) drill pipe are used to send and release the completion casing string. The string has eight open-hole packers, and the distance from the packers to the string toe section is 90 m, 150 m, 235 m, 340 m, 475 m, 580 m, 684 m, and 760 m, respectively.
The top of the casing is the hanger packer, and above the hanger packer is the drill pipe and heavy-weight drill pipe. The main parameters of the overall string are shown in Table 1. The friction factor is 0.25 in the casing and 0.3 in the open hole.

Table 1.
Main structural parameters of string.
3.2. String Axial Force
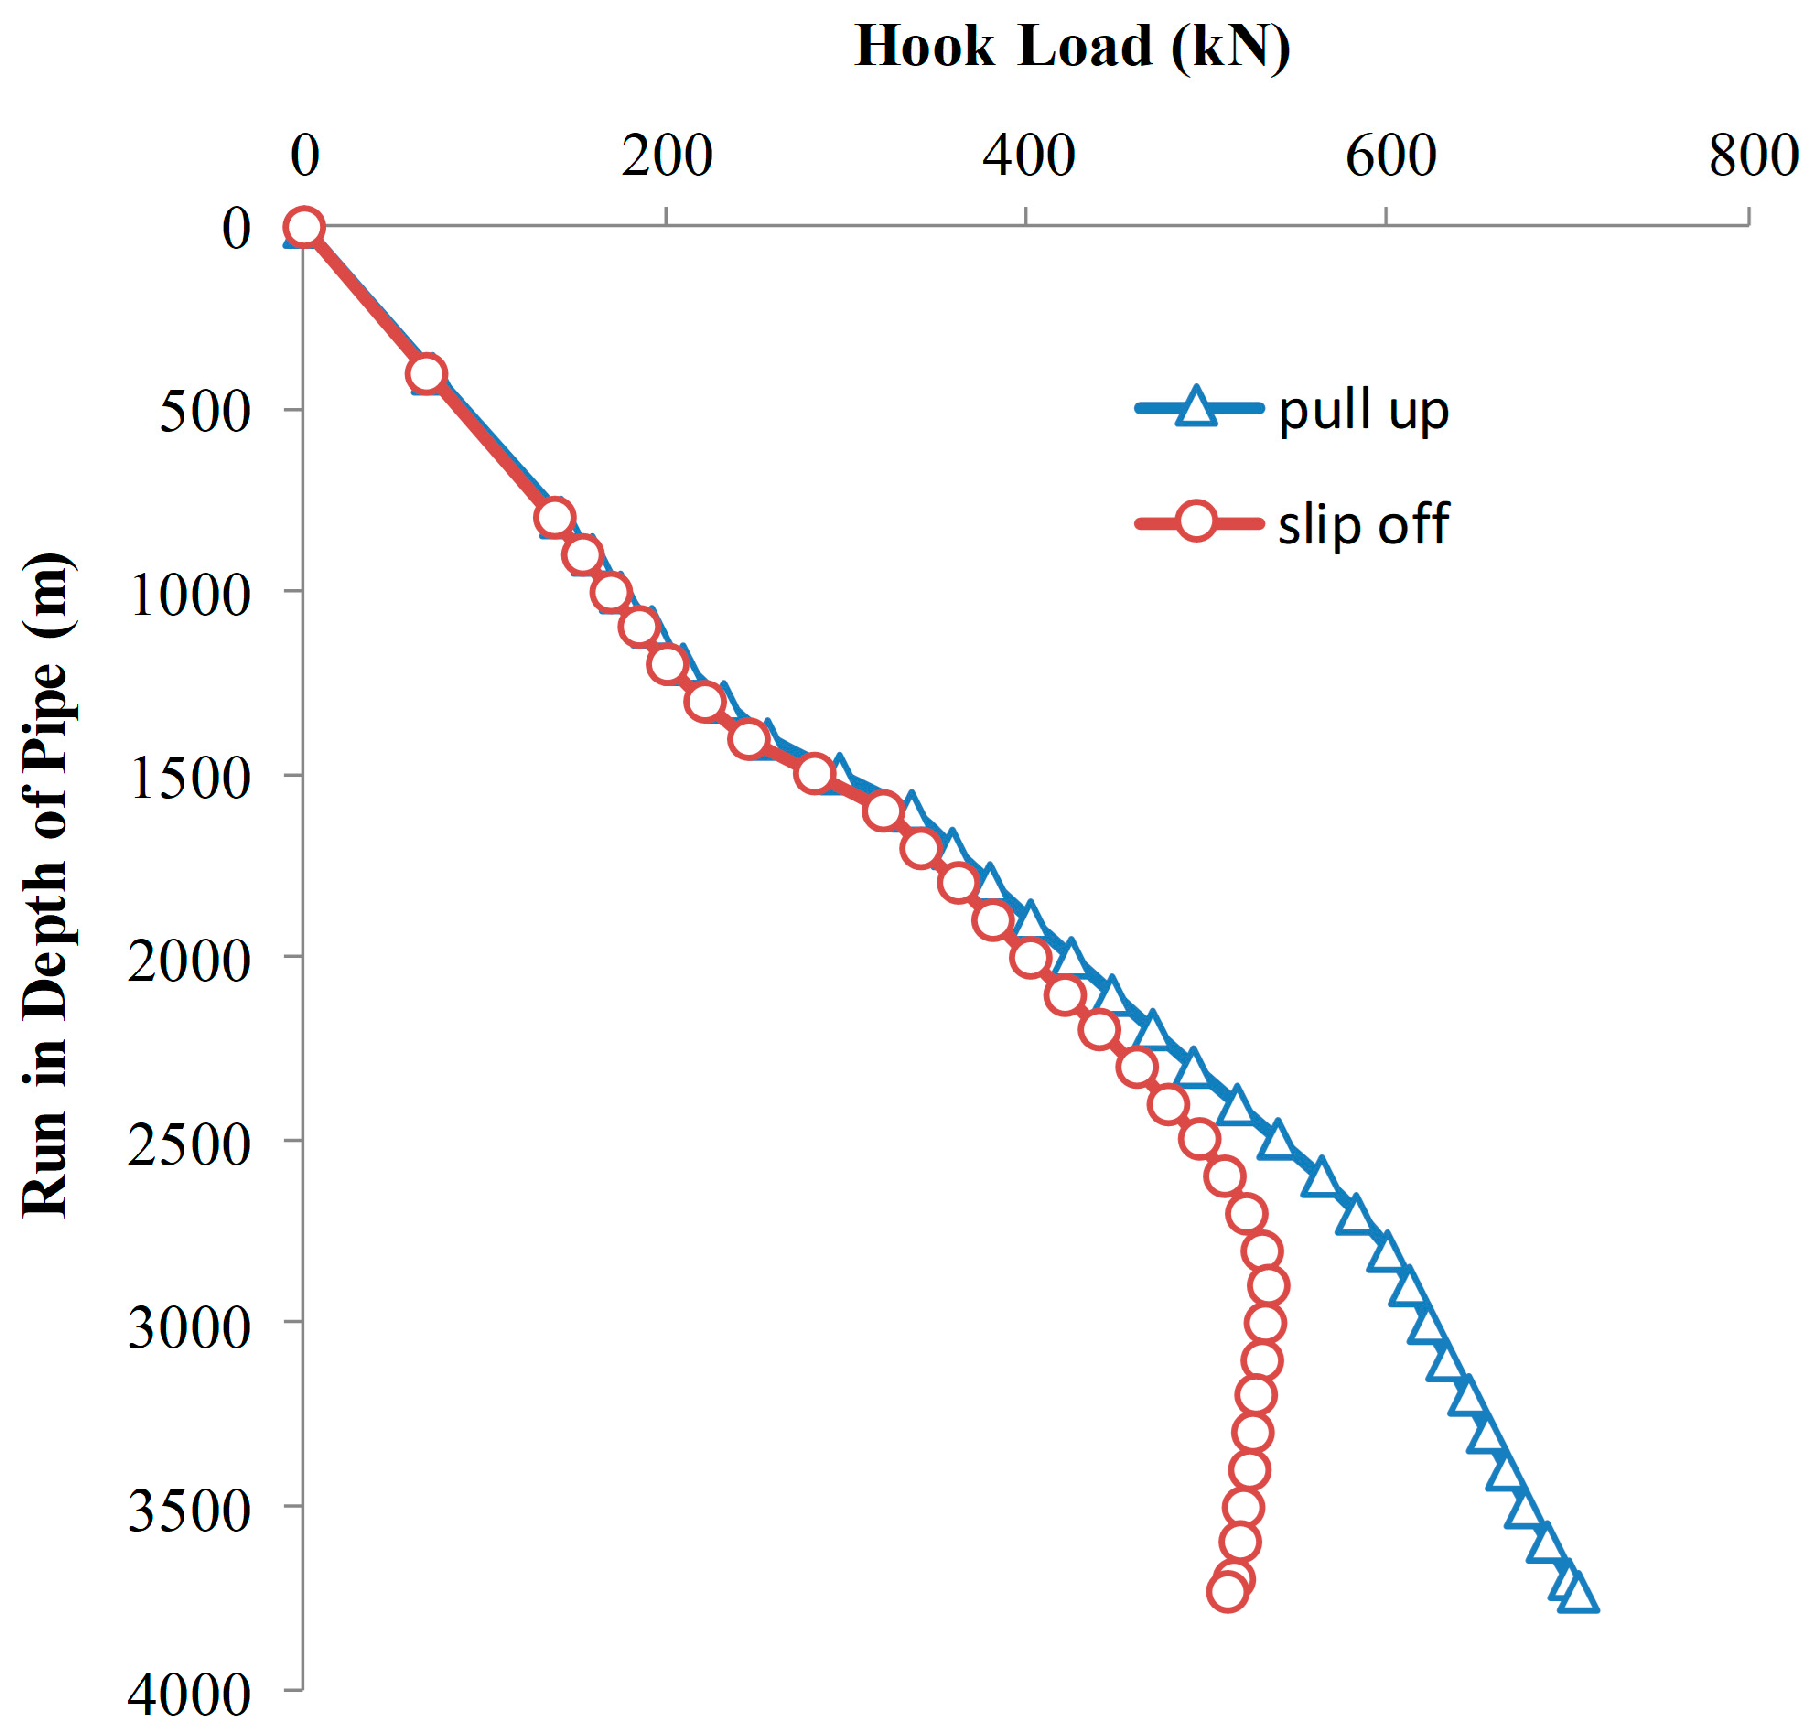
From previous models and parameters, the hook load is calculated along the depth, which is shown in Figure 4. It can be seen that the hook load has the following characteristics:
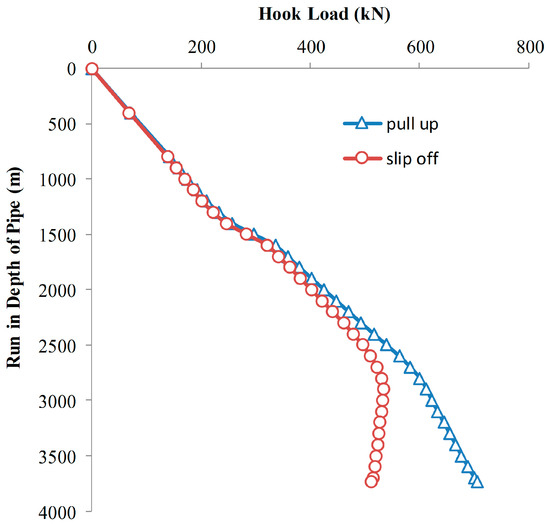
Figure 4.
Hook load at different depths.
- (1)
- The hook load difference between running down and pulling up gradually becomes larger when the string passes the kick-off point;
- (2)
- During the pulling-up process, the hook load increases with the string length;
- (3)
- During the running-down process, the hook load increases monotonously before the string enters the horizontal section, and decreases slowly after entering the horizontal section.
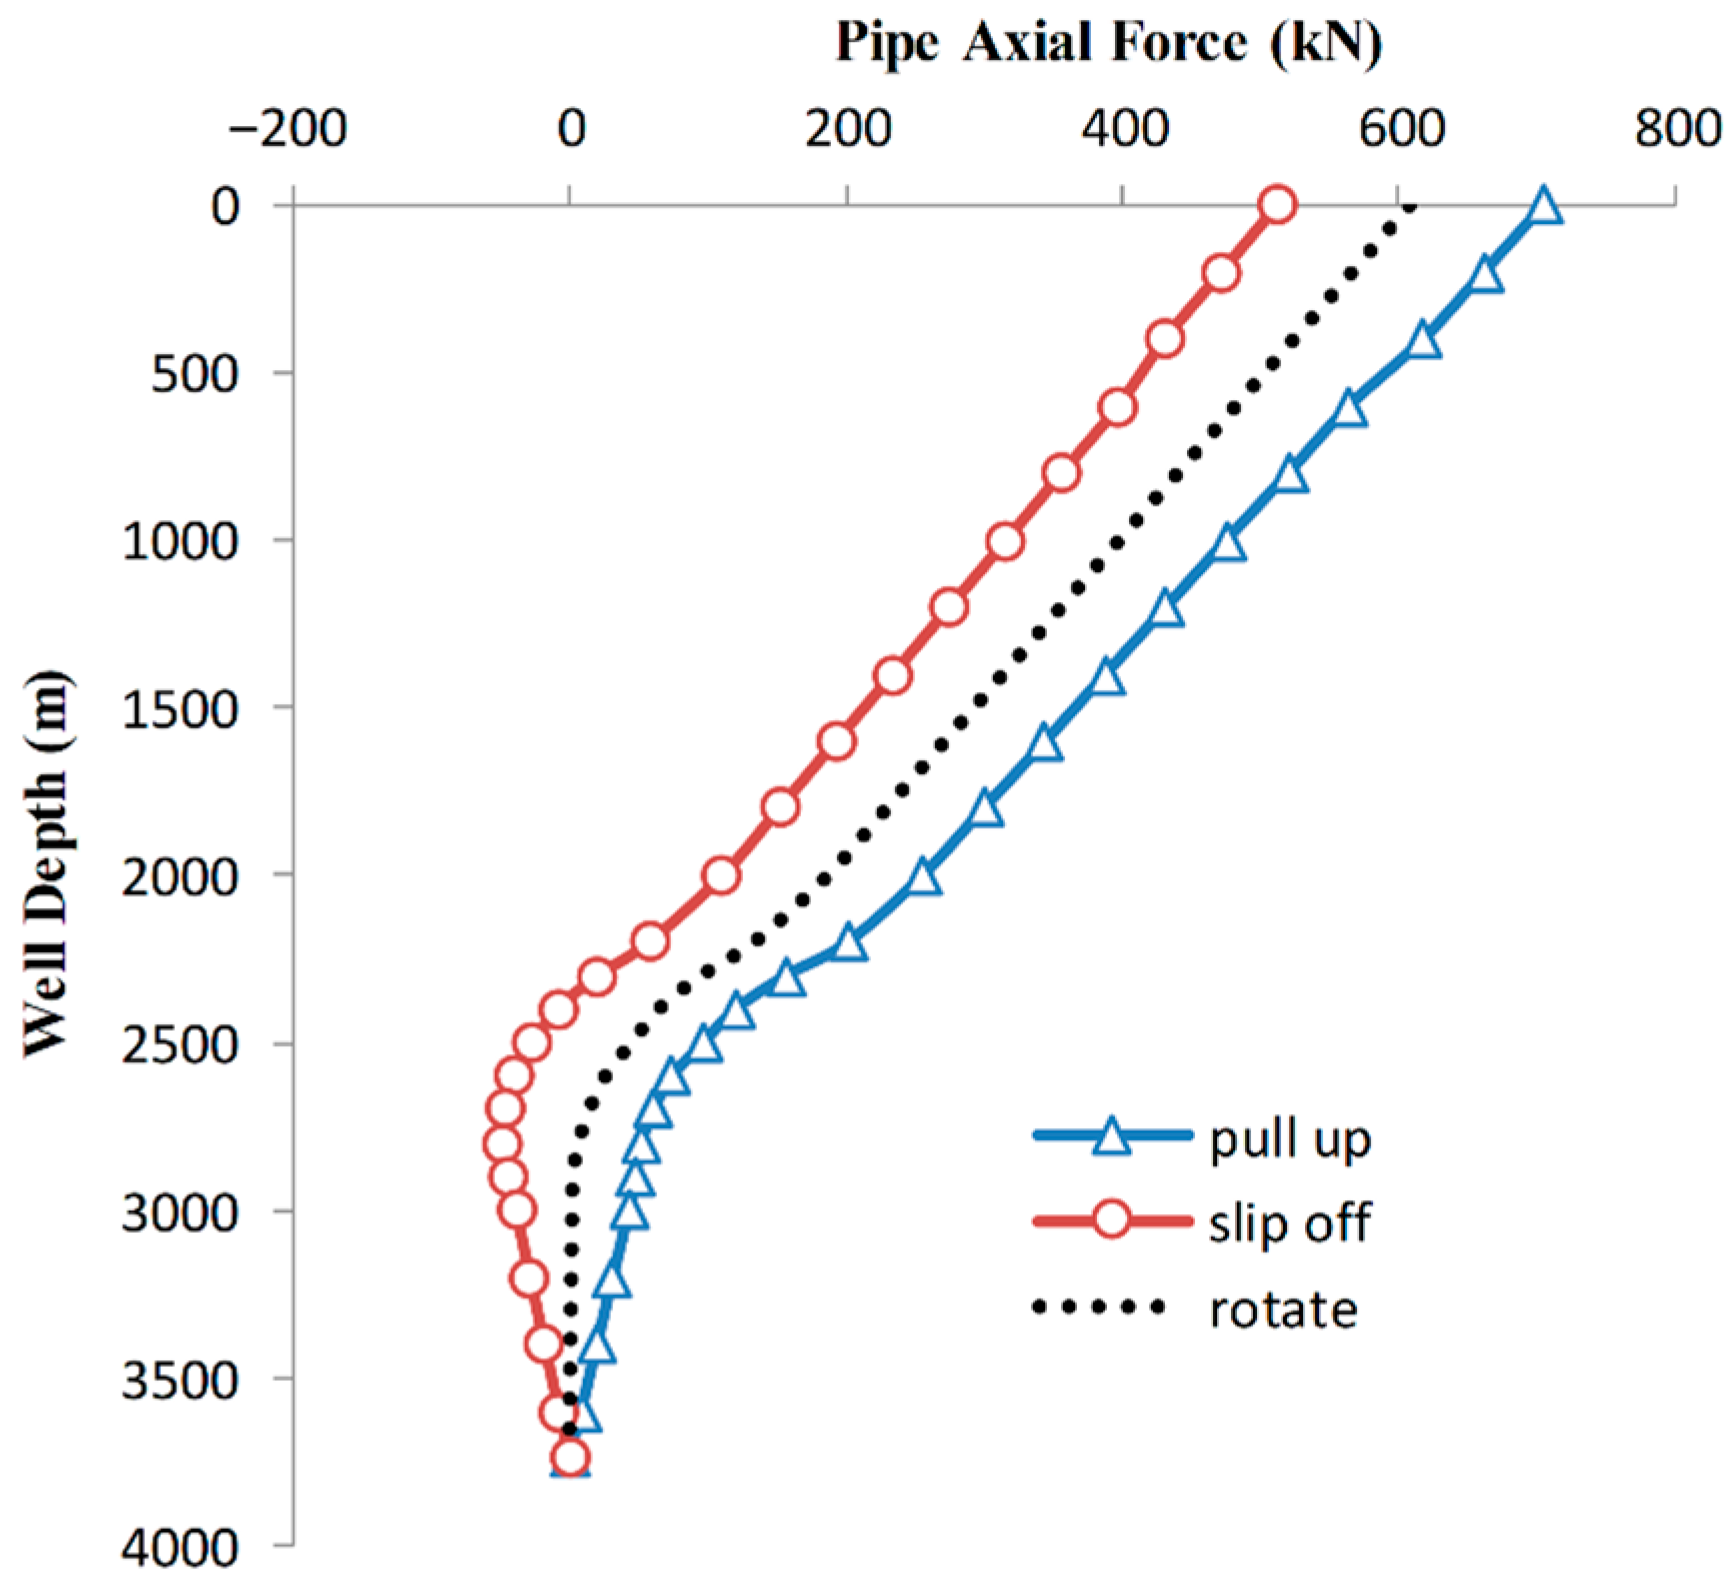
When the string reaches the bottom, the axial force distribution is shown in Figure 5. It can be seen that the maximum axial compressive force occurs around 2700–2800 m, about 50 kN. However, this section is curved, and the string will not be subject to spiral buckling. In the horizontal section, the axial compressive force decreases to about 40 kN. For the 4-1/2” casing, the critical value of spiral buckling is about 220 kN in horizontal wells. Therefore, the string will not buckle.
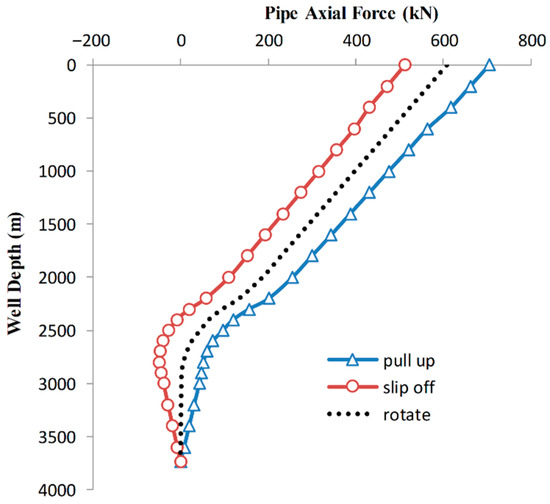
Figure 5.
String axial force distribution.
3.3. Effect of Local Resistance Amplification
It is assumed that the completion string of well S has been run to the bottom. In order to investigate the relationship between the local resistance and the hook load, it is assumed that the string encounters axial resistance of 0 kN, 50 kN, and 100 kN near its bottom. The corresponding hook load variation is shown in Table 2.
Table 2.
Influence of string axial resistance at the bottom on hook load.
In this table, the hook load increases during the pulling-up process, and the hook load decreases during the running-down process when compared to the case of no local resistance. The amplification factor is the ratio of the increase and decrease value to the local resistance value.
The following main features can be obtained:
- (1)
- The resistance at the string bottom is amplified during the upward transmission process;
- (2)
- The amplification factor of the pulling-up process is greater than that of the running-down process;
- (3)
- The larger the local resistance, the larger the amplification factor.
Figure 6 shows the hook load differences between the pull-up process and run-down process under different Fs conditions. As can be seen, Fs = 0 kN means that there is no blocking in the well, and that the calculated hook load is 705.33 kN. If the blocking point resistance is 50 kN, the hook load will be increased by 77.74 kN instead of 50 kN. And if the blocking point resistance is 100 kN, the hook load will be increased by 158.58 kN instead of 100 kN. According to the relationship between the blocking point resistance and the hook load, the amplification factor can be obtained.
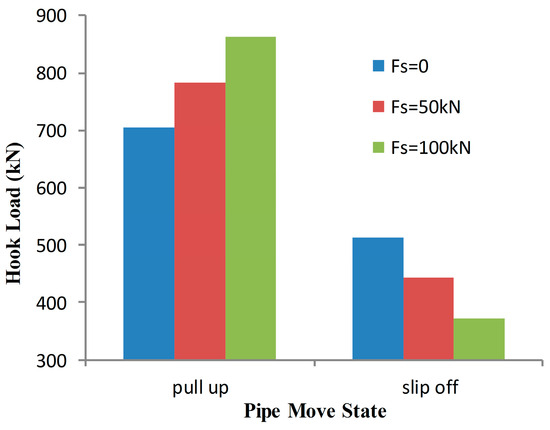
Figure 6.
Hook load comparison when completion string meets axial resistance at the bottom hole.
To study the influence of blocking position on hook load, several blocking point locations were assumed. For Case 1, in which assumes that the blocking point is located in the middle of the kick-off segment and with a depth of 2580 m (1156 m away from the bottom), the corresponding hook load variation is shown in Table 3.
Table 3.
Hook load versus string blocking point at the middle kick-off segment.
For Case 2, in which assumed that the blocking point is located at the beginning of the kick-off segment and with a depth of 2230 m (1506 m away from the bottom), the corresponding hook load variation is shown in Table 4.
Table 4.
Hook load versus string blocking point at the beginning of the kick-off segment.
Table 5 shows the amplification factor changes under different blocking situations. Also, the amplification factor with two blocking point situations is calculated.
Table 5.
The amplification factors under different blocking situations.
The calculation results showed that:
- (1)
- The amplification factor increases as the distance of blocking point from the bottom hole increases;
- (2)
- The amplification factor is affected by the resistance value, position, and other factors;
- (3)
- The axial resistances at different positions have mutual amplification and accumulation effects;
- (4)
- The variation of the hook load caused by two resistances is greater than the sum of hook load variations caused by a single resistance.
4. Discussion
4.1. Hook Load Comparison
The open-hole completion string of this well is equipped with eight external packers, and the running process is smooth. After the string runs into the hole, the hook load of the pull-up and run-down processes are recorded, as shown in Table 6. At the same time, the predicted hook load before the operation is given in the table.
Table 6.
Comparison of recorded and calculated hook load.
When the string is running down, the hook load relative difference is −2.55%, which means that the running operation of the completion string is smooth, and thtt the quality of the well is good. There are no obvious shoulders, no diameter shrinkage, no collapse, and the hole is clean. Furthermore, the design and use of completion mud, wiper trip technology, and completion string are reasonable.
When the string is pulling up, the hook load difference is 6.53%, which indicates the completion string encounters additional resistance; compared to the run-down relative difference, it is shown that the pull-up process will encounter a larger resistance.
During the in-site process of string pull-up and run-down, some of the parameters cannot be accurately obtained, such as the fineness of the wellbore description and the controllability of the construction equipment. Therefore, from the industrial analysis perspective, there will be errors between the recorded data and theoretical analysis results.
4.2. Error Analysis and Resistance Source Judgment
Based on the in-site pigging data (4″ drill pipe and 4″ heavy weight drill pipe, with 1.23 g/cm3 mud density). The well string load limit conditions are 770 kN during pull-up, and 510 kN during run-down, and the calculated friction factors are shown in Table 7.
Table 7.
Comparison of recorded data and calculated results.
The maximum error and average error of the axial force during the pull-up process are −5.21% and −0.40%, respectively. The maximum error and average error of axial force during the run-down process are −2.10% and 0.05%, respectively. All the relative errors between calculated results and in-site limited values are within the range of 10%, which indicates that the calculated values are reliable.
The calculated friction factor is applied to the drilling operation of the double-pigging process and the operation of the completion string. The error between the calculated value and the in-site recorded value is small, indicating that the stability of the mud system is good, which will ensure the smooth running of the completion strings with multiple external packers in the Sadi horizontal wells of Halfaya Oilfield.
The work results were successfully applied and verified, providing a successful experience for the future completion design and construction. Combined with calculation results and analysis, the following experience and guidance are provided:
- (1)
- Use the parameters recorded during drilling to obtain the friction factor of pipe string in the wellbore. Verify it through the pigging string to ensure that the value is reasonable, and then apply it to the friction analysis of the string running operation.
- (2)
- There is an error between the recorded value and the calculated value of the completion string load. Since the completion string cannot be rotated, the specific source of resistance cannot be confirmed, which highlights the importance of the early mud system and well drilling plan. At the same time, it also shows that after the external packer is installed, there is still room for improvement in the calculation of the pulling-up and run-down resistance.
In general, error sources also include the following parts:
- (1)
- In the kick-off section, the contact force between the string and the wellbore is relatively high, which makes it more difficult to conduct the pipe string operation. At the same time, it is difficult to guarantee the smoothness of the curved well section, and the fine description of the whole process is even more difficult.
- (2)
- In the target well interval, the wellbore’s geometry may be down-dipped, horizontal, up-dipped, or even wavy shape. When the target section is down-dipped, it is more difficult to pull the pipe string up than it is to run the string down. Meanwhile, various factors lead to differences in the wellbore cleanliness, which will affect the calculation accuracy.
- (3)
- The pipe string structure, such as the completion pipe strings, is equipped with multiple packers, centralizers, and other tools. On the one hand, it changes the bending stiffness of pipe string, and on the other hand, it is also extremely sensitive to micro-steps and cuttings beds on the wellbore.
- (4)
- Rotary run-down casing, floating run-down casing, and other processes can reduce friction while increasing the difficulty of calculating accuracy.
5. Conclusions
The proposed model focuses on dealing with multiple resistances of different points of the completion string. This model makes up for the technical defect of some common software, such as Landmark. It is suitable for the simulation of the casing running process with multiple external packers. Through the change in hook load, blocking position, and resistance character, the resistance value can be estimated more accurately.
Based on the case study of a horizontal open hole completion string from the low permeability Sadi reservoir of Halfaya Oilfield, Iraq, the following conclusions are obtained:
- The string resistance at the horizontal section will be amplified during the pulling-up process;
- The amplification factor is larger during the pulling-up process than during the running-down process;
- The larger the local resistance, the larger the amplification factor;
- The amplification factor is affected by resistance value, position, and other factors;
- The axial resistances at different positions have mutual amplification and accumulation effects;
- The change in hook load caused by both resistances is greater than the sum of hook load changes caused by a single resistance.
Author Contributions
Conceptualization, Z.N. and B.W.; methodology, Z.N. and S.S.; formal analysis, Z.N. and S.S.; resources, X.H. and B.W.; data curation, X.H.; writing—original draft preparation, Z.N. and S.S.; writing—review and editing, X.H. All authors have read and agreed to the published version of the manuscript.
Funding
This work was supported by the Major Science and Technology Project of PetroChina (2023ZZ19-06).
Data Availability Statement
Not applicable.
Conflicts of Interest
The authors declare no conflict of interest. The data presented in this study are available on request from the corresponding author. Some of the data are not publicly available due confidentiality issues relating to the oilfield policy.
References
- Sheppard, M.C.; Wick, C.; Burgess, T. Designing Well Paths to Reduce Drag and Torque. SPE Drill. Eng. 1987, 2, 344–350. [Google Scholar] [CrossRef]
- Helmy, M.W.; Khalaf, F.; Darwish, T. Well design using computer model. SPE Drill. Complet. 1998, 13, 42–46. [Google Scholar] [CrossRef]
- Lietard, O.; Ayoub, J.; Pearson, A. Hydraulic Fracturing of Horizontal Wells: An Update of Design and Execution Guidelines. In Proceedings of the International Conference on Horizontal Well Technology, Calgary, AB, Canada, 18–20 November 1996. [Google Scholar]
- Thomson, D.W.; Nazroo, M.F. Design and Installation of a Cost-Effective Stimulation Completion System for Horizontal Chalk Wells Where Multiple Zones Require Acid. SPE Drill. Complet. 1998, 13, 151–156. [Google Scholar] [CrossRef]
- Mcdaniel, B.W. Review of Current Fracture Stimulation Techniques for Best Economics in Multilayer, Low-Permeability Reservoirs. In Proceedings of the SPE Eastern Regional Meeting, Morgantown, WV, USA, 14–16 September 2005. [Google Scholar]
- Dees, J.M.; Freet, T.G.; Hollabaugh, G.S. Horizontal Well Stimulation Results in the Austin Chalk Formation, Pearsall Field, Texas. In Proceedings of the SPE Annual Technical Conference and Exhibition, New Orleans, LA, USA, 23–26 September 1990. [Google Scholar]
- Thomas, R.L.; Milne, A. The Use of Coiled Tubing during Matrix Acidizing of Carbonate Reservoirs. In Proceedings of the SPE Asia Pacific Oil and Gas Conference, Kuala Lumpur, Malaysia, 20–22 March 1995. [Google Scholar]
- Norris, M.R.; Berntsen, B.A.; Skartveit, L.; Teesdale, C. Multiple Proppant Fracturing of Horizontal Wellbores in a Chalk Formation: Evolving the Process in the Valhall Field. In Proceedings of the European Petroleum Conference, The Hague, The Netherlands, 20–22 October 1998. [Google Scholar]
- Mc Daniel, B.W.; Willett, R.M. Stimulation Techniques for Low-Permeability Reservoirs with Horizontal Completions That Do not Have Comented Casing. In Proceedings of the SPE Gas Technology Symposium, Calgary, AB, Canada, 30 April–2 May 2002. [Google Scholar]
- East, L.; Willett, R.; Surjaatmadja, J.; McDaniel, B.W. Application of New Fracturing Technique Improves Stimulation Success for Openhole Horizontal Completions. In Proceedings of the SPE International Symposium and Exhibition on Formation Damage Control, Lafayette, LA, USA, 18–20 February 2004. [Google Scholar]
- Granger, M.J.; Stickling, R.W.; E1-Rabaa, A.M.; Ortez, Y.P. Horizontal Well Applications in the Guymon-Hugoton Field: A Case Study. In Proceedings of the SPE Gas Technology Symposium, Calgary, AB, Canada, 28 April–1 May 1996. [Google Scholar]
- Wang, Y. Analysis and Research on Downhole Ability of Completion String of Horizontal Well; China University of Petroleum (East China): Dongying, China, 2008. [Google Scholar]
- Su, H.; Xie, Q. Study on completion technology of horizontal wells in oil fields. China Pet. Chem. Stand. Qual. 2019, 14, 215–216. [Google Scholar]
- Jia, J. Study on completion technology of horizontal well in new buried hill reservoir. Tech. Superv. Pet. Ind. 2019, 35, 10–13. [Google Scholar]
- Pershin, I.M.; Papush, E.G.; Kukharova, T.V.; Utkin, V.A. Modeling of Distributed Control System for Network of Mineral Water Wells. Water 2023, 15, 2289. [Google Scholar] [CrossRef]
- Kazanin, O.I.; Sidorenko, A.A.; Sidorenko, S.A.; Ivanov, V.V.; Mischo, H. High productive longwall mining of multiple gassy seams: Best practice and recommendations. Acta Montan. Slovaca 2022, 27, 152–162. [Google Scholar]
- Yuan, D.; Sun, H.; Li, Y.; Zhang, M.; Chi, X.; He, X. Multi-Stage Fractured Tight Gas Horizontal Well Test Data Interpretation Study. In Proceedings of the International Petroleum Technology Conference, Beijing, China, 26–28 March 2013. [Google Scholar]
- Wang, D.; Sun, J.; Li, Y.; Peng, H. An efficient hybrid model for nonlinear two-phase flow in fractured low-permeability reservoir. Energies 2019, 12, 2850. [Google Scholar] [CrossRef]
- Zhang, X.; Jiang, T.; Ye, C. Study on Optimization of Running Technology of Open Hole Fracturing String in Horizontal Well. Inn. Mong. Petrochem. Ind. 2014, 10, 123–124. [Google Scholar]
- Franco, C.; Solares, R.; Marri, H.; Hussain, H. The Use of SatgeFrac New Technology to Complete and Stimulate Horizontal Wells: Field Case. In Proceedings of the SPE Saudi Arabia Section Technical Symposium, Al-Khobar, Saudi Arabia, 10–12 May 2008. [Google Scholar]
- Boyun, G.; Rashid, S. An Analytical Model for Axial Force Transfer and the Maximum Compression Point of Work Strings in Extend Reach Drilling. Insights Min. Sci. Technol. 2020, 2, 555592. [Google Scholar]
- Mitchell, R.F. Effects of Well Deviation on Helical Buckling. SPE Drill. Complet. 1997, 12, 1–24. [Google Scholar] [CrossRef]
- Wu, J. Drill-Pipe Bending and Fatigue in Rotary Drilling of Horizontal Wells. In Proceedings of the SPE Eastern Regional Meeting, Columbus, OH, USA, 23–25 October 1996. [Google Scholar]
- Zhao, J. Calculation of drill string friction in horizontal well. Pet. Drill. Prod. Technol. 1995, 17, 6–11. [Google Scholar]
- Wang, J. Analytical analysis of contact friction resistance of drill string in horizontal well. Pet. Mach. 1995, 23, 44–50. [Google Scholar]
- Ma, S. Calculation of friction and friction moment of drill string in horizontal well. J. Pet. Univ. Nat. Sci. Ed. 1996, 20, 24–28. [Google Scholar]
- Han, Z. Calculation of axial force and strength check of bending drill string. Pet. Drill. Technol. 1996, 24, 7–12. [Google Scholar]
- Zu, F. Prediction and application of drill string friction in directional wells. Pet. Drill. Prod. Technol. 2001, 23, 9–11. [Google Scholar]
- Chen, H. Analysis of lateral force between casing string and drill string. Nat. Gas Ind. 2001, 21, 63–65. [Google Scholar]
- Lubinski, A. Advances in Drilling Engineering; Petroleum Industry Press: Beijing, China, 1994; Volume 1, pp. 248–249. [Google Scholar]


Disclaimer/Publisher’s Note: The statements, opinions and data contained in all publications are solely those of the individual author(s) and contributor(s) and not of MDPI and/or the editor(s). MDPI and/or the editor(s) disclaim responsibility for any injury to people or property resulting from any ideas, methods, instructions or products referred to in the content. |
© 2023 by the authors. Licensee MDPI, Basel, Switzerland. This article is an open access article distributed under the terms and conditions of the Creative Commons Attribution (CC BY) license (https://creativecommons.org/licenses/by/4.0/).