Article

Judgment Basis and Mechanical Analysis of Current Collector Failure in the Winding Process of a Lithium-Ion Battery

1
School of Mechanical Engineering, Taiyuan University of Science and Technology, Taiyuan 030024, China
2
School of Energy and Materials Engineering, Taiyuan University of Science and Technology, Jincheng 048000, China
*
Author to whom correspondence should be addressed.
Processes 2023, 11(9), 2629; https://doi.org/10.3390/pr11092629
Submission received: 19 July 2023 / Revised: 15 August 2023 / Accepted: 1 September 2023 / Published: 3 September 2023

Abstract

:
The winding process is one of the essential processes in the manufacturing of lithium-ion batteries (LIBs). Current collector failure frequently occurs in the winding process, which severely increases the production cost and reduces production efficiency. In order to solve this problem, we first analyze the relationship between different process parameters and the failure of the current collector, and put forward the standard to determine the failure of the current collector. Moreover, we conducted tensile experiments to validate the differences in the mechanical performance of the current collector under different thicknesses. Finally, the circumferential stress and strain of the current collector winding were calculated using finite element analysis. The accuracy of the proposed criterion for determining current collector failure was verified through experimental measurements of stress and strain. The results demonstrate that the criterion proposed in this study can accurately calculate the maximum stress during the current collector winding process, providing a powerful tool for addressing the issue of current collector failure in the winding process.

Graphical Abstract

1. Introduction

A lithium-ion battery (LIB) is a rechargeable secondary battery, also known as a rocking chair battery, which has the advantages of a high working voltage, high specific energy, a long cycle life, no memory effect, and no pollution [1,2,3,4]. With the rapid development of electric vehicles, the market demands more and more mileage and safety of electric vehicles. As the main energy storage device of electric vehicles, there are higher requirements for the performance of lithium batteries [5,6,7,8]. Due to the variations in the initial tension, thickness, and winding curvature radius of current collectors during the manufacturing process of lithium-ion batteries, failures in winding frequently occur. To address this issue, production factories commonly use experimental methods to determine the process parameters during the winding process. However, in practical production processes, the electrode requires multiple winding operations, such as coating, rolling, and slitting. This significantly increases production costs and reduces production efficiency [9,10]. Therefore, there is an urgent need to develop a method that can accurately predict the failure of battery current collectors. This is of significant importance in improving battery production efficiency and reducing production costs.
In recent years, much of the research has focused on the overall performance of batteries. Wenwei Wang et al. [11] conducted research on the mechanical behavior of cylindrical LIBs under dynamic loads using finite element analysis. This study focused on assessing the impact resistance of LIBs in collision accidents by proposing a constitutive model. Shengxin Zhu et al. [12] employed an in situ internal deformation measurement method to analyze the circumferential strain of LIBs and variations in internal pressure during battery charging and discharging processes. They proposed a calculation method for internal pressure based on circumferential strain. Lubing Wang et al. [13] performed finite element modeling of cylindrical batteries to predict internal short circuits under mechanical abuse conditions. Short circuit criteria were established, considering four typical loading conditions, and the relationship between the mechanical model and electrochemical short circuits was determined. Jun Xu et al. [14] developed a numerical mechanical model that describes the nonlinear structure and component materials of LIBs, as well as hazardous experimental conditions. Through impact tests with heavy objects, they demonstrated that the model is capable of predicting the dynamic response of LIBs. Keshavarzi, M. M. et al. [15] conducted an analysis of the deformation and failure mechanisms of LIBs under collision scenarios. They utilized material characterization and a single homogeneous finite element model to make predictions regarding factors such as load displacement, deformation shape, and failure in complex scenarios. This research provides a strong foundation for the safety assessment of LIBs. Breitfuss et al. [16] developed a detailed layered model for LiMn2O4/graphite pouch cells. They validated each layer’s model based on tensile experiments and then constructed a complete cell model. Lai et al. [17] presented the mechanical response of their self-made dry-type LIBs (LiFePO4/graphite). Meanwhile, Ali et al. [18] developed a detailed layered model for lithium-ion battery single-cell representative volume element (RVE) samples under quasi-static compressive loads using ABAQUS/explicit. They characterized the mechanical properties of the components through tensile experiments, in-plane constrained compression experiments, and mixture laws.
Many researchers have also conducted studies on the mechanical aspects of electrodes Yaoxing Chen et al. [19] analyzed the thin film size effect, diffusion-induced stresses, plastic yield, and hardening of electrode materials by establishing an elastic–plastic model based on lithium concentration evolution. They combined the strain gradient plasticity theory to analyze the size effect, interface damage, and delamination characteristics of electrode slurries. De Vasconcelos, L. S. et al. [20] employed nanoindentation to measure the in situ mechanical behavior of cathode electrodes and evaluated the mechanical performance of current collectors immersed in electrolyte with varying porosity. This study provided a basis for chemical-mechanical models of LIBs. Nakanishi, S. et al. [21] investigated the influence of aluminum foil surface morphology on the performance of Li-ion batteries, finding that optimizing both the foil surface and active material particle size can improve battery performance, particularly for low-conductivity LiFePO4 active materials. Van Bommel, A. et al. [22] performed a clean wipe of the LiFePO4 slurry on the cathode surface and observed surface damage on the cathode current collector through scanning electron microscopy imaging. The results demonstrated that mechanical performance declined when the rolled cathode current collector surface exhibited indentation. Zhou, S. G. et al. [23] presented a modified current collector that improved the physical contact between the current collector and the active material. This enhancement led to improved cycle stability of the battery. Ran Tao et al. [24] conducted a study on the evolution and distribution mechanism of fracture failure in current collectors during the winding process of lithium-ion battery electrodes, focusing on the circumferential strain. They proposed criteria for assessing the strength of current collectors. Their research has made significant contributions to understanding current collector failure, particularly in exploring the mechanical properties between the collector and the slurry. However, it does not establish a direct correlation between process parameters and current collector failure.
This paper investigates the relationship between different process parameters during the winding process and current collector failure. This paper proposes a novel criterion for assessing current collector failure. The specific details are as follows: (1) This study establishes the relationship between current collector failure and parameters such as initial tension, winding curvature radius, and current collector thickness. Furthermore, a criterion for determining current collector failure is proposed. (2) A finite element model of the winding process was established. Stress values of the circumferential strain evolution process were measured through experimental methods. The proposed criterion for determining collector failure in this paper was validated using these measurements. (3) Tensile tests were conducted on collector samples with different thicknesses to determine the yield strength. The relationship between collector thickness and yield strength was obtained from these experiments.

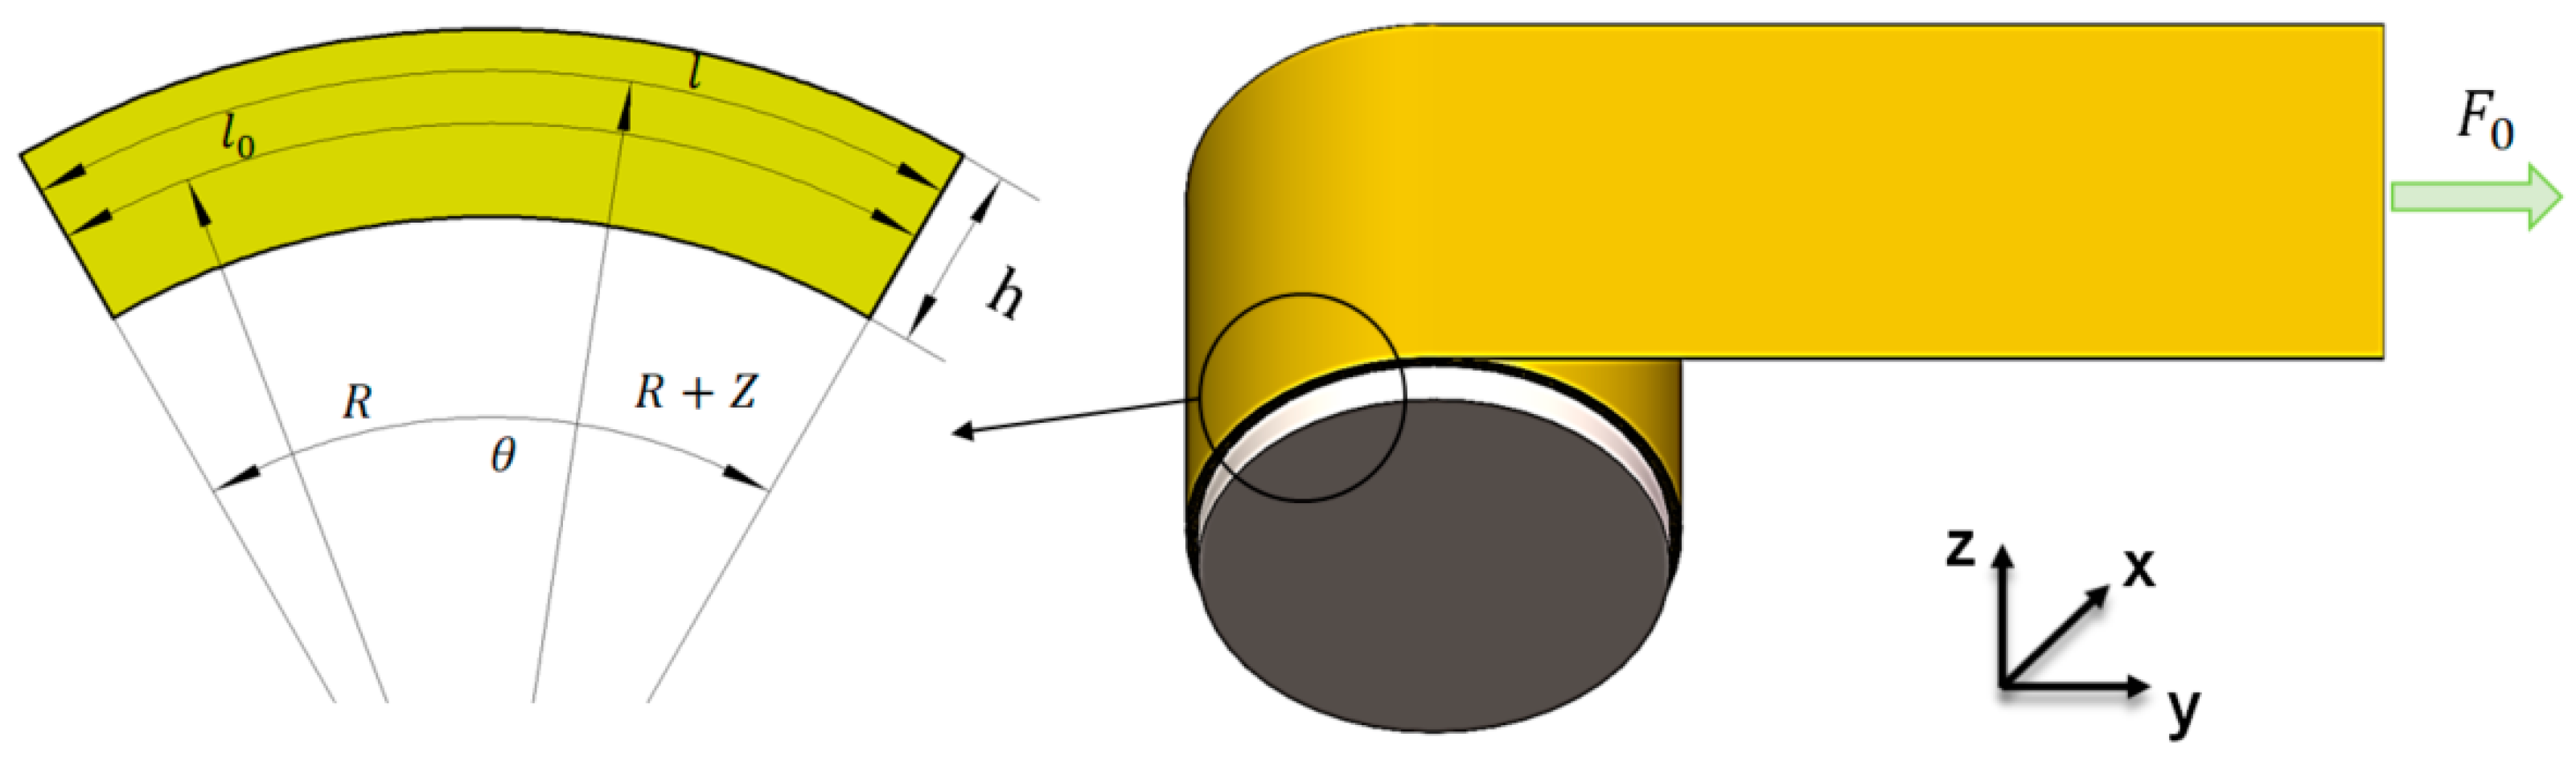
2. The Criterion for Determining Current Collector Fracture Failure

In the manufacturing process of LIB electrodes, aluminum foil is used as the current collector for the positive electrode, while copper foil is used for the negative electrode. Assuming a uniform distribution of stress along the axial force of the winding roller during the winding process, the analysis of the current collector’s stress can be simplified as a two-dimensional problem in any radial plane of the winding roller. As depicted in Figure 1, during the winding process, the current collector experiences an initial tension force F 0 in the tangential direction of the winding roller.
Based on the initial tension force F 0 , the stress experienced by the current collector can be calculated as follows:
σ a = F 0 A
where F 0 is the initial tension force, A is the cross-sectional area in the stretching direction, and σ a is the stress in the stretching direction. As shown in Figure 1, when the current collector is bent, it experiences bending stress, with the outer normal direction of the neutral layer l 0 subjected to tension and the inner normal direction subjected to compression. In the absence of bending, the neutral layer is located at half the thickness of the current collector. After bending, the neutral layer undergoes displacement. However, due to the thinness of the current collector in batteries, the change in thickness during bending is negligible, and the ratio of bending radius to plate thickness is typically greater than 4–6 [25]. Therefore, the issues of thinning due to bending and displacement of the neutral layer are neglected, and the neutral layer is approximated to overlap with the intermediate layer. Assuming no change in the length of the neutral layer in the y-direction, and with the bending angle θ and bending radius R, the formula for bending strain is as follows:
ε b = l l 0 l 0 = θ R + Z θ R θ R = θ Z θ R = Z R
where ε b is the strain in the bending direction, l 0 is the arc length of the neutral layer, and l is the arc length. Assuming the thickness of the current collector is h and the radius of curvature of the winding roller is ρ , let Z = h / 2 and R = ρ + 0 . 5   h , the formula for bending strain is as follows:
ε b = Z R = h 2 ( ρ + 0 . 5   h )
The relationship between bending strain, winding roll radius, and current collector thickness leads to the calculation of bending stress.
σ b = Eh 2 ( ρ + 0 . 5   h )
where E represents the elastic modulus of the current collector. By superimposing the stress generated from the bending of the current collector, denoted as σ b , and the stress induced by the initial tension F 0 , represented as σ a , we arrive at the following relationship:
σ = σ a + σ b = F 0 A + Eh 2 ( ρ + 0 . 5   h )
During the winding process, the current collector experiences centrifugal force, which can be calculated using the following formula:
σ c = qv 2 A
where q is the mass per unit length of the current collector, and v is the winding linear velocity of the current collector. Therefore, the maximum stress generated during the winding process can be expressed as:
σ max = σ + σ c
Since the centrifugal tensile stress is related to the winding linear velocity v and the mass per unit length q of the current collector, and considering that the mass of the current collector itself is very small, it can be approximately assumed that:
σ max     σ
Based on the above reasoning and analysis, a relationship is established between the stress generated in the current collector during the winding process and the initial tension force F 0 , collector thickness h , and winding roller curvature radius ρ . In order to ensure the safe and proper winding of the current collector, it is necessary to ensure that the maximum stress generated during this process, σ max , remains below the yield limit of the current collector material. Consequently, we consider the yield limit as the permissible stress [ σ ] for the collector. In other words:
σ max     [ σ ]
During the electrode manufacturing process, which involves a rolling process, the particulate nature of the battery slurry can cause the embedding of active materials into the current collector. As a result, the mechanical performance of the current collector is degraded, and the allowable stress is reduced to approximately 0.7 times of its original value [24]. Therefore, we have the following relationship:
σ max     0 . 7 [ σ ]

3. Finite Element Analysis

Finite element simulation software ABAQUS2022 was employed to model the winding curvature roller and the current collector, due to the extremely thin nature of the current collector, it was represented using deformable shell elements. The S4R type mesh was used for modeling, with the current collector measuring 30 mm in length and 10 mm in width. In the simulation, the winding curvature radii for copper foil were set at 11 mm, 15 mm, and 20 mm, with corresponding thicknesses of 0.01 mm, 0.03 mm, and 0.05 mm, and initial tensions of 0.2 MPa and 20 MPa. For aluminum foil, the winding curvature radius was 20 mm, thickness was 0.017 mm, and initial tension was 0.2 MPa. It is important to note that the winding curvature radius of the current collector is equivalent to the winding roller radius.
As shown in Figure 2, in the simulation setup, the winding roller was initially constrained to remain stationary. One end of the current collector was bound to the winding roller, while the other end was subjected to a load applied as an initial tension along the direction of the current collector. After applying the initial tension for 3 s, the axial rotational degree of freedom of the winding roller was released, and it started rotating at a speed of 0.5 radians per second. The rotation was stopped at the fifth second, and both ends of the current collector were fixed. A hard contact with a friction coefficient of 0.15 was established between the current collector and the winding roller.
Additionally, the following assumptions were made: (1) Due to the negligible mass of the current collector, its impact on simulation results is minimal. Therefore, inertial forces were assumed to have negligible effect on the current collector winding. (2) The effects of forces from the winding roller on the current collector were minimal, and considering our focus on the mechanical performance of the current collector, the winding roller was treated as a rigid body. (3) Temperature effects were assumed to have negligible impact on the winding simulation.
Due to the size effect of the current collector, the mechanical performance parameters vary with different thicknesses. In this research, tensile experiments on collectors with different thicknesses were conducted to provide more reliable mechanical performance parameters, and the performance parameters are shown in Table 1. Due to the fact that the elastic modulus is an intrinsic property of the material and does not change with variations in thickness, the slight differences in elastic modulus may be attributed to experimental errors.

4. Experimental Testing Method

4.1. Tensile Testing of Lithium-Ion Battery Current Collectors

Due to the influence of scale effect, the mechanical properties of traditional copper and aluminum are not consistent with those of the current collector. Tensile experiments were conducted on the current collector to obtain the mechanical performance parameters of the current collector.
Experimental samples were prepared, including copper foils with thicknesses of 0.01 mm, 0.03 mm, and 0.05 mm, as well as aluminum foil with a thickness of 0.017 mm. Three samples were prepared for each type of current collector. Following the standard tensile test method for metal foils, the materials were shaped into standard tensile test samples with a specimen width of 12.5 mm, original gauge length of 50 mm, and total length of 130 mm. To remove burrs and microcracks, the edges of the experimental samples were polished using sandpaper. Due to the extreme thinness of the samples, during sample fabrication, multiple experimental samples were overlapped and sandwiched between two metal plates for polishing. The SHIMADZU AGS-X tensile testing machine was used to conduct the tensile tests on the experimental samples. Parameters such as the current sample’s width, gauge length, and overall length were input before the tensile test. Due to the potential damage caused by serrated fixtures, flat fixtures were used in the experiment. To prevent slippage between the experimental samples and the testing machine’s fixtures during the tensile test, a layer of filter paper was inserted between the sample and the fixture. Figure 3 illustrates the physical parameters of the experimental samples, the testing apparatus, and the experimental samples after the tensile fracture.

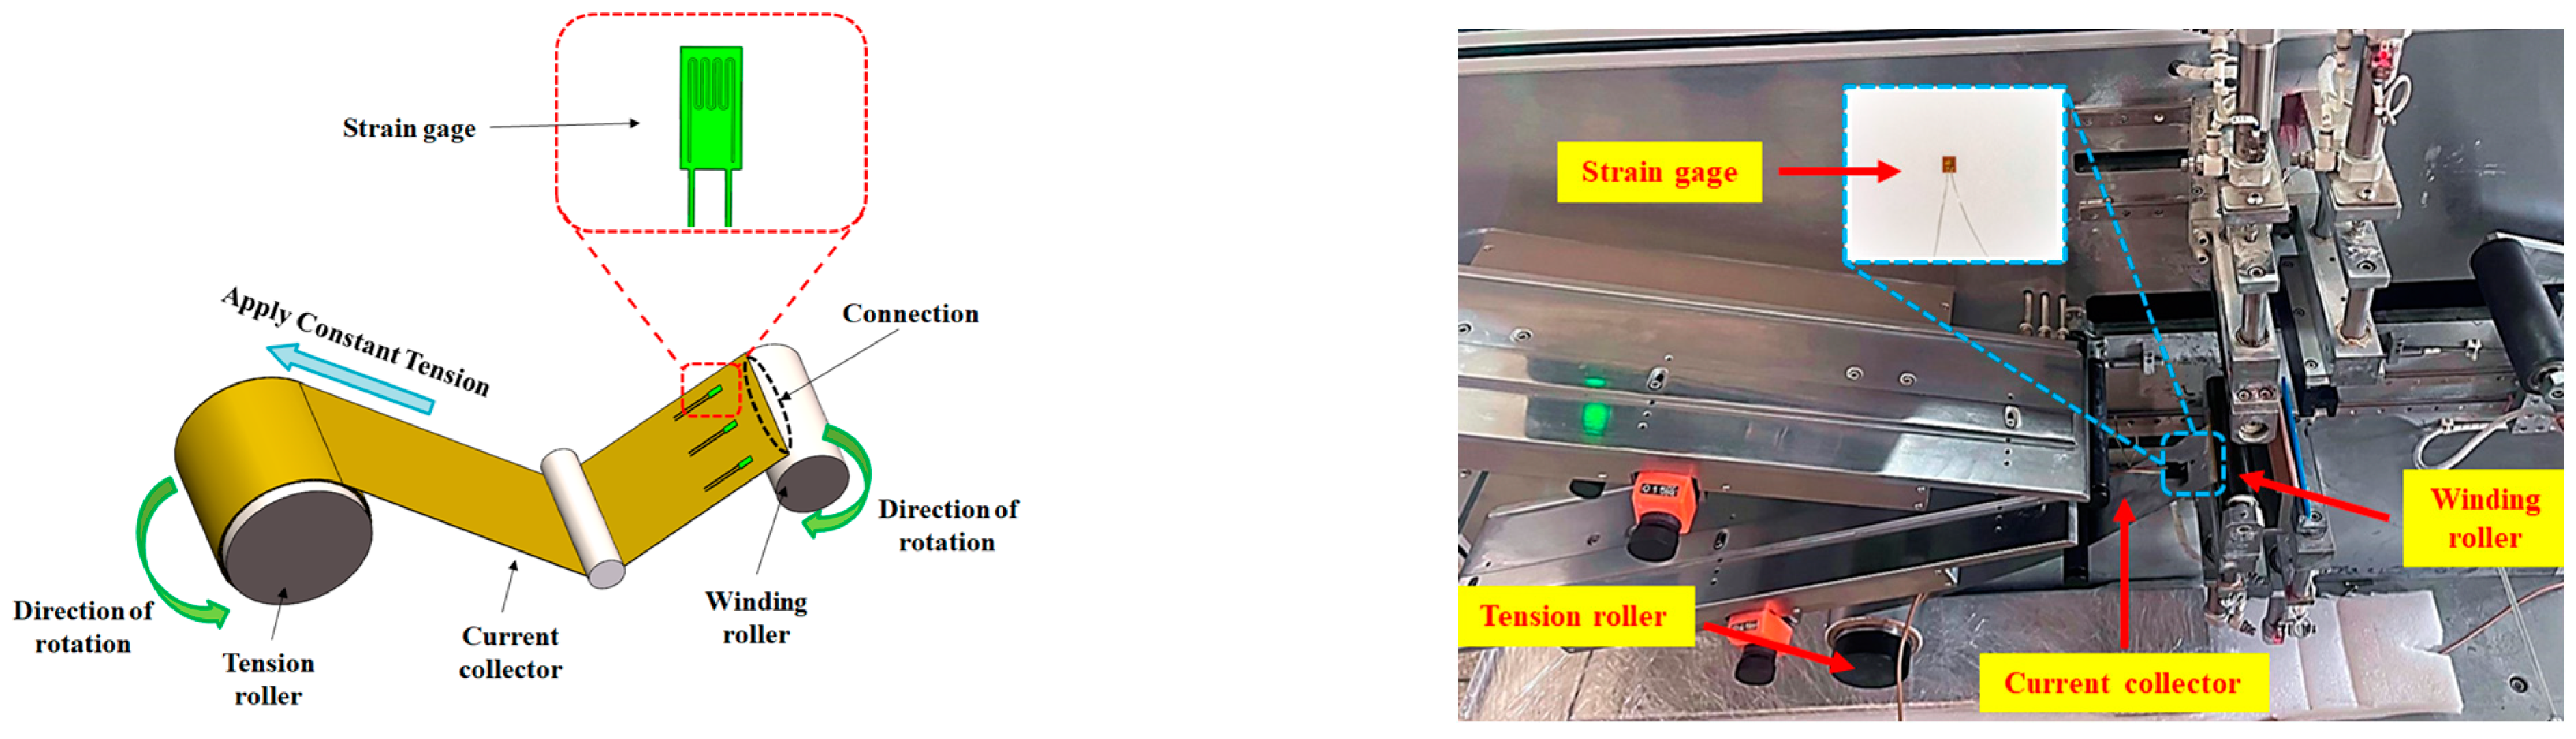
4.2. Winding Stress Testing of Lithium-Ion Battery Current Collectors

Figure 4 illustrates the winding experiment process. The experiment utilized the DH5922D stress–strain testing system and DHDAS software to collect the strains generated during the winding process of the current collector. The current collector was wound using the MSK-112A-E lithium-ion battery winding machine, equipped with tension rollers to provide a constant tension. One end of the copper foil was secured to the winding roller with adhesive tape, while a constant tension was applied to the other end by the winding roller. The winding roller was then rotated at a uniform and gradual speed. Strain gauges were attached to the outer surface of the current collector. The experiment involved combinations of different thicknesses, roller diameters, and initial tensile stresses. Each parameter combination was tested three times, with experimental parameters detailed in Table 2.
Research has found that during horizontal stretching of a current collector, when a strain gauge is attached to the current collector, the deformation of the current collector is equal to the deformation of the strain gauge [24]. Therefore, the measured strain values are accurate, as shown in Figure 5a. When the collector is wound onto the winding roller, the outer surface of the collector experiences both tensile and bending strains simultaneously. The bending strain generated on the outer surface of the actual substrate is greater than the bending strain on the surface of the current collector, as illustrated in Figure 5b. As a result, the strain measured during winding is higher than the strain generated on the outer surface of the current collector. Therefore, during the winding process, it is necessary to correct the circumferential strain measured by the strain gauge. Hence, we have the following relationship:
R + h + a R + h = l ε c + l l ε d + l
where R is the radius of the winding roller; h is the thickness of the current collector; a is the thickness of the strain gauge substrate; ε c is the measured strain value from the strain gauge; ε d is the corrected strain value; l is the length of the strain gauge. Therefore, the actual strain value should be calculated as follows:
ε c = ( R + h ) ( 1 + ε s ) R + h + a     1
Figure 6 depicts the variation in strain in the current collector over time under different initial tensions, curvature radii, and thickness conditions. The graph also displays three types of strain: corrected, uncorrected, and finite element analysis. From Figure 6, it is evident that the maximum stress values obtained from the corrected curves closely align with those obtained from the simulation calculations.

5. Analysis and Discussion

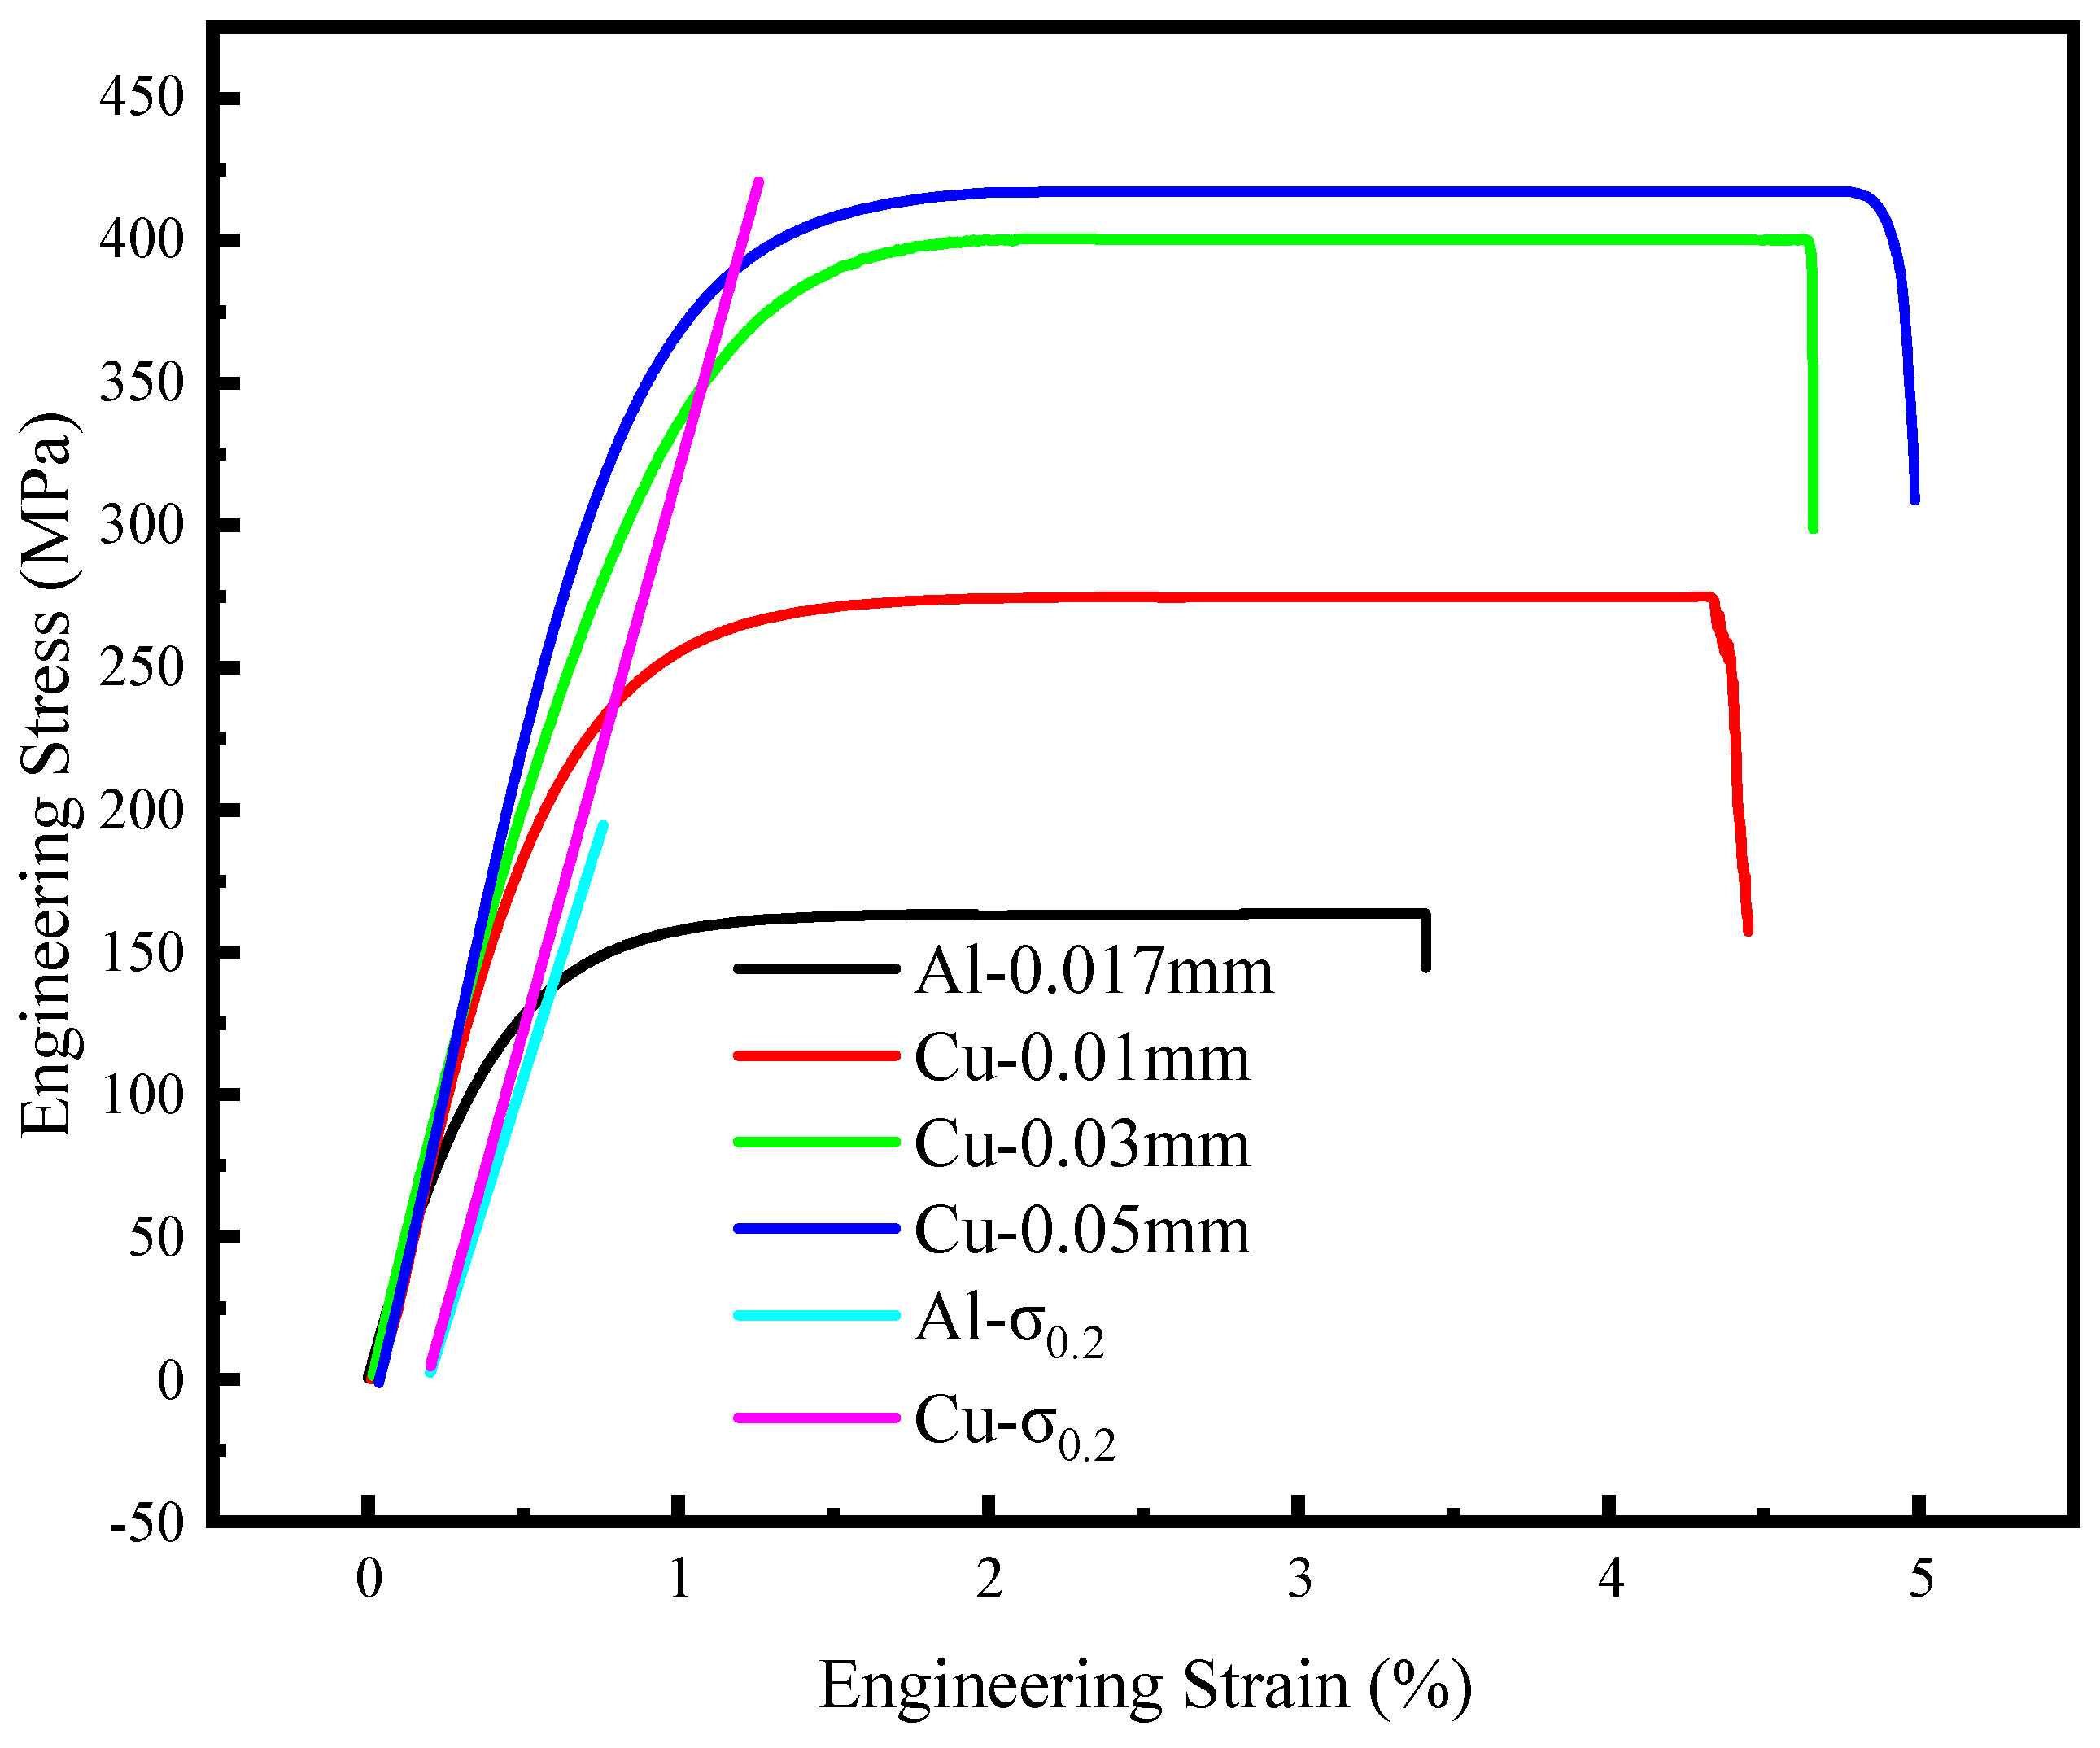
5.1. Analysis and Discussion of Tensile Experiment

Figure 7 shows the engineering stress–strain curve obtained from experiment, where the intersection of the σ 0.2 line with the curve represents the material’s yield strength. From Figure 7, it can be observed that different thicknesses of copper foils result in different yield strengths. Therefore, it can be concluded that the thickness of the current collector significantly influences its yield strength. In comparison to aluminum foils, copper foils generally exhibit higher stress values at the yield strength. Hence, in the manufacturing process of a single electrode, the yield strength of the current collector should be determined by the thickness used during manufacturing. However, in the process of manufacturing battery cells, where positive and negative electrodes overlap and are wound together, special attention should be given to current collectors with lower yield strength.

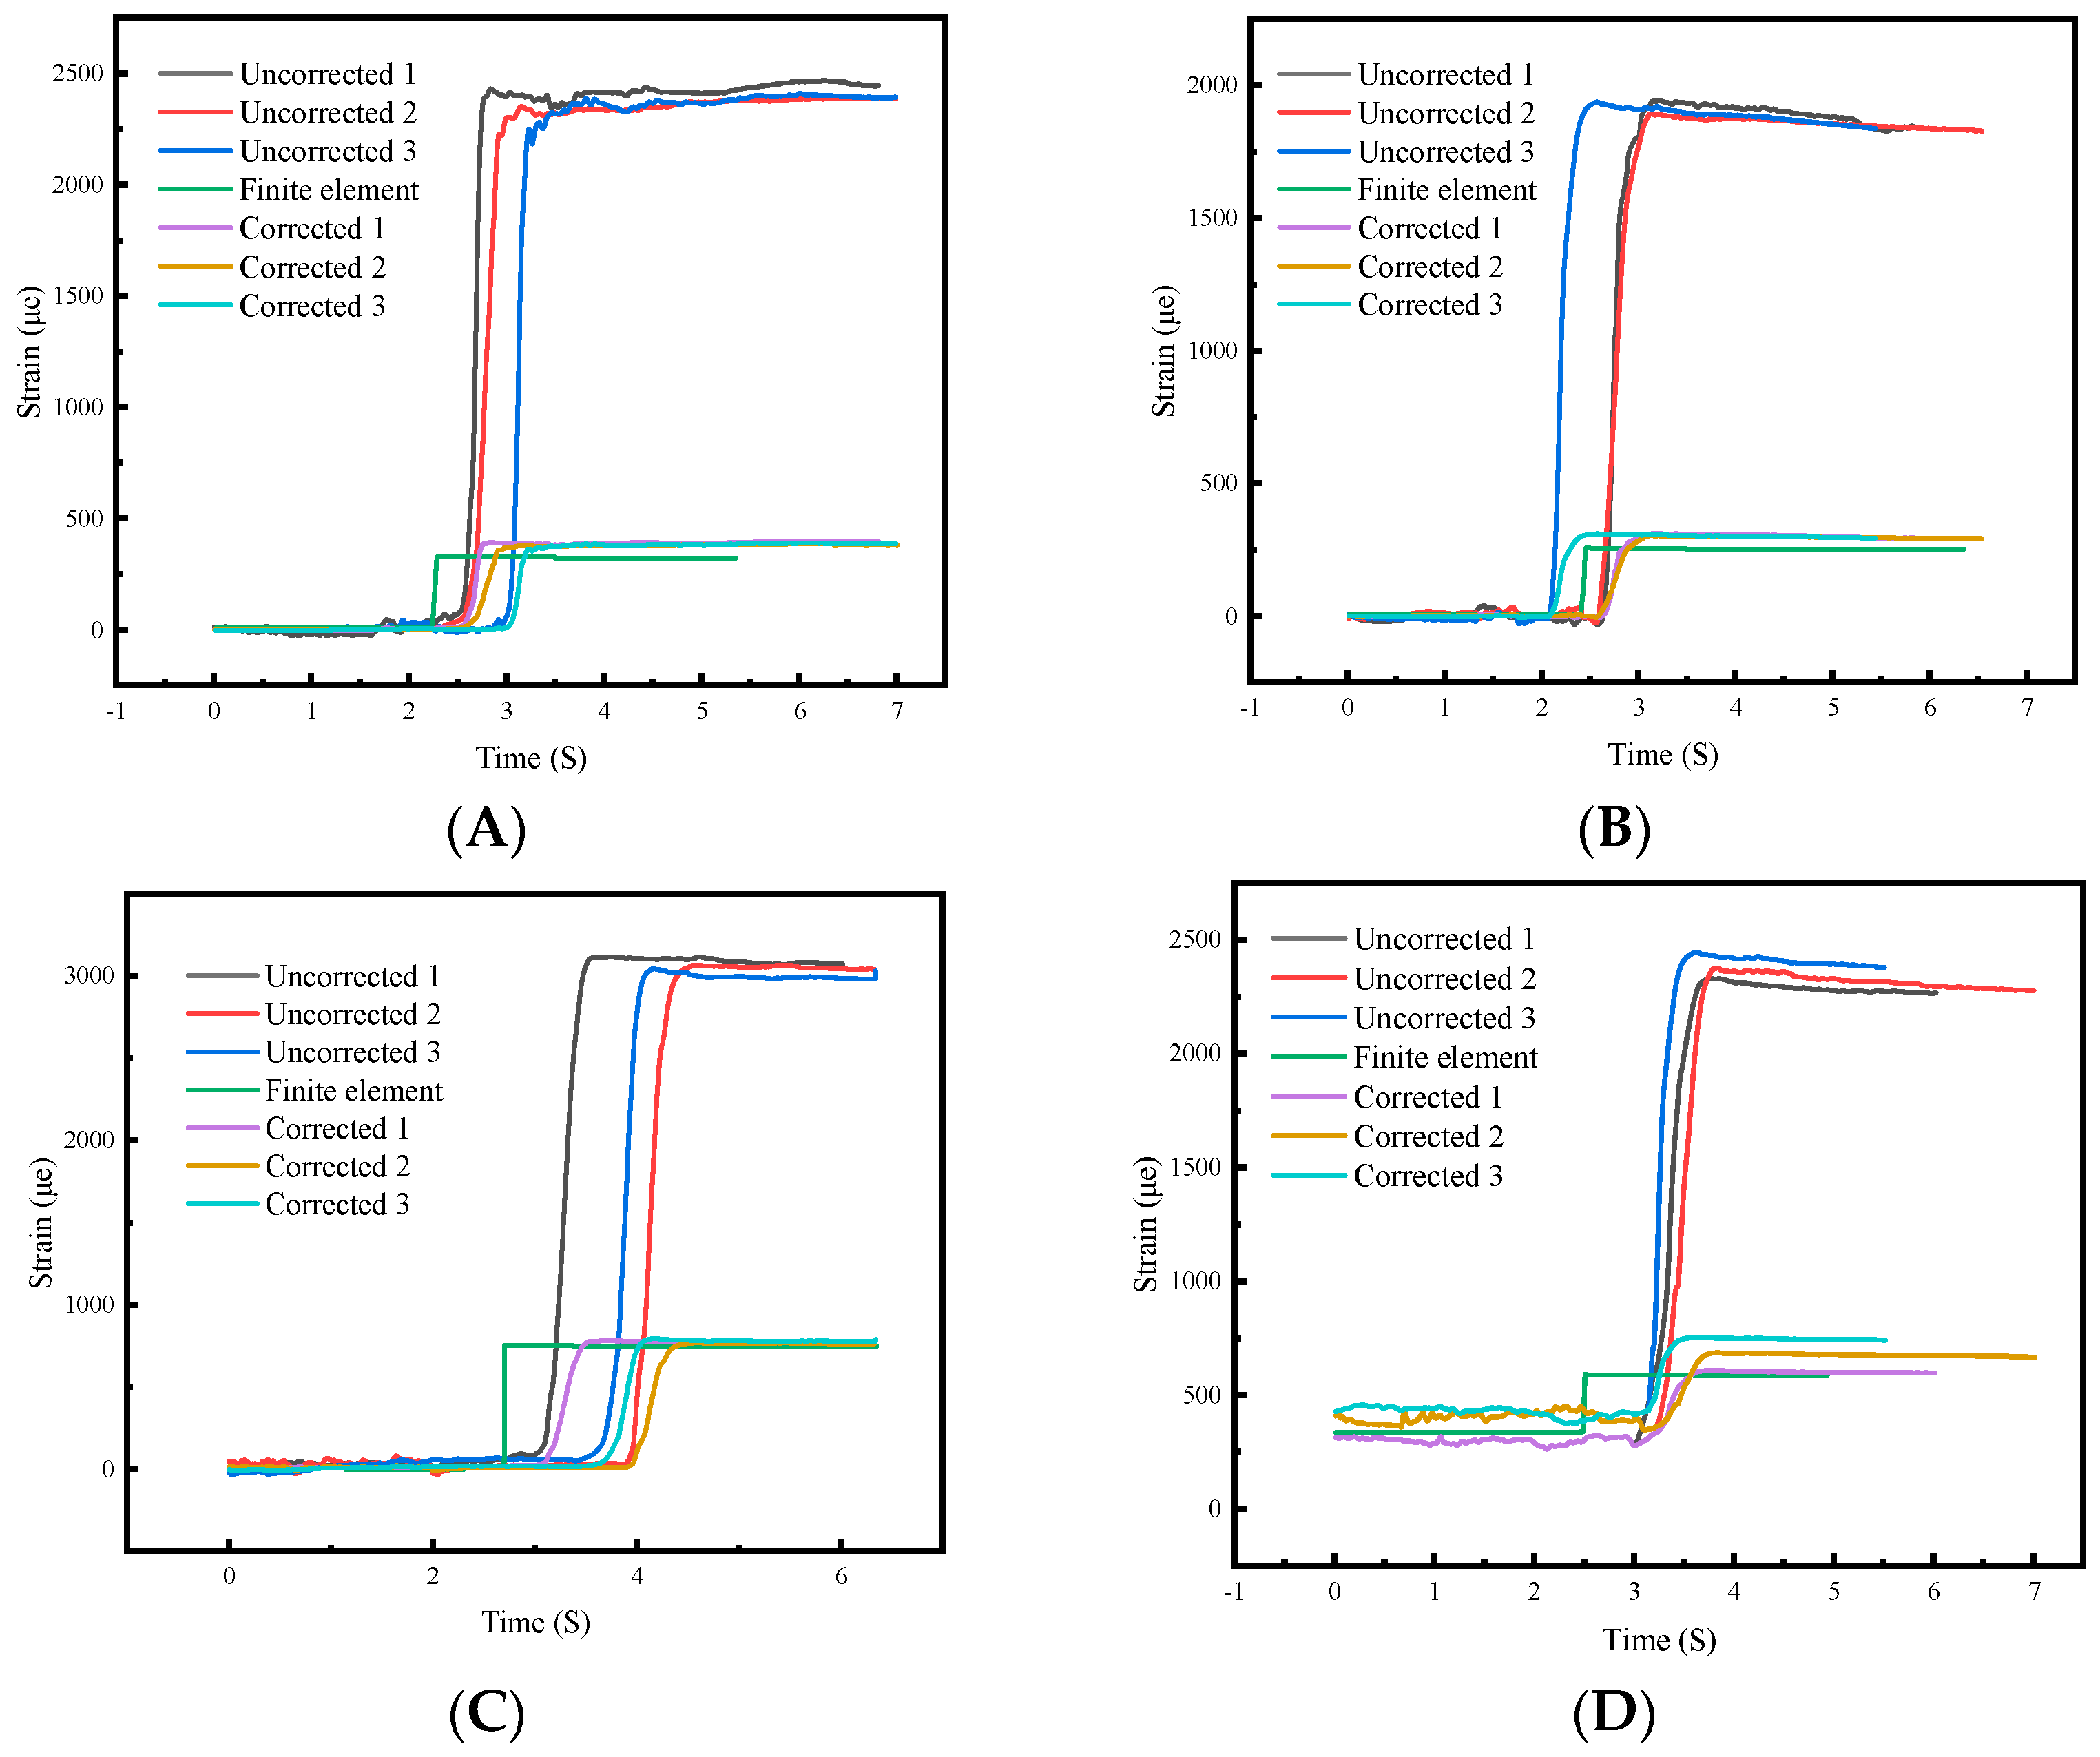
5.2. Analysis and Discussion of the Winding Experiment

Figure 8 represents the variation in strain over time for the current collector under different initial tensile stresses, winding curvature radius, and thicknesses during the winding process. From Figure 8, it is evident that the maximum stress experienced by the current collector during the winding process occurs at the moment when the electrode enters the winding stage. After entering the winding stage, the stress on the electrode gradually decreases. This is attributed to the friction between the roller and the electrode during the contact, which counteracts a portion of the tensile stress. Additionally, from Figure 8, it can be observed that the simulated values generally underestimate the experimental values after entering the winding stage. This is because the simulation did not account for centrifugal tensile stress. Comparing Figure 8a–c, it can be observed that under the same initial tensile stress and thickness, as the winding curvature radius increases, the maximum stress generated on the current collector during winding gradually decreases. Comparing Figure 8c–e, it can be deduced that under the same initial tensile stress and winding curvature radius, the greater the thickness of the current collector, the higher the stress it experiences after winding. Furthermore, comparing Figure 8c,f, it can be observed that the magnitude of the increase in winding stress is consistent, at around 280 microstrains. Therefore, we can conclude that the winding stress is solely determined by the winding curvature radius, and the bending stress and initial tension are additive, consistent with theoretical expectations. Thus, it can be inferred that the stress within the electrode is directly proportional to the thickness of the current collector and its received initial tension, while inversely proportional to the winding curvature radius, in accordance with theoretical derivations.
Figure 9 represents a comparative illustration of the maximum stress values obtained through theoretical calculations, simulation, and experimental measurements of the current collector. The x-axis from left to right represents different thicknesses, winding curvature radius, and initial tensile stresses. The first three groups refer to copper foils, while the fourth group refers to aluminum foils. From the graph, it can be observed that the stress values obtained from theoretical calculations are generally consistent with the values obtained from simulation and experimentation. This indicates the feasibility of theoretical calculations, which can serve as a reference in practical production.

6. Conclusions

This research analyzes the stress situation of the current collector and proposes criteria for its failure. This research provides a method to accurately and rapidly calculate the maximum stress value of the current collector based on parameters such as the initial tensile stress, winding curvature radius, and thickness of the current collector. The novelty of this work lies in:
(1)
Conducting tensile experiments on commonly used thicknesses of current collectors to obtain their mechanical properties, providing valuable references for practical production.
(2)
Revealing the strain mutation mechanism during the winding process of the current collector through finite element analysis and stress–strain testing, quantitatively characterizing the relationship between the stress of the current collector and parameters such as initial tensile stress, winding curvature radius, and current collector thickness.
(3)
Establishing criteria for determining the failure of the current collector, providing theoretical foundations for the winding process of lithium batteries.
The research findings indicate that the criteria proposed for determining the failure of the current collector in this study yield accurate results. In the winding process, these criteria can serve as a reference for practical production.

Author Contributions

Conceptualization, X.D. and Y.Z.; methodology, Y.Z.; software, Y.Z. and C.Z.; validation, X.D. and Y.Z.; formal analysis, Y.Z. and C.Z.; investigation, J.Z.; writing—original draft preparation, Y.Z.; writing—review and editing, X.D.; visualization, Y.Z.; supervision, Y.H.; project administration, X.D.; funding acquisition, X.D. All authors have read and agreed to the published version of the manuscript.

Funding

This research was funded by the Natural Science Foundation of Shanxi Province, China, grant number 202103021224273; the Research Project Supported by Shanxi Scholarship Council of China, grant number 2021-137; the Postgraduate Education Innovation Project in Shanxi Province of China, grant number 2022Y671; the Postgraduate Education Innovation Project in Shanxi Province of China, grant number 2023SJ258.

Data Availability Statement

Data will be made available on request.

Acknowledgments

The authors thank to the Institute of Energy Storage Technology for providing experimental support.

Conflicts of Interest

The authors declare no conflict of interest.

References

  1. Wei, M.; Ye, M.; Li, J.B.; Wang, Q.; Xu, X.X. State of charge estimation for lithium-ion batteries using dynamic neural network based on sine cosine algorithm. Proc. Inst. Mech. Eng. Part D J. Automob. Eng. 2022, 236, 241–252. [Google Scholar] [CrossRef]
  2. Manthiram, A. A reflection on lithium-ion battery cathode chemistry. Nat. Commun. 2020, 11, 9. [Google Scholar] [CrossRef] [PubMed]
  3. Liu, Y.F.; Xiong, L.Q.; Li, P.X.; Fu, H.Y.; Hou, Z.C.; Zhu, L.; Li, W.Z. Self-supported CuO nanoflake arrays on nanoporous Cu substrate as high-performance negative-electrodes for lithium-ion batteries. J. Power Sources 2019, 428, 20–26. [Google Scholar] [CrossRef]
  4. Choi, J.W.; Aurbach, D. Promise and reality of post-lithium-ion batteries with high energy densities. Nat. Rev. Mater. 2016, 1, 16013. [Google Scholar] [CrossRef]
  5. Shao, J.; Lin, C.; Yan, T.; Qi, C.; Hu, Y. Safety Characteristics of Lithium-Ion Batteries under Dynamic Impact Conditions. Energies 2022, 15, 9148. [Google Scholar] [CrossRef]
  6. Song, X.; Liu, G.; Yue, H.; Luo, L.; Yang, S.; Huang, Y.; Wang, C. A novel low-cobalt long-life LiNi0.88Co0.06Mn0.03Al0.03O2 cathode material for lithium ion batteries. Chem. Eng. J. 2021, 407, 126301. [Google Scholar] [CrossRef]
  7. Wang, Y.; Ren, D.; Feng, X.; Wang, L.; Ouyang, M. Thermal runaway modeling of large format high-nickel/silicon-graphite lithium-ion batteries based on reaction sequence and kinetics. Appl. Energy 2022, 306, 117943. [Google Scholar] [CrossRef]
  8. Zhai, P.; Liu, K.; Wang, Z.; Shi, L.; Yuan, S. Multifunctional separators for high-performance lithium ion batteries. J. Power Sources 2021, 499, 229973. [Google Scholar] [CrossRef]
  9. Chen, C.J.; Zhang, Y.; Li, Y.J.; Kuang, Y.D.; Song, J.W.; Luo, W.; Wang, Y.B.; Yao, Y.G.; Pastel, G.; Xie, J.; et al. Highly Conductive, Lightweight, Low-Tortuosity Carbon Frameworks as Ultrathick 3D Current Collectors. Adv. Energy Mater. 2017, 7, 1700595. [Google Scholar] [CrossRef]
  10. Chen, M.Y.; Liu, J.H.; Ouyang, D.X.; Wang, J. Experimental investigation on the effect of ambient pressure on thermal runaway and fire behaviors of lithium-ion batteries. Int. J. Energy Res. 2019, 43, 4898–4911. [Google Scholar] [CrossRef]
  11. Wang, W.W.; Yang, S.; Lin, C.; Shen, W.X.; Lu, G.X.; Li, Y.D.; Zhang, J.J. Investigation of mechanical property of cylindrical lithium-ion batteries under dynamic loadings. J. Power Sources 2020, 451, 227749. [Google Scholar] [CrossRef]
  12. Zhu, S.; Yang, L.; Fan, J.; Wen, J.; Feng, X.; Zhou, P.; Xie, F.; Zhou, J.; Wang, Y.-N. In-situ obtained internal strain and pressure of the cylindrical Li-ion battery cell with silicon-graphite negative electrodes. J. Energy Storage 2021, 42, 103049. [Google Scholar] [CrossRef]
  13. Wang, L.; Yin, S.; Xu, J. A detailed computational model for cylindrical lithium-ion batteries under mechanical loading: From cell deformation to short-circuit onset. J. Power Sources 2018, 413, 284–292. [Google Scholar] [CrossRef]
  14. Xu, J.; Liu, B.; Wang, X.; Hu, D. Computational model of 18650 lithium-ion battery with coupled strain rate and SOC dependencies. Appl. Energy 2016, 172, 180–189. [Google Scholar] [CrossRef]
  15. Keshavarzi, M.M.; Gilaki, M.; Sahraei, E. Characterization of in-situ material properties of pouch lithium-ion batteries in tension from three-point bending tests. Int. J. Mech. Sci. 2022, 219, 107090. [Google Scholar] [CrossRef]
  16. Christoph, B.; Wolfgang, S.; Florian, F.; Gregor, G.; Bernhard, L.; Christoph, K.; Christian, E.; Joerg, M.; Hermann, S.; Michael, S. A ‘Microscopic’ Structural Mechanics FE Model of a Lithium-Ion Pouch Cell for Quasi-Static Load Cases. Sae Int. J. Passeng. Cars Mech. Syst. 2013, 6, 1044–1054. [Google Scholar]
  17. Lai, W.J.; Ali, M.Y.; Pan, J. Mechanical behavior of representative volume elements of lithium-ion battery cells under compressive loading conditions. J. Power Sources 2014, 245, 609–623. [Google Scholar] [CrossRef]
  18. Ali, M.Y.; Lai, W.-J.; Pan, J. Computational models for simulations of lithium-ion battery cells under constrained compression tests. J. Power Sources 2013, 242, 325–340. [Google Scholar] [CrossRef]
  19. Chen, Y.; Sang, M.; Jiang, W.; Wang, Y.; Zou, Y.; Lu, C.; Ma, Z. Fracture predictions based on a coupled chemo-mechanical model with strain gradient plasticity theory for film electrodes of Li-ion batteries. Eng. Fract. Mech. 2021, 253, 107866. [Google Scholar]
  20. de Vasconcelos, L.S.; Sharma, N.; Xu, R.; Zhao, K. In-Situ Nanoindentation Measurement of Local Mechanical Behavior of a Li-Ion Battery Cathode in Liquid Electrolyte. Exp. Mech. 2019, 59, 337–347. [Google Scholar] [CrossRef]
  21. Nakanishi, S.; Suzuki, T.; Cui, Q.; Akikusa, J.; Nakamura, K. Effect of surface treatment for aluminum foils on discharge properties of lithium-ion battery. Trans. Nonferrous Met. Soc. China 2014, 24, 2314–2319. [Google Scholar]
  22. van Bommel, A.; Divigalpitiya, R. Effect of Calendering LiFePO4 Electrodes. J. Electrochem. Soc. 2012, 159, A1791–A1795. [Google Scholar]
  23. Zhou, S.; Liu, G.; Ding, N.; Shang, L.; Dang, R.; Zhang, J. Improved performances of lithium-ion batteries by graphite-like carbon modified current collectors. Surf. Coat. Technol. 2020, 399, 126150. [Google Scholar]
  24. Tao, R.; Liang, Z.; Zhu, S.; Yang, L.; Ma, L.; Song, W.-L.; Chen, H. Mechanical Analysis and Strength Checking of Current Collector Failure in the Winding Process of Lithium-Ion Batteries. Acta Mech. Solida Sin. 2021, 34, 297–306. [Google Scholar]
  25. Asnafi, N. Springback and fracture in v-die air bending of thick stainless steel sheets. Mater. Des. 2000, 21, 217–236. [Google Scholar]
Figure 1. Schematic diagram of the stress analysis during current collector winding.
Processes 11 02629 g001
Figure 2. Schematic diagram of the winding process.
Processes 11 02629 g002
Figure 3. Schematic diagram of the tensile sample and experimental setup, where a0—specimen thickness, b0—specimen width (12.5 mm), L0—original gauge length of the specimen (50 mm), Lc—parallel length of the specimen (75 mm), and Lt—total length of the specimen.
Processes 11 02629 g003
Figure 4. Schematic diagram of the current collector winding experiment.
Processes 11 02629 g004
Figure 5. Schematic diagram illustrating the correction principle for strain measurement using a strain gauge. (a) The strain measured by the strain gauge when the current collector is stretched horizontally. (b) Schematic diagram of measuring deviation of strain gauge due to the current collector bend.
Processes 11 02629 g005
Figure 6. Curves depicting the uncorrected strain, corrected strain, and simulated strain of the current collector as a function of time under strain variations. (A) Initial tensile stress of 0.2 MPa, radius of curvature of 15 mm, and thickness of 0.01 mm. (B) Initial tensile stress of 0.2 MPa, radius of curvature of 20 mm, and thickness of 0.01 mm. (C) Initial tensile stress of 0.2 MPa, radius of curvature of 20 mm, and thickness of 0.03 mm. (D) Initial tensile stress of 20 MPa, radius of curvature of 20 mm, and thickness of 0.01 mm.
Processes 11 02629 g006
Figure 7. Stress–strain curve of the current collector in the tensile experiment.
Processes 11 02629 g007
Figure 8. Strain-time curves of the current collector during the winding process under different parameters. (a) Winding curvature radius of 11 mm, initial tensile stress of 0.2 MPa, and thickness of 0.01 mm. (b) Winding curvature radius of 15 mm, initial tensile stress of 0.2 MPa, and thickness of 0.01 mm. (c) Winding curvature radius of 20 mm, initial tensile stress of 0.2 MPa, and thickness of 0.01 mm. (d) Winding curvature radius of 20 mm, initial tensile stress of 0.2 MPa, and thickness of 0.03 mm. (e) Winding curvature radius of 20 mm, initial tensile stress of 0.2 MPa, and thickness of 0.05 mm. (f) Winding curvature radius of 20 mm, initial tensile stress of 20 MPa, and thickness of 0.01 mm.
Processes 11 02629 g008
Figure 9. Comparative illustration of the maximum stress values of the current collector obtained through theoretical calculations, simulation, and experimental measurements.
Processes 11 02629 g009
Table 1. Elastic modulus and fracture strength of collectors with different thicknesses.
MateriaThickness (mm)Elastic Modulus (GPa)
Cu0.0153
0.0355
0.0556
Al0.01729
Table 2. Experimental parameters.
MateriaThickness (mm)Roller Diameter (mm)Initial Tensile Stresses (MPa)
CU0.01110.2
0.01150.2
0.01200.2
0.012020
0.03200.2
0.05200.2
Al0.017200.2
Disclaimer/Publisher’s Note: The statements, opinions and data contained in all publications are solely those of the individual author(s) and contributor(s) and not of MDPI and/or the editor(s). MDPI and/or the editor(s) disclaim responsibility for any injury to people or property resulting from any ideas, methods, instructions or products referred to in the content.

