1. Introduction
With the development of society and economy, shallow surface deposit mining can no longer meet industrial growth demands. Consequently, deeper and more complex mines have become the primary concern for resource extraction [
1,
2]. However, the problem of thermal damage in mines affected by high temperatures in deep shaft mining is becoming increasingly prominent [
3]. Several studies have shown that the ambient temperature in mines, once exceeding the regulation temperature, has a destructive effect on the psychology and physiology of miners, which can even cause accidents, including fatalities [
4]. Therefore, with the goal of prevention and control of high-temperature heat damage in deep shafts and safe deep mining, it is necessary to carry out the scientific analysis of various means of heat damage protection in the surrounding rock environment and the adoption of effective management methods.
Previous research focusing on underground heat damage management can be divided into three main categories: ventilation cooling [
5,
6,
7], cooling assisted by cooling equipment [
8,
9], and cooling with underground rock insulation materials. Xin et al. [
10] optimized air supply conditions and energy-saving control by designing a reliable auxiliary ventilation system and performing numerical simulations. Agus et al. [
11] added an air-conditioning system to the original ventilation system to optimize the ventilation structure and evaluated the thermal management of mechanical heat dissipation and worker thermal comfort.
Even though cooling methods, such as ventilation and refrigeration equipment, have been applied to manage mine heat damage with a certain effect, the optimization of the design of the underground wind network usually requires the excavation of new tunnels. This operation increases the cost consumed, accompanied by poor effects. In addition, the use of mine ventilation and refrigeration equipment in mines is not conducive to large-scale underground engineering, in which mechanical equipment causes heat transfer and wind pollution. Therefore, to reduce the impact of heat damage on the working environment, researchers have conducted in-depth studies on coated thermal insulation materials and actively explored composite materials with better thermal insulation properties [
12,
13]. Common tools used to study and test composite insulation materials consist of testing of mechanical properties, testing of thermal conductivity, and microscopic analysis (pore changes in the internal structure using scanning electron microscopy (SEM)). For instance, Liu [
14] produced an aerogel fiber with high thermal insulation properties in a harsh environment and analyzed the thermal conductivity of individual aerogel fibers through uniaxial compressive strength experiments and SEM tests and applied COMSOL simulation to find an effective way to improve the thermal insulation properties of aerogel fibers. Abderraouf and Zied [
15] included cactus fibers in concrete formulations and evaluated the compressive strength and thermal conductivity of the material to develop an eco-light concrete with high resistance. Feng et al. [
16] prepared thermal insulation composites by doping carbon aerogel with carbon fibers. The thermal performance of the formed insulation material was investigated using SEM and flexural testing. Zhang et al. [
17] developed a composite thermal barrier coating consisting of heat-resistant coating and a polyurethane foam plastic layer. In addition, thermal insulation is used in high-temperature deep shaft tunnels to reduce the impact of heat damage [
18,
19]. To improve the efficiency of thermal insulation, the principle of heat transfer is used to spray high-performance thermal insulation materials to reduce the transfer of heat from the original rock to the surrounding rock, which can to some extent avoid the economic consumption caused by the secondary excavation of new tunnels and large cooling equipment. Hou et al. [
20] used basalt fiber, glass fiber, and glass beads as raw materials to prepare three kinds of mineral thermal insulation materials. Furthermore, COMSOL simulation was performed to symbolize that specimens with basalt fibers improved the thermal insulation effect than ordinary ones. Previous research mainly focused on thermal insulation materials developed by mixing different chemical materials with good thermal conductivity based on concrete material. There is still a lack of exploration on insulation materials used to prevent thermal damage to raw rocks in high-temperature environments.
An orthogonal experiment is a commonly used method to analyze the weight of multiple factors at multiple levels and to study the optimal proportioning of materials for multi-factor-level combination ratios [
21,
22]. This approach can obtain a representative test solution among all factor combinations according to the average factor assignment and comparison. For this method, Lan et al. [
23] used the orthogonal design method to determine the best formulation of phosphorylase dihydrate filler, showing that the prepared filler in their study had good applicability and economic advantages. Pang et al. [
24] used orthogonal tests to analyze the effect of three factors on the thermal insulating capacity of insulating concrete materials and derived the optimum ratio using an efficacy factor model. Moreover, the response surface method (RSM) is a statistical analysis method based on mathematical and experimental data for the solution of multi-variable optimization problems [
25]. By constructing a response surface model between each experimental factor and the response value, a functional relationship is established between the response target and the design variables to achieve an optimal solution for the response value. As mentioned in a previous study [
26], if only the single-factor effects of orthogonal experiments are analyzed, it may cause the coverage of inter-factor effects, i.e., the magnitude of the interaction between factors cannot be clarified. By combining the RSM with orthogonal tests, it is possible to achieve fewer tests, higher accuracy, and better prediction. Meanwhile, the interaction between the factors can be considered. To this end, subsequent regression fitting analysis was performed based in Design Expert 12 software for non-linear data, and thus fitting equations were established [
27,
28,
29]. A three-dimensional surface was acquired in which level factors were used as independent variables and the corresponding experimental results as dependent variables. This surface contributed to demonstrating the extent of the interactions between the variables.
In summary, several heat damage management methods commonly used in mines have been tested and studied by scholars. In addition, the preparation of heat-insulating materials can effectively reduce heat diffusion and achieve a wide range of applications. However, from existing research results, it can be seen that studies on the preparation of heat-insulating materials with secondary resource tailings as the main raw material seldom make accurate optimization of the dosage. For this reason, practicing the concept of solid waste resourcefulness, macroscopic and microscopic testing experiments were carried out on the prepared large-doped tailing thermal insulation materials, and the relationship between compressive strength, thermal conductivity, and different doping amounts was analyzed. The prediction models of compressive strength and thermal conductivity were established based on thermodynamic parameters. This paper provides a new idea for the research of high-temperature control technology in deep mining.
3. Results and Discussion
The results of the tests of prepared specimens are displayed in
Table 6. It should be noted that the compressive strength value after 28 days of curing ranged from 0.39 to 0.81 MPa, while the thermal conductivity value ranged from 0.268 to 0.386 w/k∙m. Obviously, the obtained thermal conductivity value was much lower than that of PC (1.71 w/k·m). The analysis and discussion are described in detail in the following sections.
3.1. Compressive Strength Analysis
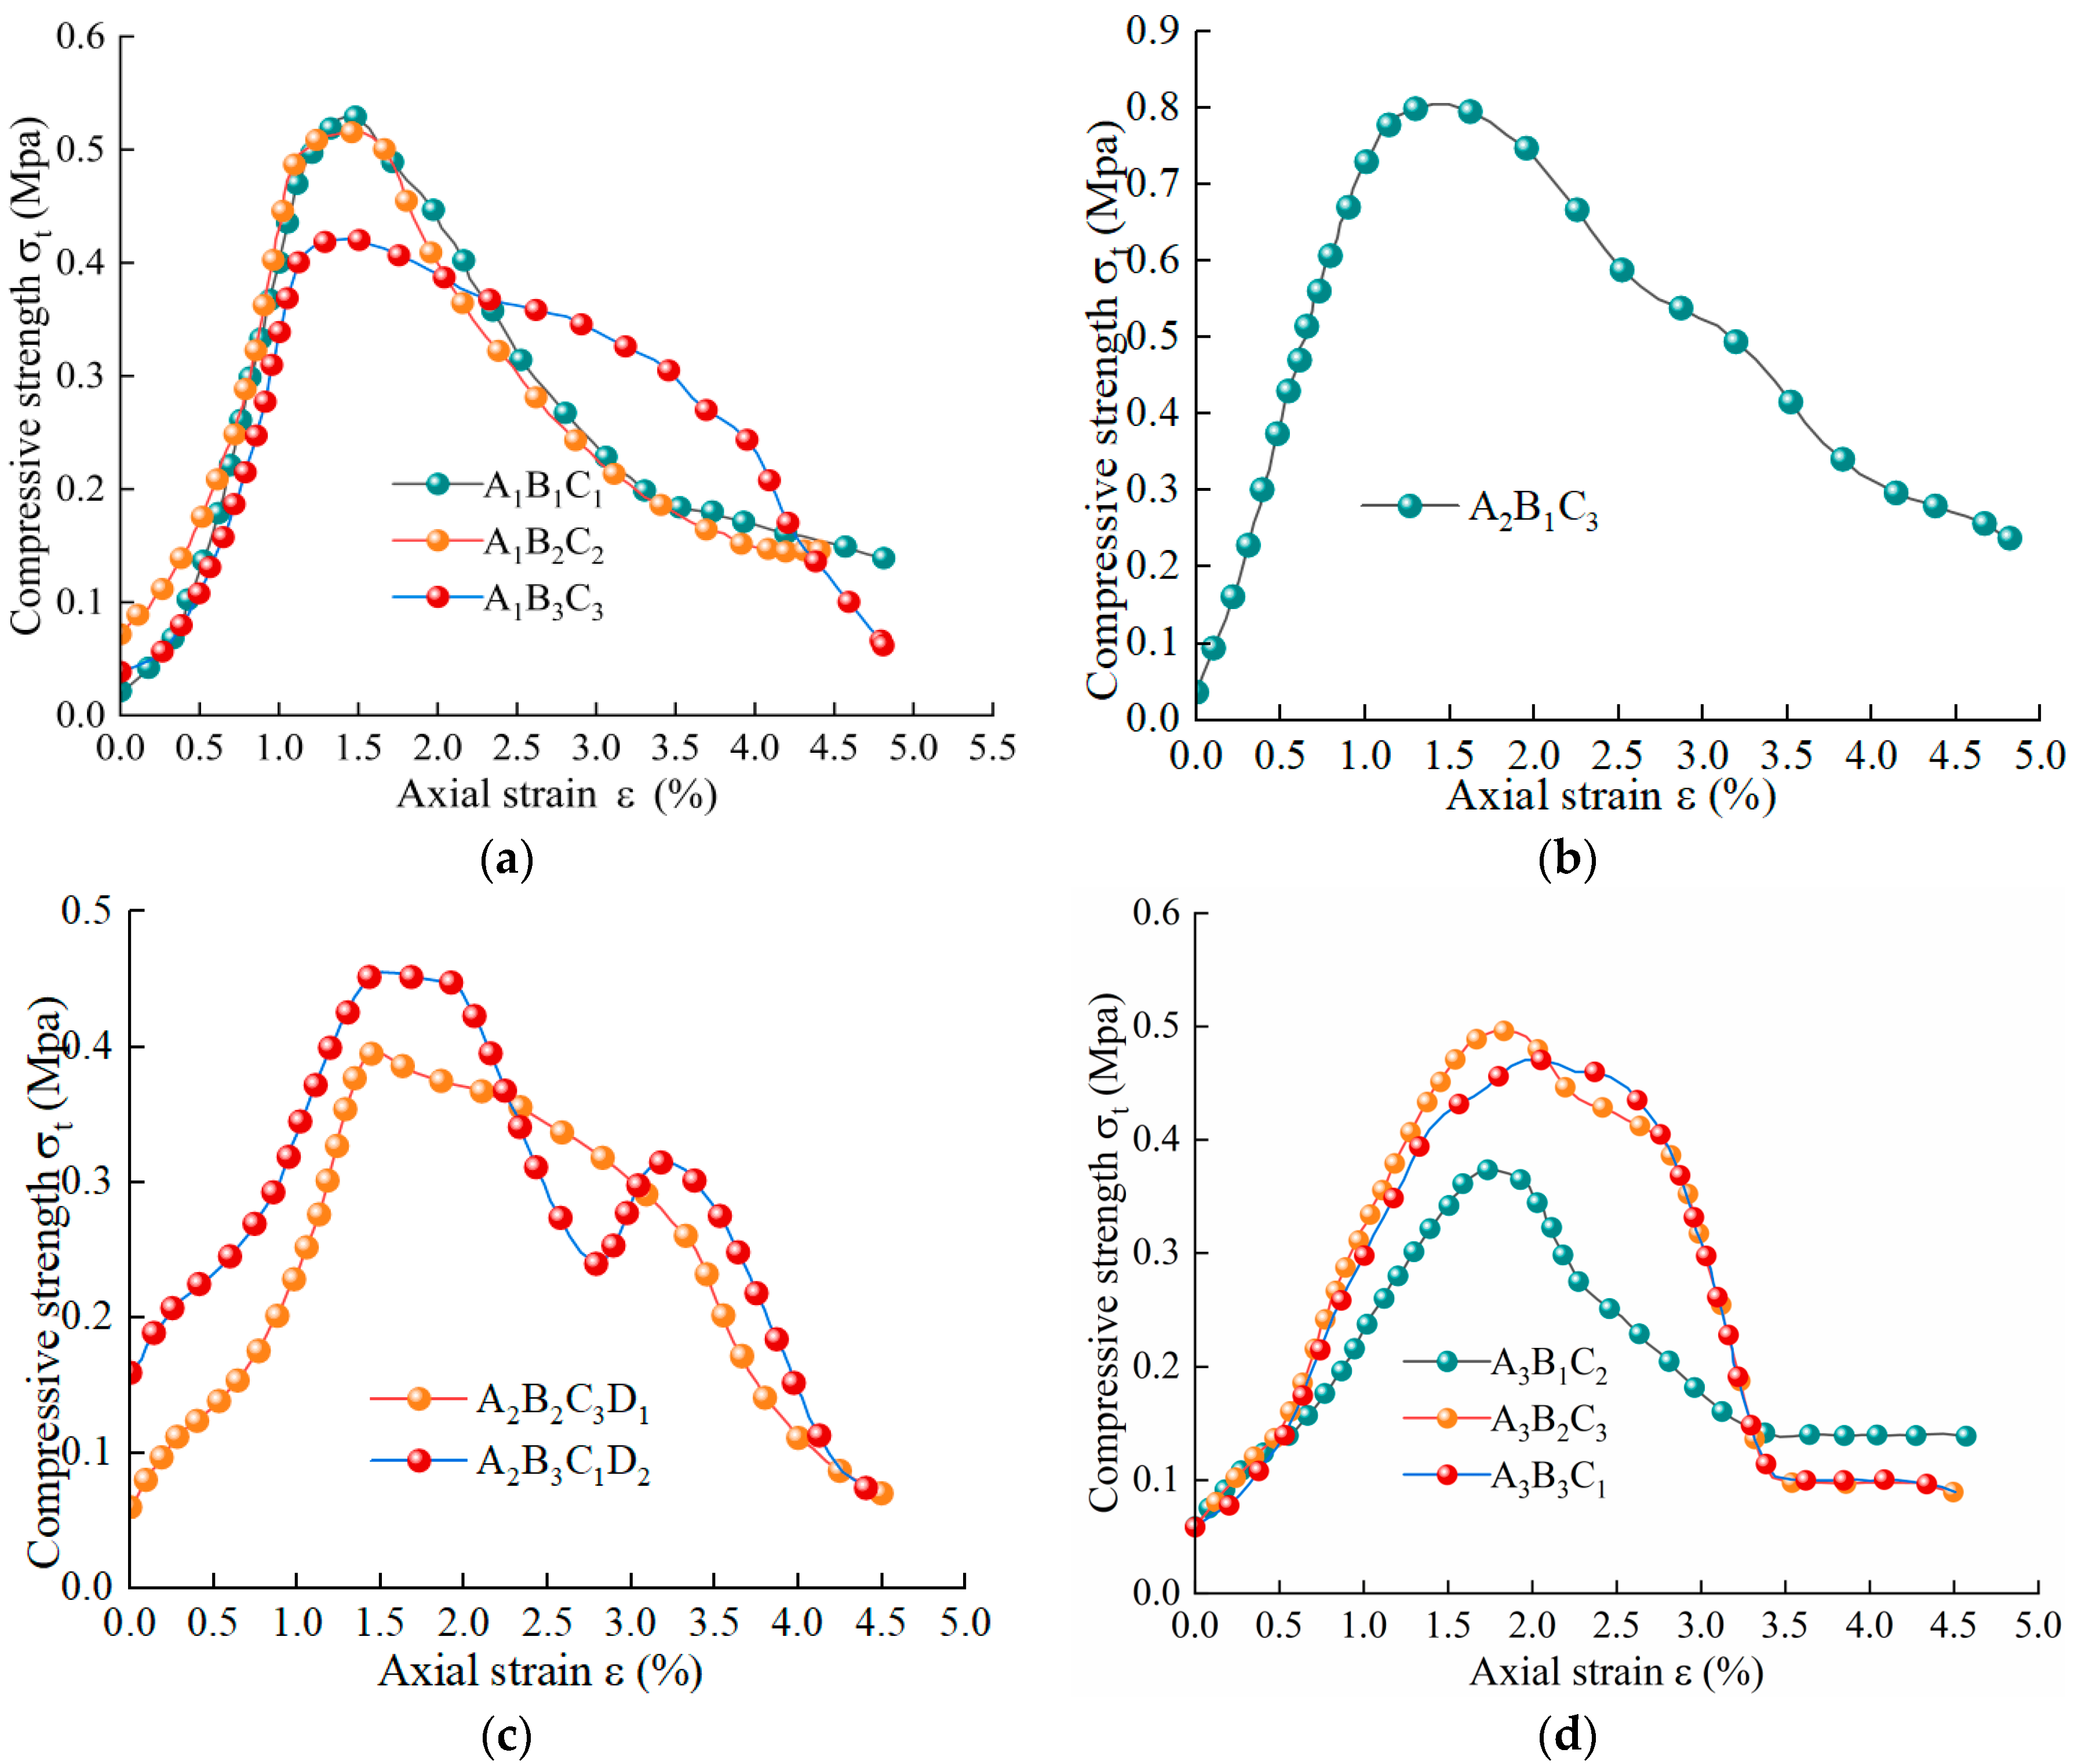
The results of the compressive strength analysis of all samples are displayed in
Figure 2.
The trend of the compressive strength test curve is shown in
Figure 2. The stress carried by each sample increased continuously as the strain displacement increased. The stress reached the compressive strength limit when the strain changed by about 1–2%, and rapidly decreased. From
Figure 3, it is apparent that the compressive strength of each experimental group was over 0.3MPa, with the highest value found in experimental group IV at 0.81MPa, specifically A
2B
1C
3, where A, B, and C represent 60, 10, and 15, respectively. The compressive strength test results have similarities with the materials cited in the literature [
39,
40] as well as experimental results.
When the level of A doping was low, C doping failed to bond the tailing particles and led to a low compressive strength of the system. Conversely, when C doping was sufficient but B doping was too high, the specimen experienced uneven pressure, leading to an increase in the degree of porosity rupture and a subsequent reduction in compressive strength. However, when appropriately dosed with B, an increase in C doping optimized the system’s compressive strength, achieving the maximum value at a 60% level of A doping. This can meet the fundamental compressive needs of thermal insulation materials. Used alongside perimeter rock support and anti-cracking mesh, it offers thermal insulation, while preventing material cracking and enhancing the material’s strength tolerance.
Due to space limitation, only the compressive strength test results of the three groups of specimens in
Figure 2a were analyzed. Results of two selected samples showed that the ratio of tailings to PC in A
1B
1C
1 was 10:1. The amount of PC added was relatively small. Although small-size tailings can play a certain role in gelling, the alkaline conditions created after the reaction between tailings and slurry weakened the gelling effect of small-size tailings. Simultaneously, the micropores formed by the glass beads reduced the compressive strength of the sample. In contrast, the ratio of tailings to PC in A
1B
2C
2 was 5:1, and the amount of PC added was higher than that in experiment no. 1, which can increase the durability and compressive strength of the material. However, increasing the amount of closed-cell glass beads increases the number of internal closed cells, which is not conducive to compressive strength materials. Therefore, the compressive strength test results for both formulas were similar. In A
1B
3C
3, although PC reached a maximum of twice that of experimental group 1, the maximum compressive strength of the glass beads reached a maximum of 20% and the maximum compressive strength was only 0.43 MPa, but with increasing strain, the compressive strength decreased slowly, indicating that a high dosage of PC and glass beads can improve the toughness of the material.
3.2. Thermal Conductivity Analysis
Thermal insulation material containing tailings belongs to the family of inorganic mortar materials, whose thermal conductivity can be measured directly using a thermal conductivity meter. As shown in
Table 6, the maximum and minimum values of thermal conductivity were 0.386 and 0.268 w/k∙m, respectively, in the nine groups of experiments. And these results have similarities with the literature [
41,
42].
Additionally, the difference in each group only reached 0.1 (w/k∙m), which was not significant. As is well known, porosity, along with the pore structure inside the material, is closely associated with thermal insulation performance. Taking the glass beads as an example, in this study, an increase in their content usually led to increasing porosity. The reduced thermal conductivity contributed to optimized thermal insulation performance. However, owing to other existing raw materials, the discharge pressure of partial pores was higher than the ultimate shear stress of the slurry, causing some pores to burst to form an interconnected structure. This phenomenon immensely weakened the thermal conductivity value that should have been reduced. The higher porosity represented an irregular pore structure inside the materials, affecting the mechanical properties of the material. Therefore, to obtain specimens with compactness, uniformity, and good applicability, the porosity of the material should be controlled to avoid an excessive value. That is to say, it is important to consider mechanical and thermal insulation properties comprehensively.
3.3. Orthogonal Experiment Result Analysis
Polar analysis of variance is a widely used tool in orthogonal tests to derive the order of precedence of the affectivity of the factors at each level of the test [
43]. In the analysis of variance,
represents the sum of the test data with a constant factor and level number i. For factor A,
represents the sum of the test data for factor A at level 1. The arithmetic mean of k is denoted by
. R represents the extreme variance, which is calculated as R =
. The R value indicates the degree of influence of the factors on the test results.
Table 7 and
Table 8 show the results of polar analysis.
Table 7 and
Table 8 imply that the order of effect of the three factors on the compressive strength is C > B > A and on the thermal conductivity is B > A > C. The optimum values of compressive strength and thermal conductivity were A
2B
1C
2 and A
2B
1C
3, respectively. Accordingly, optimum results were acquired with tailings of 60%, glass beads of 10%, and PC of 10~15%. Similar results were also investigated by Jiang et al. [
44], who, using basalt fibers as the raw material, determined the order of influence of each factor on thermal insulation performance by using orthogonal tests and polar analysis of variance.
3.4. Microtext Analysis
The use of SEM can help to observe the internal structure of the material, including pores, cracks, and microstructures. In this section, the microstructures of groups 1 and 2 are presented in
Figure 4.
Figure 4a shows that the surface of the cross section of A
1B
1C
1 was rough, accompanied with irregular shaped and low interconnected pores. It can be clearly seen that porosity was relatively lower. Due to insufficient PC content, tailings with fine particles acted as a cementing agent. As a result, a cohesive structure was presented that was similar to a pile of tailing particles without porous characteristics. This is why there were fewer internal voids and a more agglomerated phase.
Figure 4b presents a granular microstructure with irregular pores, high connectivity, and suitable porosity (A
1B
2C
2). Compared to A
1B
1C
1, increased PC caused a scaled internal microporous structure. A stable internal structure was formed under the support of larger tailing particles. Nevertheless, another finding is that connected pores accounted for a larger proportion compared with closed pores. Based on the literature [
45], the heat transfer path was increased and the thermal conductivity of the material was reduced by the formation of a multi-scale porous structure with fine particles having a large specific surface area. The thermal conductivity efficiency of the interconnected pores was higher than that of the closed pores. Consequently, the overall mechanical strength was impaired.
As an additive applied in physical insulation, closed-glass beads contributed to reducing thermal conductivity due to their unique pore structure.
Figure 5a,b shows that closed-cell glass beads have the potential to maintain a closed, uniform, and porous structure inside the material. However, they were closely bound to other substances under the bonding effect of PC and tailing particles. This played a key role in the thermal conductivity of the material. This finding is consistent with Yuan et al. [
46], who demonstrated that increasing glass beads results in more internal connection holes. This reduces the thermal conductivity of the material and improves thermal insulation properties.
3.5. Model Fit Analysis
Based on Design Expert software, regression analyses were carried out on the compressive strength and thermal conductivity of the insulation materials at the age of maintenance. Comprehensive factors A, B, and C were analyzed, the model with the highest significance was selected, then the model was used to perform non-linear optimization prediction, and the predicting effect was ensured to obtain the optimum ratio of insulating materials with a high correlation coefficient.
3.5.1. Non-linear Fitting Analysis
Non-linear regression analysis was applied by means of a module of Design Expert software. Experimental results were subjected to regression analysis. A highly adaptive fitting regression equation was obtained through the significance test of the model and the analysis of variance.
To check the reliability of the established regression equation, variance analysis was performed to test the significance of the constant, linear, quadratic (interaction), and quadratic (surface effect) terms in the fitted second-order equation model, as shown in
Table 9 and
Table 10. The results showed the effectiveness of the regression model in the prediction of response variables.
The model F-values for compressive strength and thermal conductivity were 275.47 and 281.28, respectively, indicating the significant effect of the model.
p-Values less than 0.0500 indicated that the fitted model was statistically significant, implying that A, B, C, AB, BC, A
2, and B
2 are significant model terms. The lack-of-fit terms under two sets of parameters were found to be 0.2214 and 0.1832, respectively, which were not significant at the 0.05 level of significance, demonstrating high credibility of the regression equation.
Table 11 also shows the statistical error analysis of the regression equation.
The regression equation obtained for compressive strength, for example, showed a high degree of accuracy. The corrected coefficient of determination was 0.9954, and the predicted R-squared value was 0.9917, which differed by less than 0.2. This indicated an excellent model fit. In addition, the signal-to-noise ratio of the model was 52.8788, with a ratio of values greater than 4, which was ideal and indicates that there was sufficient signal for the regression analysis. Similarly, the fitted regression equation for thermal conductivity met the test criteria and presented a good fit.
The difference between the actual and predicted values for compressive strength and thermal conductivity is shown in
Figure 6. It should be noted that the difference between the two was less than 1.4%. Simultaneously, the deviation between the predicted values and the actual values was within the acceptable range, which is further evidence of the validity of the model.
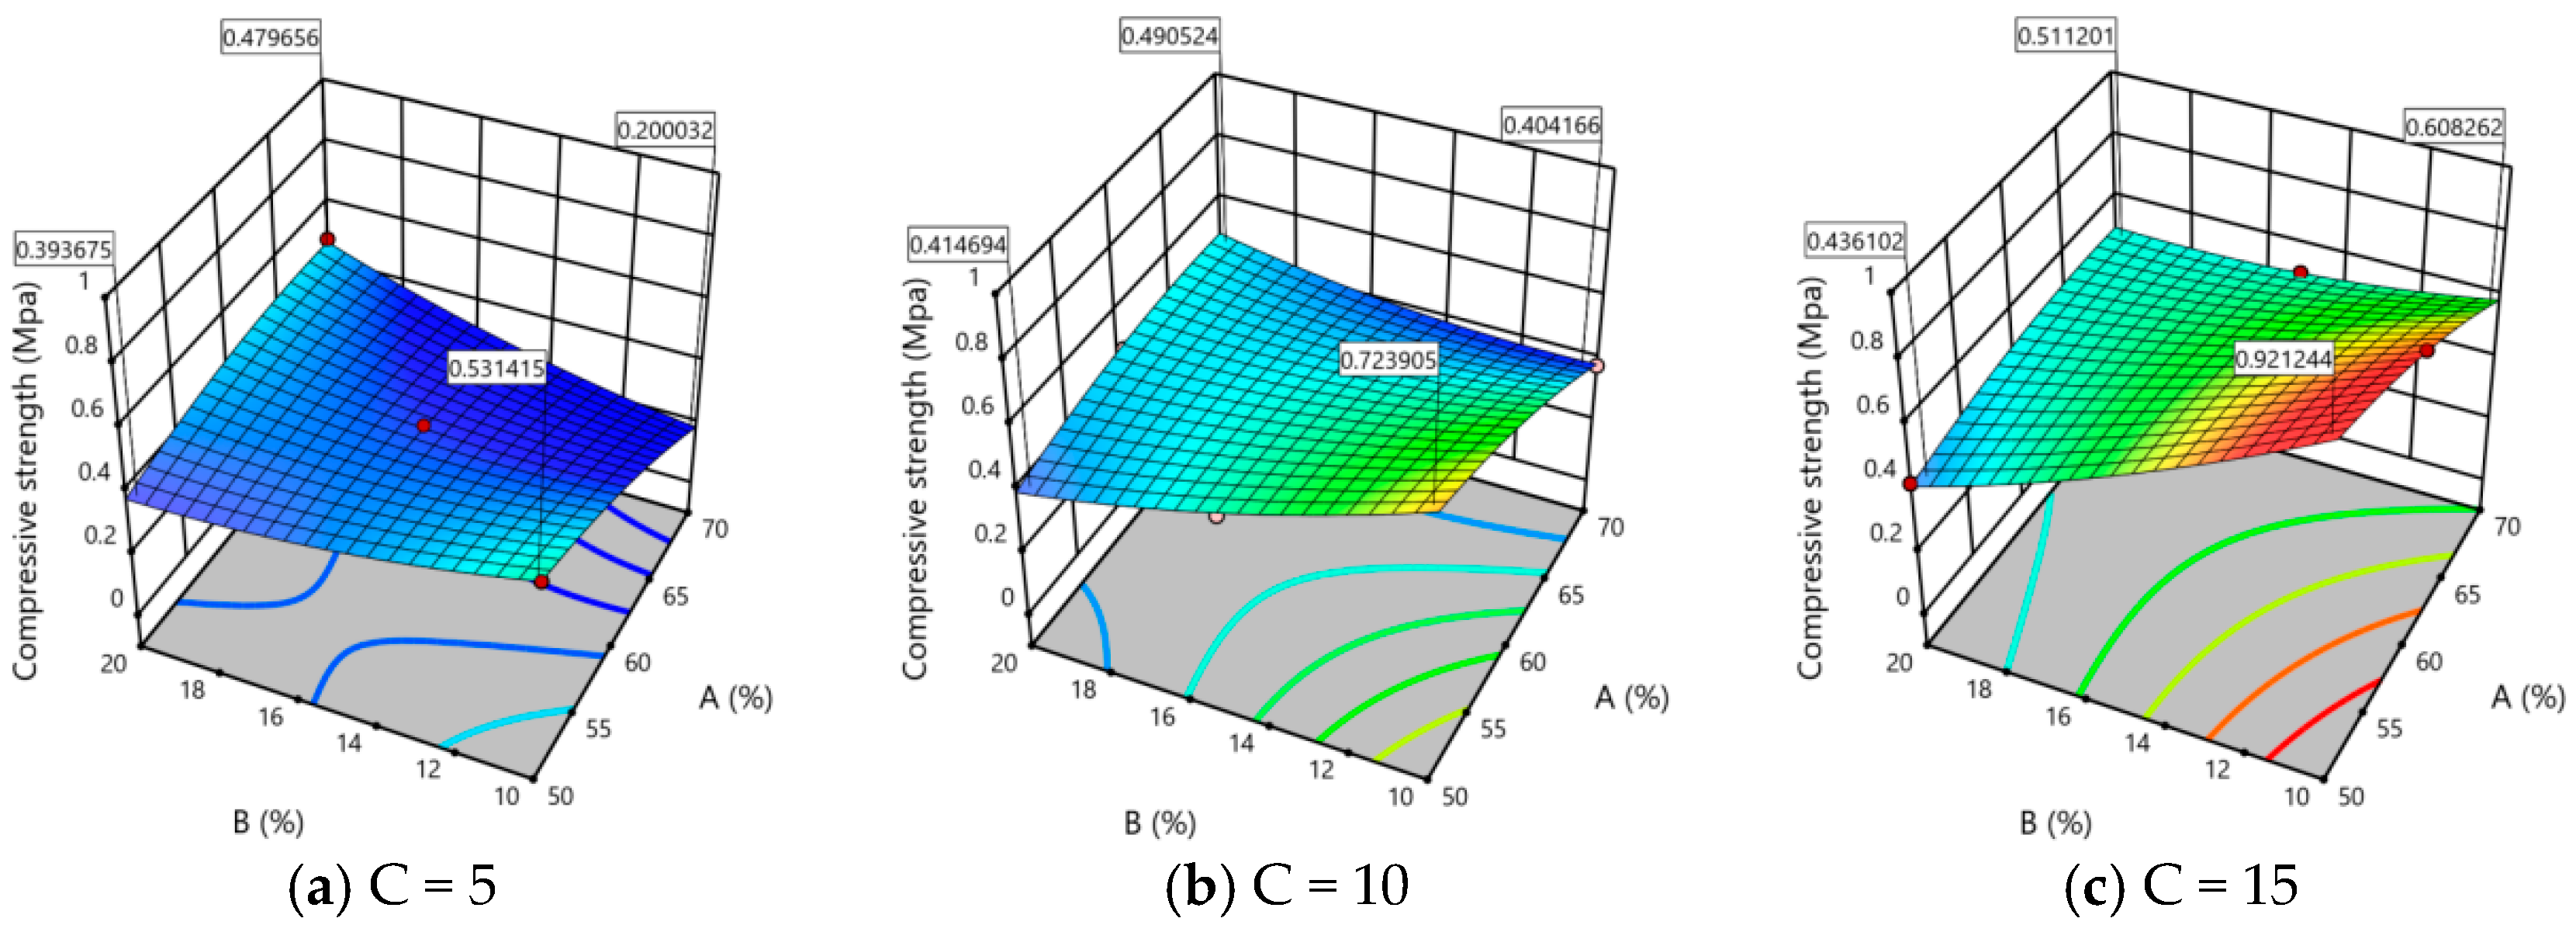
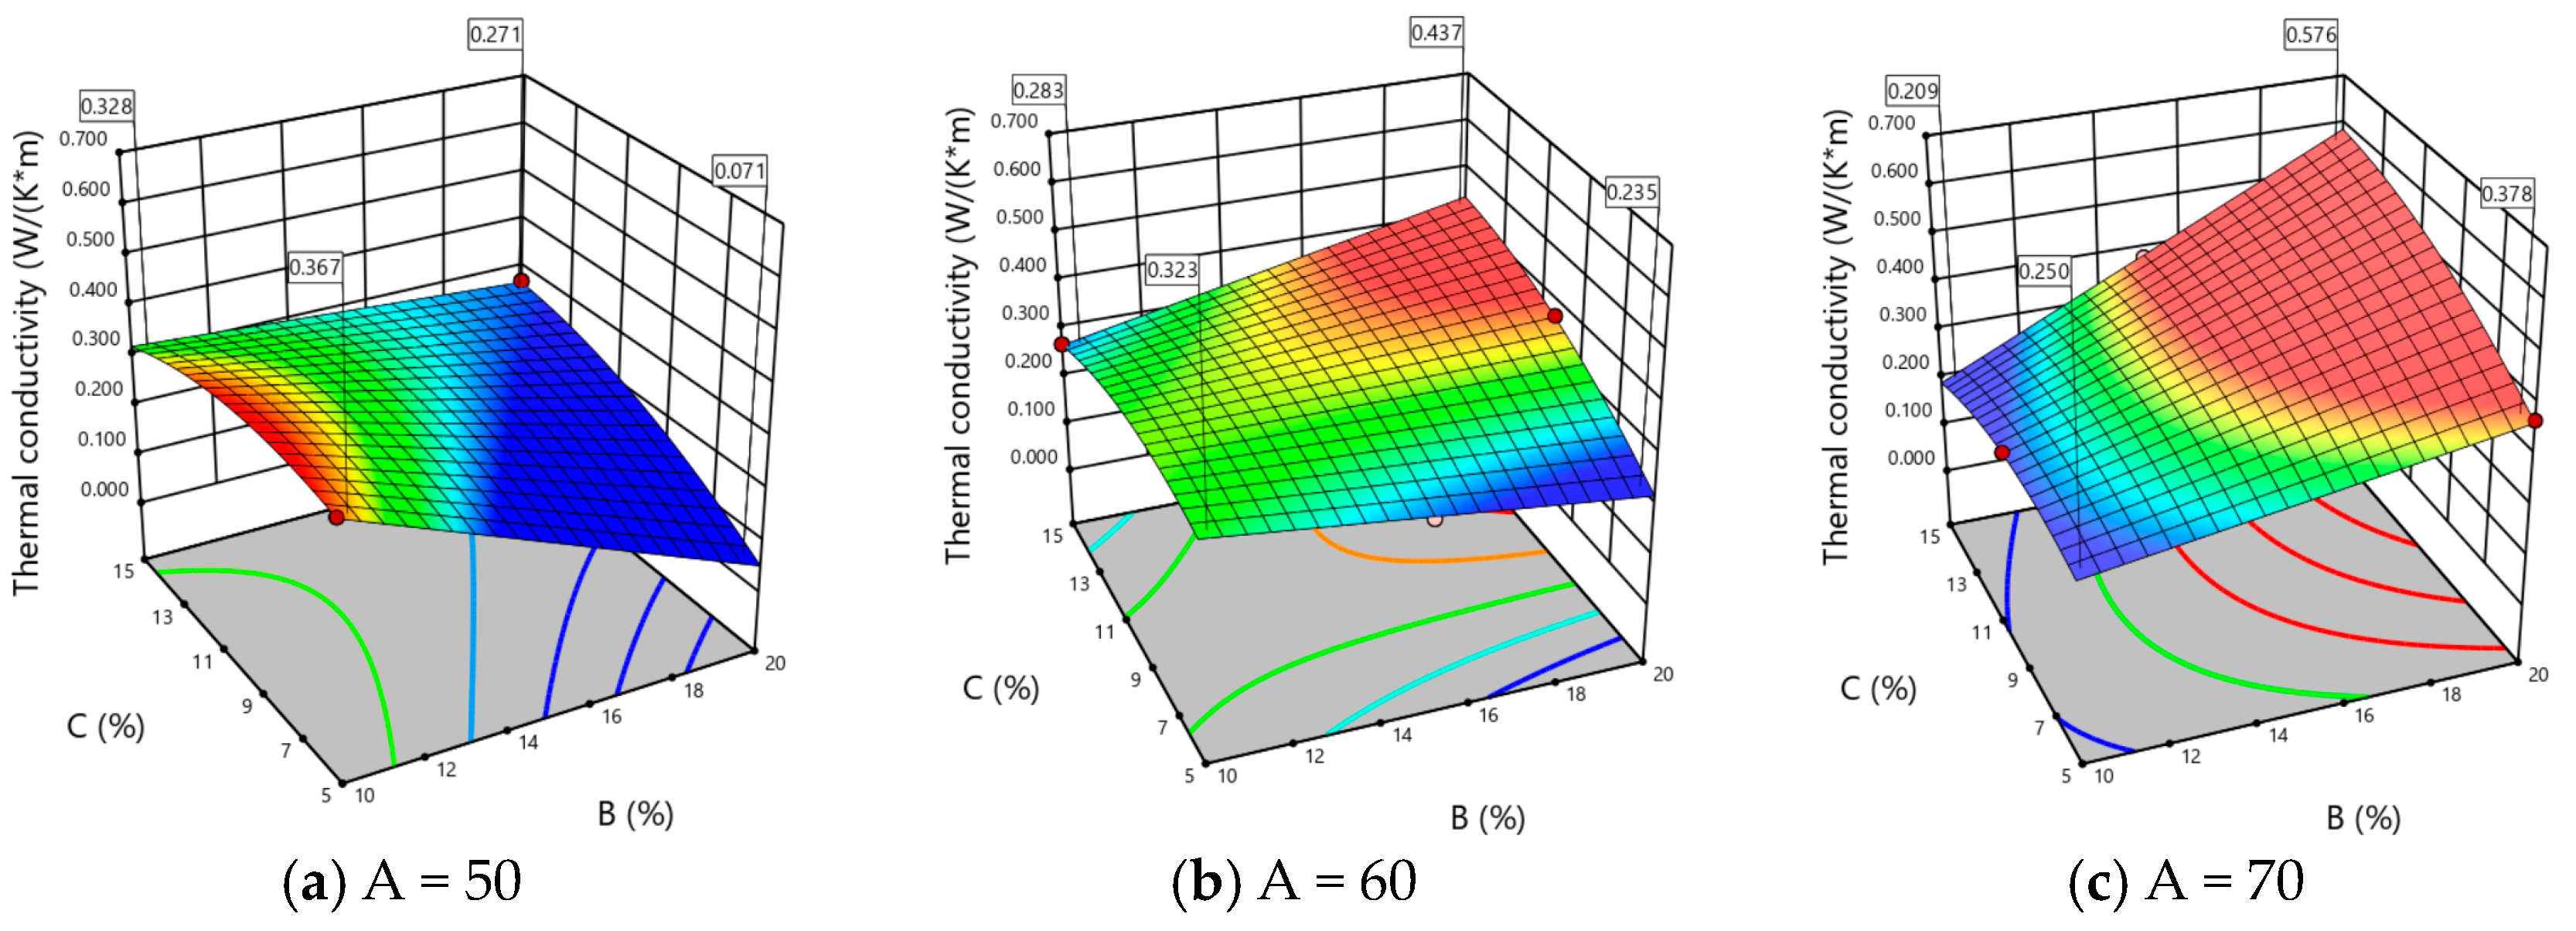
3.5.2. Visualization and Analysis
A 3D surface was generated from the square model. The effect of adjustment of the values of the factor variables on the interactive variation of compressive strength and thermal conductivity can be seen in
Figure 7,
Figure 8,
Figure 9, and
Figure 10, respectively. As can be seen from the four figures, different colors indicate the size of the resultant value, with colors closer to red indicating larger values and colors closer to blue indicating smaller values. The use of different color variations facilitates the analysis of the magnitude of the influence of each factor on the experimental results.
The interaction effects of factors A and B on compressive strength and thermal conductivity were analyzed by means of
Figure 7 and
Figure 9. As shown in
Figure 7a, decreasing volume fractions of A and B doping increased compressive strength, with a small slope indicating weak interaction effects between these factors. As factor C increased, the interaction effects of factors A and B became more pronounced and the surface transitioned from a flat to a sloped state, with the maximum value occurring between a lower B factor (10–12%) and a lower A factor (50–55%). The compressive strength decreased as the volume fraction of factor B increased when the volume fraction of factor A was constant, with the decrease in amplitude increasing. The incorporation of glass beads had a more significant effect on compressive strength. The surface analysis of thermal conductivity as the dependent variable under the interaction effects of factors A and B is shown in
Figure 9. As shown in
Figure 9a, an optimum thermal conductivity value appeared when the volume fraction of factor C was 5%, with significant coupling effects between factors A and B. When the volume fraction of factor A was low, increasing the volume fraction of B led to a rapid decrease in thermal conductivity, with B having a more significant effect on thermal conductivity. However, as the volume fraction of factor C increased, the whole surface gradually floated upward, and the maximum value of thermal conductivity reached 0.572 w/k·m, with an irregular shape as the values of factors A and B changed. The coupling effect of factor B on thermal conductivity gradually decreased as the volume fraction of factor C increased. At C = 5%, good thermal conductivity performance was achieved at high glass bead (18–20%) and low waste (50–55%) content, where vitrification of the closed-cell glass beads could increase the proportion of closed pores and improve insulation performance. Reducing the PC reduced the degree of surface densification of the sample, which is beneficial for maintaining good insulation performance. Similarly, the interaction effects of factors B and C were analyzed, as shown in
Figure 8 and
Figure 10. As the analysis process was similar to that of factors A and B, only the results of factor B and C analysis are summarized. In terms of compressive strength, PC had a more significant effect than the glass microsphere. Optimum mechanical performance occurred at lower B factor (10–12%) and higher C factor (13–15%) values. In terms of thermal conductivity, the glass microsphere had a more significant effect than PC. The optimum thermal conductivity value occurred at lower cement (5–7%) and higher glass microsphere (18–20%) content.
The summary of the 3D surface analysis results shows that for compressive strength, the order of influence of the three factors was PC > glass beads > tailings (C > B > A), with optimal volume fractions occurring in the range of tailings (50–55%), glass beads (10–12%), and PC (13–15%). For thermal conductivity, the order of influence of the factors was glass beads > tailings (B > A) and glass beads > PC (B > C), with optimal volume fractions occurring in the range of tailings (50–55%), glass beads (18–20%), and PC (5–7%). In addition, a similar order of influence as the orthogonal test range analysis was found in the analysis of the interaction effects between the factors in the model fitting. Since the analysis focused on the range of values for each factor volume fraction that gave optimal results for compressive strength and thermal conductivity, it is necessary to consider both factors together to obtain optimal volume fractions that meet practical engineering needs.
Design Expert 12 software was used to analyze the optimal volume fractions of the surface model, considering the concept of environmentally friendly treatment of solid mine tailings [
47,
48]. The selection of a large number of tailings as the basic raw material for the production of thermal insulation materials, while ensuring optimal insulation performance, can reduce costs and have a positive effect on the improvement of the economic development benefits of mines. Therefore, the volume fraction data of each factor under the prediction model were calculated based on the compressive strength (C) maximum and the thermal conductivity (T) minimum. The optimal formulation was selected based on the principle of closeness to a feasibility coefficient of 1 and actual economic benefit requirements.
The predicted optimal combination ratios under the model were calculated as follows: A at 65.2%, B at 10.4%, and C at 14.7%. The predicted response results were C = 0.707 MPa and T = 0.234 w/k·m. To verify the compressive strength and thermal conductivity of the insulation material at this predicted optimum volume fraction, three tests were carried out for the same ratio under experimental conditions and the average value was taken as the final result. The experimental C was 0.698 MPa, and T was 0.231 w/k·m. The prediction deviation was calculated by taking the absolute difference between predicted values and experimental actual values, divided by the predicted values. The deviation of C was 0.42%, and that of T was 1.2%. The results showed that the optimum combination ratio under the fitting equation was accurate and reasonable, and the material ratio under the prediction model could achieve an optimum result with high reliability and excellent compressive strength and thermal insulation performance.
4. Conclusions
Through the orthogonal design of nine groups of tests to conduct thermodynamic parameter testing, to optimize the results of the study using response surface design to obtain the best ratio of theoretical calculations, and finally to meet the objective of the maximum compressive strength and minimum thermal conductivity to perform prediction and experimental verification, we found that the preparation of the conformity of thermal insulation materials can reduce the effect of the temperature and indicates high applicability of the study. The conclusions of the study are summarized as follows:
(1) The internal pore structure of highly doped tailing insulation material is irregular, and the proportion of interconnected pores is relatively larger. The optimum levels of compressive strength and thermal conductivity are obtained in the range of 60% of tailings, 10% of glass beads, and 10% to 15% of PC.
(2) The order of effect of the three raw materials on the compressive strength of the insulation material is PC > glass beads > tailings and on thermal conductivity is glass beads > tailings > PC.
(3) The multivariate non-linear regression fit equation obtained using response surface analysis had a signal-to-noise ratio much greater than 4. The order of interaction of compressive strength is PC > glass beads > tailings and of thermal conductivity is glass beads > tailings and glass beads > PC.
(4) The volume fractions of the optimum dosage of the three main raw materials of the prepared thermal insulation materials were synthesized from the fitted equations to be 65.2% for the tailings, 10.4% for the glass beads, and 14.7% for PC. The deviation values of compressive strength and thermal conductivity under the experimental preparation test and non-linear fitting were 0.42% and 1.2%, respectively. This indicated that the model is well optimized and the optimum doping results obtained are reliable.
The results obtained in this paper are practical and useful in the development of thermal insulation materials. Industrial application experiments in mines should be carried out in the future.


