Article

Consistency Checks for Pressure-Volume-Temperature Experiment of Formation Oil and Gas at High Temperature

1
State Key Laboratory of Petroleum and Prospecting, China University of Petroleum, Beijing 102249, China
2
Tarim Oilfield Company, PetroChina, Korla 841000, China
3
Research Institute of Exploration and Development, PetroChina Changqing Oilfield Company, Xi’an 710018, China
*
Authors to whom correspondence should be addressed.
Processes 2023, 11(9), 2727; https://doi.org/10.3390/pr11092727
Submission received: 23 August 2023 / Revised: 8 September 2023 / Accepted: 11 September 2023 / Published: 12 September 2023

Abstract

:
The oil and gas phase behavior of high temperature is complex and changeable, which is usually obtained by PVT experiments. The accuracy of the experiment data plays a crucial role in the reserve evaluation and development plan of oil and gas reservoirs. However, the current PVT experiment consistency checks are not suitable for high-temperature reservoir conditions. This paper proposes a systematic check method for the PVT experiment data consistency at high temperature. These checks revise the material balance method, Hoffman method, and equilibrium constant method by using the equilibrium constant calculation method at high temperature. The consistency check of component data and constant volume depletion experiment data is carried out by combining the three improved methods with the component check method, so as to judge the experiment data accurately. In this paper, two high-temperature reservoir fluids—gas condensate sample fluid X and volatile oil sample fluid Y—are selected to carry out consistency checks with component data and constant volume depletion data. This check method is of great significance to study the phase behavior of formation oil and gas at high temperature, especially for volatile oil and gas condensate fluid.

1. Introduction

As one of the most basic reservoir fluids experiments, the PVT experiment can provide an important basis for reservoir development policy design and oil field production planning [1,2,3], especially for gas condensate reservoirs and volatile oil reservoirs [4,5,6]. There are huge reserves of gas condensate and volatile oil all over the world, with high production value [7,8,9]. The Arun field, one of several huge gas condensate reservoirs, is estimated to hold 481.39 km3 of volumetric original gas in place. The current production gas rate is about 2.3 × 10⁶ m3/d with 2400 bbl/d of condensate oil in the Arun field [10]. The Cupiagua field, also a huge gas condensate reservoir, produces an average of 2.7 × 10⁶ m3 gas per day and a maximum of 1.9 × 10⁵ barrels of condensate oil per day [11]. In the Eagle Ford shale reservoir, the oil rate of a single well in a volatile oil block can produce up to 1200 bbl/d in early time [12]. Due to the high content of medium components [13,14,15], complex phase changes will occur during the development process of light oil reservoirs and heavy gas reservoirs such as volatile oil reservoirs, gas condensate reservoirs, and some unconventional reservoirs [16,17,18]. Therefore, the PVT experiments which can reflect the fluid phase behaviors play an indispensable role in oil and gas production [19,20,21,22]. The accuracy of PVT experiment data is vital to the development and research of oil and gas reservoirs, especially gas condensate reservoirs and volatile oil reservoirs.
PVT experiments generally include differential liberation experiment [23], constant composition expansion experiment (CCE) [24], constant volume depletion experiment (CVD) [25], swelling test [26], etc. These experiments are able to characterize the changes of formation fluid physical parameters such as component composition, density, viscosity, and saturation pressure during the reservoir development process [27,28,29]. Therefore, only infallible PVT experimental data can accurately represent formation fluid properties [30,31,32].
For the research into PVT experiment data accuracy, Hoffman et al. [33] proposed that the consistency of formation fluid component data could be judged by the curve drawn based on the defined Hoffman factor and the equilibrium constant measured by the formation fluid experiment. Bashbush [34] proposed that the components of the fluid system under different pressures, the equilibrium constant k, and the molecular weight of heavy components were calculated by the material balance method, and then the consistency of the fluid component data was verified by the equilibrium constant k. Whitson et al. [35] proposed that the material balance method could be applied to the constant volume depletion (CVD) experiment to judge the accuracy of CVD experiment data. Akpabio et al. [36] proposed that the consistency of CVD experiment data could be checked by the content of each component under different depletion pressures.
The accuracy of PVT experiment results is significant for the study of the phase characteristics of formation fluids [37,38,39]. However, the current methods are all aimed at reservoirs at normal temperature. There is still no systematic method for checking the accuracy of PVT experiment data at high temperature. In this paper, the material balance method, Hoffman method, and equilibrium constant method are modified by using the equilibrium constant calculation method at high temperature. A set of systemic consistency check methods for PVT experiment data is proposed for high-temperature oil and gas reservoirs combined with the three methods and the component verification method. This paper also takes the PVT experiment data of two groups of sampling fluids as examples to compare the consistency check results and proves that the consistency check method is accurate and reliable. This method can provide an important basis for the accuracy of PVT experiment data. What is more, the method provides an effective reference for the analysis of phase characteristics of high temperature formation fluids, especially gas condensate and volatile oil. It is of great significance for reservoir development and reservoir scheme design.

2. Check Method

In this paper, a systematic check method for the accuracy of PVT experiment data for oil and gas reservoirs at high temperature is proposed. The high temperature equilibrium constant calculation method is used to modify the material balance method, Hoffman method, and equilibrium constant method. The modified material balance method and the modified Hoffman method are used to verify the consistency of component data. The component check method and the modified equilibrium constant method are used to verify the consistency of the constant volume depletion experiment data. Through the above four processes, the PVT experiment data is comprehensively checked.

2.1. Component Consistency Check

The component data of the sampled fluid is expressed as the composition of light, medium, and heavy components of an oil-gas fluid system, usually determining the component phase characteristics of the fluid system. The component consistency check is divided into two processes: material balance method and Hoffman method. The material balance method evaluates component data according to the law of the whole component. The Hoffman method focuses on the evaluation of each component data. It is different for the properties of the component data evaluated by the two component consistency check methods. Therefore, the high accuracy of the fluid component data can be indicated only when both check methods show strong consistency.

2.1.1. Material Balance Method

The material balance method mainly checks the consistency between fluid components and gas phase and liquid phase components in the separator through the principle of material balance [34]. According to the liquid phase mole fraction xi, gas phase mole fraction yi, and global mole fraction zi of the sampling fluid, the following equation can be deduced:
y i z i = L · x i z i + F
A line with slope −L and intercept F can be drawn from xi and yi of the sampling fluid. If the linear correlation coefficient is less than 0.95 and more components in the figure deviate from the trend line, it indicates that the overall consistency of component data in the fluid system is poor and the accuracy is low. However, this method is not applicable to oil and gas reservoir fluids at high temperature because the effect of high temperature on calculating xi and yi is not included.
In this paper, the calculation method of equilibrium constant at high temperature is used to improve it [40]. Firstly, according to the fugacity equation,
f s i g = f s i l
Assuming that there is no interaction between dissolved gas and oil in the liquid phase, then:
ln y s i x s i = ln P s i s a t + v s i ( P P 0 i ) R T ln ( φ s i P )
According to the Clausius-Clapeyron equation, the saturation pressure is estimated as:
ln P s i s a t = A Δ H v a p i R T
Substitute Equation (4) into Equation (3), the equilibrium constant ki is:
k i = exp [ A Δ H v a p i + v s i ( P P 0 i ) R T ln ( φ s i P ) ]
By substituting the equilibrium constant ki into the material balance method for correction, the improved material balance method is:
k i x i z i = L x i z i + F
where ki is equilibrium constant for component i, ΔHvapi is the enthalpy change of component i in the gas phase, vsi is the partial molar volume of the solvent at the infinite dilution of component i, φsi is the fugacity coefficient of component i, Ai is a constant which is determined by the chemical properties of component i, P is the pressure during the experiment, P0i is the reference pressure of component i, T is the absolute temperature, R is the universal gas constant. Equation (5) considers the effect of enthalpy change during the phase change of components. Therefore, this equation has high applicability to the phase change law at high temperatures.
The equilibrium constant of component i under experimental conditions can be calculated by substituting experimental parameters into Equation (5). Then, with xi/zi of each component as the abscissa and kixi/zi of each component as the ordinate, a scatter plot corresponding to each component can be obtained. Then, the scatter points of each component are fitted linearly, and a line with slope −L and intercept F can be drawn. If the scatter points of each component fit this line less than 0.95, it indicates that the overall consistency of the component data is poor. The improved material balance method has higher accuracy for the consistency check of fluid component data in high temperature reservoirs and improves the check effect.

2.1.2. Hoffman Method

Hoffman et al. [33] distinguish the consistency of component data by a semi-log curve drawn by Fi factor and equilibrium constant ki. The formula for calculating the Fi factor is:
F i = 1 T b i 1 T s 1 T b i 1 T c i · lg p c i p s c
where Tbi is the boiling temperature of component i, Tci is the critical temperature of component i, Ts is the separator temperature, pci is the critical pressure of component i, and psc is the pressure of standard conditions.
According to the equilibrium constant ki and the Fi factor of each component, a straight line is drawn. The linear equation is:
lg k i = A 0 + A 1 F i
This line is a line with slope A1 and intercept A0. Like the discriminant process of the material balance method, the Hoffman method also determines whether the component data of the fluid system are consistent through the degree of component deviation. If the component data points deviate from the straight line seriously and the linear correlation coefficient is less than 0.95, this method indicates that the component data of the fluid system lack consistency. Unlike the material balance method, the Hoffman method can be accurate for the data points of each component. However, the Hoffman method does not apply to non-hydrocarbon and heavy components. Same as the material balance method, the Hoffman method also uses the calculation method at normal temperature when calculating the equilibrium constant ki. Therefore, this method is not suitable for reservoir fluids at high temperature.
In this paper, the high-temperature equilibrium constant method is used to improve Hoffman’s method, that is, Equation (5) is substituted into Equation (8). Then, the equation of the line is:
lg exp [ A Δ H v a p i + v s i ( P P 0 i ) R T ln ( φ s i P ) ] = A o + A 1 F i
By substituting each parameter of the experiment into Equations (7) and (5), the Fi and equilibrium constant ki of each component can be calculated. With Fi as the abscissa and lgki as the ordinate, a scatter plot of each component can be drawn. Similar to the material balance method, the scatter points of each component are fitted linearly, and a line with slope A0 and intercept A1 can be drawn. If the points of each component are close to the trend line and the linear correlation coefficient is greater than 0.95, it indicates that the data of this component are consistent and the experiment is accurate. The improved Hoffman method is more suitable for the consistency check of fluid composition data at high temperature reservoirs due to the use of the equilibrium constant calculation method at high temperature.

2.2. Constant Volume Depletion Experiment Consistency Check

The constant volume depletion (CVD) experiment measures the content of each component in two phases under different pressures [35,41]. The experiment data are equivalent to the content of each component when the component reaches phase equilibrium under each depletion pressure. The consistency check procedure of the constant volume depletion experiment is to process the data of each depletion pressure obtained from the CVD experiment, and then draw the result data into curves to judge the accuracy of the CVD experiment data. Common methods include the component check method and the equilibrium constant method.

2.2.1. Component Check Method

The component check method is judged by the semi-log curve formed by zi and depletion pressures in the CVD experiment [36]. With the lgzi of each component under each pressure as the ordinate and depletion pressures as the abscissa, a graph of the logarithm of the content of each component under each depletion pressure can be drawn. Normally, the curve of the heavy component will show a slight jump phenomenon. In addition to the heavy component, if the corresponding curve of a component shows obvious jump phenomenon and poor monotonicity, this method indicates that the CVD experiment data of this component are not reasonable. When the curve of a certain component appears to jump phenomenon, it proves that the content of the component changes unreasonably with the depletion pressure. The measurement error is larger at the pressure corresponding to the curves jump. The process of the component check method is relatively simple. The original experiment data can be checked without calculation. However, the component check method may lead to more component lines jumping for some heavy volatile oil fluids. Therefore, the consistency of the CVD experiment data needs to be further verified by the equilibrium constant method.

2.2.2. Equilibrium Constant Method

The equilibrium constant method mainly determines the consistency of CVD experiment data by calculating the equilibrium constants of each component in phase equilibrium under each pressure [42]. However, in the process of this method, the calculation of the equilibrium constant at high temperature is not used. In this paper, the equilibrium constant method which is suitable for high temperature reservoirs is used.
According to Equation (5), the equilibrium constant of each component under each depletion pressure can be calculated. The semi-log curve of depletion pressure and equilibrium constant can be drawn:
lg ( exp [ A Δ H v a p i + v s i ( P P 0 i ) R T ln ( φ s i P ) ] ) ~ P
By substituting each parameter of the CVD experiment into Equation (5), the equilibrium constant ki of each component can be calculated. With depletion pressures as the abscissa and the lgki of each component as the ordinate, a graph of lgki of each component under each depletion pressure can be drawn. Similar to the component check method, if the curves of each component show obvious jumping phenomenon and weak monotonicity, the consistency of the CVD experiment data of the fluid system is low. And when the curve of a certain component appears to jump phenomenon, it proves that the content of the component changes unreasonably with the depletion pressure. It is also due to the excessive error of pressure measurement in a certain range that the curves of this part appear to jump phenomenon. Compared with the component check method, the process of the equilibrium constant method is complicated. This method needs to calculate the equilibrium constant of each component under each pressure. However, the consistency check of the equilibrium constant method is more accurate. Due to the limitations of the component check method for heavy components, the check results of the equilibrium constant method are more reliable. Moreover, the improved equilibrium constant method is more suitable for the check of reservoirs with higher temperature.

2.3. Check Steps

The consistency check method process of the PVT experiment data is shown in Figure 1. The method checks the component data and the constant volume depletion experiment data, respectively, to judge the accuracy of the PVT experiment data of the fluid. The method is divided into the following six steps:
(1)
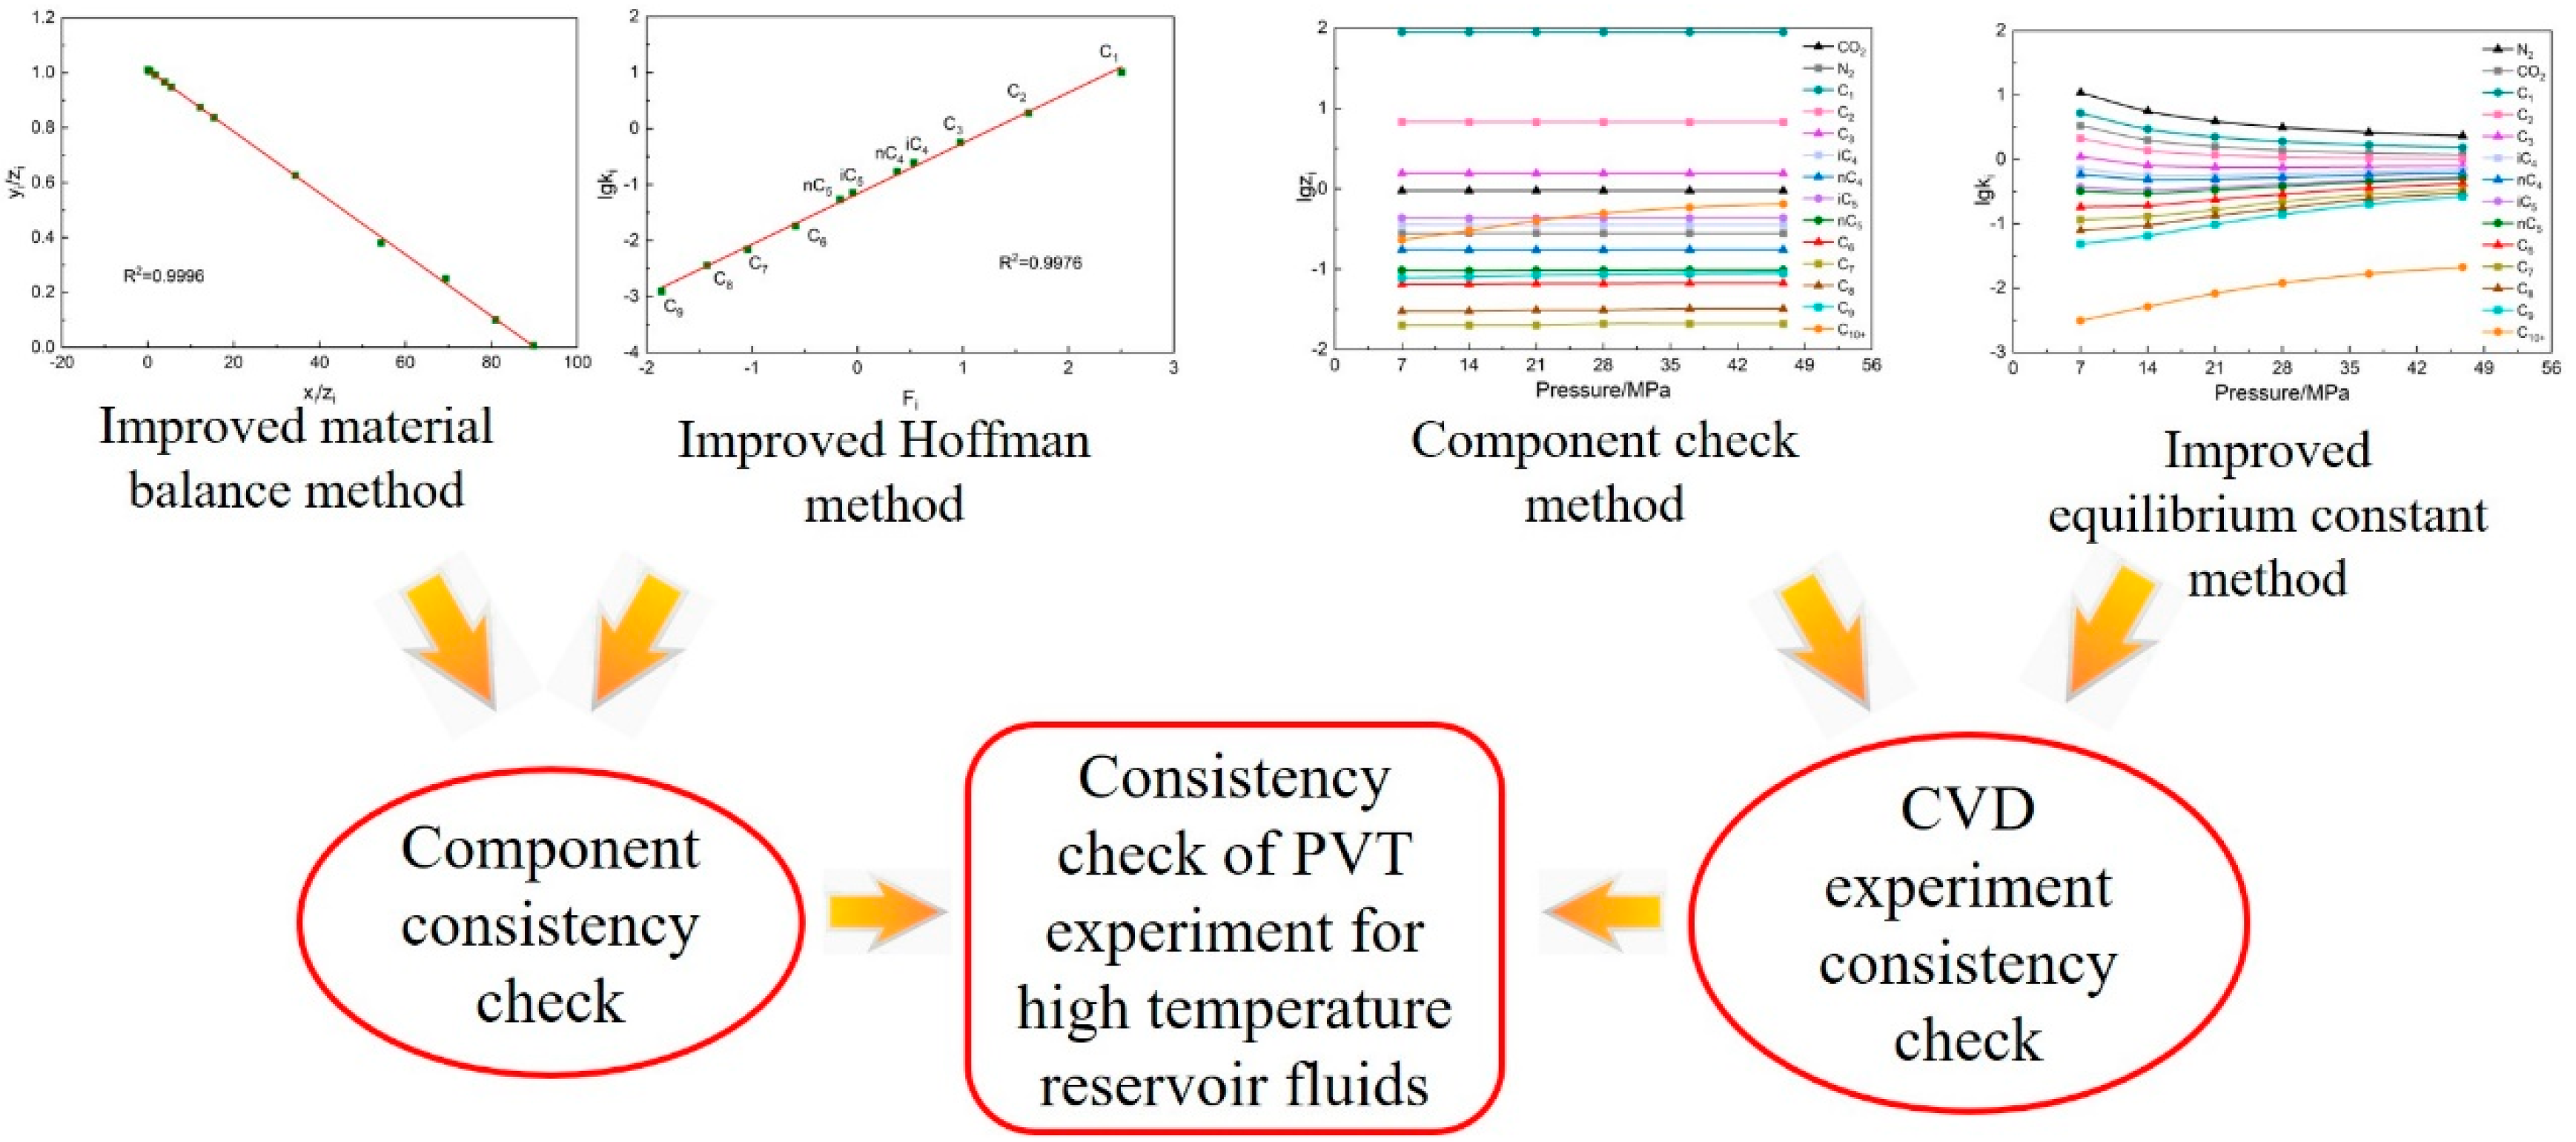
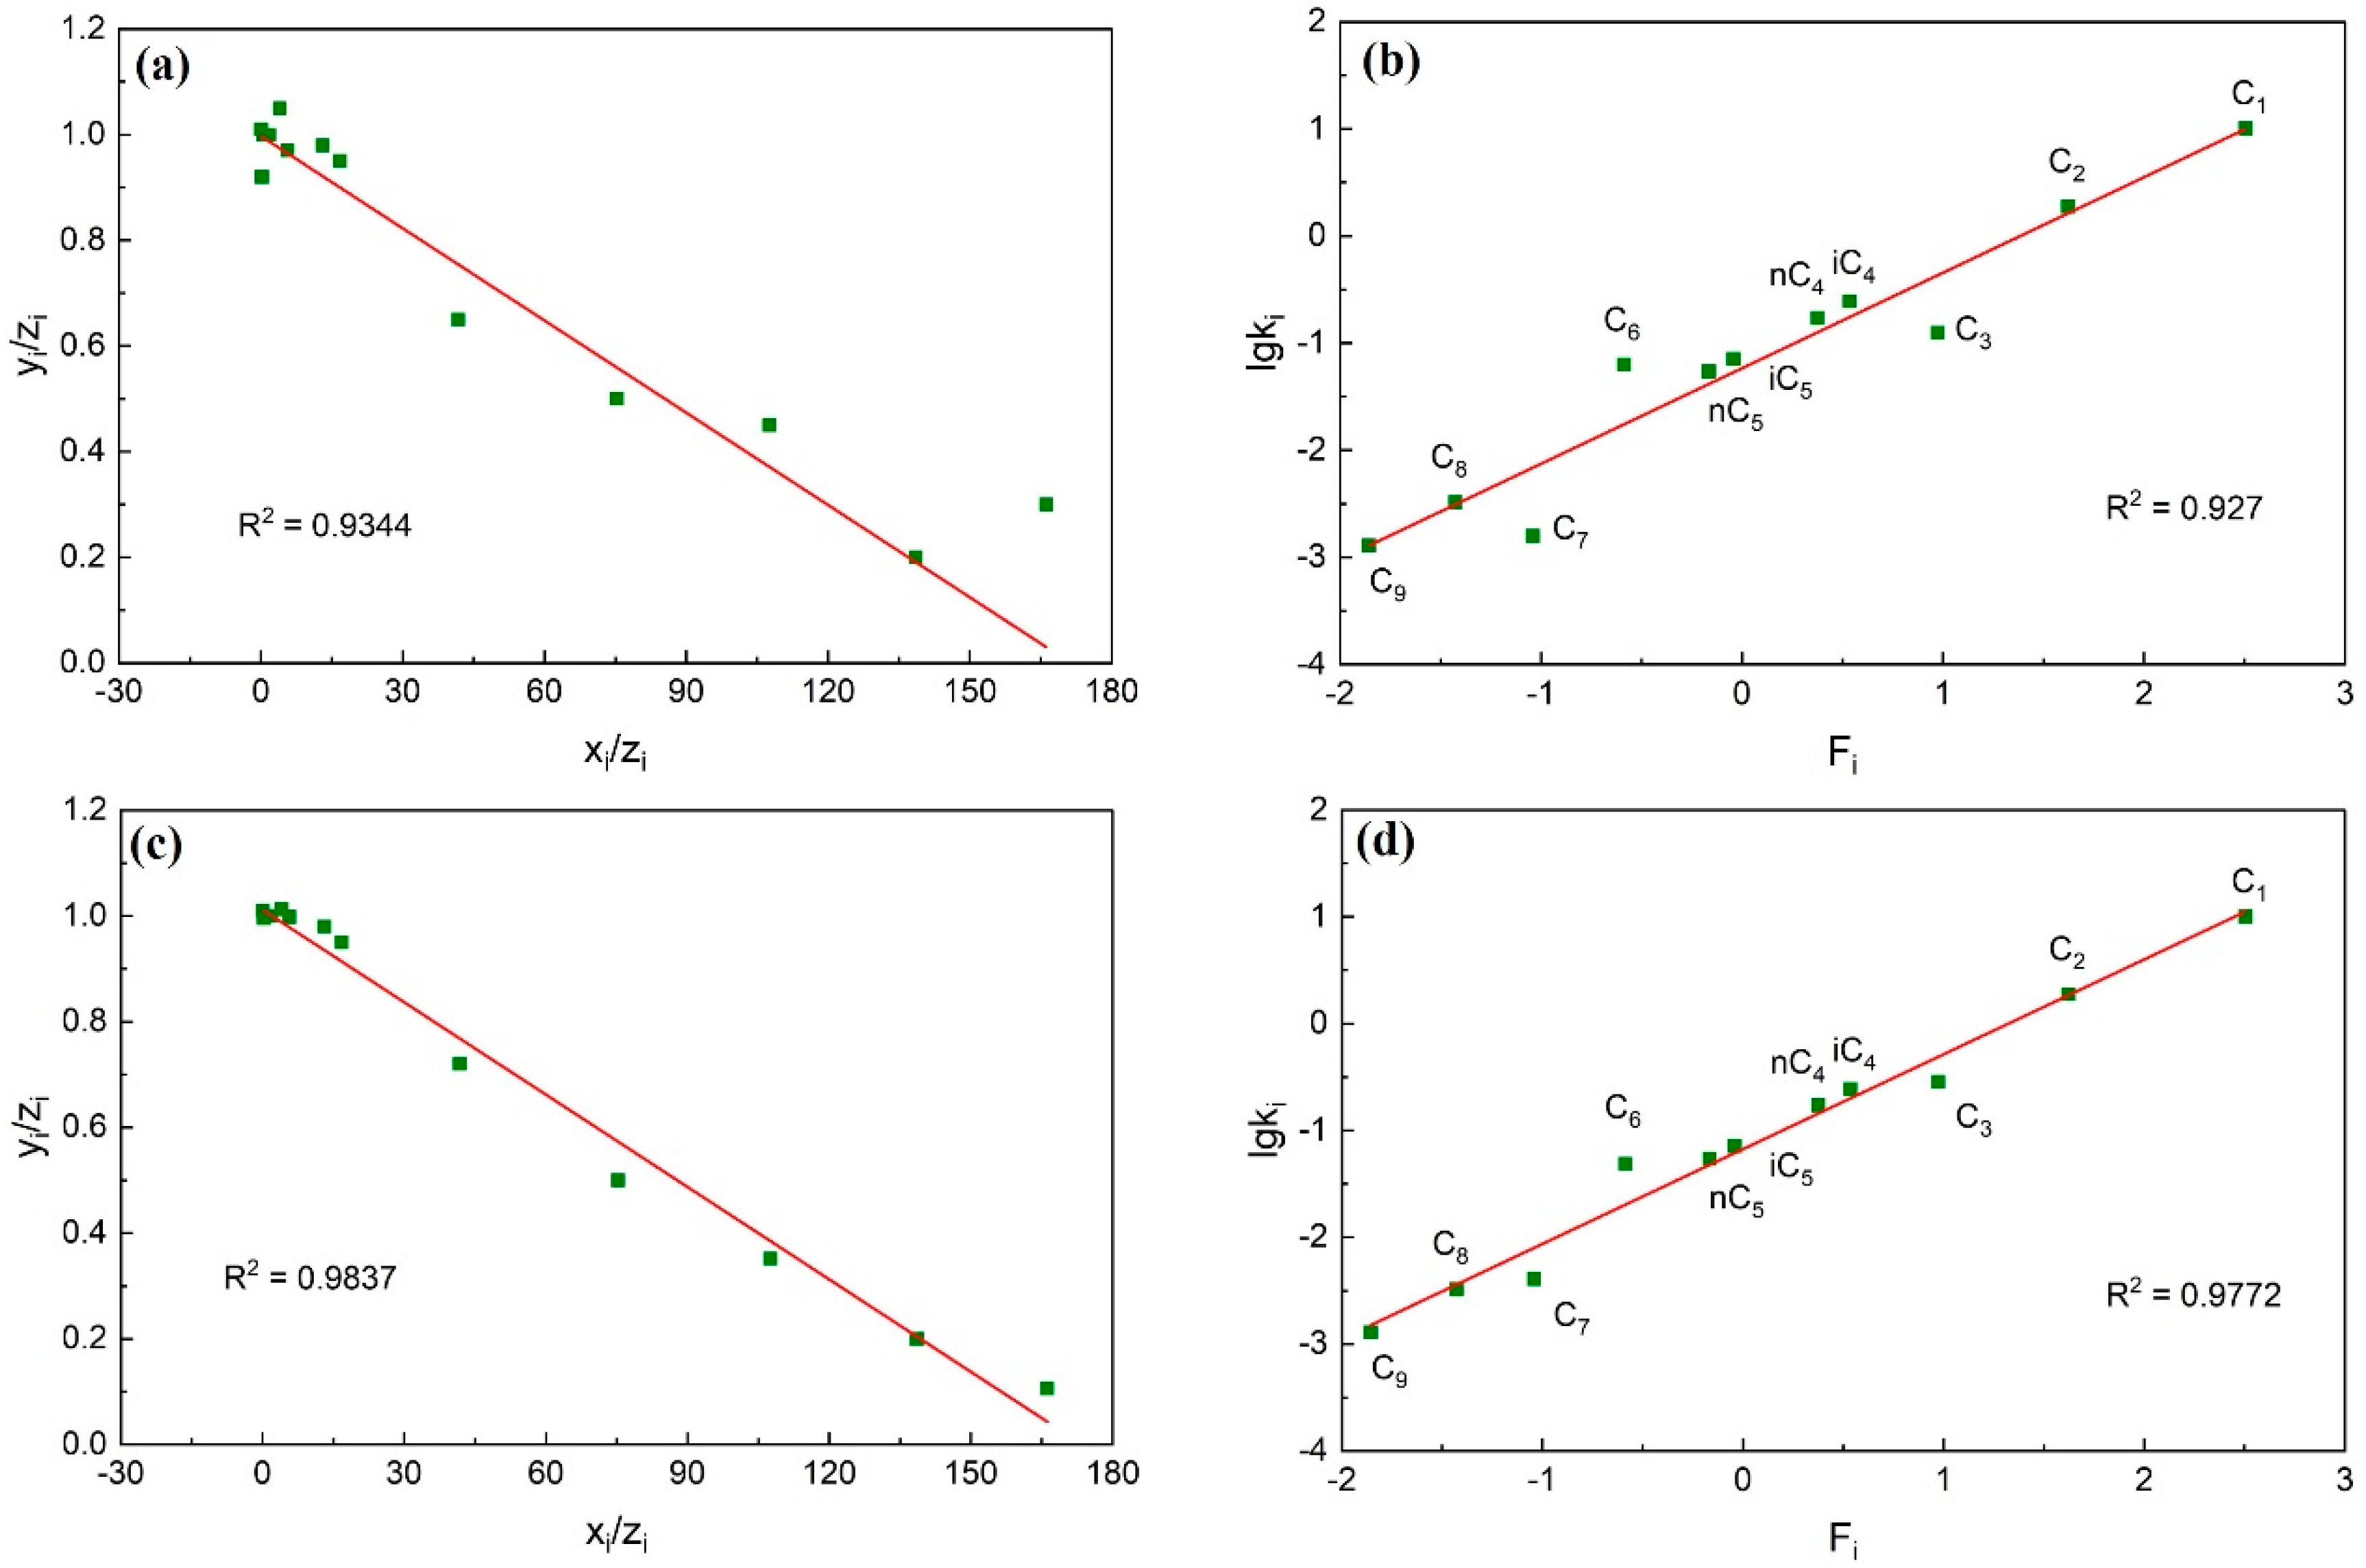
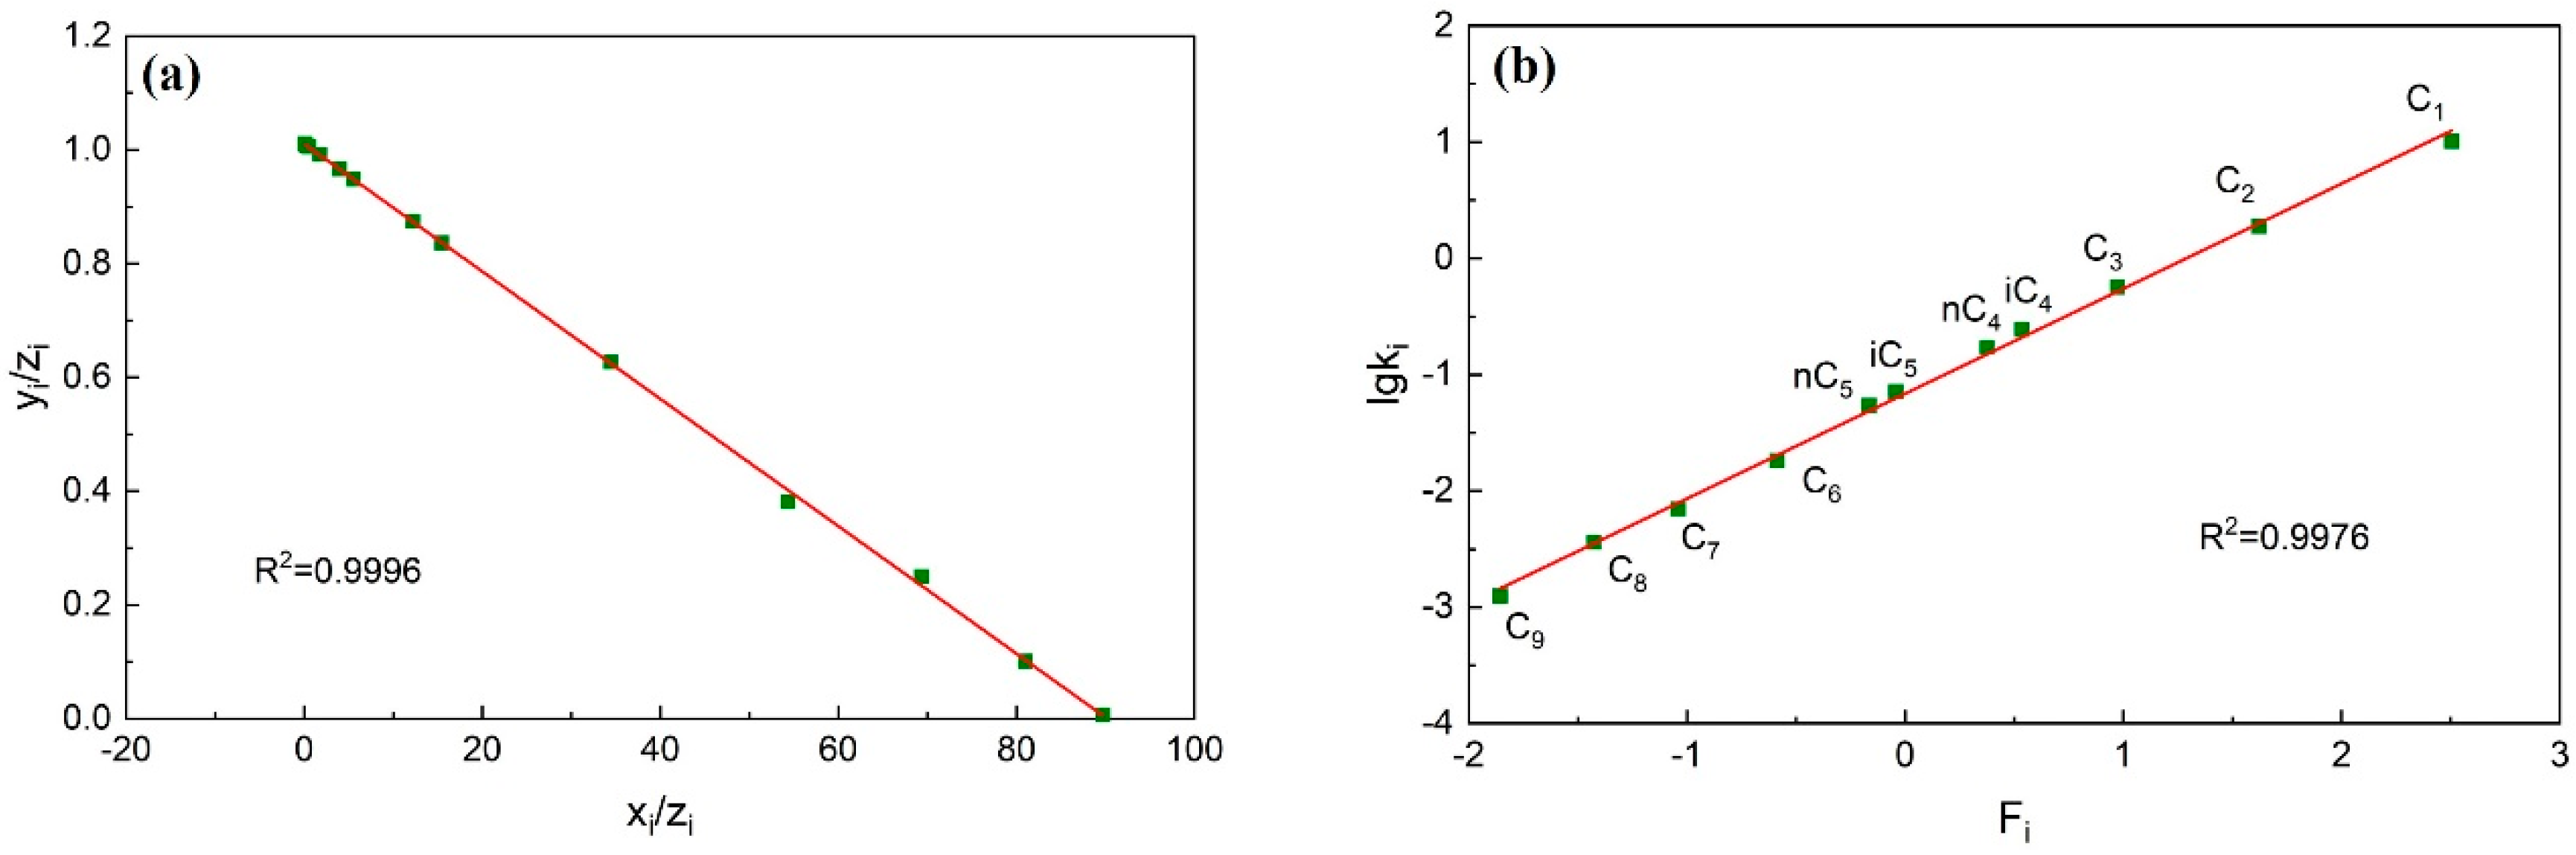
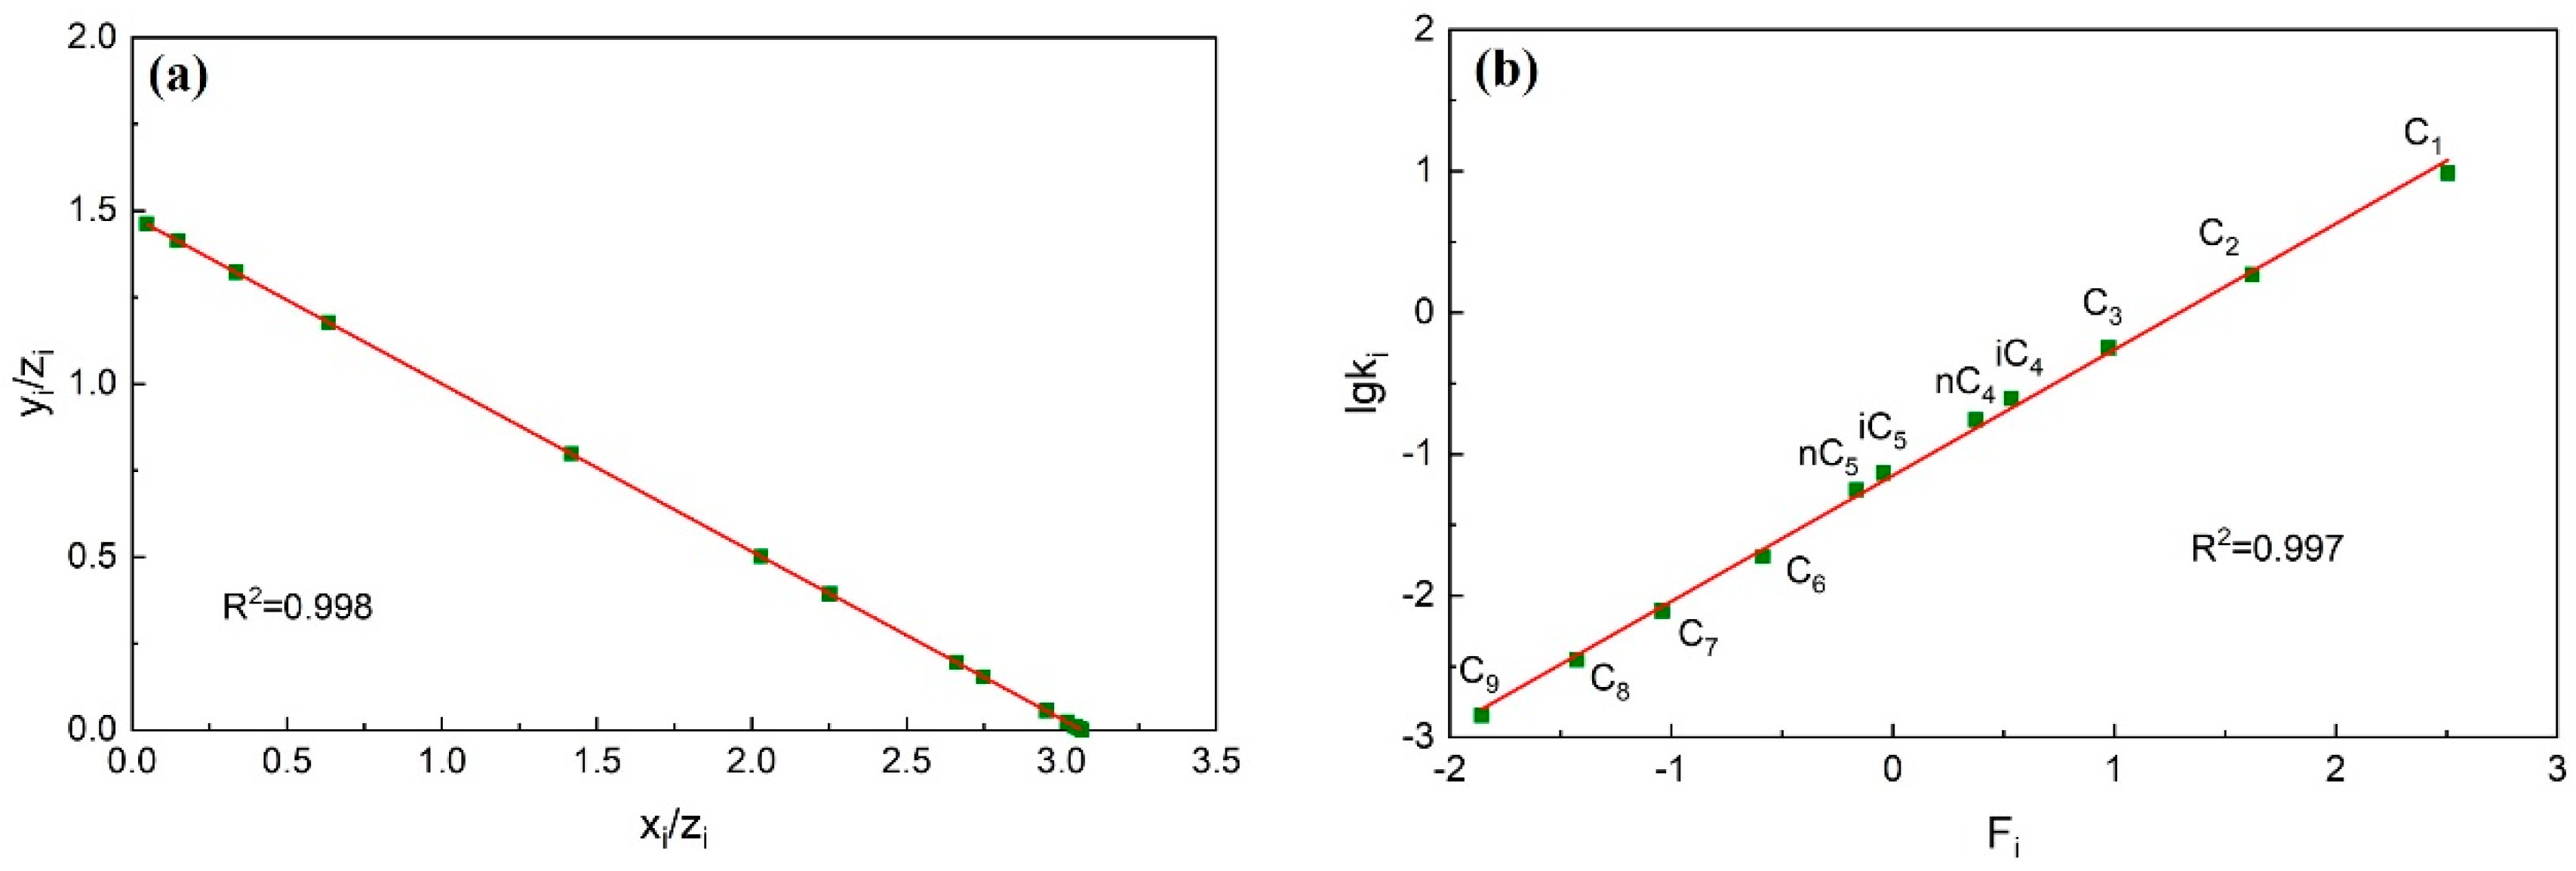
Calculate the data of each component using the improved material balance method. The data points of each component are calculated and form a trend line. Check whether each component data point deviates from the trend line, whether the linear correlation coefficient is greater than 0.95, and whether the overall consistency of the component is strong.
(2)
Calculate the data of each component using the improved Hoffman method. Similar to step (1), the data points of each component are calculated and form a trend line. Check whether the data points of non-heavy hydrocarbon components deviate from the trend line and whether the linear correlation coefficient is greater than 0.95.
(3)
If the plots formed in steps (1) and (2) all show that the data points do not deviate from the trend line and the linear correlation coefficient is greater than 0.95, it indicates that the consistency of this fluid system component data is strong. The accuracy of the component data is proved to be high.
(4)
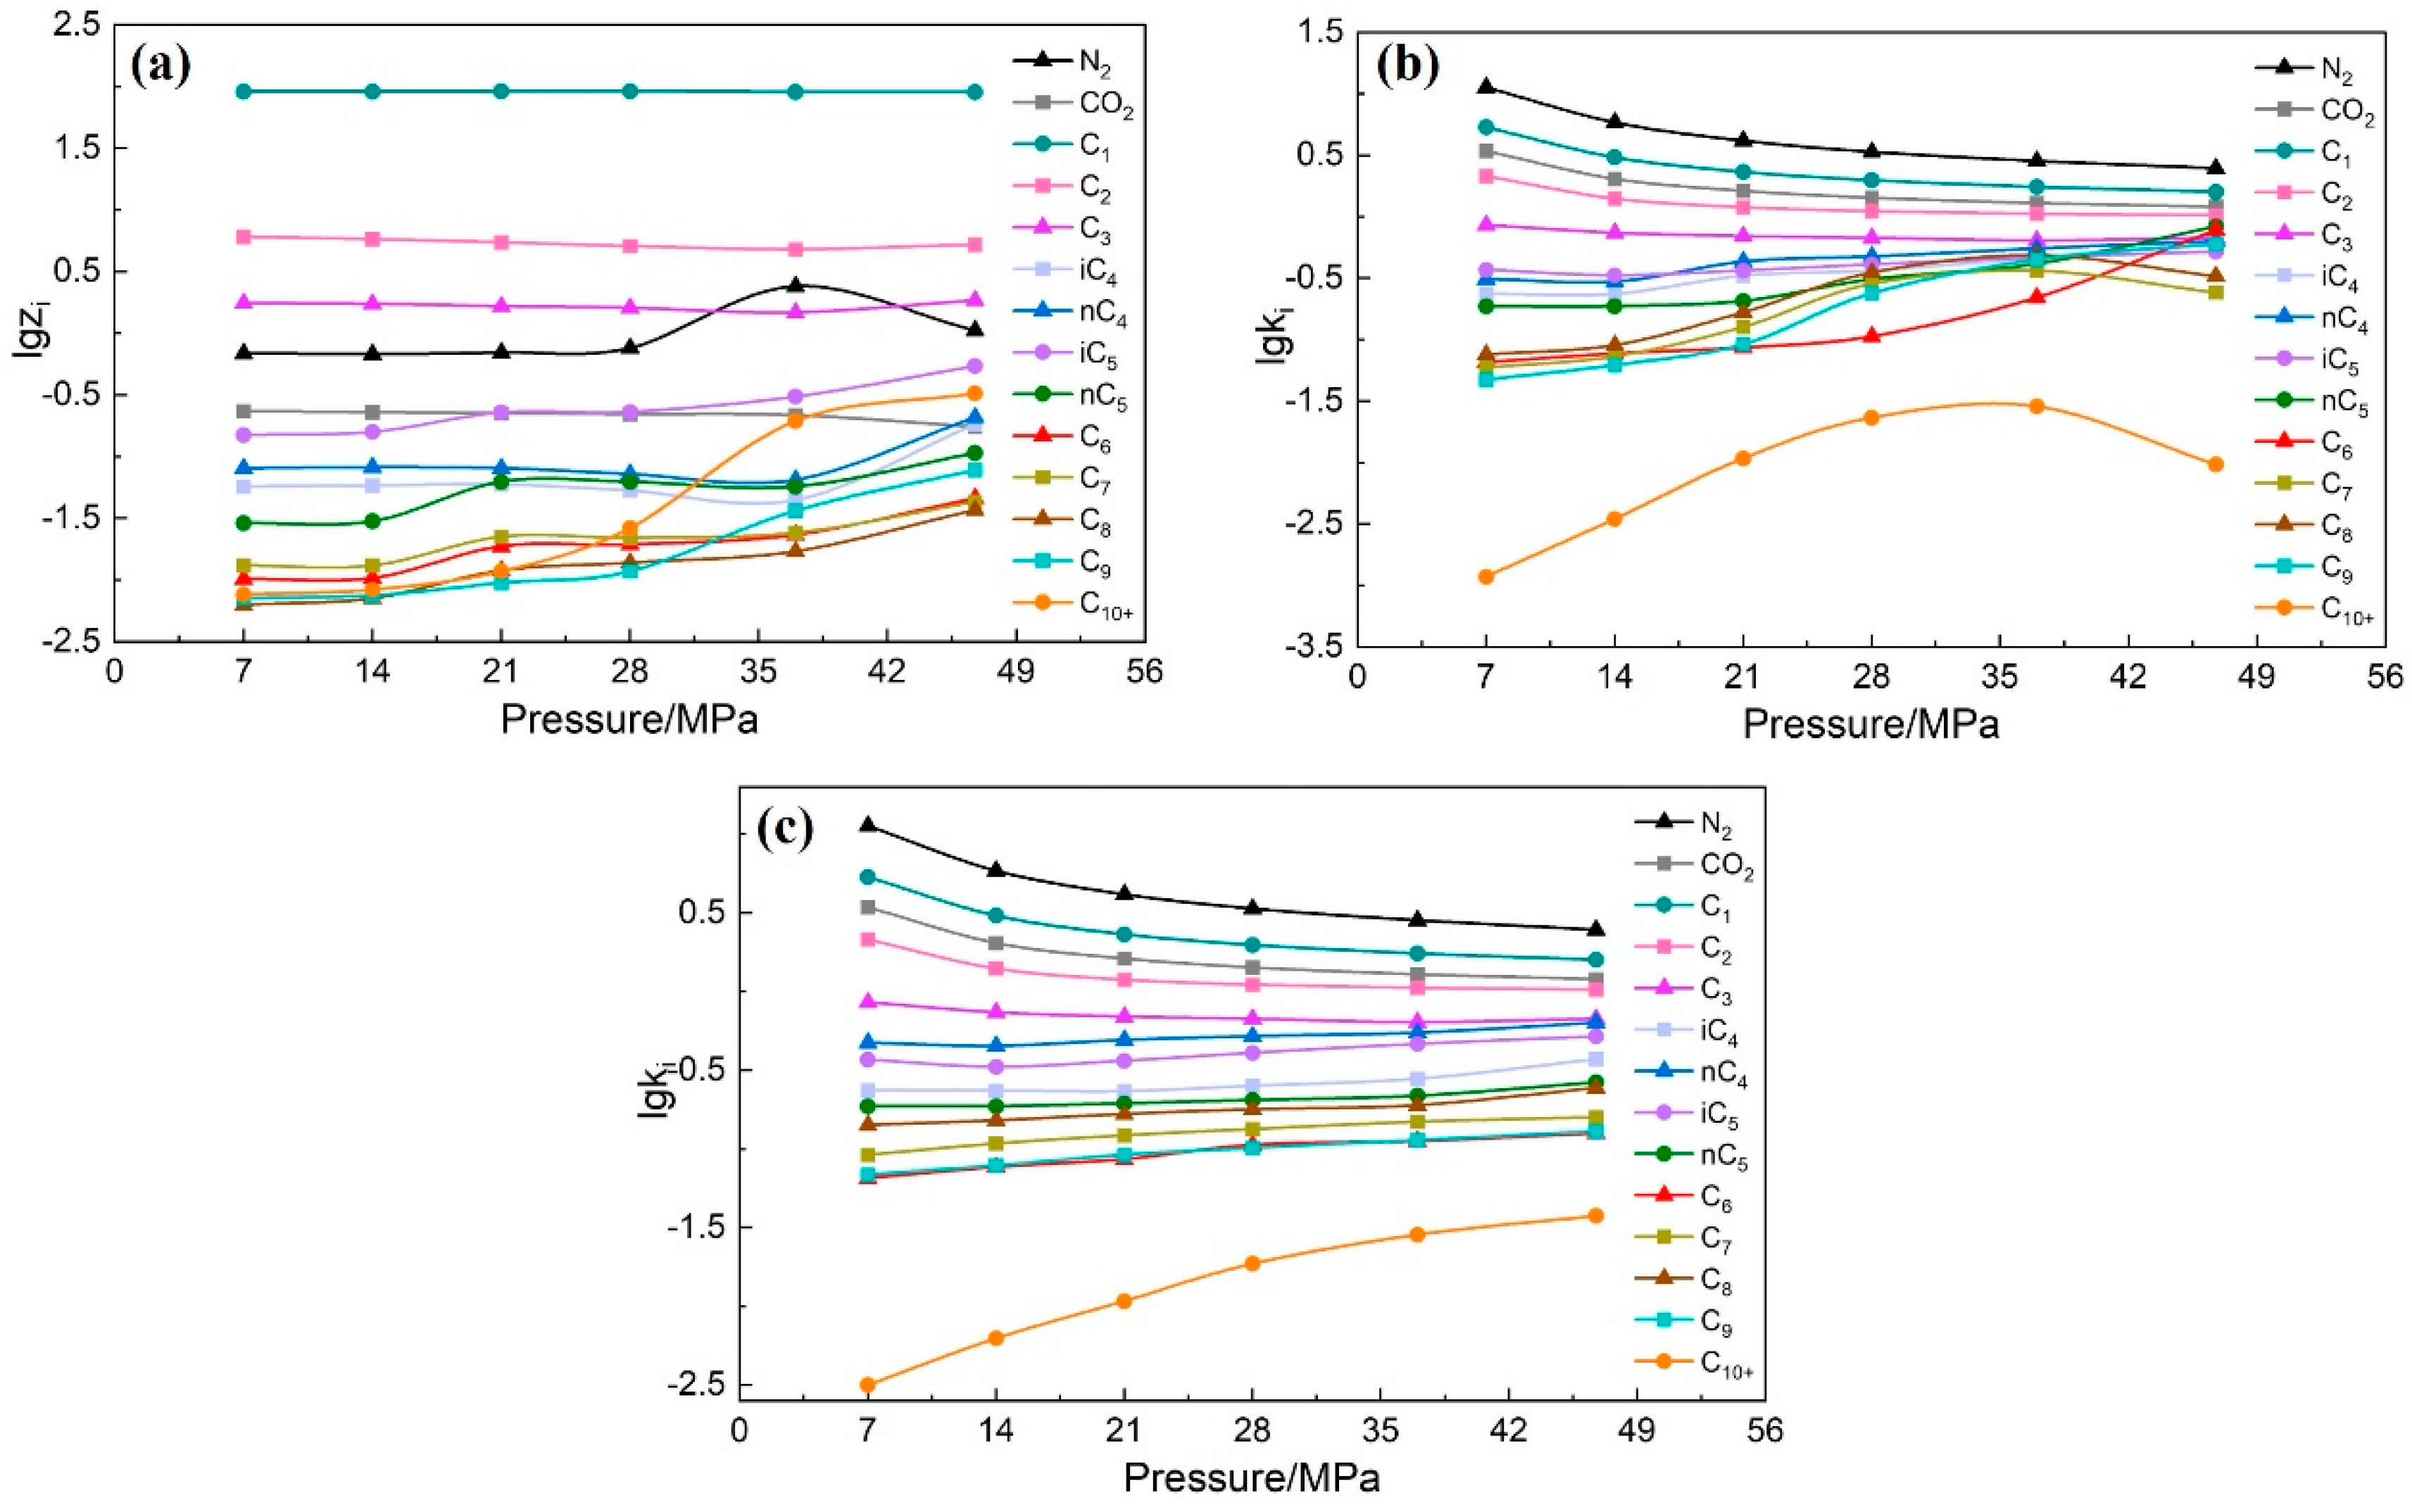
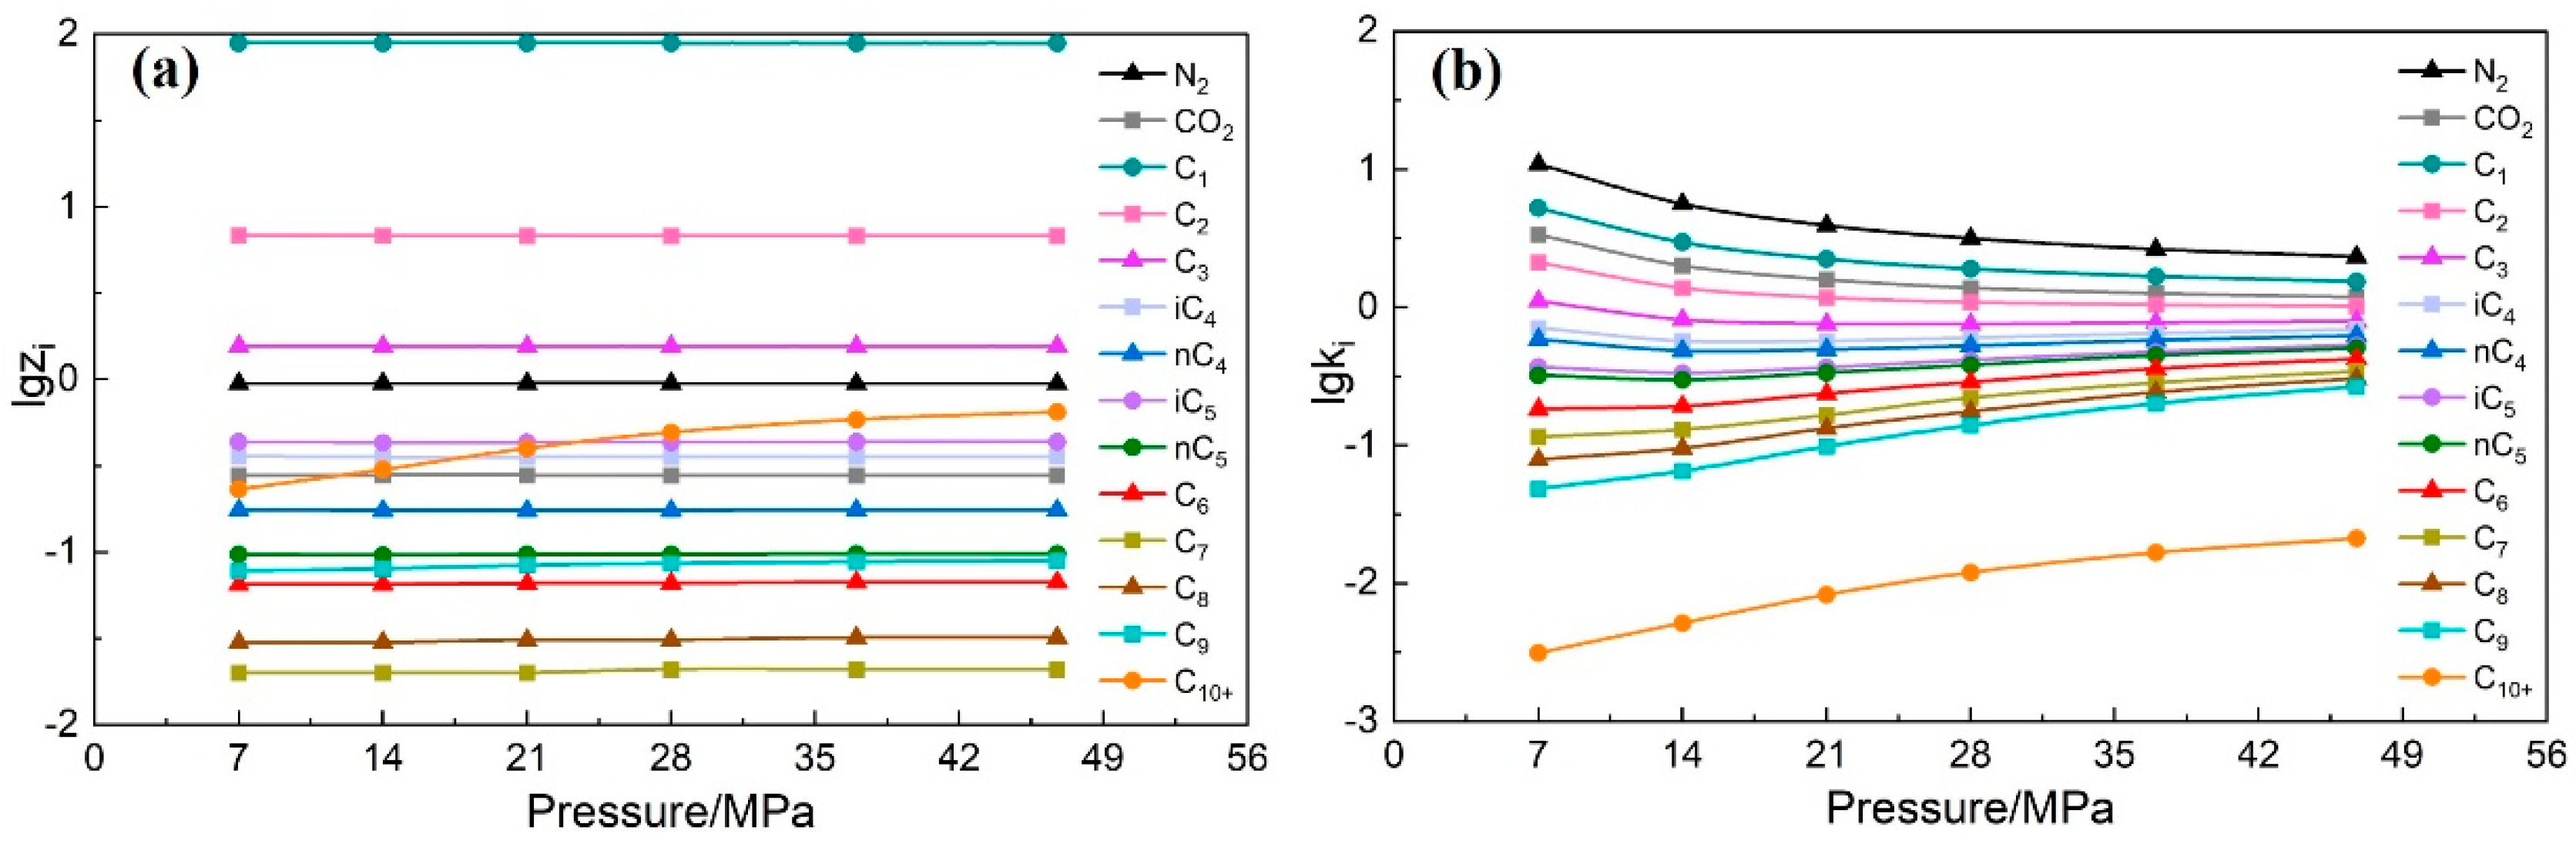
According to the component data under different depletion pressures and depletion pressures of the CVD experiment data, draw the semi-log curve plot. Check whether the curves of each component cross each other and whether the monotonicity is strong to conduct preliminary verification of the CVD experiment data.
(5)
Calculate the CVD experiment data using the improved equilibrium constant method. Similar to step (4), the semi-log curves plot of all components at different depletion pressures is drawn. Check whether each component curve jumps and crosses each other.
(6)
If the plots drawn in steps (4) and (5) all show that the curves do not jump or cross each other and the monotonicity of the curves is strong, it indicates that the consistency of the CVD experiment data is strong. The accuracy of the CVD experiment data is proved to be high.

3. Method Application

In this paper, this PVT consistency check method is used to check the fluid PVT data consistency of high temperature oil and gas reservoirs including component data and CVD experiment data of gas condensate fluid X and volatile oil fluid Y.

3.1. Gas Condensate

3.1.1. Fluid and Reservoir Properties

In this study, the gas condensate fluid X is used as the sampling fluid for the consistency study of the PVT experiment. The reservoir and fluid properties of fluid X are shown in Table 1. The reservoir where fluid X is located is a typical gas condensate reservoir with high temperature and pressure. The fluid system is characterized by a high content of medium components and sufficient elastic energy. The component content data of sampling fluid X are obtained through the PVT experiment, as shown in Table 2.
A flash experiment was carried out for fluid X. Firstly, the component content of fluid X was measured. Fluid X was then placed in a separator and subjected to formation temperature and pressure conditions. Then, the temperature and pressure of the separator were lowered to the surface ground temperature and pressure condition, and the content of the gas and liquid of each component was measured. Then, the constant volume depletion experiment was carried out on fluid X. Fluid X was placed in a constant volume container and subjected to formation temperature and saturation pressure. The pressure was then continuously lowered to measure the content of each component of the well fluid.
Fluid X is the gas condensate fluid containing more C1. In the formation, the phase change of the fluid X component is complex. Therefore, the accuracy of the PVT experiment data is particularly significant.

3.1.2. Check Result

The consistency result of fluid X checked by the material balance method is shown in Figure 2a. The component data points of fluid X deviate from the trend line seriously, and its linear correlation coefficient is less than 0.95. It is proved that the consistency of the component data of fluid X is poor due to large errors in the overall component data. The consistency result of fluid X checked by the Hoffman method is shown in Figure 2b. There is an analog between the pure liquid vapor pressure of a dissolved component and lgki. As a result, the points of components tend to be connected to a straight line. In Figure 2, the points of components are connected into a straight line which proves that there is a large measurement error. The Hoffman method showed that some component data points (such as C3, C6, and C7) deviate far from the trend line indicating the low consistency of the component data. It is presumed that there were measurement errors for the C3, C6, and C7 component data during the flash experiment, resulting in the low accuracy of the component data. Therefore, the experiment needs to be carried out again on fluid X.
Figure 2c,d shows the check results of the original consistency check method. The accuracy of the original consistency check results is low, and the errors of C3, C6, and C7 data cannot be checked under high temperature reservoir conditions. Therefore, the method proposed in this paper is more suitable for fluids in high-temperature reservoir conditions than the original method.
The consistency results of the CVD experiment checked by the component check method and the equilibrium constant method are shown in Figure 3. The curves formed by the CVD experiment data of fluid X are weak in monotonicity and cross each other without any regularity. Therefore, the consistency of the CVD experiment data of fluid X is poor, which could not provide a reference for the phase characteristics of the actual reservoir fluid. When the depletion pressure is between 28–36 MPa, the curves of some components intersect. It is proved that there are large errors in measuring the content of some components of 28–36 MPa, resulting in the poor accuracy of the CVD experiment. The CVD experiment for fluid X should also be carried out again.
Figure 3c shows the check result of the original consistency check method. Although the overall curve overlaps slightly, there is basically no crossover phenomenon. And when the depletion pressure is 28–36 MPa, the curve does not cross. It is proved that the accuracy of the original consistency check method is low, and it cannot check the error when the depletion pressure is 28–36 MPa. Therefore, the method proposed in this paper is more suitable for formation fluids under high temperature reservoir conditions than the original method.
After explaining to field personnel that the PVT experiment results of fluid X have poor accuracy, the PVT experiment of fluid X was carried out again. The consistency of the PVT experiment results is checked again in this paper.
The consistency results of the component data of fluid X after re-experiment are shown in Figure 4. In the material balance method check diagram and the Hoffman method check diagram, compared with the previous fluid component data check results, all the component data points of fluid X after re-experiment do not deviate from the trend line. Therefore, it is judged that the component data of fluid X after re-experiment is more consistent and accurate than the previous experiment results.
The consistency check of the CVD experiment for fluid X after the re-experiment is shown in Figure 5. Both the component check method and the equilibrium constant method show that the check curves of the fluid X CVD experiment data after the re-experiment are smoother than those of the previous experiment data. The curves of each component basically do not cross each other. Therefore, the CVD experiment of fluid X after the re-experiment is more consistent.

3.2. Volatile Oil

3.2.1. Fluid and Reservoir Properties

In this study, the volatile oil fluid Y is used as the sampling fluid for the consistency study of the PVT experiment. The reservoir and fluid properties of fluid Y are shown in Table 3. The component content data of fluid Y are shown in Table 4. Similar to fluid X, fluid Y also carries out a flash experiment and a constant volume depletion experiment. The experiment steps and conditions for fluid Y are the same as for fluid X.
The reservoir where fluid Y is located is a typical high temperature and pressure volatile oil reservoir with a complex phase change of fluid. Therefore, the fluid Y consistency check of the PVT experiment is indispensable.

3.2.2. Check Result

The consistency result of the fluid Y component data checked by the material balance method is shown in Figure 6a. The component data points of fluid Y are basically on the trend line. It is proved that the component data of fluid Y are consistent as a whole. The consistency result of the fluid Y component data checked by the Hoffman method is shown in Figure 6b. The data points of the non-heavy hydrocarbon components of fluid Y do not deviate much from the trend line. It indicates that the consistency is also strong for some component data points of fluid Y. The results of the two methods show that the component content data of fluid Y are reasonable and accurate.
The consistency results of the CVD experiment for fluid Y are shown in Figure 7. Both the component check method and the equilibrium constant method show that the CVD experiment data of fluid Y are consistent. There is no crossover between the curves of each component and the unsmooth curves. It is proved that the CVD experiment consistency of fluid Y is strong. Therefore, the CVD experiment data of fluid Y are accurate and reliable.

4. Conclusions

Aiming at the problem of how the current consistency check method for the PVT experiment is not suitable for high temperature reservoirs, this paper proposes a set of systematic check methods for the PVT experiment data of high-temperature reservoir fluid. This method improves the material balance method, the Hoffman method, and the equilibrium constant method using the calculation of equilibrium constant at high temperature. The accuracy of the PVT experiment data is judged by checking the consistency of the component data and the CVD experiment data using this method. This method can accurately check the accuracy of the PVT experiment and make it more accurate to characterize the phase change of formation fluid. Therefore, it further provides an important reference for the accuracy of reservoir development policy and production index forecasting. Based on the consistency check of the PVT experiment results of two sampling fluids in high temperature reservoirs, the following conclusions are drawn:
(1) This method improves the consistency check method for the PVT experiment by using the equilibrium constant calculation method at high temperature. The check results show that this method can better adapt to the PVT experiment data of reservoir fluids at high temperature.
(2) This method is used to check the two sampling fluids at high temperature reservoirs. For gas condensate fluid X, the consistency of the PVT experiment data is low. Then, the PVT experiment results of fluid X after re-experiment are checked again. The consistency check results of the component data and the CVD experiment data show that the accuracy of the re-experiment data of fluid X is higher. For volatile oil fluid Y, the check results show that the component data and the CVD experiment data of fluid Y are accurate. The above two sampling fluids prove that the method can be well applied to high temperature reservoirs.

Author Contributions

Validation, X.W.; Formal analysis, Y.H.; Data curation, J.S. (Jianchao Shi); Writing—original draft, L.Z.; Writing—review & editing, Y.Z.; Visualization, J.S. (Jiabang Song); Supervision, H.Y. All authors have read and agreed to the published version of the manuscript.

Funding

This study was supported by the Strategic Cooperation Technology Projects of CNPC and CUPB (ZLZX2020-02-04-04) and the National Natural Science Foundation of China (52074317).

Data Availability Statement

Not applicable.

Conflicts of Interest

The authors declare no conflict of interest.

Abbreviations

xiliquid phase mole fraction of component i
yigas phase mole fraction of component i
ziglobal mole fraction of component i
kiequilibrium constant of component i
ΔHvapienthalpy change of component i in the gas phase, kJ/mol
vsipartial molar volume of solvent at infinite dilution of component i, m3/mol
φsifugacity coefficient of component i
Aiconstant, determined by the chemical properties of component i
Ppressure during the experiment, kPa
P0ireference pressure of component i, kPa
Tabsolute temperature, K
Runiversal gas constant, kJ/(K·mol)
Tbiboiling temperature of component i, K
Tcicritical temperature of component i, K
Tsseparator temperature, K
pcicritical pressure of component i, kPa
pscpressure of standard conditions, kPa

References

  1. Liu, B.; Gao, S.; Mohammadian, E.; Hadavimoghaddam, F.; Tian, S.; Xu, Y.; Pan, Z. Comprehensive Outlook into Critical Roles of Pressure, Volume, and Temperature (PVT) and Phase Behavior on the Exploration and Development of Shale Oil. Energy Fuels 2022, 36, 14534–14553. [Google Scholar] [CrossRef]
  2. Ghasemi, M.; Whitson, C.H. PVT modeling of complex heavy oil mixtures. J. Pet. Sci. Eng. 2021, 205, 108510. [Google Scholar] [CrossRef]
  3. Bi, R.; Nasrabadi, H. Molecular simulation of the constant composition expansion experiment in shale multi-scale systems. Fluid Phase Equilib. 2019, 495, 59–68. [Google Scholar] [CrossRef]
  4. Panhuis, P.; Van Jaarsveld, J.; Cornelisse, P.; Ramaswami, S.; Janson, D.; Rien, D. PVT Data Making the Difference: Delineating the Size of Gas Caps in Stacked Reservoirs. In Proceedings of the SPE Reservoir Characterisation and Simulation Conference and Exhibition, Abu Dhabi, United Arab Emirates, 24–26 January 2023. [Google Scholar]
  5. Qian, K.; Yang, S.; Dou, H.; Wang, Q.; Huang, Y.; Wan, T.; Zhang, Y. Interaction of the CO2-oil system and displacement mechanisms during CO2 flooding. Pet. Sci. Bull. 2019, 4, 69–82. [Google Scholar]
  6. Li, J.; Yuan, B.; Clarkson, C.R.; Tian, J. A semi-analytical rate-transient analysis model for light oil reservoirs exhibiting reservoir heterogeneity and multiphase flow. Pet. Sci. 2023, 20, 309–321. [Google Scholar] [CrossRef]
  7. Liu, L.; Yao, J.; Sun, H.; Huang, Z.; Yan, X.; Li, L. Compositional modeling of shale condensate gas flow with multiple transport mechanisms. J. Pet. Sci. Eng. 2019, 172, 1186–1201. [Google Scholar]
  8. Apasov, R.T.; Apasov, G.T.; Varavva, A.I.; Vinogradov, D.V.; Polkovnikov, F.I.; Platonov, D.V.; Samolovov, D.A. Creating and Maintenance of Well’s Lift Models at Oil Rim Field’s Under-Gas-Cap Zones—Experience Novoport Oil and Gas-Condensate Field and Tazovskoe Oil and Gas-Condensate Field. In Proceedings of the SPE Russian Petroleum Technology Conference, Virtual, 26–29 October 2020. [Google Scholar]
  9. Luo, L.; Lee, J. Rate Transient Analysis in Unconventional Volatile Oil Reservoirs. In Proceedings of the SPE/AAPG/SEG Unconventional Resources Technology Conference, Virtual, 20–22 July 2020. [Google Scholar]
  10. Suhendro, S.; Energi, P.H. Review of 20 Years Hydrocarbon Gas Cycling in the Arun Gas Field. In Proceedings of the SPE/IATMI Asia Pacific Oil & Gas Conference and Exhibition, Jakarta, Indonesia, 17–19 October 2017. [Google Scholar]
  11. Franco, C.; Botero, O.; Zapata, J.; Mora, E.; Candela, C.; Castillo, A. Inhibited Gas Stimulation to Mitigate Condensate Banking and Maximize Recovery in Cupiagua Field. SPE Prod. Oper. 2013, 28, 154–167. [Google Scholar] [CrossRef]
  12. Phi, T.; Schechter, D. CO2 EOR Simulation in Unconventional Liquid Reservoirs: An Eagle Ford Case Study. In Proceedings of the SPE Unconventional Resources Conference, Calgary, AB, Canada, 15–16 February 2017. [Google Scholar]
  13. Qiao, R.; Chen, Z. Petroleum phase evolution at high temperature: A combined study of oil cracking experiment and deep oil in Dongying Depression, eastern China. Fuel 2022, 326, 124978. [Google Scholar] [CrossRef]
  14. Huang, X.; Zhang, Y.; He, M.; Li, X.; Yang, W.; Lu, J. Asphaltene precipitation and reservoir damage characteristics of CO2 flooding in different microscopic structure types in tight light oil reservoirs. Fuel 2022, 312, 122943. [Google Scholar] [CrossRef]
  15. Long, K.; Tang, Y.; He, Y.; Wang, Y.; Qin, J.; Tang, L. Fluid phase behavior during multi-cycle injection and production of underground gas storage based on gas-condensate reservoirs with oil rim. Geoenergy Sci. Eng. 2023, 226, 211769. [Google Scholar] [CrossRef]
  16. Li, G.; Xian, C.; Liu, H. A “One Engine with Six Gears” System Engineering Methodology for the Economic Development of Unconventional Oil and Gas in China. Engineering 2022, 18, 105–115. [Google Scholar] [CrossRef]
  17. Jia, H.; Yu, H.; Xie, F.; Yuan, Z.; Xu, K.; Wang, Y. Research on CO2 microbubble dissolution kinetics and enhanced oil recovery mechanisms. Chin. J. Theor. Appl. Mech. 2023, 55, 755–764. [Google Scholar]
  18. Qi, S.; Yu, H.; Yang, H.; Wang, Y.; Yang, Z. Experimental research on quantification of countercurrent imbibition distance for tight sandstone. Chin. J. Theor. Appl. Mech. 2021, 53, 2603–2611. [Google Scholar]
  19. Bai, L.-H.; Liu, B.; Du, Y.-J.; Wang, B.-Y.; Tian, S.-S.; Wang, L.; Xue, Z.-Q. Distribution characteristics and oil mobility thresholds in lacustrine shale reservoir: Insights from N2 adsorption experiments on samples prior to and following hydrocarbon extraction. Pet. Sci. 2022, 19, 486–497. [Google Scholar] [CrossRef]
  20. Chen, H.; Liu, X.; Jia, N.; Zhang, K.; Yang, R.; Yang, S. Prospects and key scientific issues of CO2 near-miscible flooding. Pet. Sci. Bull. 2020, 5, 392–401. [Google Scholar]
  21. Tang, M.; Wang, C.; Deng Xa Yang, H.; Lu, J.; Yu, H. Experimental investigation on plugging performance of nanospheres in low permeability reservoir with bottom water. Adv. Geo-Energy Res. 2022, 6, 95–103. [Google Scholar] [CrossRef]
  22. Yu, H.; Wang, S.; Yang, H.; Yang, Y.; Zhang, J.; Wang, Y.; Yang, W.; Lu, J. A Systematic Method to Investigate the EOR Mechanism of Nanospheres: Laboratory Experiments from Core to Micro Perspective. Energy Fuels 2023, 37, 2053–2065. [Google Scholar] [CrossRef]
  23. White, A.; Prefontaine, N.; Thomas, F.B. Pseudo Formation Volume Factor: A Consistent and Continuous Volumetric Assessment Across Multiphase Reservoirs, a Wet Gas to Black Oil Duvernay Formation Example. In Proceedings of the SPE Annual Technical Conference and Exhibition, Calgary, AB, Canada, 30 September–2 October 2019. [Google Scholar]
  24. Yao, J.; Gu, Y. A new experimental method for measuring the bubble-point pressures of the light crude oil–CO2 system at different CO2 concentrations. Fuel 2022, 311, 122526. [Google Scholar] [CrossRef]
  25. Wang, Y.; Jin, Z. Hydrocarbon mixture and CO2 adsorptions in A nanopore-bulk multiscale system in relation to CO2 enhanced shale gas recovery. Chem. Eng. J. 2021, 415, 128398. [Google Scholar] [CrossRef]
  26. Hamdi, H.; Clarkson, C.R.; Esmail, A.; Sousa, M.C. Importance of Multiple-Contact and Swelling Tests for Huff-n-Puff Simulations: A Montney Shale Example. In Proceedings of the SPE Annual Technical Conference and Exhibition, Virtual, 27–29 October 2020. [Google Scholar]
  27. Li, D.; Saraji, S.; Jiao, Z.; Zhang, Y. CO2 injection strategies for enhanced oil recovery and geological sequestration in a tight reservoir: An experimental study. Fuel 2021, 284, 119013. [Google Scholar] [CrossRef]
  28. Wang, Z.; Tu, H.; Guo, P.; Zeng, F.; Sang, T.; Wang, Z. Fluid behavior of gas condensate system with water vapor. Fluid Phase Equilib. 2017, 438, 67–75. [Google Scholar] [CrossRef]
  29. Zhao, Y.; Jin, Z. Hydrocarbon mixture phase behavior in multi-scale systems in relation to shale oil recovery: The effect of pore size distributions. Fuel 2021, 291, 120141. [Google Scholar] [CrossRef]
  30. Spivey, J.P. Comprehensive Quality Control for Constant Volume Depletion Laboratory Tests for Volatile Oils and Retrograde Gases. In Proceedings of the SPE Annual Technical Conference and Exhibition, Virtual, 27–29 October 2020. [Google Scholar]
  31. Luo, S.; Lutkenhaus, J.; Nasrabadi, H. A Framework for Incorporating Nanopores in Compositional Simulation to Model the Unusually High GOR Observed in Shale Reservoirs. In Proceedings of the SPE Reservoir Simulation Conference, Galveston, TX, USA, 10–11 April 2019. [Google Scholar]
  32. Tran, S.; Eghbali, S.; Dehghanpour, H. Studying Phase Behavior of Oil/Natural-Gas Systems for Designing Gas-Injection Operations: A Montney Case Study. SPE Res. Eval. Eng. 2020, 23, 943–961. [Google Scholar] [CrossRef]
  33. Hoffman, A.E.; Crump, J.S.; Hocott, C.R. Equilibrium constants for a gas-condensate system. J. Pet. Technol. 1953, 198, 1–10. [Google Scholar] [CrossRef]
  34. Bashbush, J.L. A method to determine k-values from laboratory data and its applications. In Proceedings of the SPE Annual Technical Conference and Exhibition, San Antonio, TX, USA, 4–7 October 1981. [Google Scholar]
  35. Whitson, C.H.; Torp, S.B. Evaluating Constant-Volume Depletion Data. J. Pet. Technol. 1983, 35, 610–620. [Google Scholar] [CrossRef]
  36. Akpabio, J.U.; Udofia, E.E.; Ogbu, M. PVT fluid characterization and consistency check for retrograde condensate reservoir modeling. In Proceedings of the SPE Nigeria Annual International Conference and Exhibition, Lagos, Nigeria, 5–7 August 2014. [Google Scholar]
  37. Chen, C.; Wang, Y.; Beagle, J.R.; Liao, L.; Shi, S.; Deng, R. Reconstruction of the evolution of deep fluids in light oil reservoirs in the Central Tarim Basin by using PVT simulation and basin modeling. Mar. Pet. Geol. 2019, 107, 116–126. [Google Scholar] [CrossRef]
  38. Varzandeh, F.; Stenby, E.H.; Yan, W. General approach to characterizing reservoir fluids for EoS models using a large PVT database. Fluid Phase Equilib. 2017, 433, 97–111. [Google Scholar] [CrossRef]
  39. Ghorayeb, K.; Mawlod, A.A.; Maarouf, A.; Sami, Q.; El Droubi, N.; Merrill, R.; El Jundi, O.; Mustapha, H. Chain-based machine learning for full PVT data prediction. J. Pet. Sci. Eng. 2022, 208, 109658. [Google Scholar] [CrossRef]
  40. Zirrahi, M.; Hassanzadeh, H.; Abedi, J. Experimental Measurements and Correlation of K-value, Viscosity, and Density Data for Mixtures of Light to Heavy Solvents and Athabasca Bitumen with Applications of ES-SAGD Process. In Proceedings of the SPE Canada Heavy Oil Technical Conference, Calgary, AB, Canada, 7–9 June 2016. [Google Scholar]
  41. Najafi-Marghmaleki, A.; Tatar, A.; Barati-Harooni, A.; Arabloo, M.; Rafiee-Taghanaki, S.; Mohammadi, A.H. Reliable modeling of constant volume depletion (CVD) behaviors in gas condensate reservoirs. Fuel 2018, 231, 146–156. [Google Scholar] [CrossRef]
  42. Ibeh, S.U.; Chubueze, S.E. PVT analysis: Validity checks and eos tuning techniques for retrograde gas condensate reservoirs. In Proceedings of the SPE Nigeria Annual International Conference and Exhibition, Lagos, Nigeria, 2–4 August 2016. [Google Scholar]
Figure 1. Check method for consistency of PVT experiment results.
Processes 11 02727 g001
Figure 2. Component consistency check diagram of fluid X. (a) Material balance method using the consistency check method at high temperature. (b) Hoffman method using the consistency check method at high temperature. (c) Material balance method using the original consistency check method. (d) Hoffman method using the original consistency check method.
Processes 11 02727 g002
Figure 3. CVD experiment consistency check diagram of fluid X. (a) Component check method. (b) Equilibrium constant method using the consistency check method at high temperature. (c) Equilibrium constant method using the original consistency check method.
Processes 11 02727 g003
Figure 4. Component consistency check diagram of fluid X after re-experiment. (a) Material balance method. (b) Hoffman method.
Processes 11 02727 g004
Figure 5. CVD experiment consistency check diagram of fluid X after re-experiment. (a) Component check method. (b) Equilibrium constant method.
Processes 11 02727 g005
Figure 6. Component consistency check diagram of fluid Y. (a) Material balance method. (b) Hoffman method.
Processes 11 02727 g006
Figure 7. CVD experiment consistency check diagram of fluid Y. (a) Component check method. (b) Equilibrium constant method.
Processes 11 02727 g007
Table 1. Reservoir parameters for sample fluid X.
Reservoir ParametersValue
Reservoir pressure, MPa121.68
Reservoir temperature, °C138.2
Saturation pressure, MPa51.48
Liquid molecular weight173
Liquid density (20 °C), kg/m3827.34
Table 2. The composition of fluid X.
ComponentCO2N2C1C2C3iC4nC4
Fluid X,
mol%
0.1751.05890.1345.2161.8470.1830.208
ComponentiC5nC5C6C7C8C9C10+
Fluid X,
mol%
0.5420.1070.0460.0430.0370.0780.326
Table 3. Reservoir parameters for fluid Y.
Reservoir ParametersValue
Reservoir pressure, MPa147.8
Reservoir temperature, °C124.3
Saturation pressure, MPa32.76
Liquid molecular weight157
Liquid density (20 °C), kg/m3762.1
Table 4. The composition of fluid Y.
ComponentCO2N2C1C2C3iC4nC4
Fluid Y,
mol%
1.780.4555.4810.434.481.782.63
ComponentiC5nC5C6C7C8C9C10+
Fluid Y,
mol%
1.172.062.792.621.763.439.14
Disclaimer/Publisher’s Note: The statements, opinions and data contained in all publications are solely those of the individual author(s) and contributor(s) and not of MDPI and/or the editor(s). MDPI and/or the editor(s) disclaim responsibility for any injury to people or property resulting from any ideas, methods, instructions or products referred to in the content.

