Article

CNN-LSTM to Predict and Investigate the Performance of a Thermal/Photovoltaic System Cooled by Nanofluid (Al2O3) in a Hot-Climate Location

by
Abdulelah Alhamayani
Mechanical Engineering Department, College of Engineering and Islamic Architecture, Umm Al-Qura University, P.O. Box 5555, Makkah 24382, Saudi Arabia
Processes 2023, 11(9), 2731; https://doi.org/10.3390/pr11092731
Submission received: 17 August 2023 / Revised: 7 September 2023 / Accepted: 11 September 2023 / Published: 13 September 2023

Abstract

:
The proposed study aims to estimate and conduct an investigation of the performance of a hybrid thermal/photovoltaic system cooled by nanofluid (Al2O3) utilizing time-series deep learning networks. The use of nanofluids greatly improves the proposed system’s performance deficiencies due to the rise in cell temperature, and time-series algorithms assist in investigating its potential in various regions more accurately. In this paper, energy balance methods were used to generate the hybrid thermal/photovoltaic system’s performance located in Tabuk, Saudi Arabia. Moreover, the generated dataset for the hybrid thermal/photovoltaic system was utilized to develop deep learning algorithms, such as the hybrid convolutional neural network (CNN) and long short-term memory (LSTM), in order to estimate and investigate the thermal/photovoltaic performance. The models were evaluated based on several performance metrics such as mean absolute percentage error (MAPE), root mean square error (RMSE), mean absolute error (MAE), and the coefficient of determination (R2). The results of the evaluated algorithms were compared and provided high accuracy ranges of 98.3–99.3%. It was observed that the best model among the others was CNN-LSTM, with an MAE of 0.375. The model was utilized to investigate the electrical and thermal performance of the hybrid thermal/photovoltaic application cooled by Al2O3 in addition to the hybrid thermal/photovoltaic cell temperature. The results show hybrid thermal/photovoltaic cell temperatures could be decreased to 43 °C, while the average daily thermal and electrical efficiencies were raised by 15% and 9%, respectively.
Keywords:
PV; PV/T; LSTM; GRU; CNN-LSTM

1. Introduction

Residential, public, and commercial buildings contribute 26% of global CO2 emissions, with 69.2% of these emissions coming indirectly from electrical and heat demands [1]. In 2020, almost 85% of the total energy produced by fossil fuels was consumed by the residential and building sectors in Saudi Arabia, contributing 241 metric tons of carbon dioxide [2]. In order to control and minimize these figures, renewable energy sources can be utilized as an alternative solution to generate clean energy. Through solar collectors and photovoltaic systems, the sun is a main renewable source to generate both electrical and thermal energy. Nonetheless, the solar photovoltaic industry has obstacles to overcome to achieve highly efficient electrical conversion, with recent panel efficiency reaching 23% [3]. One of the reasons for this poor number is the rise in solar cell temperature [4].
Studies have been implemented to increase power generation by cooling the PV system since the 1970s. Wolf developed an initial hybrid thermal/photovoltaic system to enhance PV electric output and utilize the absorbed heat simultaneously [5]. Recent research has been applied to achieve the same goal by utilizing either water or air as cooling fluid in order to absorb the excess heat stored in PV modules [6,7]. A spike in temperature can reduce the amount of power generated by about 0.5% for every 1 °C increase, so researchers are trying to keep the temperature of PV modules at 25 °C [8,9]. Using cooling methods that reduced the temperature of a PV module by 4.7 °C, Tang et al. were able to increase the PV’s electrical power and efficiency by 8.4% and 2.3%, respectively [10]. Káiser and Zamora evaluated the electrical performance by cooling the photovoltaic system through natural and forced convictions [11]. Their study showed a significant drop in photovoltaic surface temperature equal to 15 °C, resulting in an increase in electrical power of around 15% compared to the natural convection case.
In order to remove the heat that has been stored in solar cells, numerous researchers have recently attached phase-change material (PCM) and nanofluids to PV/T systems. The cooling of a PV/T system using three different fluids—water, alumina water nanofluid, and silver water nanofluid—was numerically explored by Khanjari et al. [12]. For alumina and silver water, respectively, the electrical efficiency of their system increased by 4.26% and 11.54% as compared to pure water. Manigandan and Kumar applied PCM with nanofluid to reduce the temperature of a PV/T system [13]. According to the study’s findings, using a PCM nanofluid system increased power generation by 15% when compared to using a single PV cell. Also, thermal efficiency increased by 8% for the PV/T systems and 12% for the PCM systems. Al-Waeli et al. studied electrical and thermal improvements using SiC nanoparticles and water-based nanofluid on a PV system [14]. The scientists discovered electrical and thermal capabilities improved by 24.1% and 100.191%, respectively, as compared to a traditional thermal/photovoltaic system. Nada et al. conducted an experimental study to compare the performance of PCM/nanofluid-PVT systems and a single PV system [15]. The result presented an increase in electrical efficiency in PCM-PVT and PCM/nanofluid-PVT systems of 5.7% and 13.2%, respectively.
Nowadays, machine learning (ML) and artificial neural networks (ANNs) are widely used to predict PV/T efficiency. Al-Waeli et al. developed ANN models to predict the thermal and electrical efficiency of three cooling PV/T systems [16]. Of all the developed artificial neural networks (ANNs), the best mean absolute error (MAE) for the thermal and electrical efficiency models was 1.42 and 1.164, respectively. Yousif and Kazem used three machine learning algorithms to predict PV/T power [17]. They found that the ANN model had the best performance, with an MAE of 0.65084. Furthermore, Al-Waeli et al. attempted to train a neural network model with the target of predicting the electrical performance of a thermal/photovoltaic system integrated with nano-phase-change material (PCM) and a nanofluid cooling system [18]. The best model in their study scored a rate of determination (R2) of 0.81 and a root mean square error (RMSE) of 0.371. Similarly, Shahsavar et al. aimed to forecast the performance of a building-integrated PV/T system through the utilization of machine learning [19]. They presented a highly accurate predictive model with R2 ranges of 0.9997–0.9999 for the dataset used in their study. Recently, Jakhar et al. developed a multi-layer perceptron (MLP) in order to match other researchers’ targets in predicting the performance of a thermal/photovoltaic system with nanofluids-based geothermal cooling [20]. The average rate of determination (R2) of their predictive model reached 98%, and the improved predicted cell temperature and electrical performance were 32.1 °C and 10.66%, respectively. Similarly, Diwania et al. attempted to prognosticate the performance of hybrid thermal/photovoltaic systems operated by pure water and Fe/water nanofluid through the utilization of a Gaussian process regression model [21]. The rate of determination (R2) and mean absolute error (MAE) achieved by the proposed model were 96% and 11.6, respectively. Margoum et al. used K-Nearest Neighbor (K-NN) to predict the electrical generation of a Ag/water-based thermal/photovoltaic system [22]. The reported R2 and mean square error (MSE) of the developed model were roughly 82% and 16.47, respectively.
The need for the utilization of thermal/photovoltaic systems cooled by nanofluids in hot-climate regions is a necessity to improve the generation of electricity and heat. The potential of implementing this application can be well investigated by leveraging recent time-series neural networks to guarantee precise predictions. The above-mentioned studies focused on predicting the electrical and thermal performance of various PV/T applications utilizing conventional machine learning algorithms. To the best of the author’s knowledge, there is no study that has applied time-series (deep learning neural networks) models to forecast the proposed system’s performance. Therefore, this study aims to utilize hybrid deep learning neural networks to predict and investigate PV/T performance at a hot-climate location. The main objectives of the current paper are as follows:
(1)
Numerically study the effect of cooling a PV/T system with alumina nanofluid (Al2O3) in Tabuk, Saudi Arabia.
(2)
Develop neural network algorithms using long short-term memory (LSTM), gradient recurrent unit (GRU), convolutional neural network (CNN), hybrid LSTM-GRU, and hybrid CNN-LSTM to train the numerical data and predict the PV/T performance.
(3)
Evaluate the developed models based on various metrics, including the coefficient of determination (R2), mean absolute percentage error (MAPE), the root mean square error (RMSE), and mean absolute error (MAE).

2. Methodology

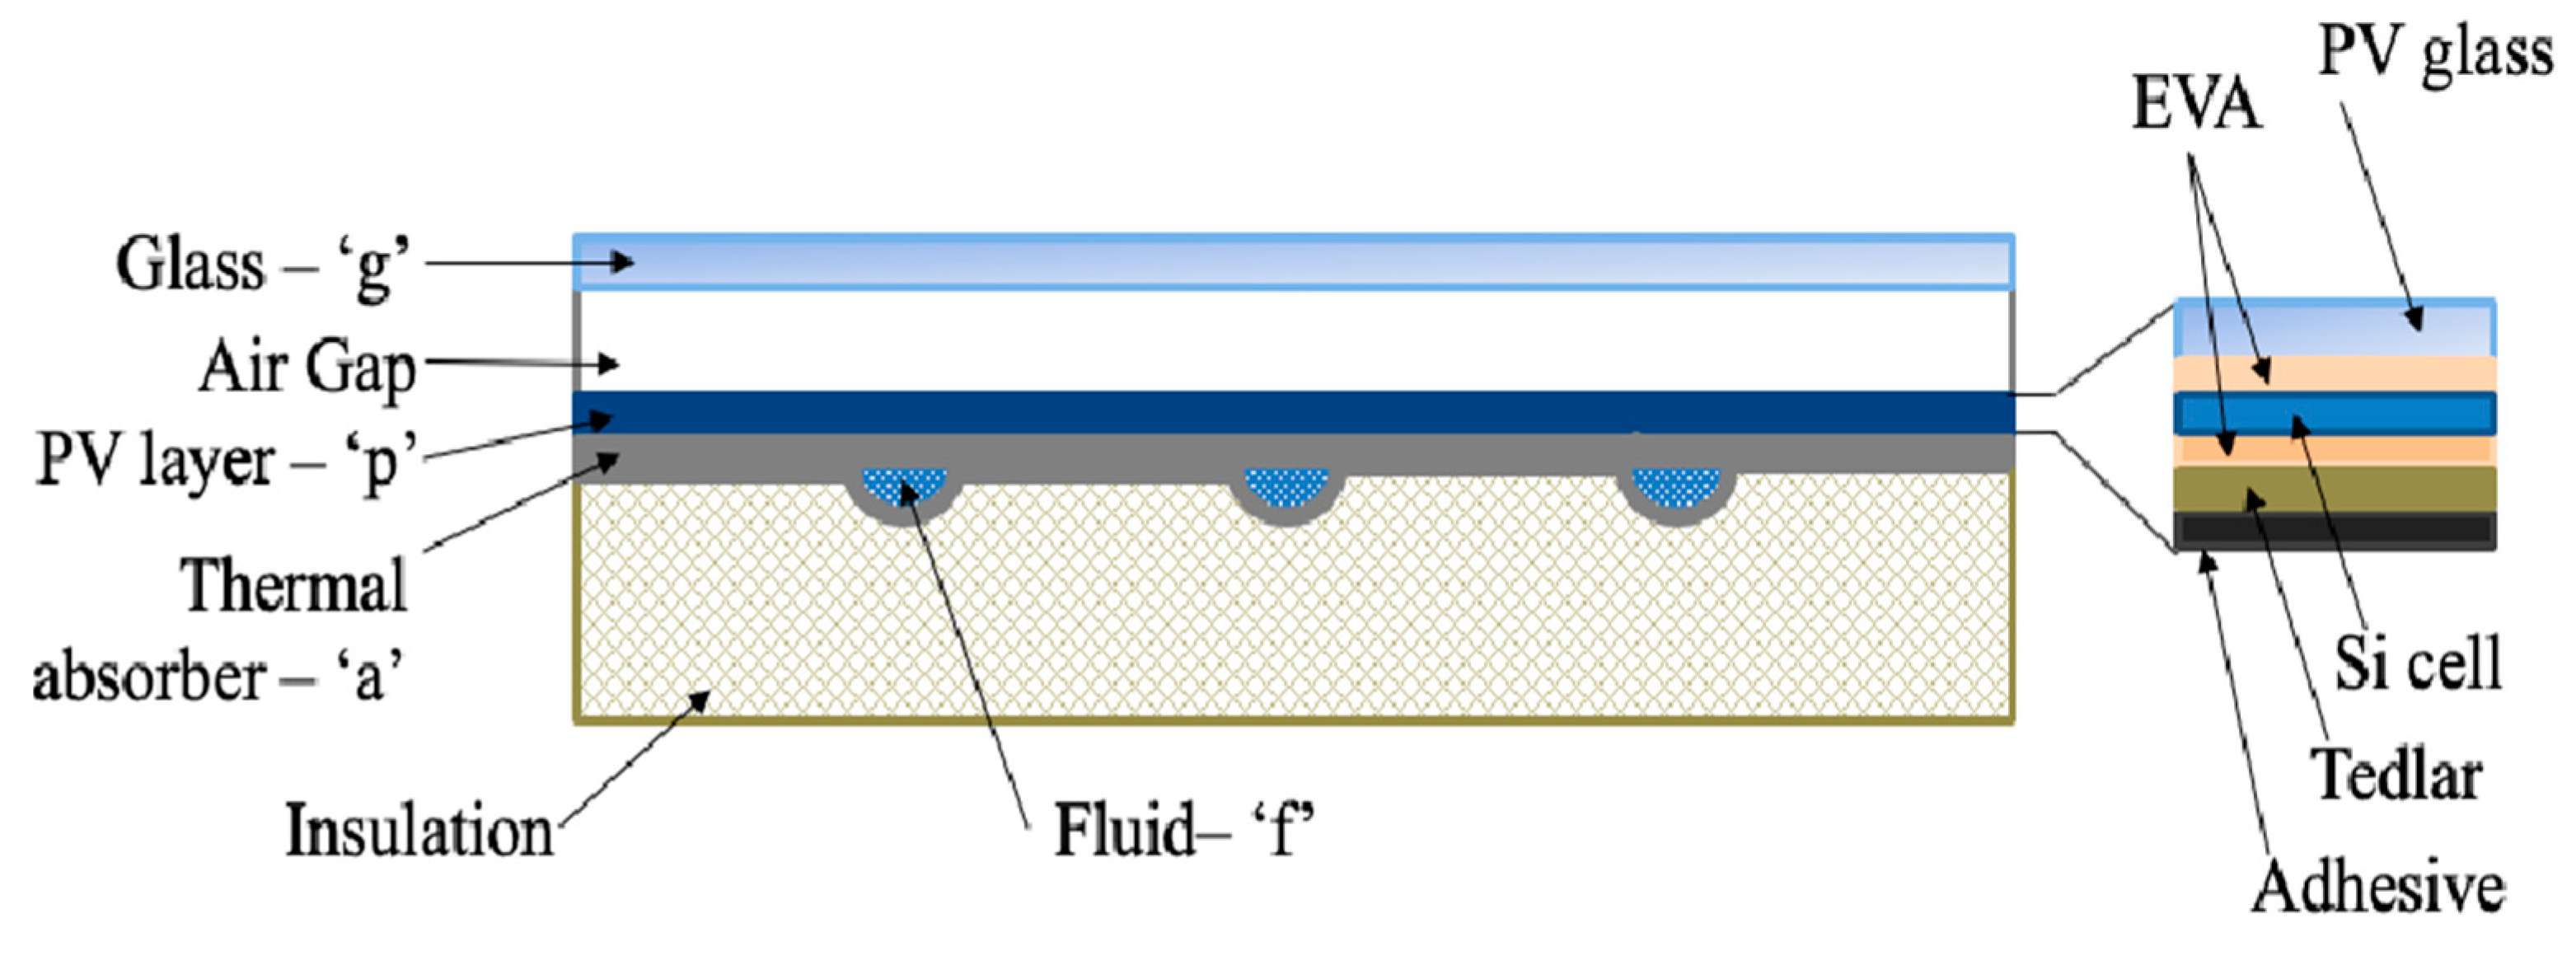
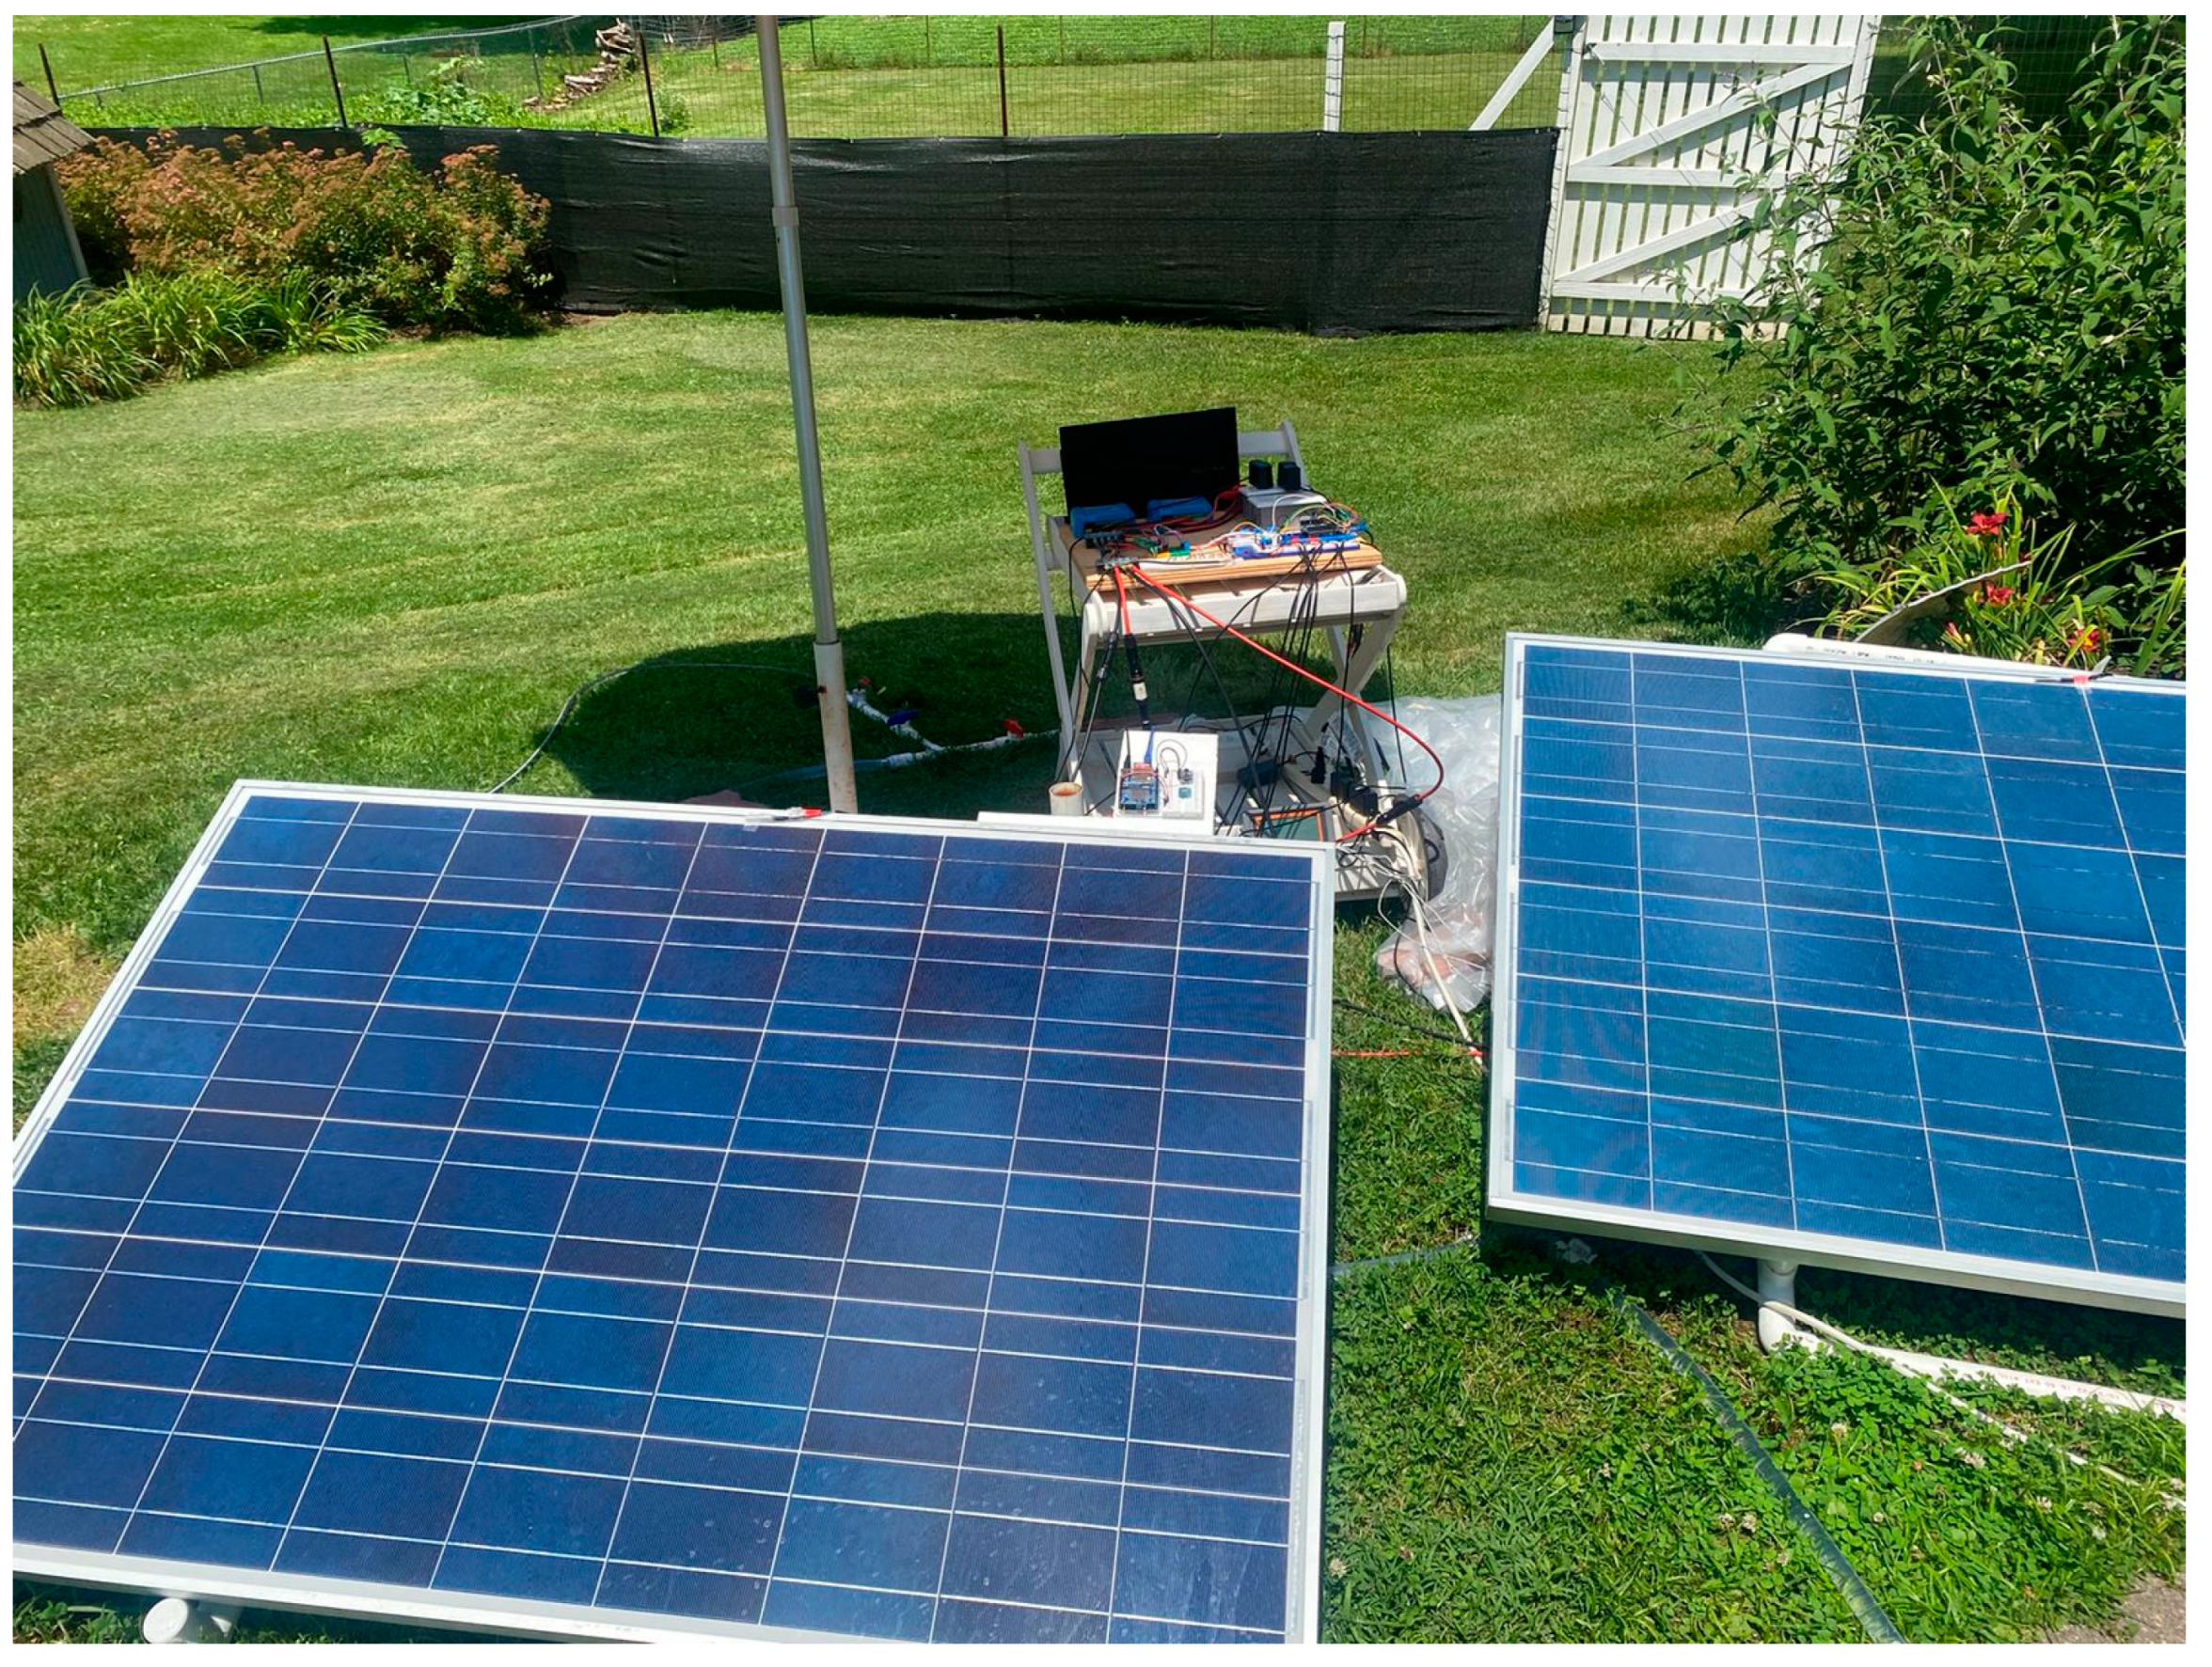
2.1. PV/T System Modeling

An analytical model was developed based on the analysis of the integration of a PV/T system into a residential building. The performance of the proposed system was analyzed by applying the laws of thermodynamics. This section provides the relevant equations for analyzing the PV/T system.
Cell temperature, thermal gain, outlet fluid temperature, and electrical and thermal efficiency are the primary factors to be considered when assessing a PV/T system. Utilizing the resistances to conduction, convection, and radiation heat transfer, energy balance equations are applied to the PV/T system to derive the theoretical expressions of the parameters. An illustration of the cooling system connected to the PV module is shown in Figure 1. Equation (1) provides the expression for computing the temperature of the cell based on the energy balance between glass and Tedlar [23].
T c = α τ e f f G + U c a T a + U c t T b s U c a + U c t
where G represents the solar radiation that the PV module absorbs, Uca represents the total heat transfer coefficient from the photovoltaic cell to the surroundings through glass, Uct represents the entire heat transfer coefficient from the photovoltaic cell to fluid through Tedlar, Ta is the ambient temperature, Tbs represents the temperature of the module’s back surface, and α τ e f f represents the multiplicity of functional absorptivity and transmittivity and can be expressed in Equation (2) [24].
α τ e f f = τ g α c β c + 1 β c α t e d η C , e l c β c
The back surface temperature expression obtained from the energy balance between Tedlar and rear surface is given by Equation (3) [25].
T b s = h p 1 α τ e f f G + U g t T a + U a w T w U g t + U a w
where Ugt is the total heat transfer coefficient from the top surface of the photovoltaic cell to Tedlar through the photovoltaic cell, Uaw is the entire heat transfer coefficient from the absorbent sheet to the working fluid, and hp1 is the penalty factor caused by the combination of the photovoltaic cell material, glass sheet, and EVA [26].
U g t = U c a x U c t U c a + U c t
h p 1 = U c t U c a + U c t
The outlet fluid temperature, based on the equilibrium condition for heat balance when fluid streams below the solar cell, is expressed by Equation (6) [27].
T f o = h p 1 h p 2 α τ e f f G U T + T a 1 exp F A P V T U T m w C w + T f i exp F A P V T U T m w C w
where UT is the total heat transfer coefficient from the thermal/photovoltaic system to the atmosphere, APVT is the area of the PV module or panel, mw is the working fluid mass flow rate, Cw is the specific heat capacity of the working fluid, and hp2 is the penalty factor caused by the existence of an interaction between the working fluid and Tedlar [24].
h p 2 = U t w U t w + U g t
From the integration of Equation (6), the average working fluid temperature can be expressed by Equation (8).
T f = h p 1 h p 2 α τ e f f G U T + T a 1 1 exp F A P V T U T m w C w F A P V T U T m w C w + T f i exp 1 exp F A P V T U T m w C w F A P V T U T m w C w
Equation (9) provides the thermal energy produced from the combined hybrid thermal photovoltaics system, and Equation (10) expresses the thermal efficiency of the hybrid thermal photovoltaics system [28].
Q u = m w C w T f o T f i
η t h = Q u A P V T G
The efficiency of the solar cell can be evaluated by Equation (11) [29,30].
η c e = η S T C [ 1 β 0 T c T S T C ]
According to [31], the properties of the nanofluid (Al2O3) used in the hybrid thermal photovoltaics system are modeled using the following equations:
ρ n f = ρ f b 1 + ρ n p
C n f = 1 ρ f b C f p + C n p ρ n p ρ n f
u n f = 1 + 2.5 u f b                                                                         for       < 0.05 u n f = 1 + 2.5 + 6.5 2 u f b                                                           for       > 0.05  
k n f = k f b k n p + 2 k f b 2 ( k f b k n p ) k n p + 2 k f b ( k f b k n p ) + ρ n p C n p 2 . 2 x T n f 3 π d n p u f b
where ρ n f , C n f , u n f , k n f ,   a n d   are nanofluid density, nanofluid specific heat capacity, nanofluid viscosity, nanofluid thermal conductivity, and nanofluid volume fraction. The term fb refers to the base fluid, which is water. Table 1 illustrates all the utilized properties in developing the mathematical model of the thermal/photovoltaic system.
Figure 1. A schematic illustration of the PV module’s integrated cooling system [32].
Processes 11 02731 g001

2.2. Predictive Models and Evaluations

The mathematical model was validated by ongoing research by Abdulwahed Mushabbab et al. [33]. Figure 2 shows the hybrid thermal/photovoltaic system used to validate the mathematical model in the section above. The developed thermal/photovoltaic system model was used to generate a dataset for a 1-year period (8760 h), depending on historical weather data and generated PV power data. The weather data used to simulate the mathematical model were obtained from historical weather data for Tabuk, Saudi Arabia [34]. Additionally, the PV power output for the proposed location was generated through the implementation of the pvlib Python model [35]. The generated data were utilized to train multiple neural networks to predict the influence of nanofluid on cooling a thermal/photovoltaic system. All the simulated parameters were trained in predictive algorithms based on eliminating the highly correlated features within the generated thermal/photovoltaic system dataset. The features used to train the models were cell temperature, PV output power, ambient temperature, wind speed, cloud cover, relative humidity, Reynolds number, inlet temperature to cool the thermal/photovoltaic system, thermal efficiency, and electrical efficiency.
The software that was used to train, validate, and test the models was the R statistical computing environment (version 4.1.1), deploying Keras and TensorFlow libraries [35,36]. Similarly, all data were normalized using the min–max method to accelerate the computation time during the training session. The dataset applied by models was divided into training (80%), validation (10%), and testing (10%) to avoid overfitting during the training phase. Figure 3 shows a block diagram that clarifies all the processes necessary to predict the performance of the thermal/photovoltaic collector cooled by nanofluid. All pre-processing techniques were explained in detail in previous works [37,38].
Long short-term memory (LSTM), gradient recurrent unit (GRU), convolutional neural network (CNN), hybrid LSTM-GRU, and hybrid CNN-LSTM are the time-series deep learning models suggested in this work. In general, time-series deep learning algorithms typically deploy previously determined timesteps, called lookback periods, for all the features of the utilized dataset, including the response data, to predict the next-step value. Additionally, data can be batched through the utilization of time-series deep learning algorithms to effectively obtain the best predictive model and avoid overfitting issues. All models’ architectures are described as follows:

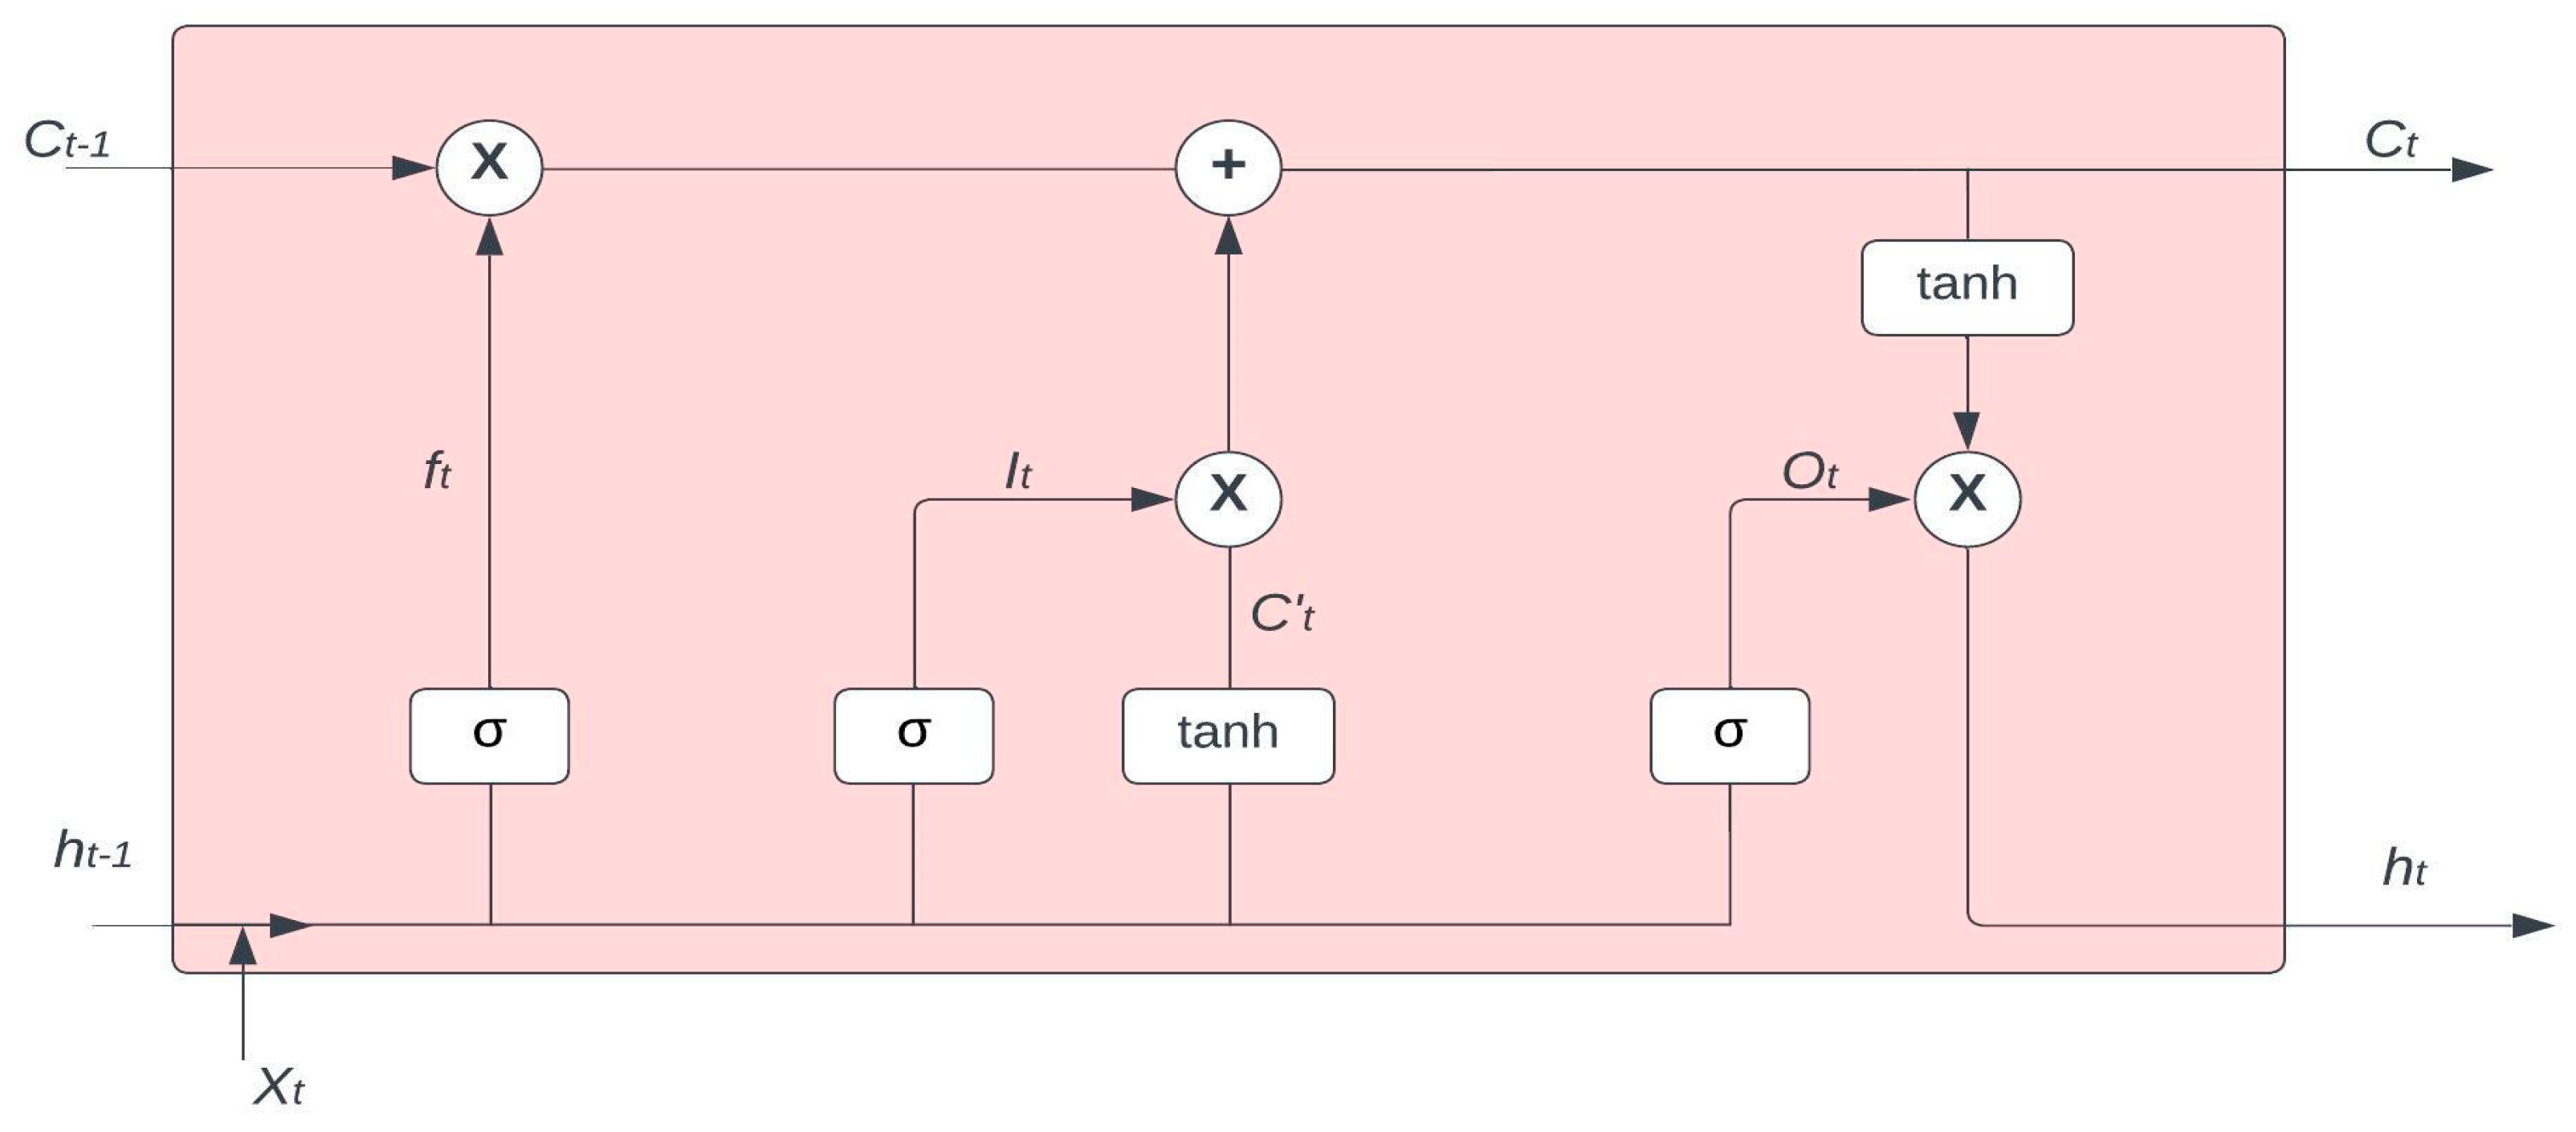
2.2.1. Long Short-Term Memory (LSTM)

In 1997, Hochreiter and Schmidhuber developed the long short-term memory (LSTM) neural network, a subtype of the recurrent neural network (RNN) [39]. Dealing with long-term dependencies leading to a gradient vanishing problem or gradient explosion problem is one of the challenges RNNs must overcome. In order to solve this issue, LSTM employs a forget gate that enables the current state to forget unimportant previous data at the present time.
The forget gate, input gate, and output gate are the gates that make up the LSTM’s architecture. The forget gate determines which data are left out of the cell state. The input gate then determines the data that are saved and included in the cell state. The output gate then selects the output data and sends them to the following node [40]. Figure 4 shows the LSTM model structure. Equations for all gates are:
f t = σ W f h t 1 , x t + b f
i t = σ W i h t 1 , x t + b i
o t = σ W o h t 1 , x t + b o
The cell state C t equation is listed below:
C ~ t = tanh W c h t 1 , x t + b C
C t = f t * C t 1 + i t * C ~ t
The output h t that comes out from the LSTM unit is:
h t = o t * tanh C t

2.2.2. Gated Recurrent Unit (GRU)

Kyunghyun Cho developed a gated recurrent unit (GRU) in 2014 [41]. Long short-term unit (LSTM) and gated recurrent unit (GRU) both have the capacity to handle the gradient vanishing problem. Similar to LSTM, GRU can exclude irrelevant prior observations in the context of the current data and take into account only prior observations that have an impact on the response. In contrast to LSTM, which uses a separate memory cell to address the gradient vanishing problem, GRU has an update gate z and a reset gate r. This is how the two models differ. Figure 5 shows the GRU model structure. The following equations refer to activation h t j , candidate activation h ~ t j , update gate z t j , and reset gate r t j .
h t j = 1 z t j h t 1 j + z t j h ~ t j
z t j = σ W z x t + U z h t 1 j
h ~ t j = tanh W x t + U r t h t 1 j
r t j = σ W r x t + U r h t 1 j
where 1 z t j h t 1 j is the selective “forget” information of the original hidden state, and z t j h ~ t j is the selective “memory” information for h ~ t j .

2.2.3. Convolutional Neural Network (CNN)

The capacity of a CNN to acquire highly abstracted object properties makes it one of the deep learning models that is appropriate for visual picture analysis and recognition [42]. However, it can be used to anticipate how well thermal/photovoltaic systems would work because it can also learn time-series data with a variety of attributes.
Figure 6 shows the structure of a CNN. It consists of a convolutional layer, a pooling layer, a flattening layer, and a fully connected layer. The main layer in this network is the convolutional layer, which reduces computational complexity through sliding windows and weight sharing. The layer after that is the pooling layer. It lowers the size of the feature map and runs each of them independently, which allows for the identification of the dominant features in the training phase. The pooling layer used in this work is known as the max pooling layer. The last two layers are the flattening layer and the fully connected layer, respectively. It is important to note that the flattering layer turns data into a one-dimensional vector to allow the fully connected layer to connect neurons between other layers [42].

2.2.4. Hybrid Neural Network (LSTM-GRU and CNN-LSTM)

The three previous models mentioned above can be developed into hybrid structures. Figure 7a shows the developed structure for the LSTM-GRU network. Figure 7b demonstrates the integrated CNN-LSTM structure. Table 2 summarizes all the structure layers for all the developed models.

2.2.5. Metric Evaluation

Mean absolute percentage error (MAPE), root mean square error (RMSE), mean absolute error (MAE), and the coefficient of determination (R2) are used to evaluate the accuracy of predictive ML models. The methods to compute these metrics are shown below, respectively.
M A P E = 1 n i = 1 n A i P i A i
R M S E = i = 1 n A i P i n
M A E = i = 1 n A i P i n
R 2 = 1 i = 1 n A i P i 2 i = 1 n A i A ¯ 2
where P i is the predicted data,   A i is the actual data, A ¯ is the mean of the target data, and n is the number of the data.

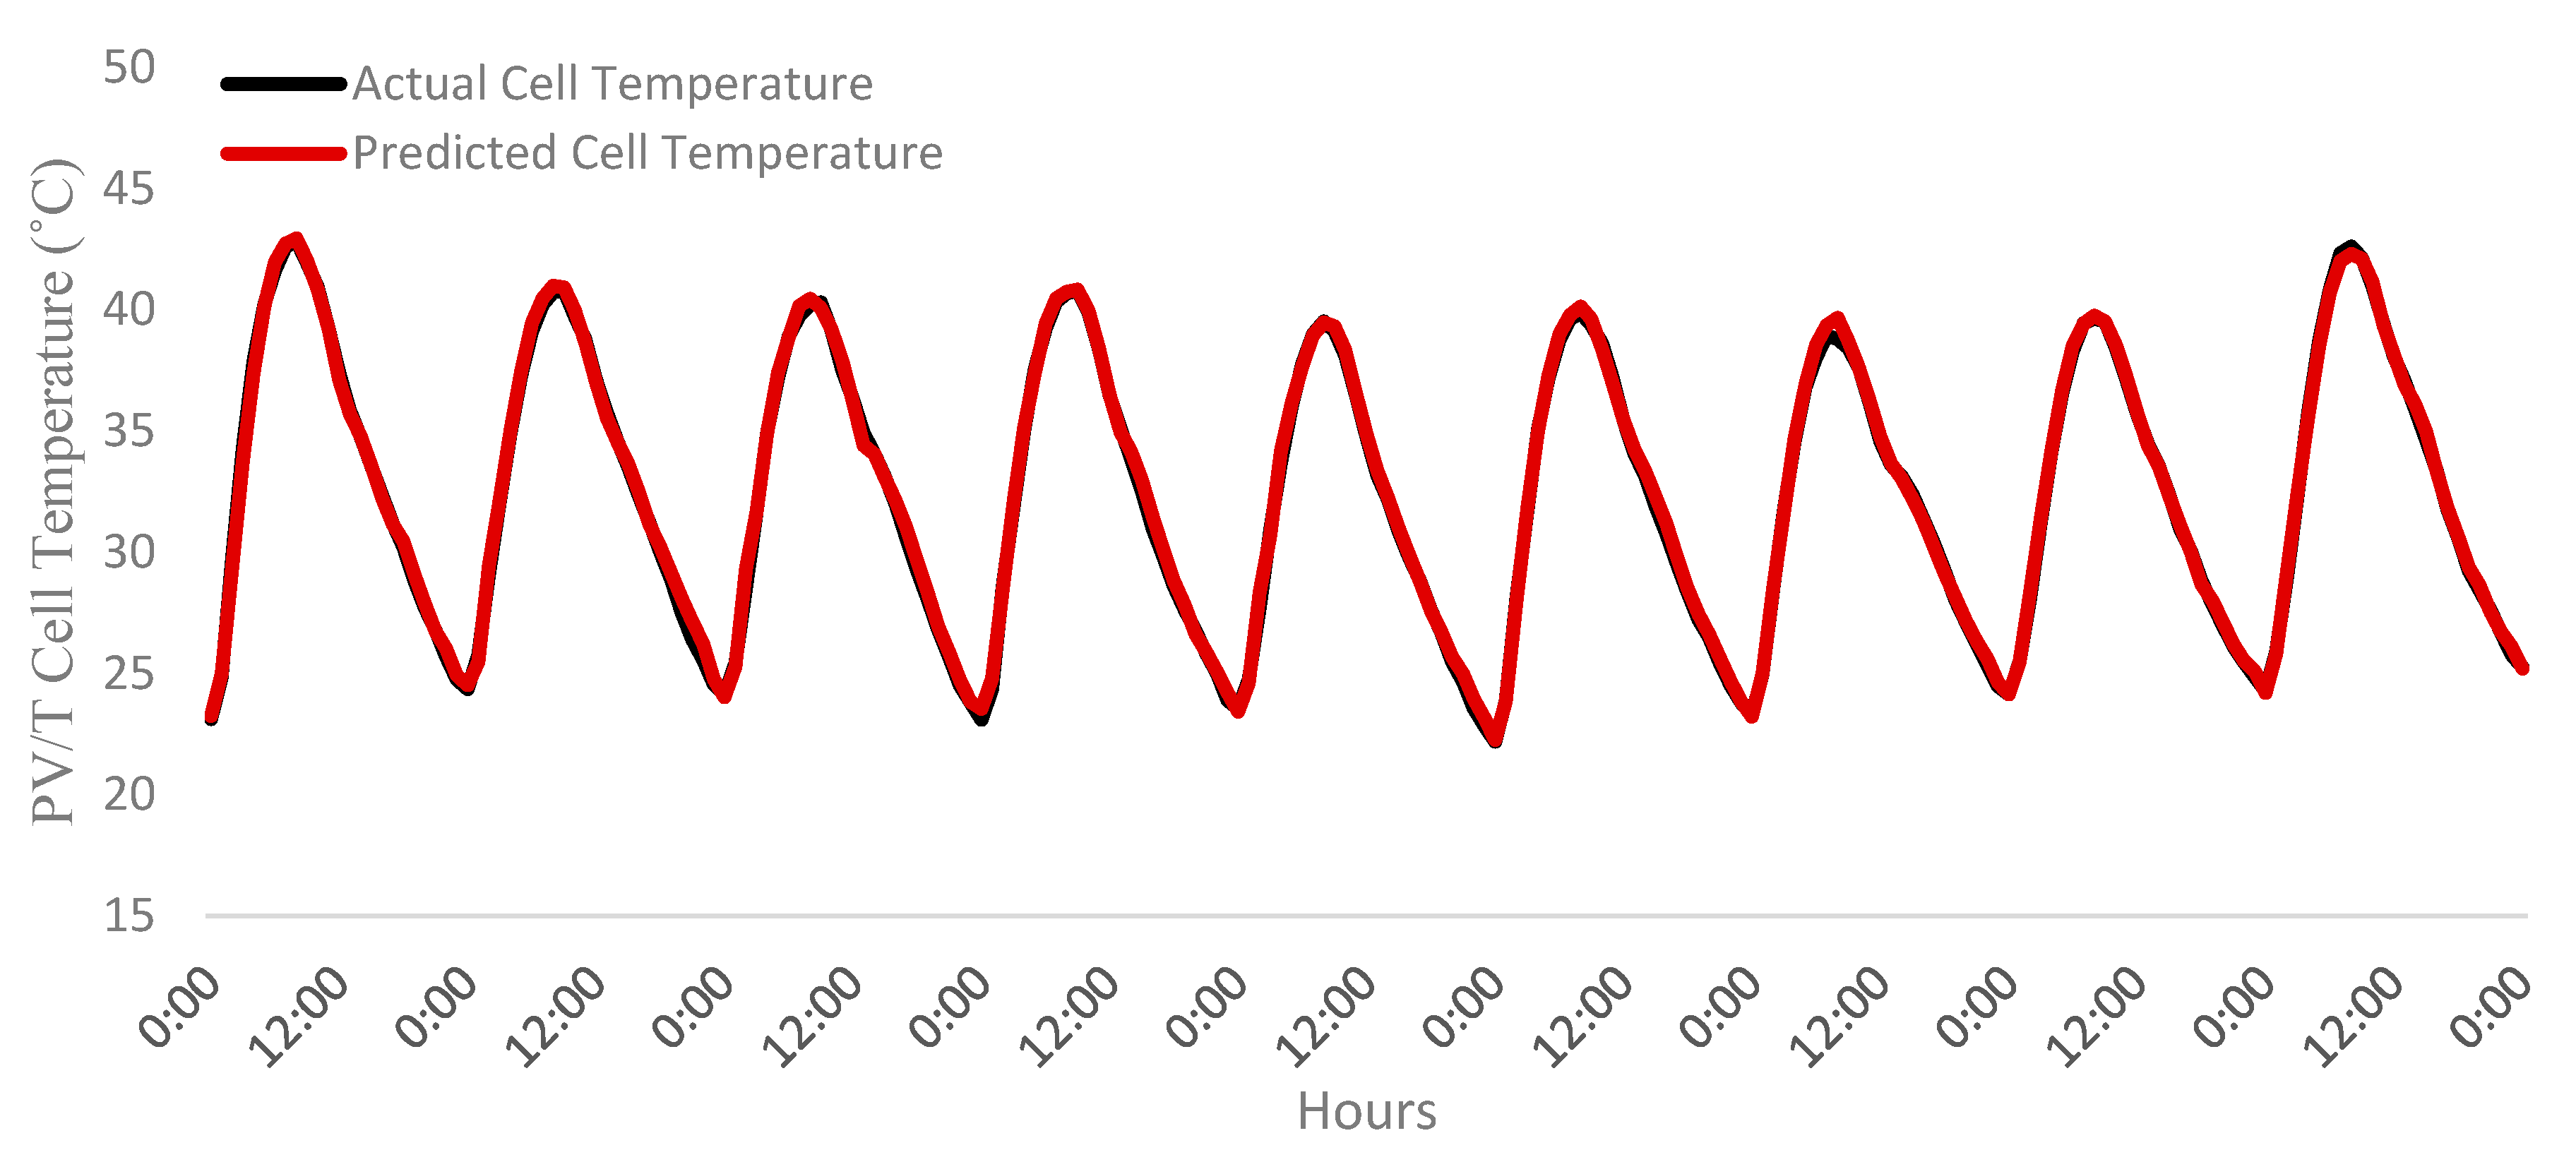
3. Results and Discussion

The main focus of this paper is to develop a time-series deep learning algorithm to predict the performance of the PV/T system cooled by nanofluid (Al2O3). Figure 8 illustrates a time series of the actual PV/T cell temperature (black line) against the accuracy of the predicted same parameter (red line) using the best-developed model for a random 9 days in the dataset. It is obvious that predictions follow the actual values, which represent the high accuracy of the developed algorithm. It is also seen that the PV/T cell temperature (cooled by nanofluid) during the daytime can reach almost 45 °C. Further, improving the thermal/photovoltaic system’s mass flowrate will improve its performance. As a result, cell temperature and thermal and electrical efficiencies predicted utilizing nanofluid (Al2O3) were compared according to the increase in flowrate. Figure 9 shows the predicted cell temperature for various mass flowrates on 1st July. The blue line represents the PV/T panel temperature with no cooling, while other lines represent the behavior of cell temperature with various cooling flowrates using nanofluid. It can be seen that the temperature decreases with increasing the working fluid flowrate, with the cell temperature lowering from approximately 71 °C to 43 °C in the peak time.
The performance metrics for each individual model were determined by calculating the mean absolute percentage error (MAPE), root mean square error (RMSE), mean absolute error (MAE), and the coefficient of determination (R2). Table 3 presents the comparison of the results for the trained CNN-LSTM model with LSTM, GRU, CNN, and LSTM-GRU models utilizing the dataset of a thermal/photovoltaic system cooled by nanofluid (Al2O3). The best performance for predicting the PV/T cell temperature was achieved by CNN-LSTM, with a rate of determination (R2) of 99.3% and a mean absolute error (MAE) of 0.375, while other evaluation metrics had the lowest values among other models. The CNN model recorded the poorest results among other models, scoring R2 at 98.3% and MAE at 0.6483.
The applied dataset was also utilized to predict the electrical and thermal performance of the PV/T system cooled by nanofluid. Figure 10 demonstrates a comparison of the predicted electrical performance of the PV/T for the non-cooling case versus various nanofluid flowrates in the daytime on the first day of July. It can be observed that the predicted electrical performance of the non-cooling case could be significantly increased by nanofluid cooling from approximately 11.8% to 14% under the effect of high temperature. Figure 11 shows a comparison of the predicted thermal performance of the same system cooled by nanofluid against water cooling. The average predicted thermal performance of the proposed system cooled by nanofluid jumped from roughly 65% to 75% in comparison with water cooling. Figure 12 demonstrates a comparison of the predicted monthly daily production for a PV system versus a water cooling and nanofluid cooling PV/T system. For the PV system, the predicted average daily electrical energy output varied from roughly 1.1 to 1.5 kWh/m2/day all year round. For PV/T cooling by nanofluid, however, the predicted average daily electrical energy production could be increased to approximately 1.5–2 kWh/m2/day through the whole year.

4. Conclusions

The presented paper addressed the validity of developing time-series deep learning algorithms to predict the performance of a PV/T system cooled by nanofluid (Al2O3). The PV/T system simulated based on weather data and developed mathematical equations were validated by Abdulwahed Mushabbab and other works, which were referenced in Section 2.1. The simulated data were trained, validated, and tested through the utilization of LSTM, GRU, CNN, LSTM-GRU, and CNN-LSTM. The best model among them was utilized to forecast and investigate the electrical and thermal performance of a PV/T system. From the Results section, it can be seen that the CNN-LSTM was the best model to predict the PV/T parameters, with an R2 and MAE of 0.993 and 0.375, respectively. The result shows the PV/T cell temperature could be decreased to around 43 °C using Al2O3 during the daily peak time. Also, an enhancement in the average daily electrical efficiency of the PV/T compared to a PV system of 9% was observed. Furthermore, the predicted average daily electrical energy output could reach 2 kWh/m2/day during the year, and the average daily thermal efficiency of the PV/T utilizing nanofluid increased by approximately 15% compared to the PV/T water cooling.
The future scope is to simulate the PV/T-PCM/nanofluid and predict the performance of the system using new artificial intelligence techniques. This would allow researchers to obtain more accurate predictions and avoid overfitting issues and wrong forecasts. Similarly, the challenges of handling nanofluids, such as stability and viscosity, can be addressed in the implementation of the proposed system. Furthermore, the water-to-nanofluid ratio will be investigated in detail for hot-climate locations.

Funding

This research received no external funding.

Data Availability Statement

Not applicable.

Conflicts of Interest

The author declare no conflict of interest.

Nomenclature

SymbolDescription
α τ e f f Product of effective absorptivity and transmittivity
α c Absorptivity of a cell
α t e d Absorptivity of Tedlar
β c Cell packing factor
C w Specific heat capacity of the working fluid
m w Working fluid mass flowrate
Q u Removal of thermal energy
T a Ambient temperature
T b s PV/T back surface temperature
T c PV/T cell temperature
τ g Transmissivity of glass
T f i Working fluid inlet temperature
T f o Working fluid outlet temperature
U c a Overall heat transfer coefficient from the cell to the atmosphere
U c t Overall heat transfer coefficient from the cell to Tedlar
U g t Overall heat transfer coefficient from glass to Tedlar through a solar cell
U t w Overall heat transfer coefficient from Tedlar to the working fluid

References

  1. IEA. Buildings-Energy System; IEA: Paris, France, 2023; Available online: https://www.iea.org/energy-system/buildings (accessed on 15 July 2023).
  2. IEA. Saudi Arabia-Countries & Regions; IEA: Paris, France, 27 September 2020; Available online: https://www.iea.org/countries/saudi-arabia (accessed on 15 July 2023).
  3. Zito, B. Most Efficient Solar Panels of 2023 (Guide). Forbes. 4 July 2023. Available online: https://www.forbes.com/home-improvement/solar/most-efficient-solar-panels/ (accessed on 15 July 2023).
  4. Solar Performance and Efficiency. Energy.gov. (n.d.) Available online: https://www.energy.gov/eere/solar/solar-performance-and-efficiency (accessed on 15 July 2023).
  5. Wolf, M. Performance analysis of combined heating and photovoltaic power systems for residences. Energy Conversion. 1976, 16, 79–90. [Google Scholar] [CrossRef]
  6. Al-Waeli, A.H.A.; Sopian, K.; Kazem, H.A.; Chaichan, M.T. Photovoltaic/Thermal (PV/T) systems: Status and future prospects. Renew. Sustain. Energy Rev. 2017, 77, 109–130. [Google Scholar] [CrossRef]
  7. Al-Waeli, A.H.A.; Kazem, H.A.; Chaichan, M.T.; Sopian, K. Photovoltaic/Thermal System: Principles, Design and Applications, 1st ed.; Springer Nature: Berlin, Germany, 2020; ISBN 978-3-030-27824-3. [Google Scholar]
  8. Al-Waeli, A.H.A.; Chaichan, M.T.; Sopian, K.; Kazem, H.A. Influence of the base fluid on the thermo-physical properties of nanofluids with surfactant. Case Stud. Therm. Eng. 2019, 13, 100340. [Google Scholar] [CrossRef]
  9. Chen, J.F.; Zhang, L.; Dai, Y.J. Performance analysis and multi-objective optimization of a hybrid photovoltaic/thermal collector for domestic hot water application. Energy 2018, 143, 500–516. [Google Scholar] [CrossRef]
  10. Tang, X.; Quan, Z.; Zhao, Y. Experimental investigation of solar panel cooling by a novel micro heat pipe array. Energy Power Eng. 2010, 2, 171–174. [Google Scholar] [CrossRef]
  11. Mazón-Hernández, R.; García-Cascales, J.R.; Vera-García, F.; Kaiser, A.S.; Zamora, B. Improving the Electrical Parameters of a Photovoltaic Panel by Means of an Induced or Forced Air Stream. Int. J. Photoenergy 2013, 2013, 830968. [Google Scholar] [CrossRef]
  12. Khanjari, Y.; Pourfayaz, F.; Kasaeian, A. Numerical investigation on using of nanofluid in a water-cooled photovoltaic thermal system. Energy Convers. Manag. 2016, 122, 263–278. [Google Scholar] [CrossRef]
  13. Manigandan, S.; Kumar, V. Comparative study to use nanofluid ZnO and CuO with phase change material in photovoltaic thermal system. Int. J. Energy Res. 2019, 43, 1882–1891. [Google Scholar] [CrossRef]
  14. Al-Waeli, A.H.A.; Sopian, K.; Chaichan, M.T.; Kazem, H.A.; Hasan, H.A.; AlShamani, A.N. An experimental investigation of SiC nanofluid as a base-fluid for a photovoltaic thermal PV/T system. Energy Convers. Manag. 2017, 142, 547–558. [Google Scholar] [CrossRef]
  15. Nada, S.A.; El-Nagar, D.H.; Hussein, H.M.S. Improving the thermal regulation and efficiency enhancement of PCM-Integrated PV modules using nano particles. Energy Convers. Manag. 2018, 166, 735–743. [Google Scholar] [CrossRef]
  16. Al-Waeli, A.H.A.; Sopian, K.; Yousif, J.H.; Kazem, H.A.; Boland, J.; Chaichan, M.T. Artificial neural network modeling and analysis of photovoltaic/thermal system based on the experimental study. Energy Convers. Manag. 2019, 186, 368–379. [Google Scholar] [CrossRef]
  17. Yousif, J.H.; Kazem, H.A. Prediction and evaluation of photovoltaicthermal energy systems production using artificial neural network and experimental dataset. Case Stud. Therm. Eng. 2021, 27, 101297. [Google Scholar] [CrossRef]
  18. Al-Waeli, A.H.; Kazem, H.A.; Yousif, J.H.; Chaichan, M.T.; Sopian, K. Mathematical and Neural Network Models for Predicting the Electrical Performance of a PV/T system. Int. J. Energy Res. 2019, 43, 8100–8117. [Google Scholar] [CrossRef]
  19. Shahsavar, A.; Moayedi, H.; Al-Waeli, A.H.A.; Sopian, K.; Chelvanathan, P. Machine learning predictive models for optimal design of building-integrated photovoltaic-thermal collectors. Int. J. Energy Res. 2020, 44, 5675–5695. [Google Scholar] [CrossRef]
  20. Jakhar, S.; Paliwal, M.K.; Kumar, M. Machine learning predictive models for optimal design of photovoltaic/thermal collector with nanofluids based geothermal cooling. Environ. Prog. Sustain. Energy 2023, 42, e14131. [Google Scholar] [CrossRef]
  21. Diwania, S.; Kumar, M.; Kumar, R.; Kumar, A.; Gupta, V.; Khetrapal, P. Machine learning-based thermo-electrical performance improvement of nanofluid-cooled photovoltaic–thermal system. Energy Environ. 2022, 0958305X221146947. [Google Scholar] [CrossRef]
  22. Margoum, S.; Hajji, B.; El Fouas, C.; El Manssouri, O.; Aneli, S.; Gagliano, A.; Mannino, G.; Tina, G.M. Prediction of Electrical Power of Ag/Water-Based PVT System Using K-NN Machine Learning Technique. In Digital Technologies and Applications; Springer Nature: Cham, Switzerland, 2023; pp. 125–132. [Google Scholar] [CrossRef]
  23. Joshi, A.S.; Tiwari, A.; Tiwari, G.N.; Dincer, I.; Reddy, B.V. Performance evaluation of a hybrid photovoltaic thermal (PV/T) (glass-to-glass) system. Int. J. Therm. Sci. 2009, 48, 154–164. [Google Scholar] [CrossRef]
  24. Hedayatizadeh, M.; Ajabshirchi, Y.; Sarhaddi, F.; Safavinejad, A.; Farahat, S.; Chaji, H. Thermal and electrical assessment of an integrated solar photovoltaic thermal (PV/T) water collector equipped with a compound parabolic concentrator (CPC). Int. J. Green Energy 2013, 10, 494–522. [Google Scholar] [CrossRef]
  25. Gakkhar, N.; Soni, M.K.; Jakhar, S. Experimental investigation of exergy performance of a water cooled hybrid photovoltaic thermal collector. Int. J. Exergy 2020, 31, 330–351. [Google Scholar] [CrossRef]
  26. Dubey, S.; Tiwari, G.N. Thermal modeling of a combined system of photovoltaic thermal (PV/T) solar water heater. Sol. Energy 2008, 82, 602–612. [Google Scholar] [CrossRef]
  27. Duffie, J.A.; Beckman, W.A. Solar Engineering of Thermal Processes; John Wiley & Sons: Hoboken, NJ, USA, 2013. [Google Scholar]
  28. Jakhar, S.; Soni, M.S.; Gakkhar, N. Exergy analysis of a photovoltaic thermal system with earth water heat exchanger cooling system based on experimental data. Int. J. Exergy 2017, 23, 367–387. [Google Scholar] [CrossRef]
  29. Evans, D.L. Simplified method for predicting photovoltaic array output. Sol. Energy 1981, 27, 555–560. [Google Scholar] [CrossRef]
  30. Schott, T. Operation temperatures of PV modules-a theoretical and experimental approach. In Proceedings of the Sixth EC Photovoltaic Solar Energy Conference, London, UK, 15–19 April 1985; Inderscience: Geneve, Switzerland, 1985; pp. 1101–1110. [Google Scholar] [CrossRef]
  31. Hissouf, M.; Feddaoui, M.; Najim, M.; Charef, A. Numerical study of a covered Photovoltaic-Thermal Collector (PVT) enhancement using nanofluids. Sol. Energy 2020, 199, 115–127. [Google Scholar] [CrossRef]
  32. Kallio, S.; Siroux, M. Energy Analysis and Exergy Optimization of Photovoltaic-Thermal Collector. Energies 2020, 13, 5106. [Google Scholar] [CrossRef]
  33. Mushabbab, A. (University of Dayton, Dayton, OH, USA). Personal communication. 2023. [Google Scholar]
  34. Visual Crossing Corporation. Visual Crossing Weather (2018–2019). [Data Service]. 2020. Available online: https://www.visualcrossing.com/ (accessed on 1 June 2023).
  35. “Pvlib Python.” Pvlib Python-Pvlib Python 0.10.1 Documentation. Available online: https://pvlib-python.readthedocs.io/en/stable/ (accessed on 1 September 2023).
  36. RStudio Team. RStudio: Integrated Development for R; RStudio, PBC: Boston, MA, USA, 2020; Available online: http://www.rstudio.com/ (accessed on 1 June 2023).
  37. Alhamayani, A.D.; Sun, Q.; Hallinan, K.P. Estimating Smart Wi-Fi Thermostat-Enabled Thermal Comfort Control Savings for Any Residence. Clean Technol. 2021, 3, 743–760. [Google Scholar] [CrossRef]
  38. Alhamayani, A.D.; Sun, Q.; Hallinan, K.P. An Improved Method to Estimate Savings from Thermal Comfort Control in Residences from Smart Wi-Fi Thermostat Data. Clean Technol. 2022, 4, 395–406. [Google Scholar] [CrossRef]
  39. GERON, A. Hands-on Machine Learning with Scikit-Learn, Keras, and Tensorflow: Concepts, Tools and Techniques to Build Intelligent Systems; O’Reilly: Sebastopol, CA, USA, 2019. [Google Scholar]
  40. Hochreiter, S.; Schmidhuber, J. Long short-term memory. Neural Comput. 1997, 9, 1735–1780. [Google Scholar] [CrossRef]
  41. Chung, J.; Gulcehre, C.; Cho, K.H.; Bengio, Y. Empirical Evaluation of Gated Recurrent Neural Networks on Sequence Modeling. arXiv 2014, arXiv:1412.3555. [Google Scholar]
  42. Aksan, F.; Li, Y.; Suresh, V.; Janik, P. CNN-LSTM vs. LSTM-CNN to Predict Power Flow Direction: A Case Study of the High-Voltage Subnet of Northeast Germany. Sensors 2023, 23, 901. [Google Scholar] [CrossRef]
Figure 2. A PV/T system utilized to validate the mathematical model.
Processes 11 02731 g002
Figure 3. A block diagram for all the processes to predict the thermal/photovoltaic system performance.
Processes 11 02731 g003
Figure 4. Long short-term memory architecture.
Processes 11 02731 g004
Figure 5. Grand recurrent unit architecture.
Processes 11 02731 g005
Figure 6. Convolutional neural network architecture.
Processes 11 02731 g006
Figure 7. Hybrid deep learning models utilized to predict the performance of the thermal/photovoltaic system: (a) LSTM-GRU simplified architecture, (b) CNN-LSTM simplified architecture.
Processes 11 02731 g007
Figure 8. A time series plot for the actual PV/T cell temperature versus the predicted PV/T cell temperature for 9 days in the dataset.
Processes 11 02731 g008
Figure 9. A comparison between the cell temperature prediction for a PV/T system for a non-cooling case with various cooling flowrates using nanofluid.
Processes 11 02731 g009
Figure 10. A comparison of the predicted electrical performance of the PV/T system for a non-cooling case vs. different nanofluid flowrates.
Processes 11 02731 g010
Figure 11. A comparison of the predicted thermal performance of the PV/T system for a water cooling case vs. different nanofluid flowrates.
Processes 11 02731 g011
Figure 12. A comparison of the predicted monthly daily production for a PV system vs. a water cooling and nanofluid cooling PV/T system.
Processes 11 02731 g012
Table 1. Parameters of photovoltaic/thermal system and nanofluid properties.
ParameterValue
PV glass’s transmissivity ( τ g ) 0.95
PV glass cover’s thickness (tg)0.0032 m
PV glass cover’s thermal conductivity (kg)1 W/mk
PV cell’s absorptivity ( α c ) 0.9
PV cell’s transmissivity ( τ c ) 0.9
PV cell thermal conductivity (kc)0.036 W/mk
Tedlar’s absorptivity ( α t e d ) 0.75
Absorber plate’s thermal conductivity385 W/m.k
Absorber plate’s thickness0.002 m
Packing factor of solar cell ( β c ) 0.83
Temperature coefficient of PV panel ( β 0 )0.0034
Thermal conductivity of the epoxy adhesive1.04 W/m.k
Base fluid density (ρfb)998.2 Kg/m3
Nanoparticle density (ρnp)3970 Kg/m3
Base fluid thermal conductivity (kfb)0.6 W/m.k
Nanoparticle thermal conductivity (knp)40 W/m.k
Base fluid specific heat capacity (Cfb)4.182 kJ/kg.k
Nanoparticle specific heat capacity (Cnp)0.765 kJ/kg.k
Nanofluid volume fraction ( )5%
Table 2. Summary of the structure layers and hyperparameters for developed models.
Structure of Layer
Model1st Layer2nd Layer3rd Layer4th Layer5th Layer
LSTMLSTM
(N: 25/A: tanh)
dense
(N:1/A: relu)
---
GRUGRU
(N: 25/A: tanh)
dense
(N: 1/A: relu)
---
CNNCNN
(F: 30/Fz: 5/A: relu)
max pooling
(Pz: 4)
flattendense
(N: 1/A: sigmoid)
-
LSTM-GRULSTM
(N:25/A: tanh)
GRU
(N: 15/A: tanh)
dense
(N: 1/A:relu)
--
CNN-LSTMCNN
(F: 64/Fz: 5/A: relu)
max pooling
(Pz: 4)
flattenLSTM
(N: 25/A: tanh)
dense
(N: 1/A: sigmoid)
Hyperparameters
All modelsLookback Steps = 12Batch Size = 128
Where N: neuron units, A: activation, F: filter units, Fz: filter size, and Pz: pooling size.
Table 3. Performance measures of the predictive cell temperature deep learning algorithms.
ModelMAPE (%)RSMEMAE R 2
LSTM0.14560.69410.43490.991
GRU0.13760.71940.41040.991
CNN0.21781.02370.64830.983
LSTM-GRU0.12800.65440.38150.992
CNN-LSTM0.12600.62200.37500.993
Disclaimer/Publisher’s Note: The statements, opinions and data contained in all publications are solely those of the individual author(s) and contributor(s) and not of MDPI and/or the editor(s). MDPI and/or the editor(s) disclaim responsibility for any injury to people or property resulting from any ideas, methods, instructions or products referred to in the content.

