Article

Energy and Exergy Analysis of Hydrogen-Based Fluidized Bed Direct Reduction towards Efficient Fossil-Free Ironmaking

1
Chinalco Environmental Protection and Energy Conservation Group Co., Ltd., Xiong’an 071700, China
2
State Key Laboratory of Multiphase Complex Systems, Institute of Process Engineering, Chinese Academy of Sciences, Beijing 100190, China
3
School of Chemical Engineering, University of Chinese Academy of Sciences, Beijing 100049, China
*
Author to whom correspondence should be addressed.
Processes 2023, 11(9), 2748; https://doi.org/10.3390/pr11092748
Submission received: 12 August 2023 / Revised: 23 August 2023 / Accepted: 24 August 2023 / Published: 14 September 2023

Abstract

:
Hydrogen-based fluidized bed direct reduction (H-FBDR) is an important and promising route for fossil-free ironmaking. In this study, to achieve the optimal operation state of energy use and exergy efficiency, the influences of the metallization process and the ratios of H2 injected on the energy and exergy flows in the H-FBDR process are studied. The results show that the thermodynamically designed two-stage reduction process (first: Fe2O3→FeO; second: FeO→Fe) requires a smaller H2 quantity than other metallization processes. According to the mass, energy, and exergy balance analyses, variations in the H2 consumption, exergy destruction, and energy/exergy losses of the overall system, iron ore preheater (F1), fluidized bed reactor system (R), heat exchanger (E), and gas preheater (F2) with different ratios of H2 injected (η) are derived. The total H2 consumption, total exergy destruction, and energy/exergy losses rise with increasing η, and sharp increases are observed from η = 1.3 to η = 1.8. The exergy efficiencies (φ) can be ranked as φR > φE > φF1 ≈ φF2, and the exergy destruction in components F1 and F2 is mainly caused by the combustion reaction, whereas physical exergy destruction dominates for components R and E. The performances of components F1, E, and F2 degrade from η = 1.0 to η = 1.8, and significant degradation arises when η exceeds 1.3. Thus, considering the H2 consumption, thermodynamic efficiency, and energy/exergy losses, the ratio of H2 injected should be set below 1.3. Notably, although the energy loss in the H-FBDR system is 2 GJ/h at η = 1.3, the exergy loss is only 360 MJ/h, in which the recycled gases from component E occupy 320 MJ/h, whereas the total exergy destruction is 900 MJ/h. Therefore, improving the performance of operation units, particularly the components F1 and F2, is as important as recovering the heat loss from component E for optimizing the H-FBDR process.

Graphical Abstract

1. Introduction

In the context of “carbon peak and neutrality”, traditional carbon metallurgy technology cannot meet the requirement for high-quality development of the iron and steel industry in the future. It is essential to develop new and green low-carbon ironmaking technology [1,2,3]. Compared with traditional carbon metallurgy, hydrogen metallurgy, which uses H2 as a fuel and reductant, can help the ironmaking process eliminate its reliance on fossil fuels and address the issue of carbon emissions from the source, which is an important direction for future ironmaking technology [4,5,6,7]. As an efficient gas-based direct reduction reactor for ironmaking, the fluidized bed reactor can directly use iron ore fines of less than 5 mm, with the advantages of high gas–solid contact efficiency and rapid mass and heat transfer rates, resulting in exceptional metallurgical performance. Nowadays, with the transformation of raw iron ore from lump to powder, ironmaking via hydrogen-based fluidized bed direction reduction demonstrates more significant superiority and potential as one of the future’s mainstream technologies for green and low-carbon ironmaking [8,9,10,11,12,13,14].
Recently, hydrogen metallurgy has become a worldwide hot topic in the iron and steel industry. However, ironmaking through hydrogen-based fluidized bed direct reduction began in the early 1950s, when the American Hydrocarbon Research, Inc. (now called Hydrocarbon Technologies, Inc., Lawrenceville, NJ, USA) built the H-iron process in Brownsville, Texas [15]. Then, the FIOR process and the Finmet process were constructed sequentially in South America, with H2-rich gases from natural gas steam reforming as fluidizing and reducing gas [8]. In 1996, German Lurgi Metallurgie (now called Outotec) designed the first pure hydrogen-based fluidized bed direct reduction process for ironmaking, named the Circored process, which has been the only ironmaking process that uses pure H2 as the reductant to have ever been commercially operated till now [16]. Although the hydrogen-based fluidized bed direct reduction process has been developed for more than seven decades, it is far inferior to the shaft furnace in global direct reduced iron yields, which is mainly attributed to the problem of defluidization and high energy consumption [17]. For fluidized bed direct reduction, defluidization caused by the agglomeration of sticky iron particles is a disaster, and once defluidization occurs, the process has to be terminated, resulting in significant loss [18]. In the past few decades, tremendous efforts have been made to tackle the problem of defluidization, and a lot of effective methods have been proposed, such as iron morphology control [19], surface modification with noncohesive additives [20,21,22], and enlargement of particle size [10,23,24,25]. However, research on the reduction in energy consumption in the fluidized bed direct reduction process is far from satisfactory. It has been reported that the energy consumption of Midrex (a typical shaft furnace process) is of the order of 9.6 GJ/t direct reduced iron, which is significantly lower than Finmet (12.4 GJ/t direct reduced iron) and Circored (11.5 GJ/t direct reduced iron) [16]. Thus, reducing energy consumption is the key to improving the competitiveness of fluidized bed direct reduction in the direct reduced iron market.
In this study, to optimize the H-FBDR process for minimum energy consumption and preferable performance of each operation unit, both the quantity of energy and the quality of energy, i.e., exergy consumed under different metallization processes and ratios of H2 injected, are carefully investigated. Based on this, the thermodynamic efficiency and the energy/exergy losses are evaluated.

2. Method

2.1. Description of the H-FBDR Process

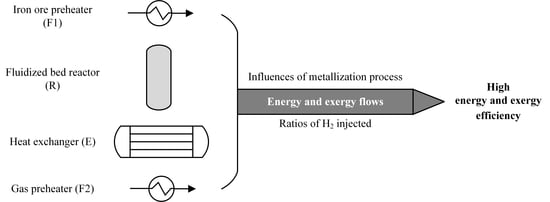
As shown in Figure 1, the proposed process design for the H-FBDR process is depicted. In the H-FBDR system, inputs are raw iron ore and H2, whereas outputs are hot briquetted iron (HBI) and H2O. In a continuous operation, the detailed description of the H-FBDR process is as follows: First, raw iron ore mainly composed of magnetite is preheated (F1) to a high temperature, and simultaneously, the oxidization reaction 4Fe3O4 + O2→6Fe2O3 happens. Then, the as-oxidized iron ore consisting mainly of hematite is put into one or two fluidized bed reactors (R), where the metallization or reduction of iron ore Fe2O3 + 3H2→2Fe + 3H2O is conducted. The produced direct reduced iron with a high metallization degree (λ = mole of metallic iron/mole of total iron) is compacted into HBI, and the tail gas composed of H2 and H2O is recycled. The heat of the tail gas from the fluidized bed reactor is recovered through a heat exchanger (E). After cooling and washing, H2O in the tail gas is completely removed, and the recycled H2, together with the new H2 from the H2 storage, serves as the heat transfer medium in the heat exchanger. Pure H2 out of the heat exchanger is preheated (F2) and injected into the fluidized bed reactor system to reduce and suspend the iron ore particles. In the H-FBDR system, the energy for preheating iron ore and reducing gas is supplied by H2 combustion. Here, the energy for F2 comes from the combustion reaction of H2 and air (N2 + O2), and H2 completely reacts with O2 to form H2O. Thus, the high-temperature exhaust gas from F2 is composed of H2O and N2. To improve the energy use in the system, the high-temperature tail gas (H2O + N2) from F2 is introduced into F1 for preheating iron ore.
In this study, to avoid the defluidization of iron ore particles in the fluidized bed and accomplish hot compaction of direct reduced iron, the metallization temperature is set at 700 °C. The metallization degree of direct reduced iron is 95%.

2.2. Energy Analysis

The steady-state mass balance for each operation unit (F1, R, E, F2) in the H-FBDR system can be written as
i m i = 0
where mi denotes the mass flow rate in component k (k = F1, R, E, F2) with a positive value for the input stream and a negative value for the output.
The energy analysis of each operation unit (F1, R, E, F2) in the H-FBDR system is conducted based on the first law of thermodynamics, i.e., the principle of conservation of energy. Here, the variations in the potential and kinetic energies of the streams are negligible. Thus, the energy balance for component k in the H-FBDR system can be expressed as
i m i h i + i Q l = 0
where hi represents the enthalpy of stream i, and Ql is the heat loss between component k and the environment. In Equation (2), inputs are regarded as positive, whereas outputs are negative. hi can be obtained according to Gyftopoulos and Beretta [26]:
h i = a + bT + cT 2
where a, b, and c are the correlation constants, and T is the temperature (°C), as shown in Table 1 [26].
In this study, energy analysis of the H-FBDR system is carried out with the following assumptions and simplifications: the heat loss Ql caused by the heat dissipation in each operation unit (F1, R, E, F2) is neglected; outlet gas temperature from F1 is 150 °C; tail gas (H2O + N2) temperature from F2 is 400 °C; recycled gas (H2 + H2O) temperature from E is 150 °C; and the injected H2 is completely burned in both F1 and F2.

2.3. Exergy Analysis

Exergy denotes the amount of theoretical work to form matter in its specified state from substances common in the natural environment, in a reversible way, and with the heat transfer occurring only in the environment [27,28,29]. The exergy of stream i (Ei) is the maximum theoretically available work as the system interacts with the total equilibrium in the environment, and it comprises chemical exergy and thermomechanical exergy. Thermomechanical exergy can be further divided into physical exergy, kinetic exergy, and potential exergy [30]. In this study, only chemical exergy ( E i ch ) and physical exergy ( E i ph ) are considered. The specific physical exergy can be calculated via the following equation:
E i ph = h i h i , 0 T 0 ( s i s i , 0 )
where hi,0 and si,0 refer to the enthalpy and entropy at the standard state.
And the specific chemical exergy can be calculated by
E i ch = x n E n , 0 ch + RT x n lnx n
where xn is the concentration of n, E n , 0 ch is the standard chemical exergy of n, and R is the universal gas constant with a value of 8.314 J/(mol·K).
The exergy of H2 fuel ( E H 2 , F ) is defined as
E H 2 , F = 0.95 Q H 2 , H
where Q H 2 , H is the high-heat value of H2 fuel, 285.83 MJ/kmol.
Standard chemical exergies of gases and solids involved in this study are shown in Table 2 [27].
Exergy does not satisfy the law of conservation, because entropy always increases in an irreversible process. After heat and mass balances in each operation unit are checked, based on the second law of thermodynamics, the exergy balance for component k in the H-FBDR system can be expressed as the following [31]:
i m i E i E D , k = 0  
where E D , k is the exergy destruction in component k. Similarly, inputs Ei are considered positive and outputs Ei negative.
Another parameter that should be defined is exergy losses (Eloss), which consist of exergy flowing to the surroundings) [32]. Exergy losses appear at the level of the overall system, and they should not be confused with exergy destruction, which indicates the loss of exergy inside the process boundaries due to irreversibilities. If the system boundaries used for all exergy balances are at the temperature T0 of the reference environment, there are no exergy losses in component k.
In this study, the second law of thermodynamic efficiency, i.e., the exergy efficiency φ of component k, can be expressed as the proportion of the total input exergy flow to the total output exergy flow (R) or the proportion of useful exergy to the consumption of driving exergy (F1, E, and F2) [33].
To evaluate the performance of component k in the H-FBDR system, the relative exergy destruction rate χk, i.e., the proportion of exergy destruction of component k to the total amount of exergy destruction of the system, is defined as follows (Anvari et al., 2015; Ding et al., 2022; Li et al., 2019; Li et al., 2021) [13,34,35,36]:
χ k = E D , k E D , k
If χk increases, it indicates that the performance of the component k becomes worse due to an increase in the internal irreversibilities of the component. However, if χk decreases, the performance of the component or the whole cycle improves due to a decrease in internal irreversibilities.

3. Results and Discussion

In this study, a typical iron ore mainly composed of magnetite is used as the raw material, and its composition is listed in Table 3. In the H-FBDR system, the yield of HBI is 10,000 t/a, and the production time is 8000 h/a. Thus, the throughput of raw iron ore, as-oxidized iron ore, and direct reduced iron can be achieved, as shown in Table 4.
The amount of H2 injected into the fluidized bed is characterized by the value of η. η is defined as the ratio of amounts injected to the amounts necessary for the metallization of iron ore in the fluidized bed, as shown in Equation (9):
η = H 2   feed   into   fluidized   bed H 2   needed   for   metallization   of   iron   ore   [ mol mol ]

3.1. Influence of Metallization Process in the Fluidized Bed

The metallization of iron ore can be accomplished in one or more fluidized bed reactors, such as Finmet (four fluidized bed reactors) and Circored (two fluidized bed reactors), and it differs in the metallization degree of products in each fluidized bed reactor. In this study, to investigate the influence of the metallization process in the fluidized bed reactors on the energy use an exergy efficiency of operation units in the H-FBDR system, three different cases are comparatively analyzed, as shown in Table 5.
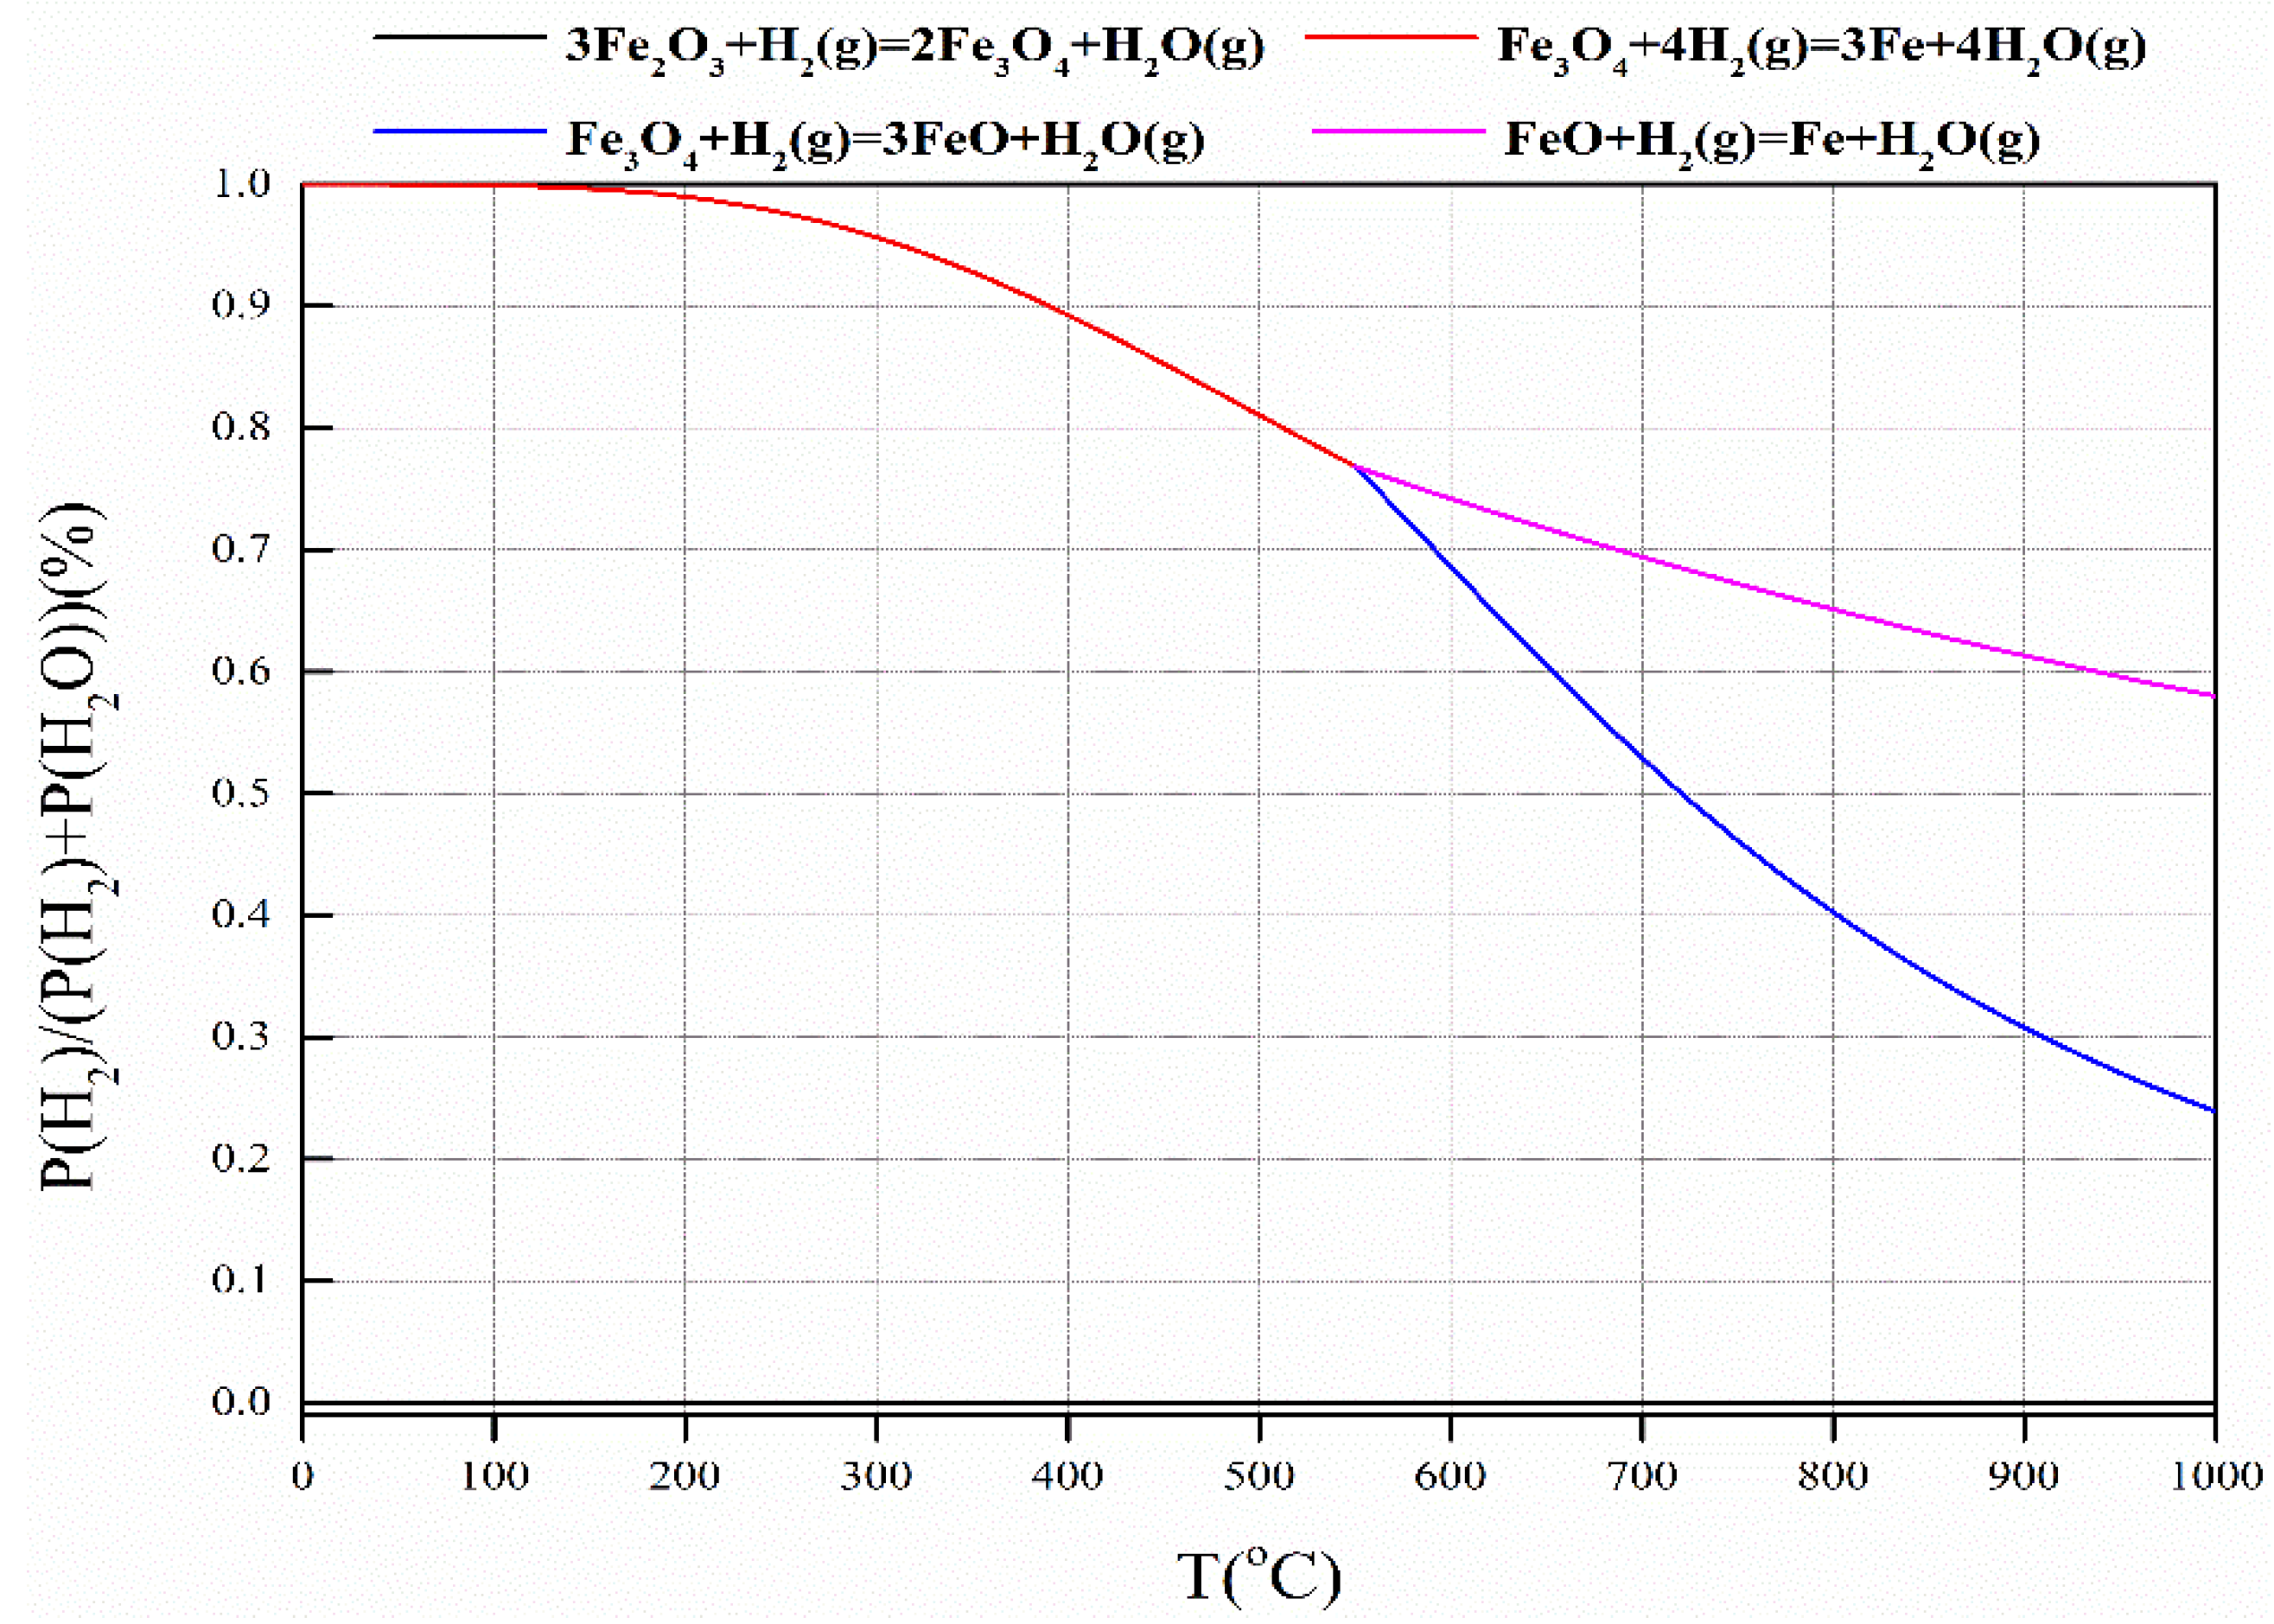
The fluidized bed is a typical continuous stirred tank reactor, and the outlet gas composition should be equal to that in the reactor. In this study, to achieve the performance of the fluidized bed reactor system in the optimal state, the H2 concentration in the outlet gas of the fluidized bed reactor system is set to be equal to the thermodynamic limit value at the reduction temperature, as shown in Figure 2. A 30% oversupply of H2 (η = 1.3) is introduced into the fluidized bed reactor system where metallization of iron ore happens (FeO→Fe). According to the mass balance and energy analysis, the mass and heat flow in each operation unit can be derived, as shown in Tables S1–S15 in the Supplementary Materials. In cases 1, 2, and 3, according to the thermodynamic calculations, the value of H2/(H2 + H2O) from the fluidized bed reactor (FeO→Fe) should be 0.6942 at 700 °C. In case 1, the value of H2/(H2 + H2O) from the first fluidized bed reactor is calculated to be 0.6409 through mass balance; thus, to accomplish the reduction of Fe3O4 to FeO in the optimal state, the temperature of the first fluidized bed reactor should be set to 630 °C. In cases 2 and 3, the raw iron ore is preheated to 900 °C by F1, and it should be noted that double F2 is required in case 2 to maintain the metallization temperature at 700 °C. The consumption of H2 in each operation unit is shown in Figure 3. On the whole, the H2 consumption in case 1 (686 Nm3-H2/t-Fe) is lower than in cases 2 and 3 (701 Nm3-H2/t-Fe), which is attributed to the lower preheating temperature of raw iron ore in case 1 than that in cases 2 and 3.
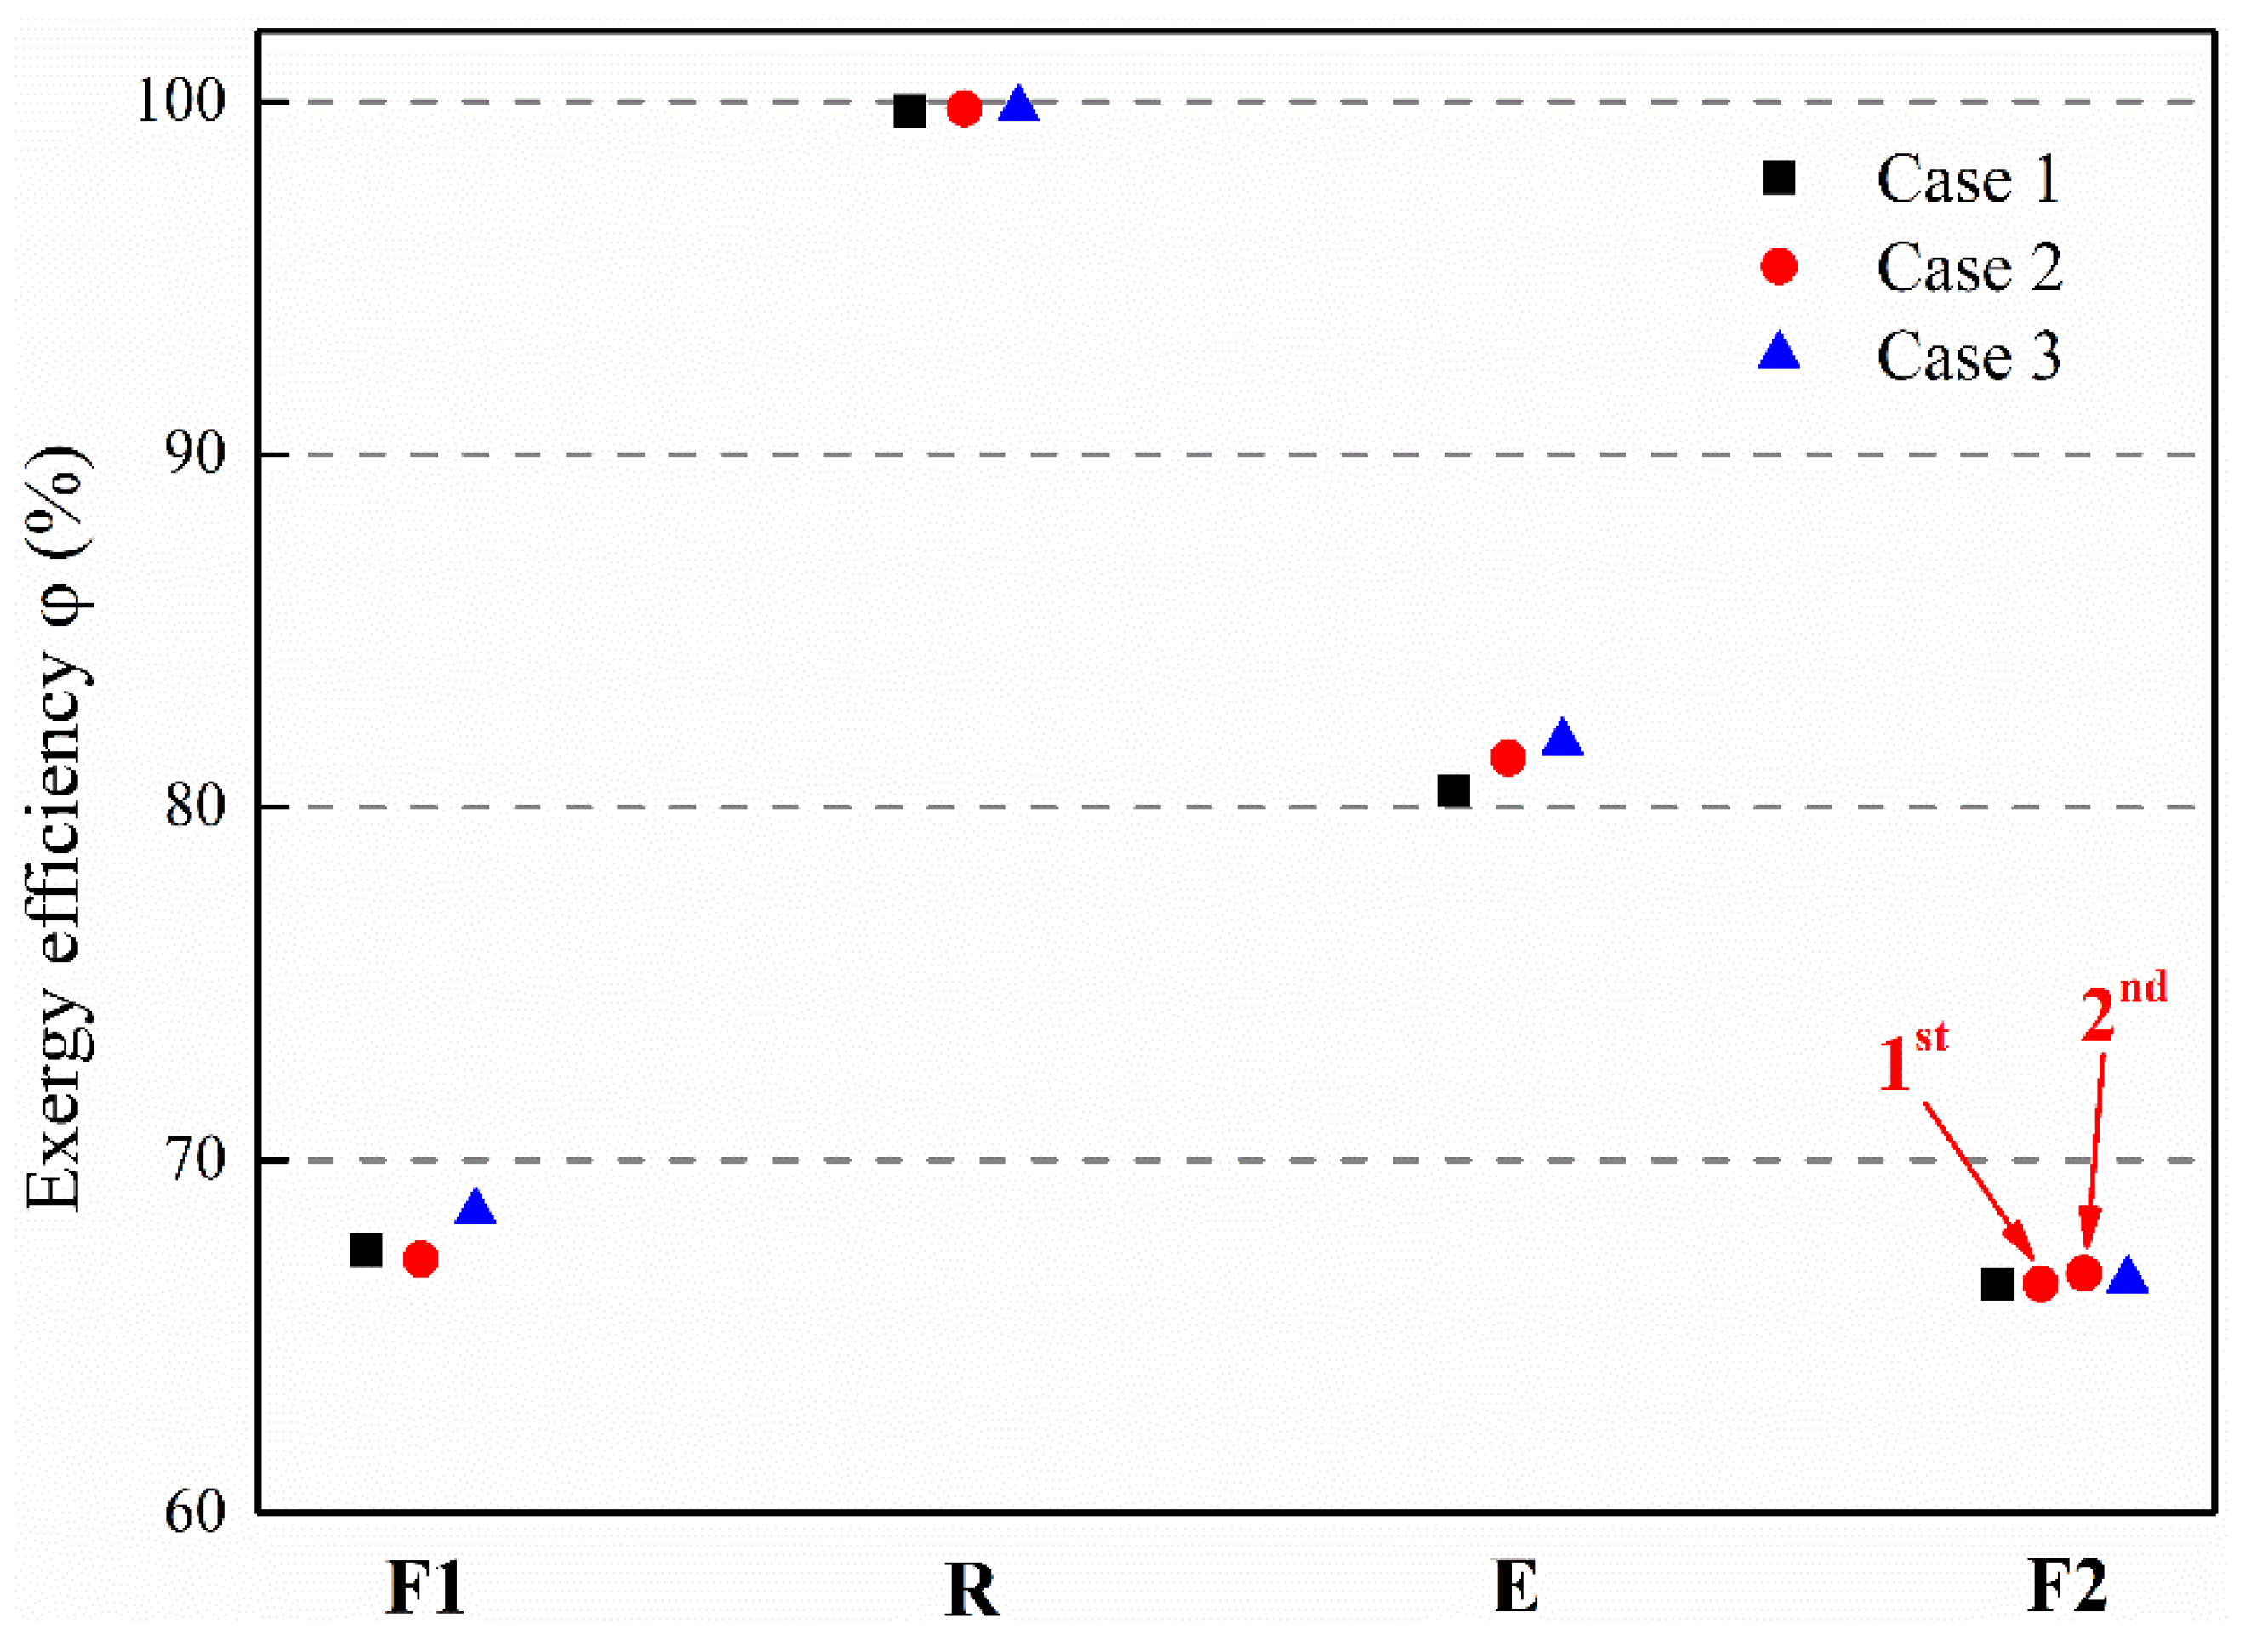
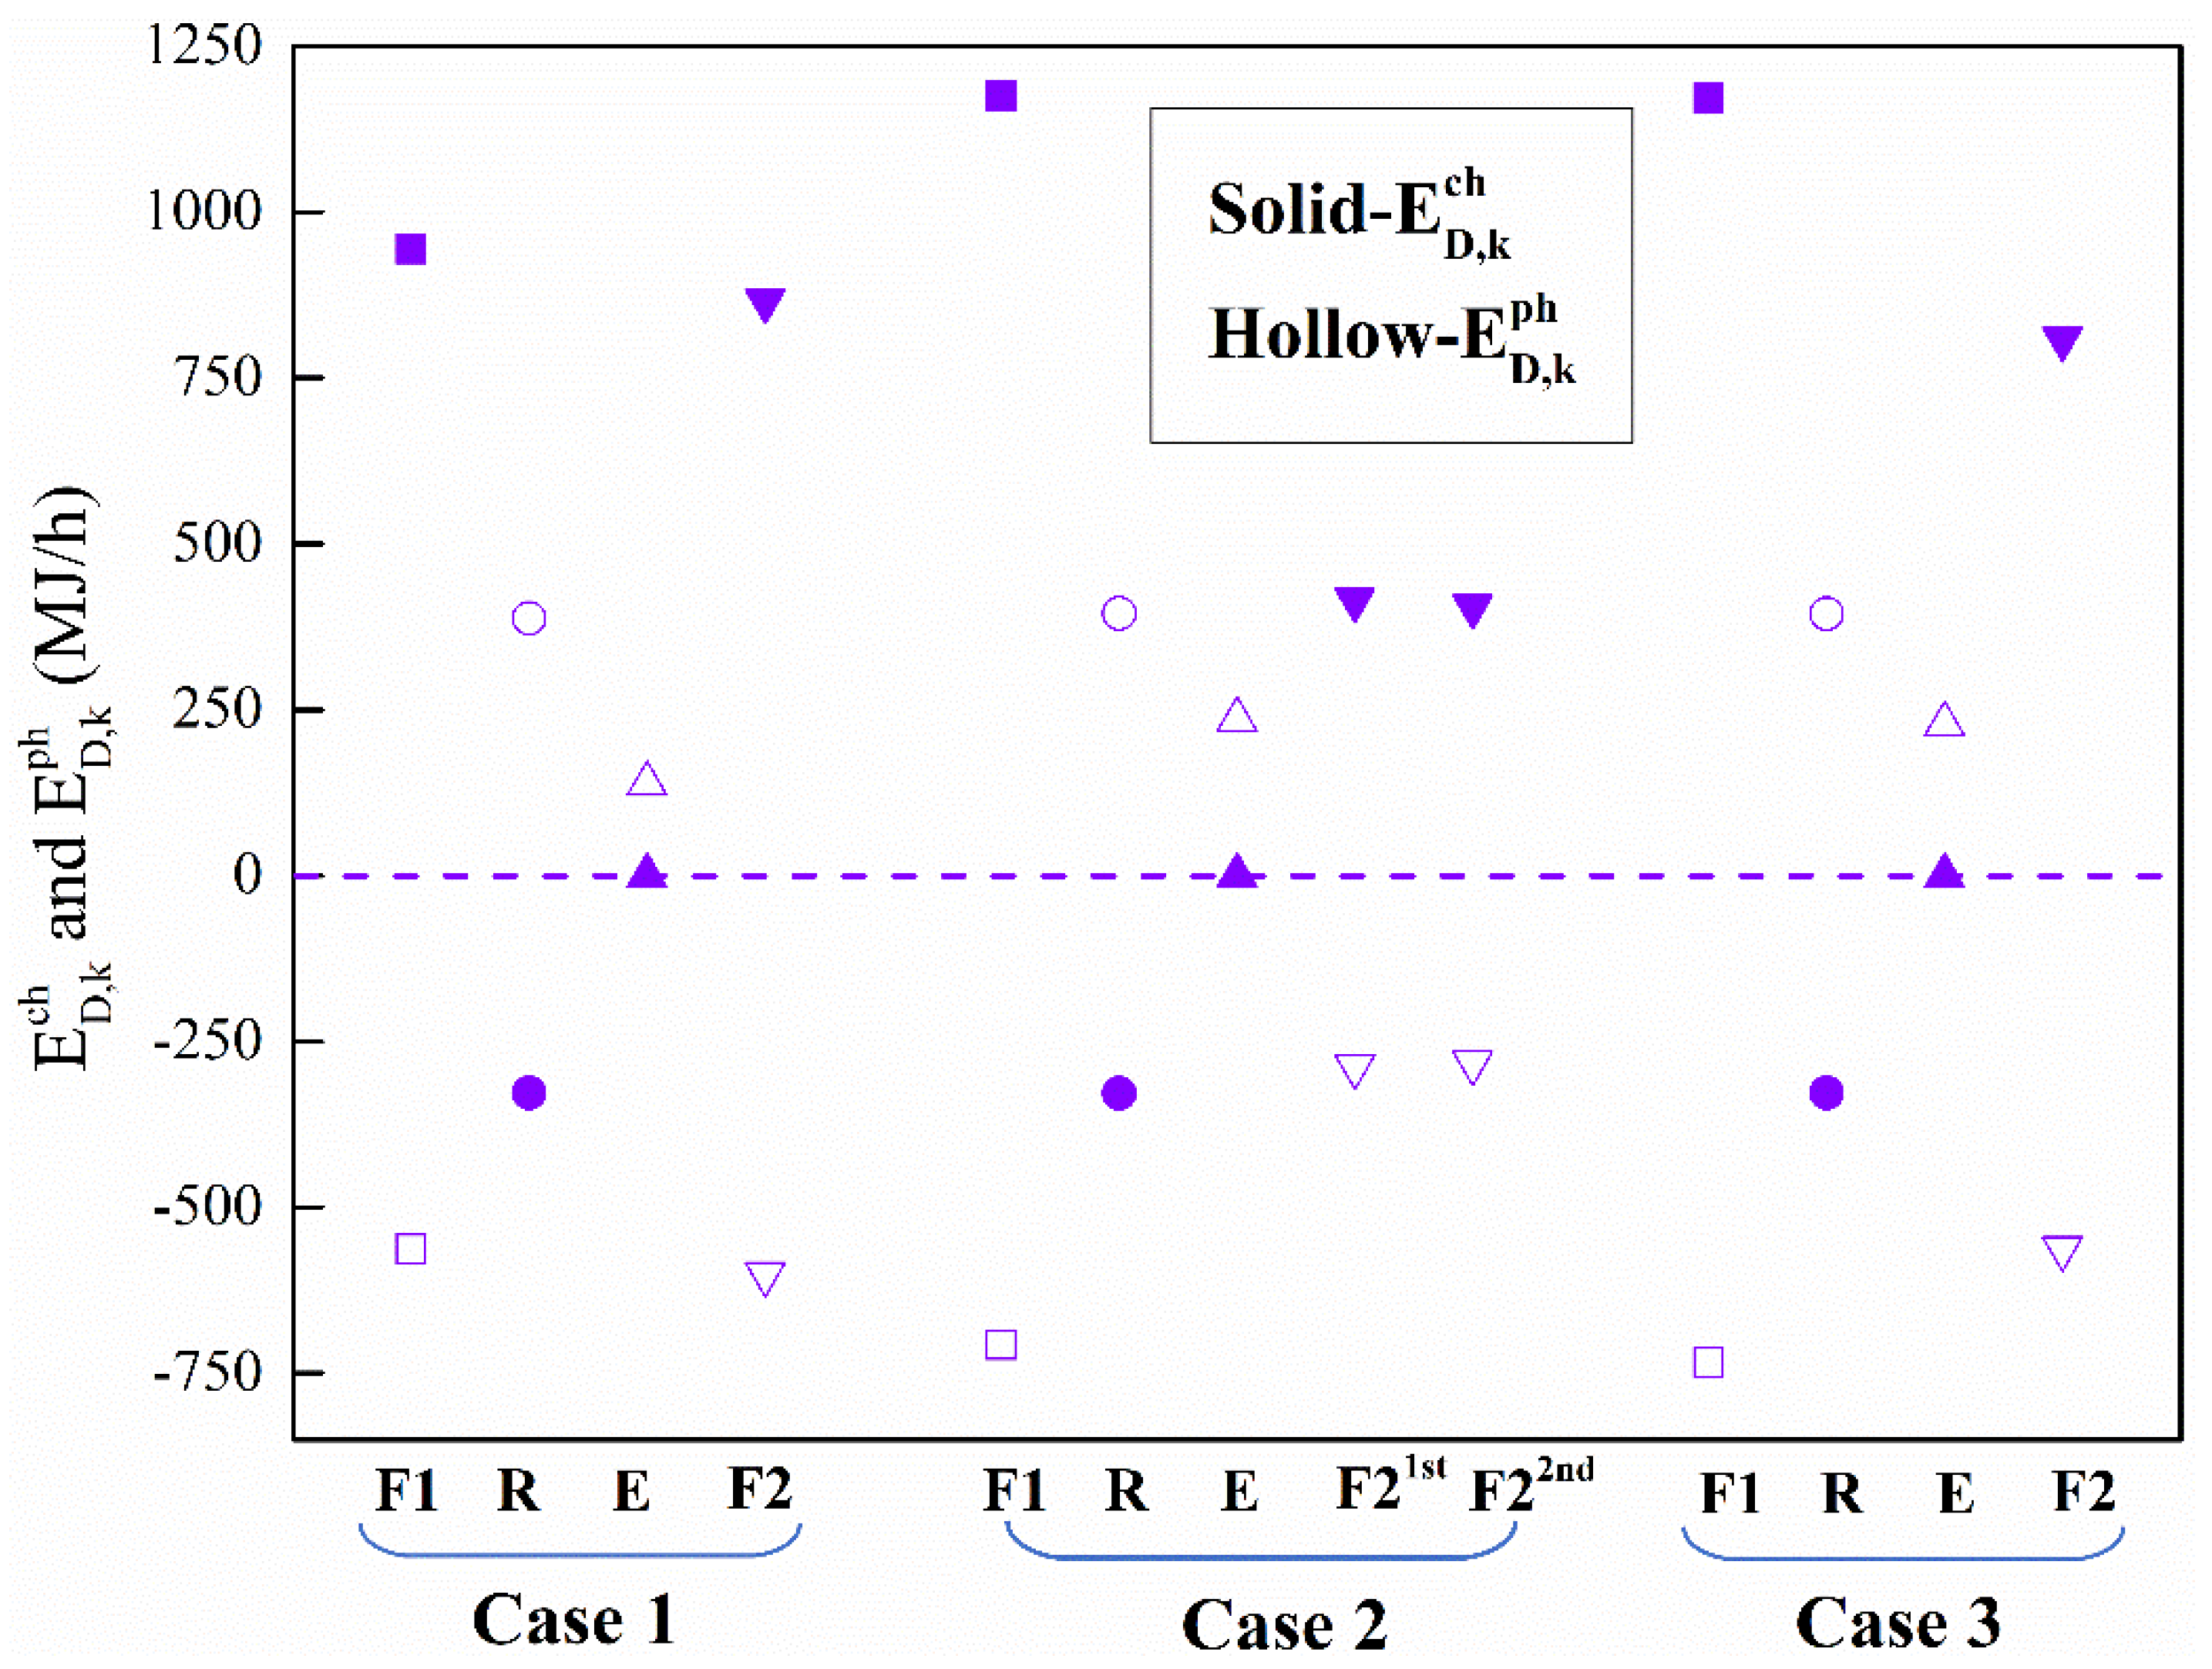
The exergy efficiency for each operation unit (F1, R, E, F2) is shown in Figure 4. The metallization process in the fluidized bed reactor system is designed according to the thermodynamic limits; thus, the exergy efficiency of R in cases 1, 2, and 3 approximately reaches 100%. It should be noted that the exergy efficiencies of components F1, R, E, and F2 in different cases are close, and the values can be ranked as φR > φE > φF1 ≈ φF2. The exergy destruction in components F1 and F2 is primarily caused by the chemical reaction occurring during the combustion of H2, whereas that in components R and E is mainly caused by physical exergy destruction, as shown in Figure 5. The exergy efficiencies of components F1 and F2 are lower than 70%, indicating high potential for improving thermodynamic performance. As a heat exchanger, the exergy efficiency of E in cases 1, 2, and 3 is around 81%, which is also far from satisfactory. With matched heat capacities of streams in a counterflow heat exchanger, the minimum irreversibility corresponds to ΔTmin→0 and negligibly small pressure losses, whereas in this study, ΔTmin is set to be 125 °C. Heat exchangers perform better when the heat transfer areas are increased, while the cost will be huge indeed; hence, there is a limiting size beyond which a further increase will not be justified economically.
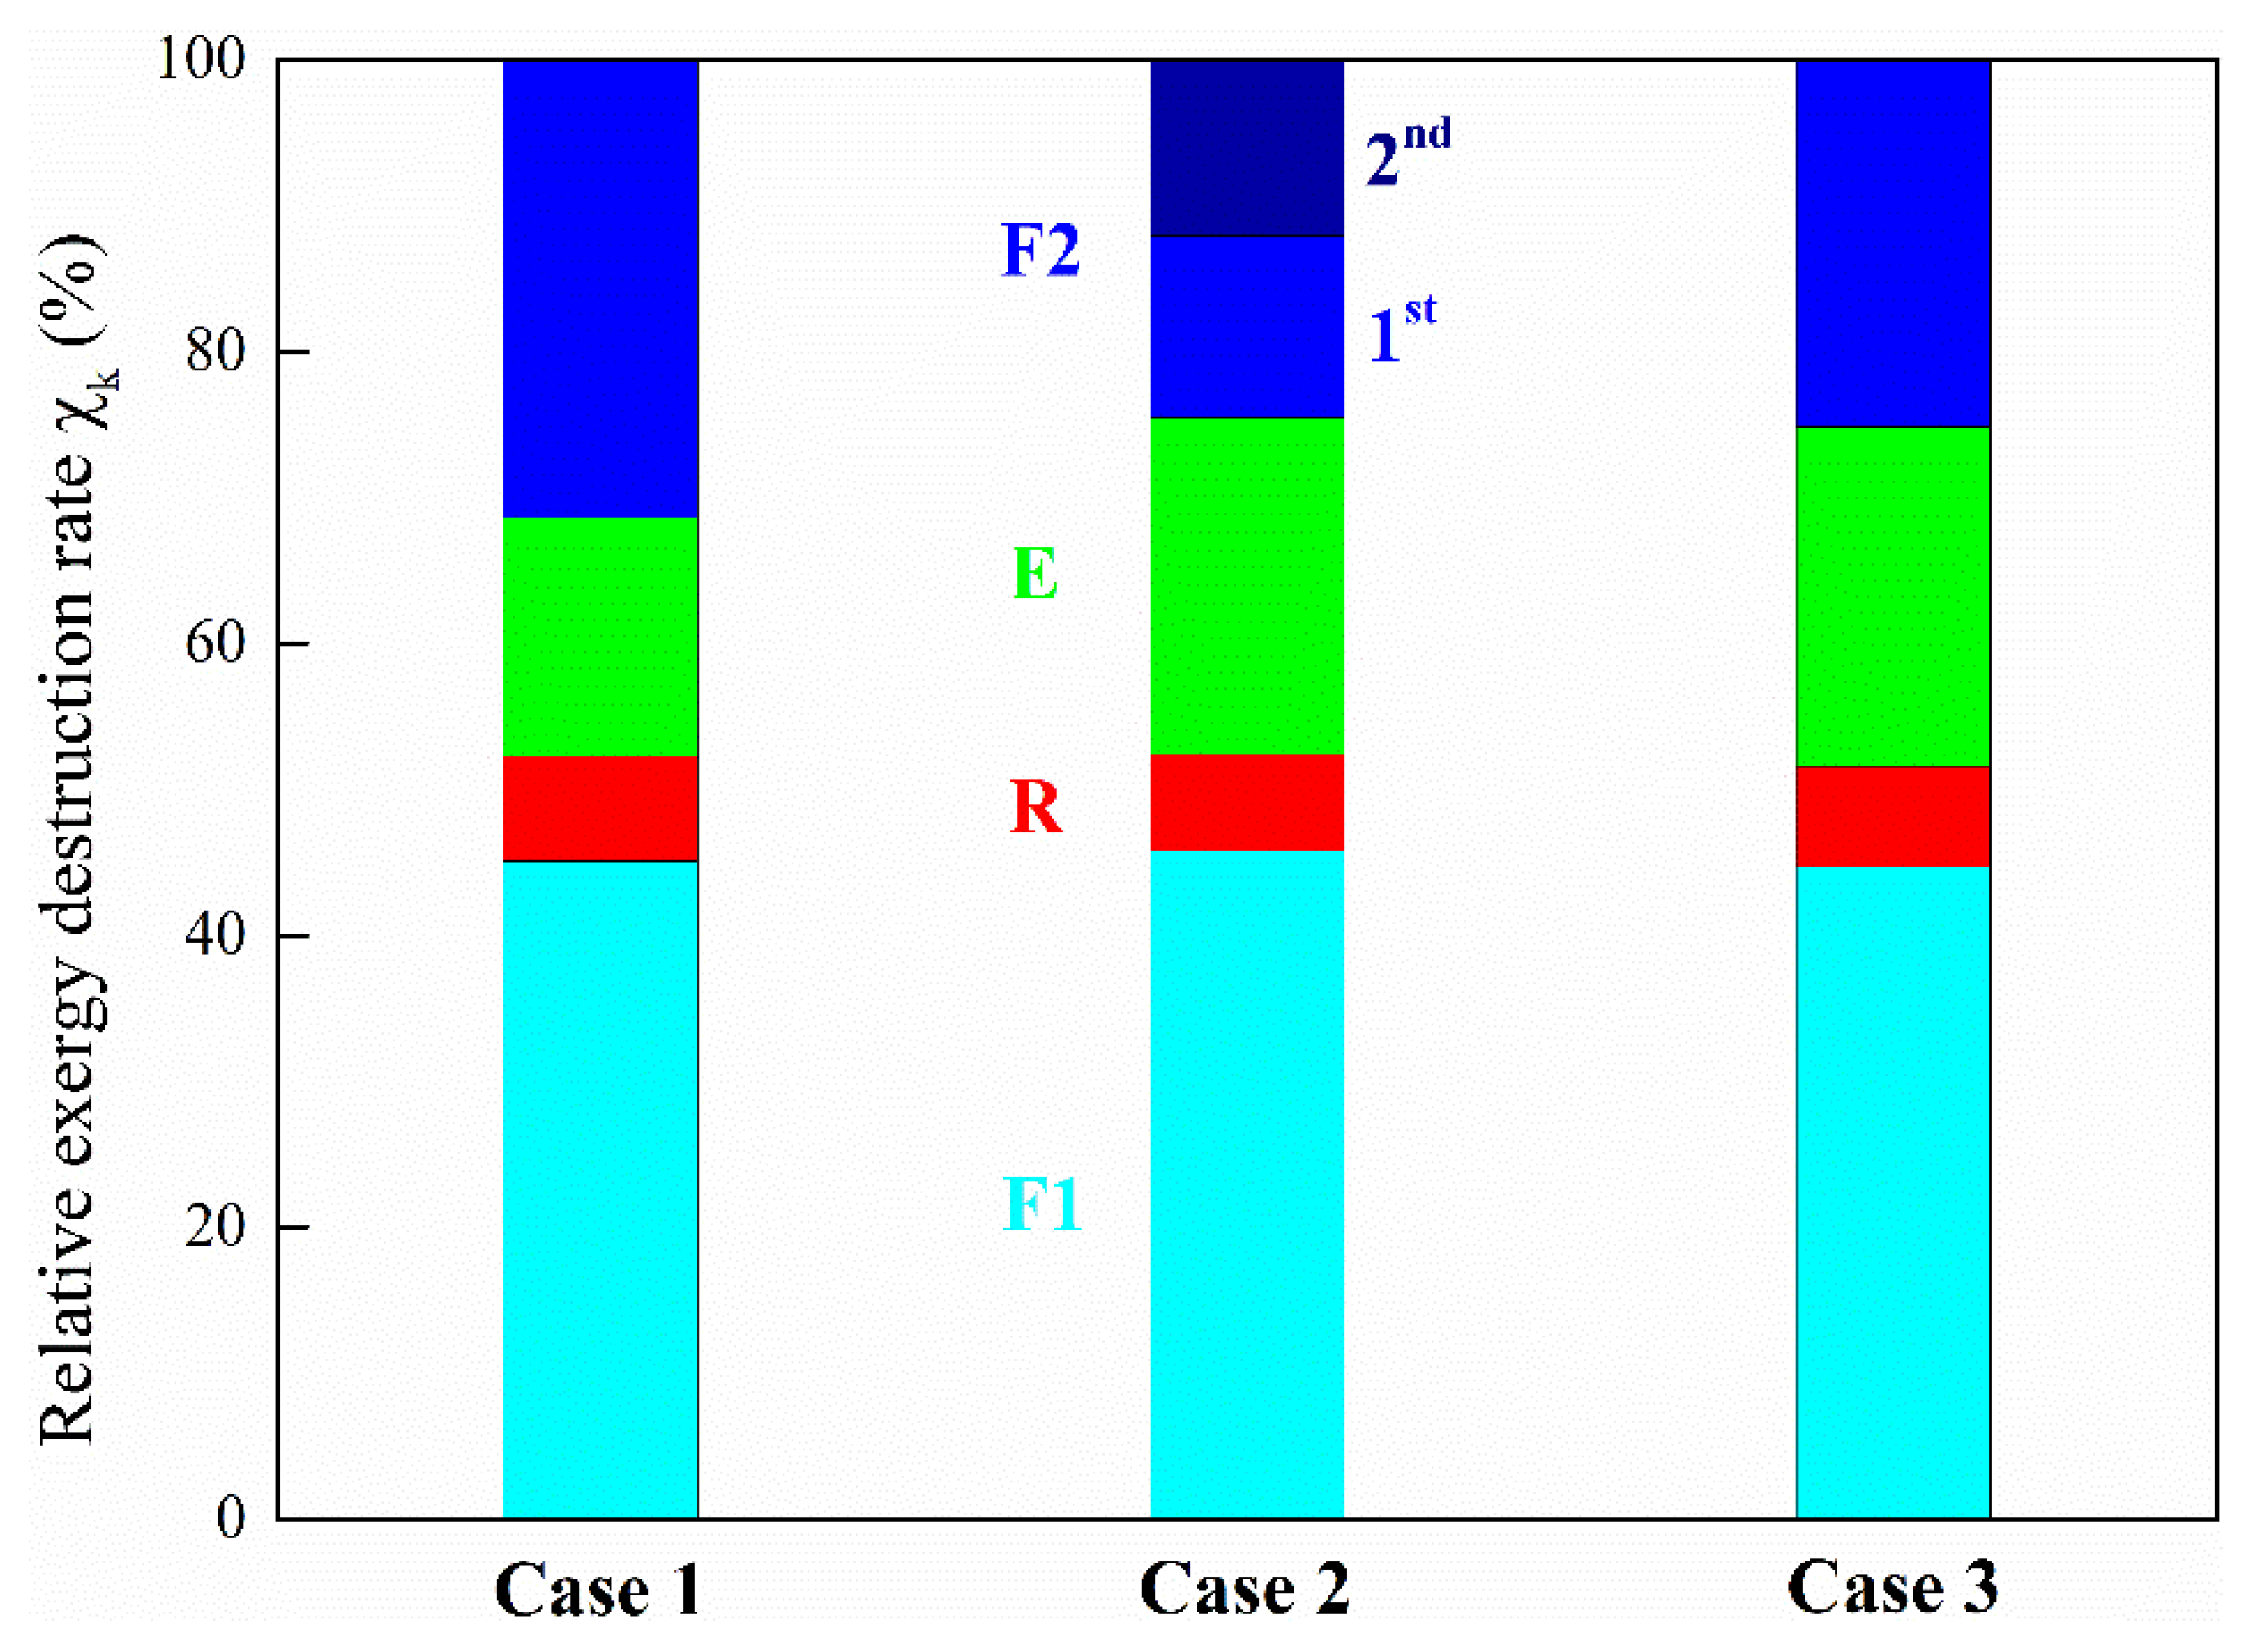
To compare the thermodynamic performance of component k in the H-FBDR system, the relative exergy destruction rate (χk) of component k is calculated, as shown in Figure 6. The preheating processes of iron ore (F1) occupy most of the exergy destruction in cases 1, 2, and 3, and the similar values are approximately 45%, indicating that component F1 presents the worst performance in cases 1, 2, and 3. The preheating processes of H2 (F2) come in second; although the exergy efficiency of component F2 in cases 1, 2, and 3 is similar to that of component F1 (Figure 4), the relative exergy destruction rate of component F2 in cases 2 and 3 is approximately half of component F1, implying that component F2 performs better than component F1 in cases 2 and 3. Regarding the heat recovery process, the relative exergy destruction rate of component E in case 1 is lower than that in cases 2 and 3, which should be attributed to the higher consumption of H2 in cases 2 and 3.

3.2. Influence of H2 Injected into the Fluidized Bed Reactor System

It has been demonstrated that the metallization process (first: Fe2O3→FeO; second: FeO→Fe) demands a smaller H2 quantity in theory, and the process performance with different ratios of H2 injected is carefully studied. The mass and heat flow in each operation unit (F1, R, E, F2) at different ratios of H2 injected are obtained through the analysis of mass and heat balance, as listed in Tables S16–S38 in the Supplementary Materials. As shown in Figure 7, the total H2 consumption in the H-FBDR system increases with the rising ratio of H2 injected into the fluidized bed reactor system. Nevertheless, a slight decrease appears as the ratio rises from 1.8 to 2.1. In this study, when η = 1.8 and the outlet gas composition from the second fluidized bed reactor (FeO→Fe) is equal to the thermodynamic limit value at 700 °C, the value of H2/(H2 + H2O) from the first fluidized bed reactor (Fe2O3→FeO) will be 0.7407. Thus, according to the thermodynamic calculation in Figure 2, the minimum temperature of the first fluidized bed reactor should be set to 570 °C, which is the critical temperature for Fe2O3→Fe3O4→FeO→Fe. If the reduction temperature is lower than 570 °C, the H2 reduction process will be Fe2O3→Fe3O4→Fe, similar to the situation in case 2. Results in Section 3.1 indicate that the energy use and exergy efficiency in case 2 are identical to those in case 3. Therefore, when the value of η is higher than 1.8, the H-FBDR system should be designed to operate in the mode of case 3. The H2 consumption of each operation unit (F1, R, F2) at different ratios of H2 injected is also calculated, as shown in Figure 8. Obviously, the H2 consumption in F2 at η = 1.8 is much higher than that at η = 2.1, which accounts for the slightly higher value of total H2 consumption (Figure 7).
Exergy efficiencies of components F1, R, E, and F2 at different ratios of H2 injected are shown in Figure 9. Due to the thermodynamic design, the exergy efficiencies of R with varying values of η also approximately reach 100%. It is interesting to see that the exergy efficiencies of components F1, E, and F2 drop as the value of η rises, while the lowest point presents at η = 1.8, and the situation at η = 2.1 is close to that at η = 2.5, which is higher than η = 1.8. A detailed description is as follows: for component F1, φη=1 ≈ φη=1.3 ≈ φη=2.1 ≈ φη=2.5 > φη=1.5 > φη=1.8; for component E, φη=1 > φη=1.3 > φη=1.5 > φη=2.1 ≈ φη=2.5 >> φη=1.8; and for component F2, φη=1 > φη=1.3 > φη=1.5 ≈ φη=2.1 ≈ φη=2.5 > φη=1.8. Exergy efficiency is applied to measure the differences between the actual process and the thermodynamically ideal one, which implies the extent of its thermodynamic perfection. Thus, the performances of components F1, E, and F2 in the H-FBDR system with η = 1.8 are furthest from the ideal thermodynamic state among the different ratios of H2 injected.
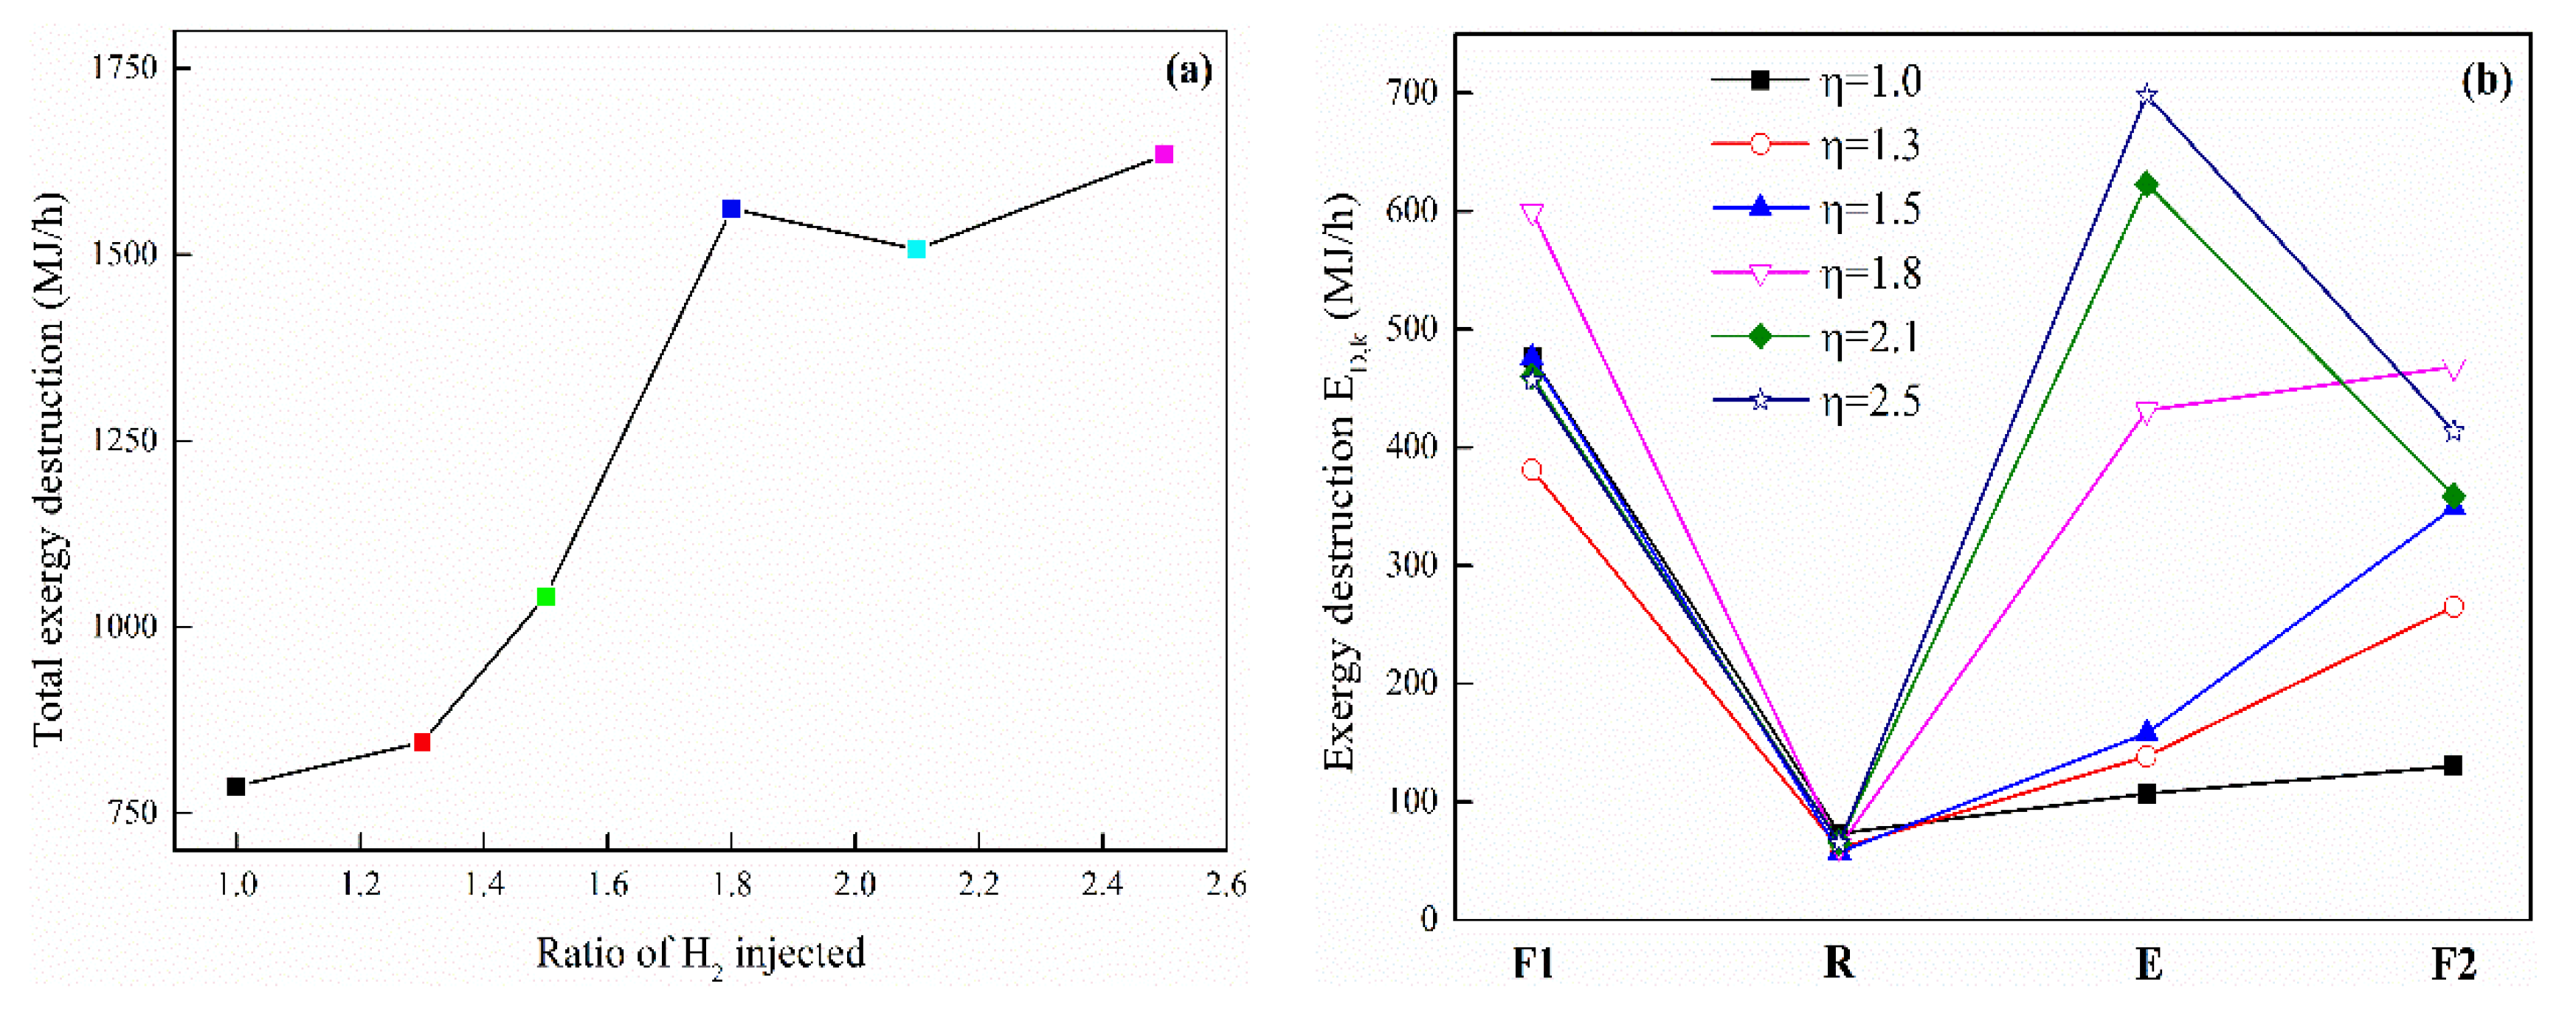
To identify the areas of improvement of the H-FBDR system at different ratios of H2 injected, the exergy destruction of the overall system and each component (F1, R, E, and F2) is compared, as shown in Figure 10. Interestingly, the trend of the total exergy destruction curve in Figure 10a is similar to that of the total H2 consumption curve in Figure 7. Thus, it is reasonable to believe that the total exergy destruction corresponds to the total H2 consumption of the H-FBDR system at different ratios of H2 injected, i.e., higher H2 consumption induces more exergy destruction. There are two features in Figure 10b. One is that the exergy destruction of component R gives the lowest value in the H-FBDR system at different ratios of H2 injected. The other feature is that the exergy destruction of component F1 occupies most of the H-FBDR system when the value of η is lower than 1.8, while component E dominates at η = 2.1 and η = 2.5, and this indicates that the thermodynamic performance of component E decreases at higher ratios of H2 injected. Notably, the exergy destruction of components F1, E, and F2 shows significant increases when the ratio of H2 injected is raised from 1.3 to 1.8, and more specifically, for component F1: (ED,F1)η=1.8 > (ED,F1)η=2.5 ≈ (ED,F1)η=2.1 ≈ (ED,F1)η=1.5 ≈ (ED,F1)η=1.0 > (ED,F1)η=1.3; for component E: (ED,E)η=2.5 > (ED,E)η=2.1 >> (ED,E)η=1.8 >> (ED,E)η=1.5 > (ED,E)η=1.3 > (ED,E)η=1.0; and for component F2: (ED,F2)η=1.8 > (ED,F2)η=2.5 > (ED,F2)η=2.1 ≈ (ED,F2)η=1.5 > (ED,F2)η=1.3 > (ED,F2)η=1.0.
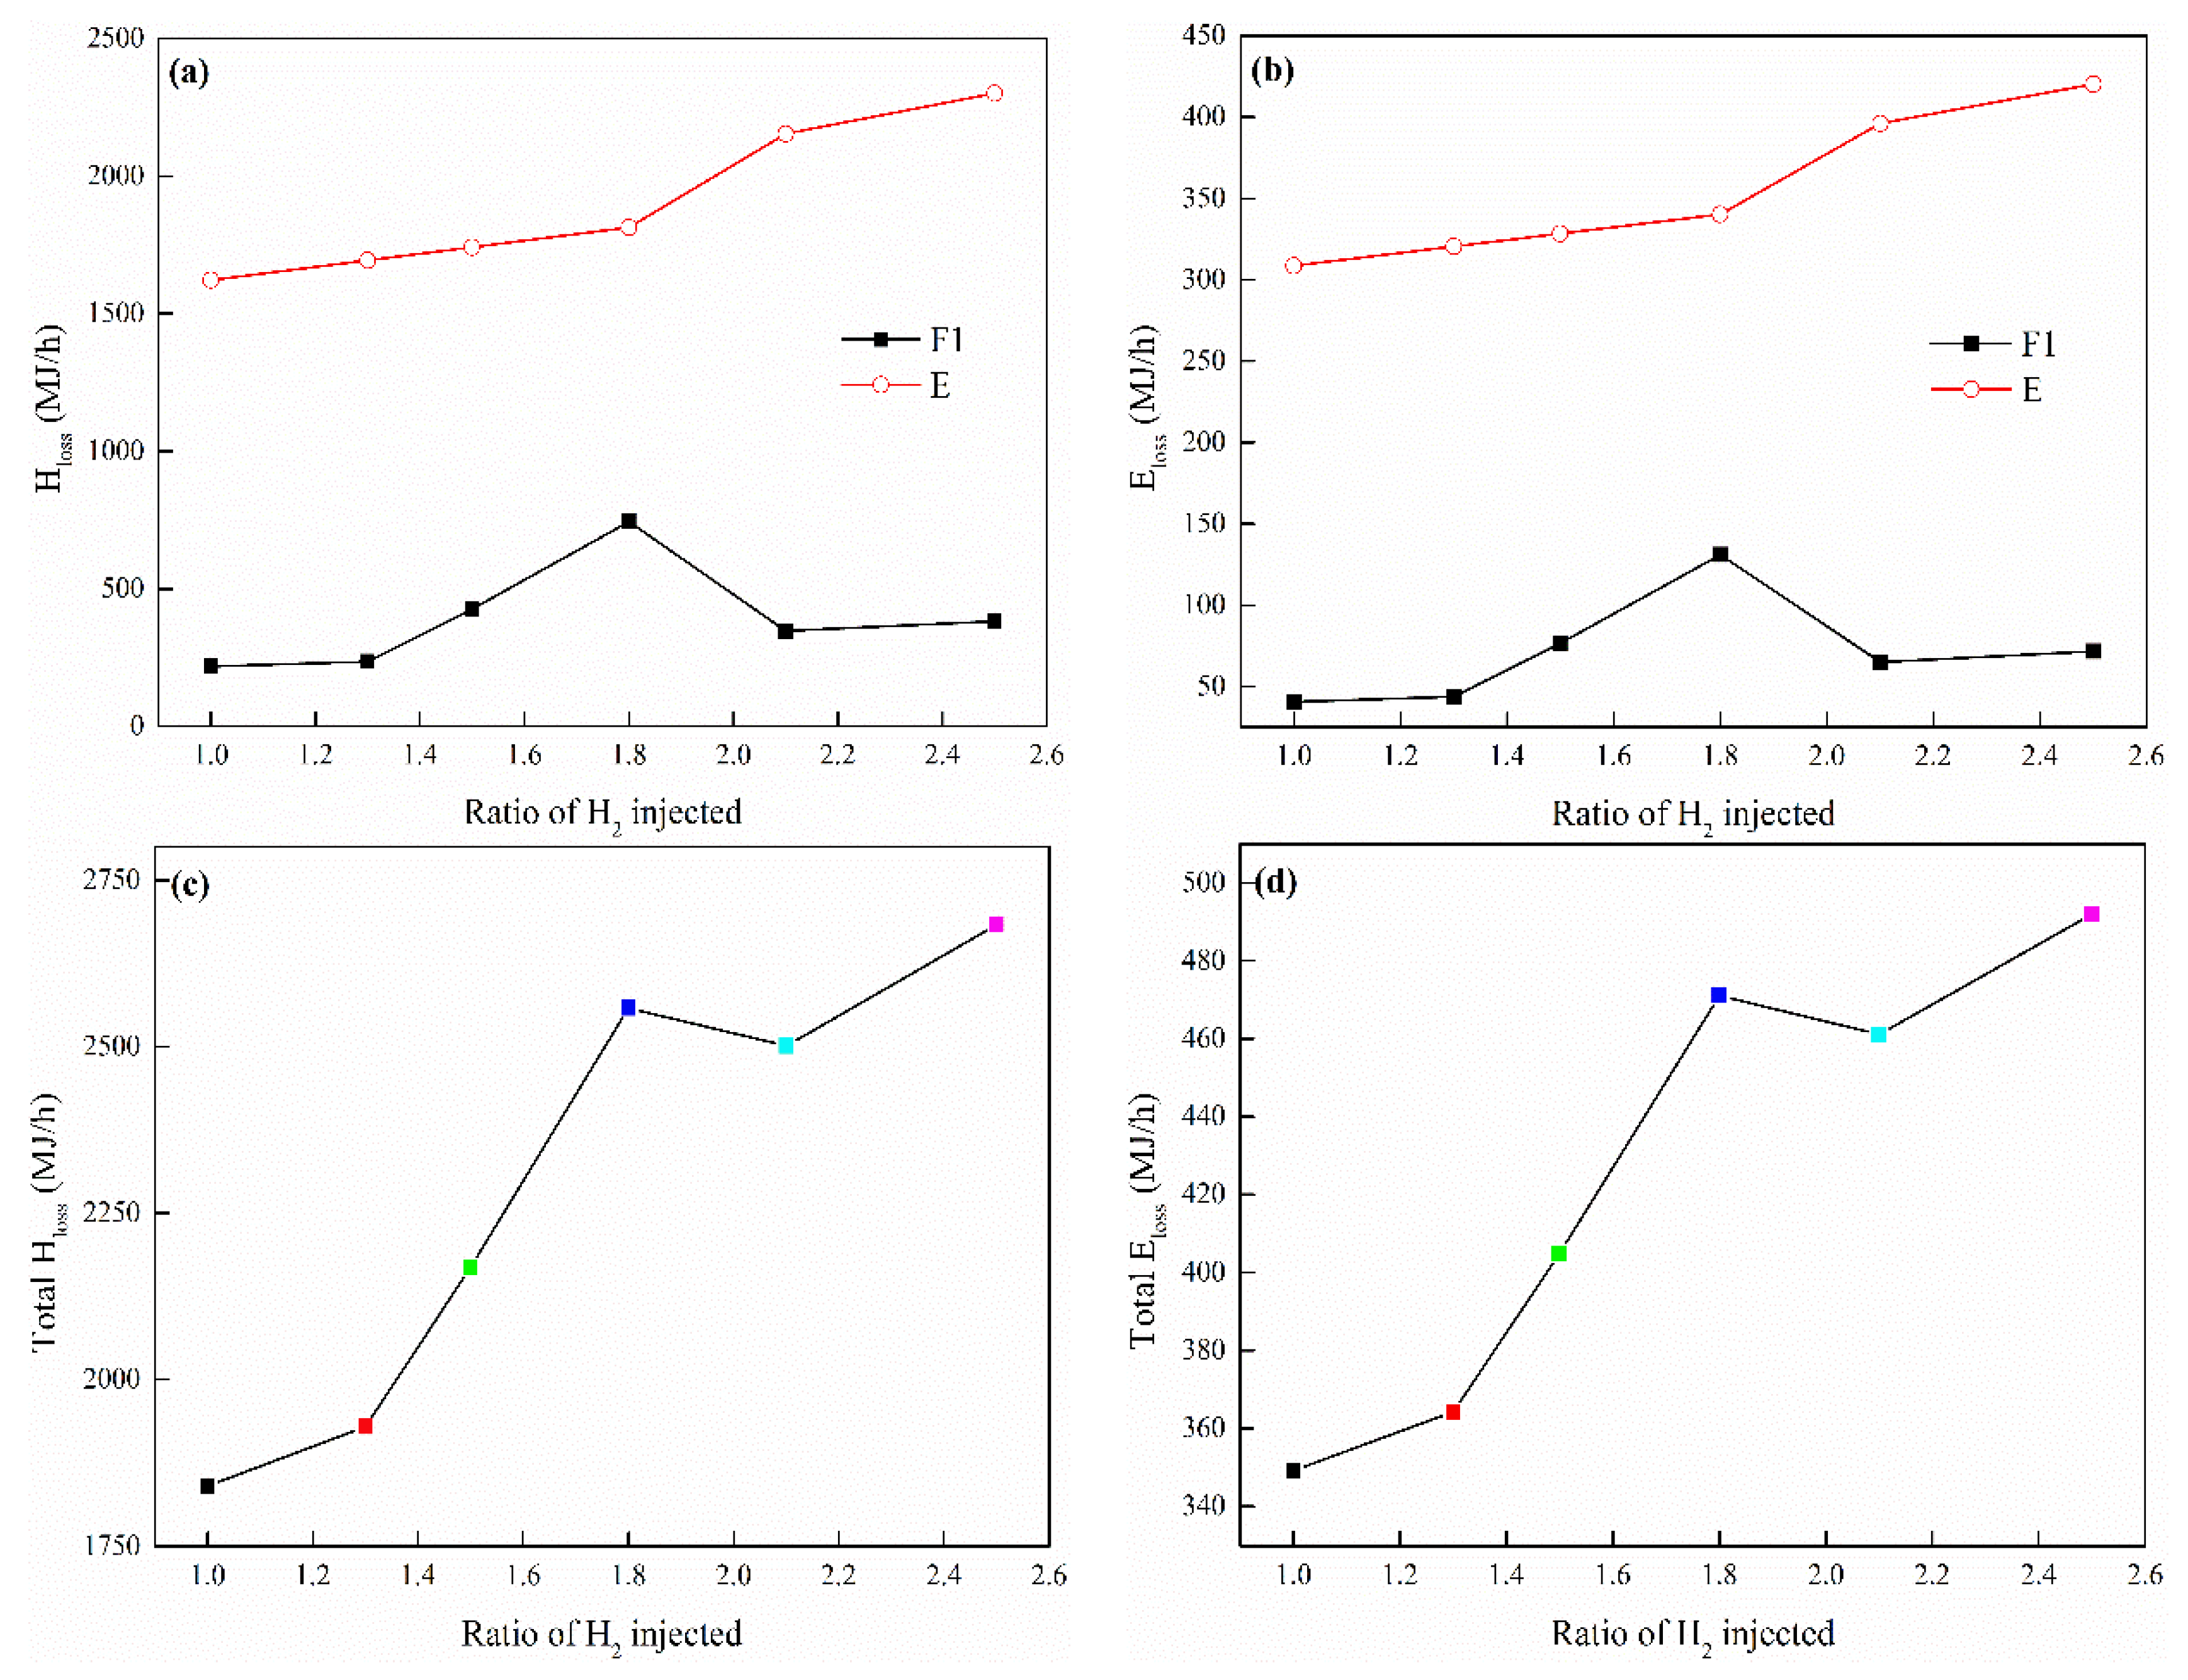
To clarify the energy use and exergy use of the overall H-FBDR system at different ratios of H2 injected, the energy loss and exergy loss are analyzed, as shown in Figure 11. According to the definitions of energy loss and exergy loss, i.e., energy and exergy flowing to the surroundings, the energy loss and exergy loss only occur in components F1 and E. The curves of Hloss are similar to those of Eloss at different ratios of H2 injected, whereas the proportion of Eloss,E/Eloss,F1 is higher than that of Hloss,E/Hloss,F1, and the proportion of Hloss/Eloss is more than 5. Total Hloss and total Eloss increase slowly when the ratio of H2 injected is raised from 1 to 1.3, whereas sharp rises are observed from 1.3 to 1.8, and then slight decreases appear at η = 2.1. It should be noted that the recycled gases (H2 + H2O) from component E occupy most of the energy loss and exergy loss of the H-FBDR system at different ratios of H2 injected, and the values are close when η is lower than 1.8; thus, the increases in the total losses are mainly caused by the tail gases from component F1.
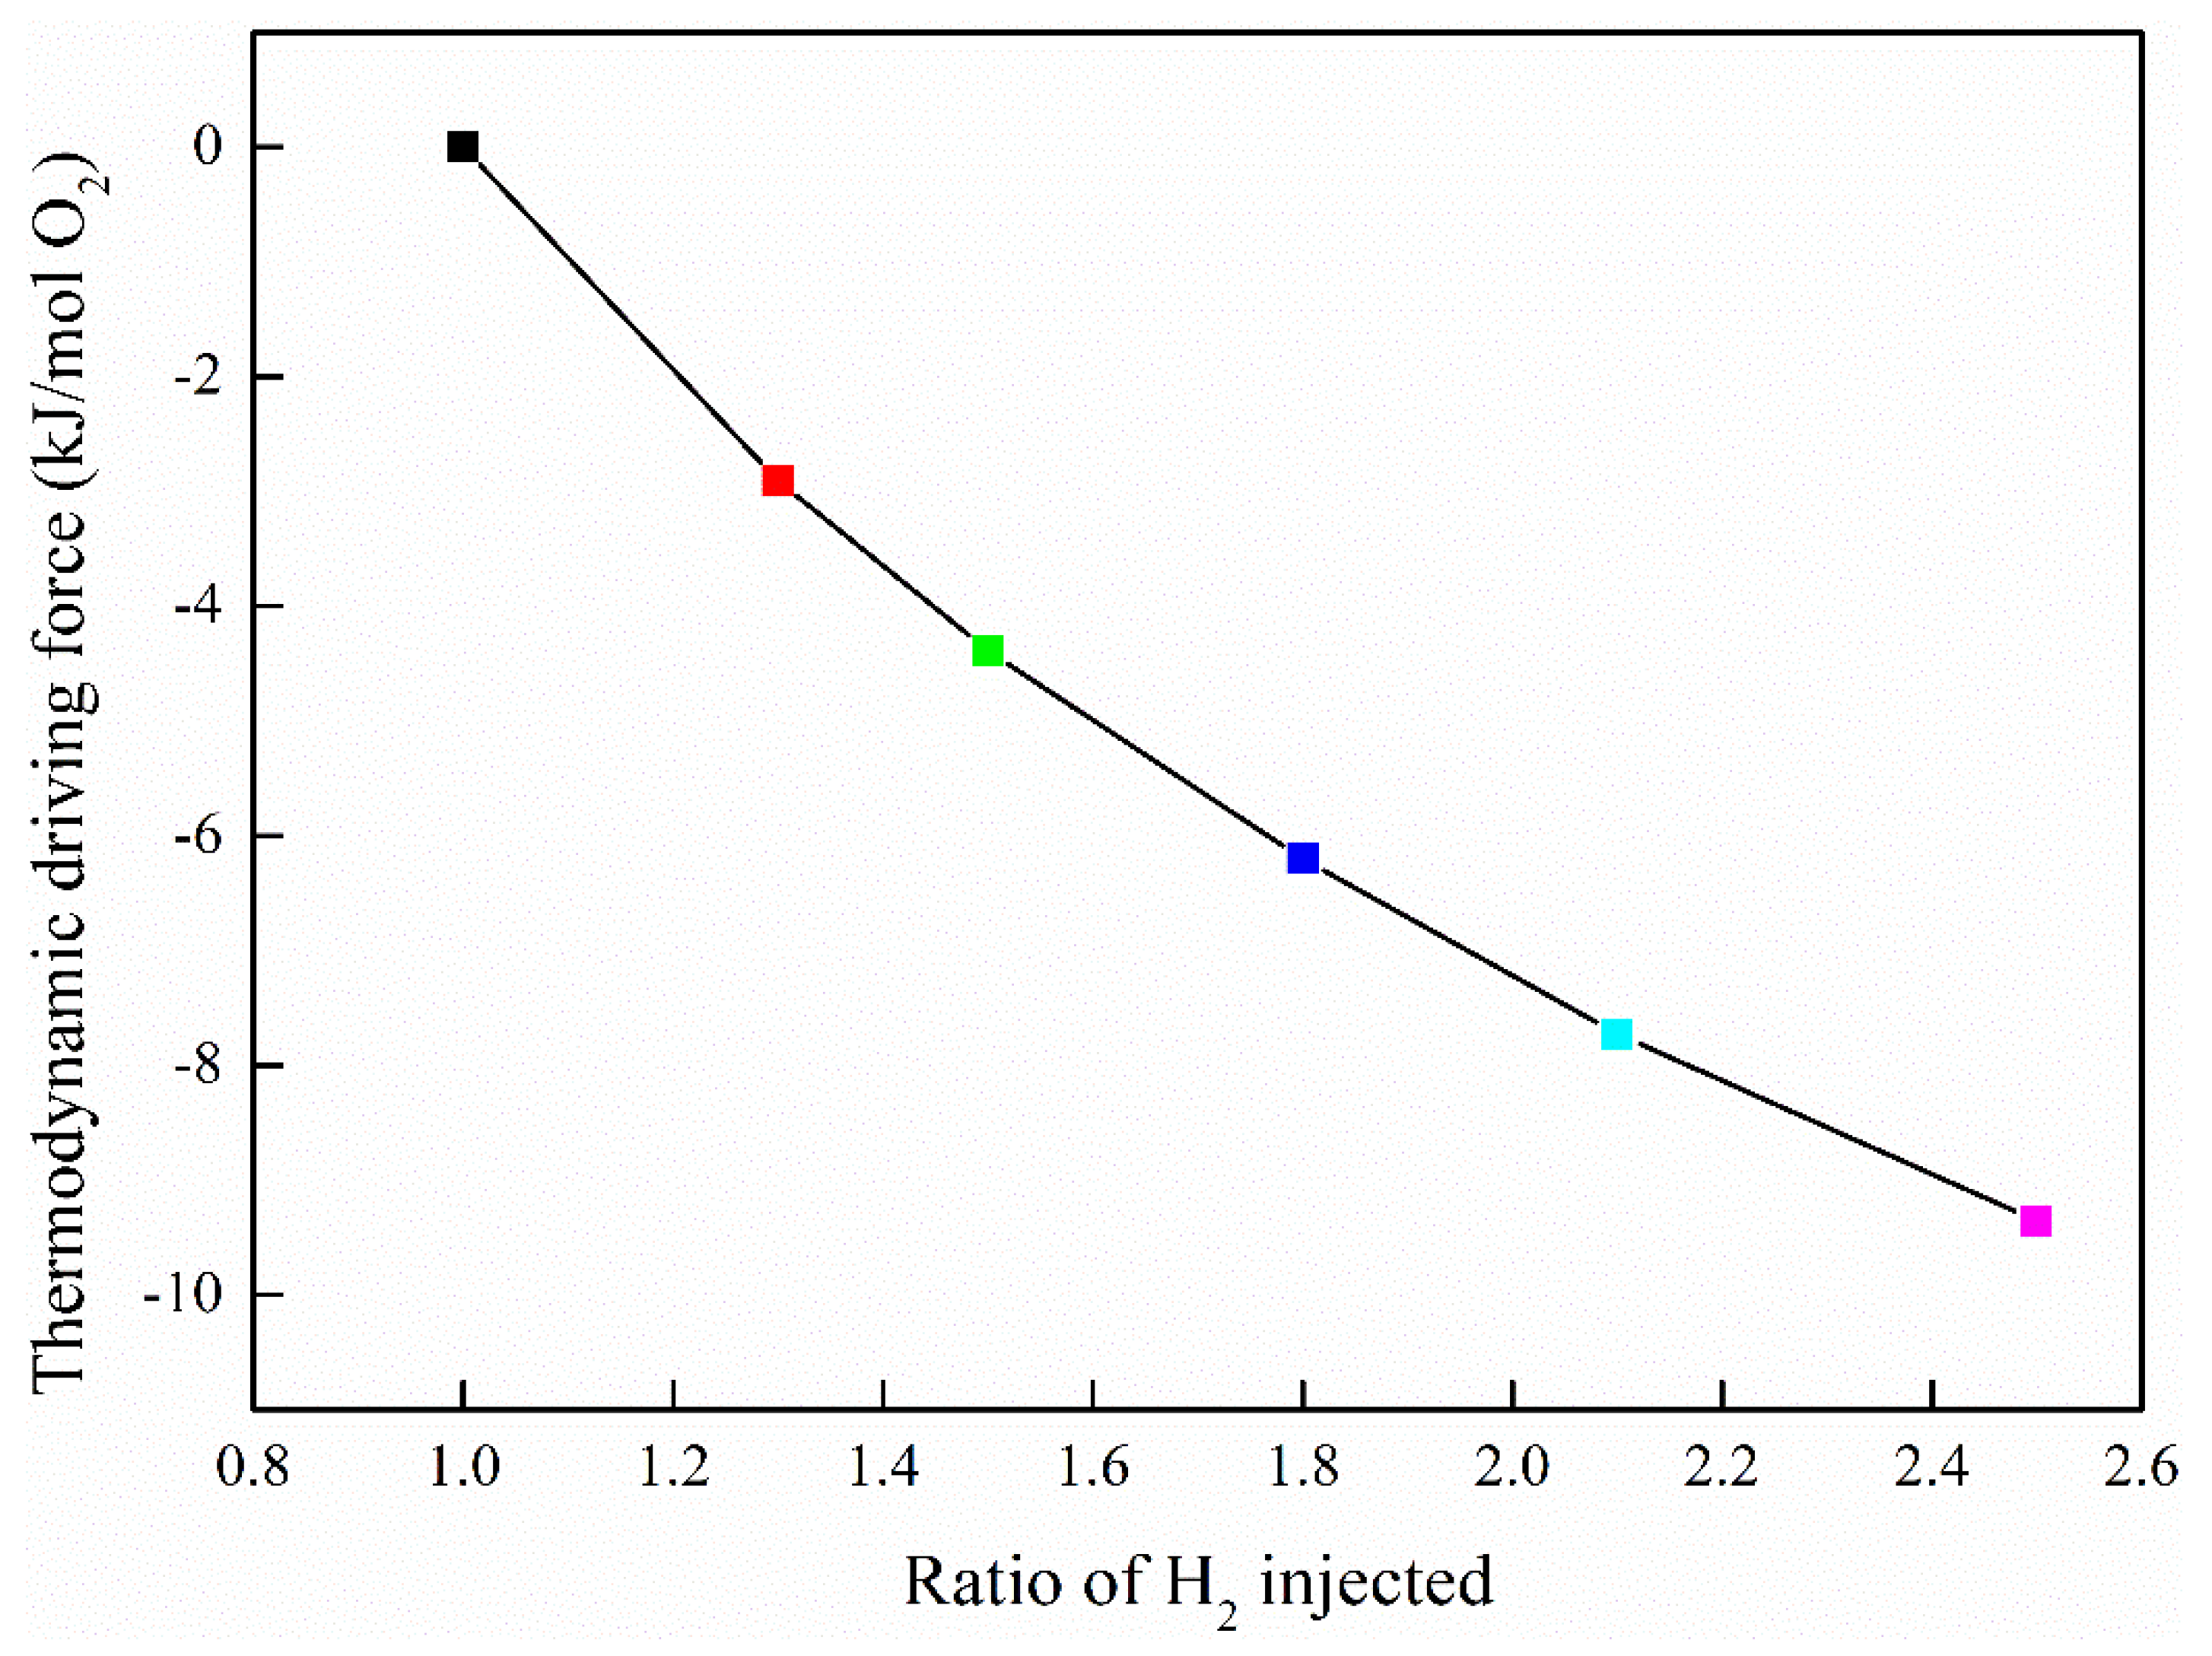
Altogether, considering the H2 consumption, thermodynamic efficiency, and energy/exergy losses, the ratio of H2 injected should be lower than η = 1.3, and the lower value seems to be better. However, the ratio of H2 injected determines the thermodynamic driving force, as shown in Figure 12; thus, in terms of the reduction kinetics (FeO→Fe), a higher value of η will be more favorable. The specific value of η between 1 and 1.3 will be determined by the actual reduction kinetics and operating parameters of the fluidized bed reactor system. From the standpoint of energy use in the overall system, the heat recovery of the recycled gases (H2 + H2O) from component E plays a decisive role in minimizing the process energy losses. As for the thermodynamic efficiency, the improvement in the performance of components F1 and F2 should be given significant attention.

4. Conclusions

In the present study, the effects of the metallization process and ratios of H2 injected on the energy and exergy use of a hydrogen-based fluidized bed direct reduction system are carefully studied. For different metallization processes, the two-stage reduction process (first: Fe2O3→FeO; second: FeO→Fe) based on thermodynamic design requires a smaller H2 quantity than the low→high metallization process and the one-stage process. The exergy efficiencies of components F1, R, E, and F2 can be ranked as φR > φE > φF1 ≈ φF2, and the exergy destruction in components F1 and F2 is mainly caused by the combustion reaction, whereas physical exergy destruction dominates for components R and E. Total H2 consumption, total exergy destruction, and total energy/exergy losses rise with the increasing ratios of H2 injected, and sharp increases are observed from η = 1.3 to η = 1.8, whereas slight decreases appear from η = 1.8 to η = 2.1, and the variations in those curves show similar trends. It has been demonstrated that η = 1.8 is a critical point according to the thermodynamic design of the two-stage reduction process. If the value of η is higher than 1.8, the reduction will be accomplished via the one-stage process. The performances of components F1, E, and F2 degrade from η = 1.0 to η = 1.8, and significant degradation arises when the value of η exceeds 1.3. Thus, considering the H2 consumption, thermodynamic efficiency, and energy/exergy losses, the ratio of H2 injected should be set below 1.3. According to the energy and exergy analysis of the overall system, the energy loss of the H-FBDR system is 2 GJ/h at η = 1.3, in which the recycled gases from component E occupy 1.7 GJ/h, and the total exergy destruction is 900 MJ/h. Therefore, great efforts should be made to recover the heat of the recycled gases from component E to raise the process energy efficiency, and the thermodynamic performance of components F1 and F2 should be significantly improved to minimize the exergy destruction. In future studies, we will study and evaluate the role of energy used to produce hydrogen in the system energy balance.

Supplementary Materials

The following supporting information can be downloaded at: https://www.mdpi.com/article/10.3390/pr11092748/s1. Table S1: Mass, heat, and exergy flows in F1 for case 1; Table S2: Mass, heat, and exergy flows in R1st for case 1; Table S3: Mass, heat, and exergy flows in R2nd for case 1; Table S4: Mass, heat, and exergy flows in E for case 1; Table S5: Mass, heat, and exergy flows in F2 for case 1; Table S6: Mass, heat, and exergy flows in F1 for case 2; Table S7: Mass, heat, and exergy flows in R1st for case 2; Table S8: Mass, heat, and exergy flows in R2nd for case 2; Table S9: Mass, heat, and exergy flows in E for case 2; Table S10: Mass, heat, and exergy flows in F21st for case 2; Table S11: Mass, heat, and exergy flows in F22nd for case 2; Table S12: Mass, heat, and exergy flows in F1 for case 3; Table S13: Mass, heat, and exergy flows in R for case 3; Table S14: Mass, heat, and exergy flows in E for case 3; Table S15: Mass, heat, and exergy flows in F2 for case 3; Table S16: Mass, heat, and exergy flows in F1 for η = 1.0; Table S17: Mass, heat, and exergy flows in R1st for η = 1.0; Table S18: Mass, heat, and exergy flows in R2nd for η = 1.0; Table S19: Mass, heat, and exergy flows in E for η = 1.0; Table S20: Mass, heat, and exergy flows in F2 for η = 1.0; Table S21: Mass, heat, and exergy flows in F1 for η = 1.5; Table S22: Mass, heat, and exergy flows in R1st for η = 1.5; Table S23: Mass, heat, and exergy flows in R2nd for η = 1.5; Table S24: Mass, heat, and exergy flows in E for η = 1.5; Table S25: Mass, heat, and exergy flows in F2 for η = 1.5; Table S26: Mass, heat, and exergy flows in F1 for η = 1.8; Table S27: Mass, heat, and exergy flows in R1st for η = 1.8; Table S28: Mass, heat, and exergy flows in R2nd for η = 1.8; Table S29: Mass, heat, and exergy flows in E for η = 1.8; Table S30: Mass, heat, and exergy flows in F2 for η = 1.8; Table S31: Mass, heat, and exergy flows in F1 for η = 2.1; Table S32: Mass, heat, and exergy flows in R for η = 2.1; Table S33: Mass, heat, and exergy flows in E for η = 2.1; Table S34: Mass, heat, and exergy flows in F2 for η = 2.1; Table S35: Mass, heat, and exergy flows in F1 for η = 2.5; Table S36: Mass, heat, and exergy flows in R for η = 2.5; Table S37: Mass, heat, and exergy flows in E for η = 2.5; Table S38: Mass, heat, and exergy flows in F2 for η = 2.5.

Author Contributions

Writing—original draft, Z.D.; Writing—review & editing, Funding acquisition, W.L.; Funding acquisition, F.P. and Z.Z. All authors have read and agreed to the published version of the manuscript.

Funding

This research was funded by [National Natural Science Foundation of China] grant number [22278404 and 22078326] And The APC was funded by Chinalco Environmental Protection and Energy Conservation Group Co., Ltd.

Data Availability Statement

All relevant data are within the manuscript and its Supplementary Materials.

Acknowledgments

The authors wish to gratefully acknowledge the financial support from the National Natural Science Foundation of Chinaand Chinalco Environmental Protection and Energy Conservation Group Co., Ltd.

Conflicts of Interest

The authors declare that they have no known competing financial interest or personal relationships that could have appeared to influence the work reported in this paper.

References

  1. Quader, M.; Ahmed, S.; Dawal, S.; Nukman, Y. Present needs, recent progress and future trends of energy-efficient Ultra-Low Carbon Dioxide (CO2) Steelmaking (ULCOS) program. Renew. Sustain. Energy Rev. 2016, 55, 537–549. [Google Scholar] [CrossRef]
  2. Vogl, V.; Åhman, M.; Nilsson, L. Assessment of hydrogen direct reduction for fossil-free steelmaking. J. Clean. Prod. 2018, 203, 736–745. [Google Scholar] [CrossRef]
  3. Zhao, J.; Zuo, H.; Wang, Y.; Wang, J.; Xue, Q. Review of green and low-carbon ironmaking technology. Ironmak. Steelmak. 2020, 47, 296–306. [Google Scholar] [CrossRef]
  4. Ariyama, T.; Takahashi, K.; Kawashiri, Y.; Nouchi, T. Diversification of the ironmaking process toward the long-term global goal for carbon dioxide mitigation. J. Sustain. Metall. 2019, 5, 276–294. [Google Scholar] [CrossRef]
  5. Tang, J.; Chu, M.; Li, F.; Feng, C.; Liu, Z.; Zhou, Y. Development and progress on hydrogen metallurgy. Int. J. Miner. Metall. Mater. 2020, 27, 713–723. [Google Scholar] [CrossRef]
  6. Li, F.; Chu, M.; Tang, J.; Liu, Z.; Zhou, Y.; Wang, J. Exergy analysis of hydrogen-reduction based steel production with coal gasification-shaft furnace-electric furnace process. Int. J. Hydrogen Energy 2021, 46, 12771–12783. [Google Scholar] [CrossRef]
  7. Ma, K.; Deng, J.; Wang, G.; Zhou, Q.; Xu, J. Utilization and impacts of hydrogen in the ironmaking processes: A review from lab-scale basics to industrial practices. Int. J. Hydrogen Energy 2021, 46, 26646–26664. [Google Scholar] [CrossRef]
  8. Schenk, J. Recent status of fluidized bed technologies for producing iron input materials for steelmaking. Particuology 2011, 9, 14–23. [Google Scholar] [CrossRef]
  9. Hasanbeigi, A.; Arens, M.; Price, L. Alternative emerging ironmaking technologies for energy-efficiency and carbon dioxide emissions reduction: A technical review. Renew. Sustain. Energy Rev. 2014, 33, 645–658. [Google Scholar] [CrossRef]
  10. Du, Z.; Liu, J.; Liu, F.; Pan, F. Relationship of particle size, reaction and sticking behavior of iron ore fines toward efficient fluidized bed reduction. Chem. Eng. J. 2022, 447, 137588. [Google Scholar] [CrossRef]
  11. Oscar, H.; Magnus, T.; Du, S. Experimental study on hydrogen reduction of industrial fines in fluidized bed. Ironmak. Steelmak. 2021, 48, 936–943. [Google Scholar] [CrossRef]
  12. Wang, R.R.; Zhao, Y.Q.; Babich, A.; Senk, D.; Fan, X.Y. Hydrogen direct reduction (H-DR) in steel industry—An overview of challenges and opportunities. J. Clean. Prod. 2021, 329, 129797. [Google Scholar] [CrossRef]
  13. Li, S.; Zhang, H.; Nie, J.; Dewil, R.; Baeyens, J.; Deng, Y. The direct reduction of iron ore with hydrogen. Sustainability 2021, 13, 8866. [Google Scholar] [CrossRef]
  14. Wolfinger, T.; Spreitzer, D.; Schenk, J. Analysis of the usability of iron ore ultra-fines for hydrogen-based fluidized bed direct reduction—A review. Materials 2022, 15, 2687. [Google Scholar] [CrossRef]
  15. Squires, A.; Johnson, C. The H-iron process. JOM 1957, 9, 586–590. [Google Scholar] [CrossRef]
  16. Cavaliere, P. Clean Ironmaking and Steelmaking Processes: Efficient Technologies for Greenhouse Emissions Abatement; Springer: Cham, Switzerland, 2019. [Google Scholar]
  17. Guo, Z.; Gong, X. Sticking Mechanism and Suppression Technology of Fluidized Reduced Iron Ore Powder; Science Press: Beijing, China, 2017. [Google Scholar]
  18. Gudenau, H.; Komatina, M. The sticking problem during direct reduction of fine iron ore in the fluidized bed. Metalurgija 2004, 10, 309–328. [Google Scholar] [CrossRef]
  19. Du, Z.; Zhu, Q.; Fan, C.; Pan, F.; Li, H.; Xie, Z. Influence of reduction condition on the morphology of newly formed metallic iron during the fluidized bed reduction of fine iron ores and its corresponding agglomeration behavior. Steel Res. Int. 2016, 87, 789–797. [Google Scholar] [CrossRef]
  20. Du, Z.; Zhu, Q.; Yang, Y.; Fan, C.; Pan, F.; Sun, H.; Xie, Z. The role of MgO powder in preventing defluidization during fluidized bed reduction of fine iron ores with different iron valences. Steel Res. Int. 2016, 87, 1742–1749. [Google Scholar] [CrossRef]
  21. Du, Z.; Zhu, Q.; Fan, C.; Pan, F.; Xie, Z. Enhanced effect and mechanism of Fe2O3 on CaO for defluidization inhibition during fluidized bed reduction of iron ore fines. Powder Technol. 2017, 313, 82–87. [Google Scholar] [CrossRef]
  22. Du, Z.; Ge, Y.; Liu, F.; Fan, C.; Pan, F. Effect of different modification methods on fluidized bed hydrogen reduction of cohesive iron ore fines. Powder Technol. 2022, 400, 117226. [Google Scholar] [CrossRef]
  23. Zhu, Q.; Wu, R.; Li, H. Direct reduction of hematite powders in a fluidized bed reactor. Particuology 2013, 11, 294–300. [Google Scholar] [CrossRef]
  24. Li, J.; Kong, J.; Zhu, Q.; Li, H. Efficient synthesis of iron nanoparticles by self-agglomeration in a fluidized bed. AIChE J. 2017, 63, 459–468. [Google Scholar] [CrossRef]
  25. Li, J.; Kong, J.; He, S.; Zhu, Q.; Li, H. Self-agglomeration mechanism of iron nanoparticles in a fluidized bed. Chem. Eng. Sci. 2018, 177, 455–463. [Google Scholar] [CrossRef]
  26. Gyftopoulos, E.; Beretta, G. Thermodynamics: Foundations and Applications; Dover Publications: New York, NY, USA, 2005. [Google Scholar]
  27. Szargut, J. Exergy Method: Technical and Ecological Applications; WIT Press: Southampton, UK, 2005. [Google Scholar]
  28. Peltola, P.; Tynjälä, T.; Ritvanen, J.; Hyppänen, T. Mass, energy, and exergy balance analysis of chemical looping with oxygen uncoupling (CLOU) process. Energy Convers. Manag. 2014, 87, 483–494. [Google Scholar] [CrossRef]
  29. Qi, H.; Cui, P.; Liu, Z.; Xu, Z.; Yao, D.; Wang, Y.; Zhu, Z.; Yang, S. Conceptual design and comprehensive analysis for novel municipal sludge gasification-based hydrogen production via plasma gasifier. Energy Convers. Manag. 2021, 245, 114635. [Google Scholar] [CrossRef]
  30. Ma, S.; Hani, E.H.B.; Tao, H.; Xu, Q. Exergy, economic, and optimization of a clean hydrogen production system using waste heat of a steel production factory. Int. J. Hydrogen Energy 2022, 47, 26067–26081. [Google Scholar] [CrossRef]
  31. Yang, Y.; Shen, Z.; Wen, X.; Liu, H. Energy and emission analysis of flash ironmaking-powder generation coupling processes with various fuels. Appl. Therm. Eng. 2022, 217, 119280. [Google Scholar] [CrossRef]
  32. Morosuk, T.; Tsatsaronis, G. A new approach to the exergy analysis of absorption refrigeration machines. Energy 2008, 33, 890–907. [Google Scholar] [CrossRef]
  33. Fallah, M.; Mahmoudi, S.; Yari, M.; Ghiasi, R. Advanced exergy analysis of the Kalina cycle applied for low temperature enhanced geothermal system. Energy Convers. Manag. 2016, 108, 190–201. [Google Scholar] [CrossRef]
  34. Li, G.; Liu, Z.; Liu, F.; Yang, B.; Ma, S.; Weng, Y.; Zhang, Y.; Fang, Y. Advanced exergy analysis of ash agglomerating fluidized bed gasification. Energy Convers. Manag. 2019, 199, 111952. [Google Scholar] [CrossRef]
  35. Anvari, S.; Saray, R.; Bahlouli, K. Conventional and advanced exergetic and exergoeconomic analyses applied to a tri-generation cycle for heat, cold and power production. Energy 2015, 91, 925–939. [Google Scholar] [CrossRef]
  36. Ding, S.; Guo, B.; Hu, S.; Gu, J.; Yang, F.; Li, Y.; Dang, J.; Liu, B.; Ma, J. Analysis of the effect of characteristic parameters and operating conditions on exergy efficiency of alkaline water electrolyzer. J. Power Sources 2022, 537, 231532. [Google Scholar] [CrossRef]
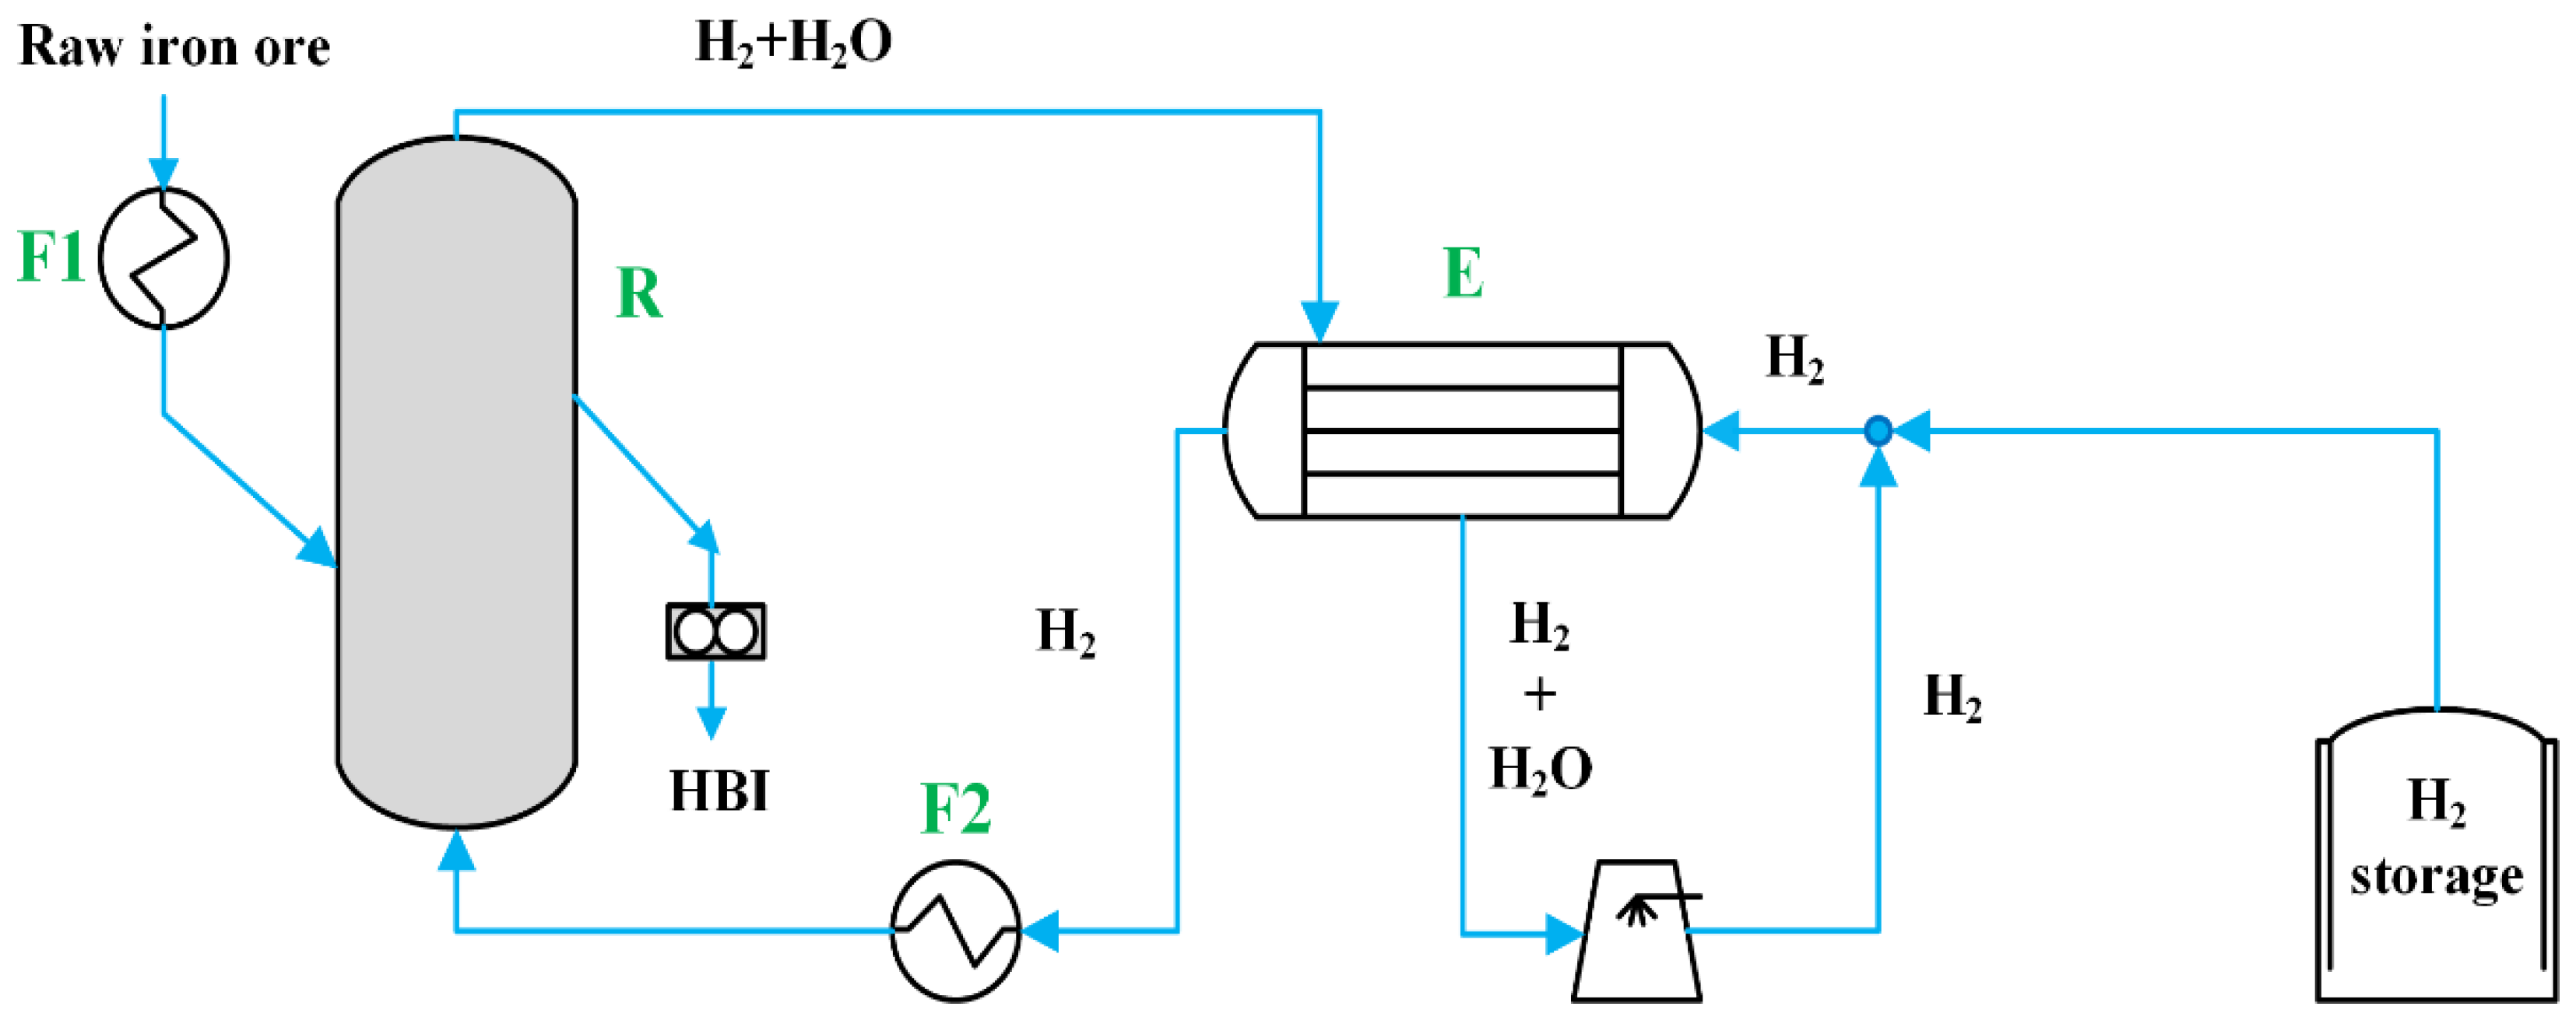
Figure 1. Schematic diagram of the H-FBDR process.
Processes 11 02748 g001
Figure 2. Thermodynamic analyses of H2 reduction of iron oxides.
Processes 11 02748 g002
Figure 3. H2 consumption of each operation unit in different metallization processes.
Processes 11 02748 g003
Figure 4. Exergy efficiencies of components F1, R, E, and F2.
Processes 11 02748 g004
Figure 5. Chemical exergy ( E D , k ch ) and physical exergy ( E D , k ph ) of components F1, R, E, and F2 in different cases.
Processes 11 02748 g005
Figure 6. Relative exergy destruction rate (χk) of components F1, R, E, and F2 in the H-FBDR system.
Processes 11 02748 g006
Figure 7. Variations in total H2 consumption with the ratio of H2 injected.
Processes 11 02748 g007
Figure 8. H2 consumption of each operation unit at different ratios of H2 injected.
Processes 11 02748 g008
Figure 9. Dependence of exergy efficiency on the ratio of H2 injected.
Processes 11 02748 g009
Figure 10. Variations in exergy destruction with the ratio of H2 injected. (a) Total exergy destruction, and (b) components F1, R, E, and F2.
Processes 11 02748 g010
Figure 11. Energy loss (Hloss) and exergy loss (Eloss) of the H-FBDR system at different ratios of H2 injected. (a) Hloss of components E and F1, (b) Eloss of components E and F1, (c) total Hloss, and (d) total Eloss.
Processes 11 02748 g011
Figure 12. Thermodynamic driving forces for reaction FeO→Fe at different ratios of H2 injected.
Processes 11 02748 g012
Table 1. Correlation constants for hi calculation (MJ/kmol).
Formulaabc
Fe2O3−825.089.18 × 10−21.00 × 10⁻⁴
FeO−268.595.08 × 10−26.00 × 10⁻⁶
Fe−85.03 × 10−23.12 × 10−2−3.00 × 10⁻⁵
CaO−636.274.75 × 10−23.00 × 10⁻⁶
SiO2−912.074.52 × 10−24.00 × 10⁻⁵
MgO−602.673.99 × 10−25.00 × 10⁻⁵
Al2O3−1687.108.40 × 10−25.00 × 10⁻⁵
H2−67.03 × 10−22.80 × 10−22.00 × 10⁻⁶
H2O (g)−242.613.25 × 10−26.00 × 10⁻⁶
O2−78.82 × 10−22.98 × 10−23.00 × 10⁻⁶
N2−68.86 × 10−22.83 × 10−23.00 × 10⁻⁶
Table 2. Standard chemical exergies of matter (MJ/kmol).
FormulaChemical Exergies (MJ/kmol)
Fe2O312.4
FeO124.9
Fe374.3
CaO110.2
SiO22.2
MgO59.1
Al2O315.0
H2 (g)236.1
O2 (g)4.0
N2 (g)0.7
H2O (g)9.5
Table 3. Chemical composition of raw iron ore.
FormulaTFe (Total Iron Content)Fe2O3FeOCaOSiO2MgOAl2O3
Concentration (wt.%)71.0867.8930.110.100.980.270.65
Table 4. Throughput of raw iron ore, as-oxidized iron ore, and direct reduced iron in the H-FBDR system (kmol/h).
FormulaFe2O3FeFeOCaOSiO2MgOAl2O3
Raw iron ore7.170.007.070.030.280.110.11
As-oxidized iron ore10.710.000.000.030.280.110.11
Direct reduced iron0.0020.341.070.030.280.110.11
Table 5. Different metallization processes in the fluidized bed reactor system.
Metallization Processes1st Fluidized Bed2nd Fluidized Bed
Case 1λ = 0, FeOλ = 95%
Case 2λ = 30%, Fe + FeOλ = 95%
Case 3λ = 95%
Disclaimer/Publisher’s Note: The statements, opinions and data contained in all publications are solely those of the individual author(s) and contributor(s) and not of MDPI and/or the editor(s). MDPI and/or the editor(s) disclaim responsibility for any injury to people or property resulting from any ideas, methods, instructions or products referred to in the content.