Article

Study on Process Parameters in Hydrothermal Liquefaction of Rice Straw and Cow Dung: Product Distribution and Application of Biochar in Wastewater Treatment

1
Center of Excellence for Research in Engineering Materials (CEREM), Deanship of Scientific Research, King Saud University, Riyadh 11421, Saudi Arabia
2
Mechanical Engineering Department, College of Engineering, King Saud University, Riyadh 11421, Saudi Arabia
*
Author to whom correspondence should be addressed.
Processes 2023, 11(9), 2779; https://doi.org/10.3390/pr11092779
Submission received: 13 August 2023 / Revised: 7 September 2023 / Accepted: 13 September 2023 / Published: 18 September 2023
(This article belongs to the Special Issue Preparation of Biochar and Biochar Composites and Their Application)

Abstract

:
In this study, rice straw (RS) and cow dung (CD) waste were hydrothermally processed for the recovery of bio-oil and biochar. The hydrothermal experiments were performed in a 5 L capacity reactor under the following process conditions: temperature (240–340 °C), solvent to biomass ratios of 1:1, 1:2, 2:1, 1:3 and 3:1, a time of 1 h and a pressure of 15 bar. The HTL products were characterized via FTIR, SEM and GC–MS (gas chromatography mass spectrometry). It was seen that the maximum bio-oil yield was 32.5 wt% and the biochar yield was 18.5 wt% for the 2:1 RS:CD mixture at a temperature of 320 °C. The bio-oil contained hexadecane, heptadecane, octadecane and other hydrocarbons, and their presence was confirmed by GC–MS. The biochar was analyzed, and it was used in wastewater treatment to remove the colorants. The biochar also showed some promising results in the colorants removal study, with an efficiency of more than 76%.

1. Introduction

Achieving a sustainable energy supply without neglecting environmental quality and waste reduction at the source has necessitated the search for novel green technologies in handling the significant tons of waste with the scope for energy derivation. Among the many alternate non-conventional sources, lignocellulosic biomass has earned significant attention. Researchers across the globe have experimented with wide varieties of biomass, including rice husk and cow dung [1]. Remediating marine wastewater biomass, including Scenedesmus obliquus and Chlorella vulgaris, is also having a wider scope as substrates for the recovery of bio-oil as an energy source [2]. However, the heterogeneity of the biomass being derived from varied sources poses problems while tapping it for a particular application [3]; hence, characterization of the biomass samples is a priority. The moisture content, volatile matter, fixed carbon and ash content determine the utility of the biomass.
The moisture content in biomass is an important parameter that influences its usage for thermochemical, chemical or biological conversions into fuels. A lower moisture percentage identifies the biomass to possess high combustion yields. The reactivity of the fuel derived from the biomass is controlled by the volatile matter to fixed carbon ratio. The corrosivity, slag formation and the economics involved in the handling and transportation of the biomass converted fuel are determined by the ash content of the biomass [4]. Pyrolysis (400–500 °C) in the near absence of oxygen [5] and gasification (800–900 °C) in a controlled environment [6] of air/oxygen/steam are thermochemical conversions of biomass that produce charcoal, bio-oil and renewable biofuels. The hydrotreatment of bio-oil under elevated pressure and temperature conditions in the presence of a catalyst yields renewable diesel, gasoline and aviation fuels [7]. Apart from the proximate characterization of biomass, the oil/lipid and carbohydrate profile aids in the diversion of biomass for the production of biodiesel by chemical conversion, and bioethanol via biological conversion [8].
Among the various products obtained from the lignocellulosic biomass enriched with cellulose, hemicellulose and lignin, bio-oil and biochar are given much focus among researchers, as bio-oil proves to be an efficient intermediate for liquid alternate fuels production, and biochar is an effective remediate of waste waters [9]. Bio-oil is growing into a sustainable energy source, owing to its suitability as a feedstock for the synthesis of clean and green fuels, green chemicals and carbon-rich materials that have the potential to be used as nutrient supplements [10]. Thus, the reliance on fossil fuels can be reduced, making biomass a promising renewable energy source. In many developing and underdeveloped countries, rice straw (RS) is available in abundance. Its availability, low cost and carbon neutrality has driven this waste hailing from rice to be the third largest agricultural commodity in the world as a suitable substrate to produce many green fuels and chemicals [11]. Such initiatives address the twin concerns of energy demand and environmental deterioration. With agro-waste heaping on one hand, odorous animal waste (manure) with high heavy metal content is also exponentially accumulating because of the developments in animal husbandry. Although traditional methods of handling the waste are available, these are losing popularity owing to the drawbacks, like longer processing times, as in the case of composting; water/soil eutrophication; and hazardous gas emissions while disposed in landfills [12].
Cow dung (CD) is a bioresource that is cheaply and abundantly available. It is used in many developing countries as a source of energy, apart from being tapped for its suitability as a cleansing agent with antimicrobial properties, and as a biomaterial to enhance soil fertility [13]. The present investigation was undertaken to exploit abundantly available rice straw and cow dung by blending and subjecting these to hydrothermal liquefaction by establishing suitable process conditions of temperature, solvent to biomass ratio, time and pressure for the simultaneous recovery of bio-oil and biochar; this process complements and supplements the pros and cons of both agricultural and animal waste. The chemical and structural properties of the products were further studied via FTIR, SEM and GC–MS.

2. Materials and Methods

2.1. Materials and Reagents

All of the materials and reagents used in the study were purchased from local chemical suppliers. Laboratory-grade chemicals like dichloromethane, erichrome black dye and double distilled water were used for the study. In addition, the biomasses like rice straw and cow dung were collected from a nearby poultry and paddy field.

2.2. Biomass Collection and Characterization

The lignocellulosic biomasses of rice straw (RS) and cow dung (CD) were collected from a nearby cow and poultry farm that is situated near the institute. The collected RS and CD waste biomass was dried naturally in the sun for 5 days and subsequently in an oven at 100 °C, in order to complete the removal of moisture content from the biomass. The dried biomasses were crushed and screened through meshes with pore sizes of 210 mm and 72 Brass (BSS). The different proportions of 1:2, 2:1, 1:3 and 3:1 of dried RS to CD biomasses were chosen for further studies. Then, the proportionated dried biomass was taken for proximate and ultimate analyses, as per ASTM standards. The moisture and ash content of the dried biomass were estimated, as per the ASTM E871-82 [14] and ASTM E1755-01 [15] standard methods. Then, the elemental analysis was carried out using a CHNS (Perkin-Elmer 2400 series, PerkinElmer Co., Waltham, MA, USA) analyzer for the dried biomass; direct measurement was used to depict the presence of the elements carbon, hydrogen, nitrogen and sulphur, while the amount of oxygen was inferred from the difference. A Shimadzu Thermogravimetric Analyzer (50H) was used to perform a thermogravimetric analysis (TGA) for the RS and CD biomass under various heat conditions that depict the pyrolytic behavior of the chosen biomass under a nitrogen environment [16].

2.3. Hydrothermal Optimization Experiments

The hydrothermal liquification (HTL) process was performed at high temperature (240 °C–340 °C) and pressure (15 bar) in a 5 L capacity autoclave reactor (made of stainless steel) equipped with an auto cooling temperature unit. The process was carried out with a heating rate of 10 °C/min up to 340 °C under a nitrogen environment in the reactor [17]. The experiments were performed using the RS and CD proportionated biomass, with solvent ratios of 1:1, 1:2, 2:1, 1:3 and 3:1, with 1 L of water used as a solvent. Motor-driven homogeneous mixing was maintained at 700 rpm during the entire process. After the experiments, the reactor was cooled with cold water at the end of the reaction time to recover the value-added products.

2.4. Hydrothermal Products Separation and Recovery

At first, the gaseous products were collected using the air-tight container before dismantling the reactor, and stored for further analysis. The dark brown slurry (highly viscous) was collected at the bottom of the reactor and taken up for extraction. The bio-oil was extracted from the dark brown slurry using dichloromethane (DCM) as a solvent, then held undisturbed to separate the three phases of products, depending on their densities, aqueous phase, bio-oil and solid residues obtained from the bottom. The excess DCM was recovered from the extracted bio-oil using a rotary evaporator under vacuum conditions [18]. The percentage of recovered bio-oil yield szx calculated using Equation (1) [19,20].
B i o o i l   y i e l d   wt % = M a s s   o f   b i o o i l   y i e l d   g M a s s   o f   b i o m a s s   g × 100
The recovered HTL products were subjected to further analytical studies such as gas chromatography, CHNS, FTIR and SEM. The extracted bio-oil was analyzed using a gas chromatograph (Agilent 7890 GC, Agilent Technologies Co., Santa Clara, CA, USA.) equipped with a flame ionization detector (FID). In addition, the elemental analysis of the bio-oil and biochar was carried out using a CHNS analyzer (Perkin-Elmer 2400 series analyzer, PerkinElmer Co., Waltham, MA, USA). The moisture content of the HTL products was analyzed, as per ASTM E1755-01. The bio-oil yield and high heating value were calculated with Equation (2) [19,20].
H H V   MJ kg = 0.338 × C + 1.428 × H O 8

2.5. HTL Products Characterization

The bio-oil obtained from the HTL process needed to be characterized before defining its applications. The bio-oil obtained from the RS:CD, 2:1 mixture showed carbon (42.3, 51.2, 53.2), hydrogen (12.3, 9.5, 10.2), nitrogen (1.1, 0.9, 0.7) and oxygen (44, 38, 35.4) content. Furthermore, the bio-oil had H/C (3.48, 2.22 and 2.3) and O/C (0.78, 0.55 and 0.49) ratios for all of the biomasses. The CHNS combination of bio-oil is the major parameter that implies its usefulness to engines.

2.5.1. Bio-Oil Characterization (GC–MS)

The recovered bio-oil was characterized using gas chromatography (GC–FID) under the following conditions: a maximum temperature of 230 °C, an initial temperature of 40 °C, heating at the rate of 4.0 °C per min and holding for 2 min. A DB 5MS column with dimensions of 30 m × 0.25 mm × 0.25 μm (Varian) was used as the stationary phase, and 99.999% pure He gas was used as a carrier. The quadrupole temperature was kept at 150 °C for the mass standards, while the ion source electron energy and temperature for electron ionization (EI) were 70 eV and 230 °C, respectively, for the GC–FID/TCD [21,22].

2.5.2. Biochar Characterization

Scanning electron microscopy (SEM) (JEOL JSM-6510, JEOL Ltd., Akishima, Tokyo, Japan) was used to examine the surface characteristics, morphology and microstructures of the biochar obtained from the HTL process. Then, the sample of biochar was sprinkled with gold for 30 s using polarons, and the captured spectra results were displayed in a stereoscope. This may facilitate the adsorption procedure by enhancing the dispersion of dye molecules across the biochar structure [23].
FTIR spectroscopy (SHIMADZU IR Prestige 21 spectrometer) was used to investigate and identify the specific organic functional group of bio-oil obtained from the HTL process. The qualities of the bio-oil are mainly determined by its chemical structures. The extracted bio-oil sample was placed into the Ge window of a Nicolet 5700 FT-IR (Thermo Fisher Scientific Co., Waltham, MA, USA) with an ATR attachment (Omni sampler nexus) for the analyses. Furthermore, spectra between 400 cm−1 and 4000 cm−1 were captured with a resolution of a 4 cm−1, with different temperatures. The chemical component relative concentration (%) was calculated via integration of the FTIR profile from the relevant region [24,25].
A ceramic source, KBr beam splitter and deuterated triglycine sulphate (DTGS) detector were all included in the Perkin-Elmer FTIRC-100566 spectrometer (Varian Instruments, Randolph, MA, USA), which was used to acquire all of the spectra. An electronic load display and a stainless-steel rod were used to apply constant contact pressure to the attenuated total reflection (ATR) sampling device, which used a DuraSamplIR single-pass diamond-coated internal reflection accessory from Smiths Detection, Danbury, CT. The sample was measured via KBr pellets in the wavenumber range of 400–4000 cm−1, with a spectral resolution of 4 cm−1 [21]. Thermo-Scientific’s Omnic Spectra software (Catalog number: 833-036200) was used to analyze the samples in triplicate, to average the absorbance spectra, and to adjust the initial value. By integrating an FTIR profile from the relevant region, the surface structure of the biochar was analysed [26]. The Raman spectra were obtained using a spectrometer designed by Horiva (LabRam HR-800). The radiation originated from a laser with a 514 nm wavelength and a 25-mW output.

2.6. Biochar Recovery and Activation for Adsorption Experiments

The solid residue (2:1) from the HTL process was pyrolyzed using an electric furnace at a specific temperature (500 °C) to remove debris from the biochar. The carbonized biochar was applied for wastewater treatment using a batch absorption process. At this moment, the batch adsorption experiments were performed for the RS and CD-synthesized biochar obtained from the HTL process, whereas the optimized parameters including the effects of pH, contact time (30 min), dye concentration (0.1–0.5 g/L), temperature (36 °C) and biochar dosage (1–5 g/L) were obtained in the batch adsorption experiment.
The batch adsorption studies were carried out by saturating five different 1 L conical flasks with 1 L of erichrome black dye solution containing synthetic effluent at the appropriate concentration (0.1–0.5 g/L) of RS and CD biochar dosage (1.0, 2.0, 3.0, 4.0 and 5.0 g/L). For effective adsorption, all of the experiments were carried out in a shaker incubator at 100 rpm for 30 min until equilibrium was reached. The adsorbate samples from each conical flask were collected after the process was completed, and filtered using Whatman filter paper with a 20 μm pore size. The adsorption capacity of the filter paper was examined to determine whether it affected the adsorption process under all experimental circumstances before filtration. The dye removal efficiency was calculated as per the equation, where Co is the initial dye concentration and Ct is the dye concentration at time t:
D y e   r e m o v a l   e f f i c i e n y   R = ( C o C t ) C o 100

3. Results and Discussion

3.1. Biomass Characterization

The thermal stability of the biomass was analyzed using thermogravimetric analysis (TGA) in accordance with existing studies. TGA was carried out at three different stages, with a broad temperature range from 0 °C to 800 °C, in order to determine the pyrolytic temperatures for the hydrothermal experiments. Figure 1 shows that the moisture content was removed below 180 °C at the first stage, and the degradation of organic components occurred between 200 °C and 600 °C at the second stage. The weight loss percentages at 600 °C after TGA were 21, 18, 20, 20, 17, 16 and 15% for heating rates of 10, 20, 30, 40 and 50 °C/min, respectively. The carbonaceous material became degraded in the final stage. According to Arun, Gopinath, SundarRajan, Malolan, Adithya, et al. (2020), Scenedesmus obliquus exhibited a maximum weight loss of 23.4% at a heating rate of 50 °C/min.

3.2. Hydrothermal Experiments

3.2.1. Effect of Temperature

The effect of temperature on the bio-oil yield was studied at varying temperatures from 240 to 340 °C for a 1-h reaction time. From Figure 2, it can be seen that the maximum bio-oil yield was 30 wt% at a temperature of 300 °C for a reaction time of 1 h. For the temperature range of 200 to 250 °C, the total biochar wt.% increased significantly, leading to a steep drop in the biomass wt%. One possible reason for this observation is due to carbonization of intermediate compounds from the biomass to form biochar [22]. The increase in the temperature resulted in conversion of the low-molecular-weight compounds in the bio-oil into a gaseous phase. The biochar distribution of the 10 g/200 mL batch run is depicted in Figure 3. The biochar (20 wt%) was the major charred matter that was obtained from the solid residue. This carbon percentage enhanced the chance of using biochar as the soil amendment, with the biochar yield at a reaction temperature of 250 °C. From the literature, it was seen that low temperatures of the HTL process when compared to the pyrolysis process results in higher amounts of biochar. The HTL-based biochar formation depends upon the residence time, temperature, catalyst type, feedstock composition, etc. [27].

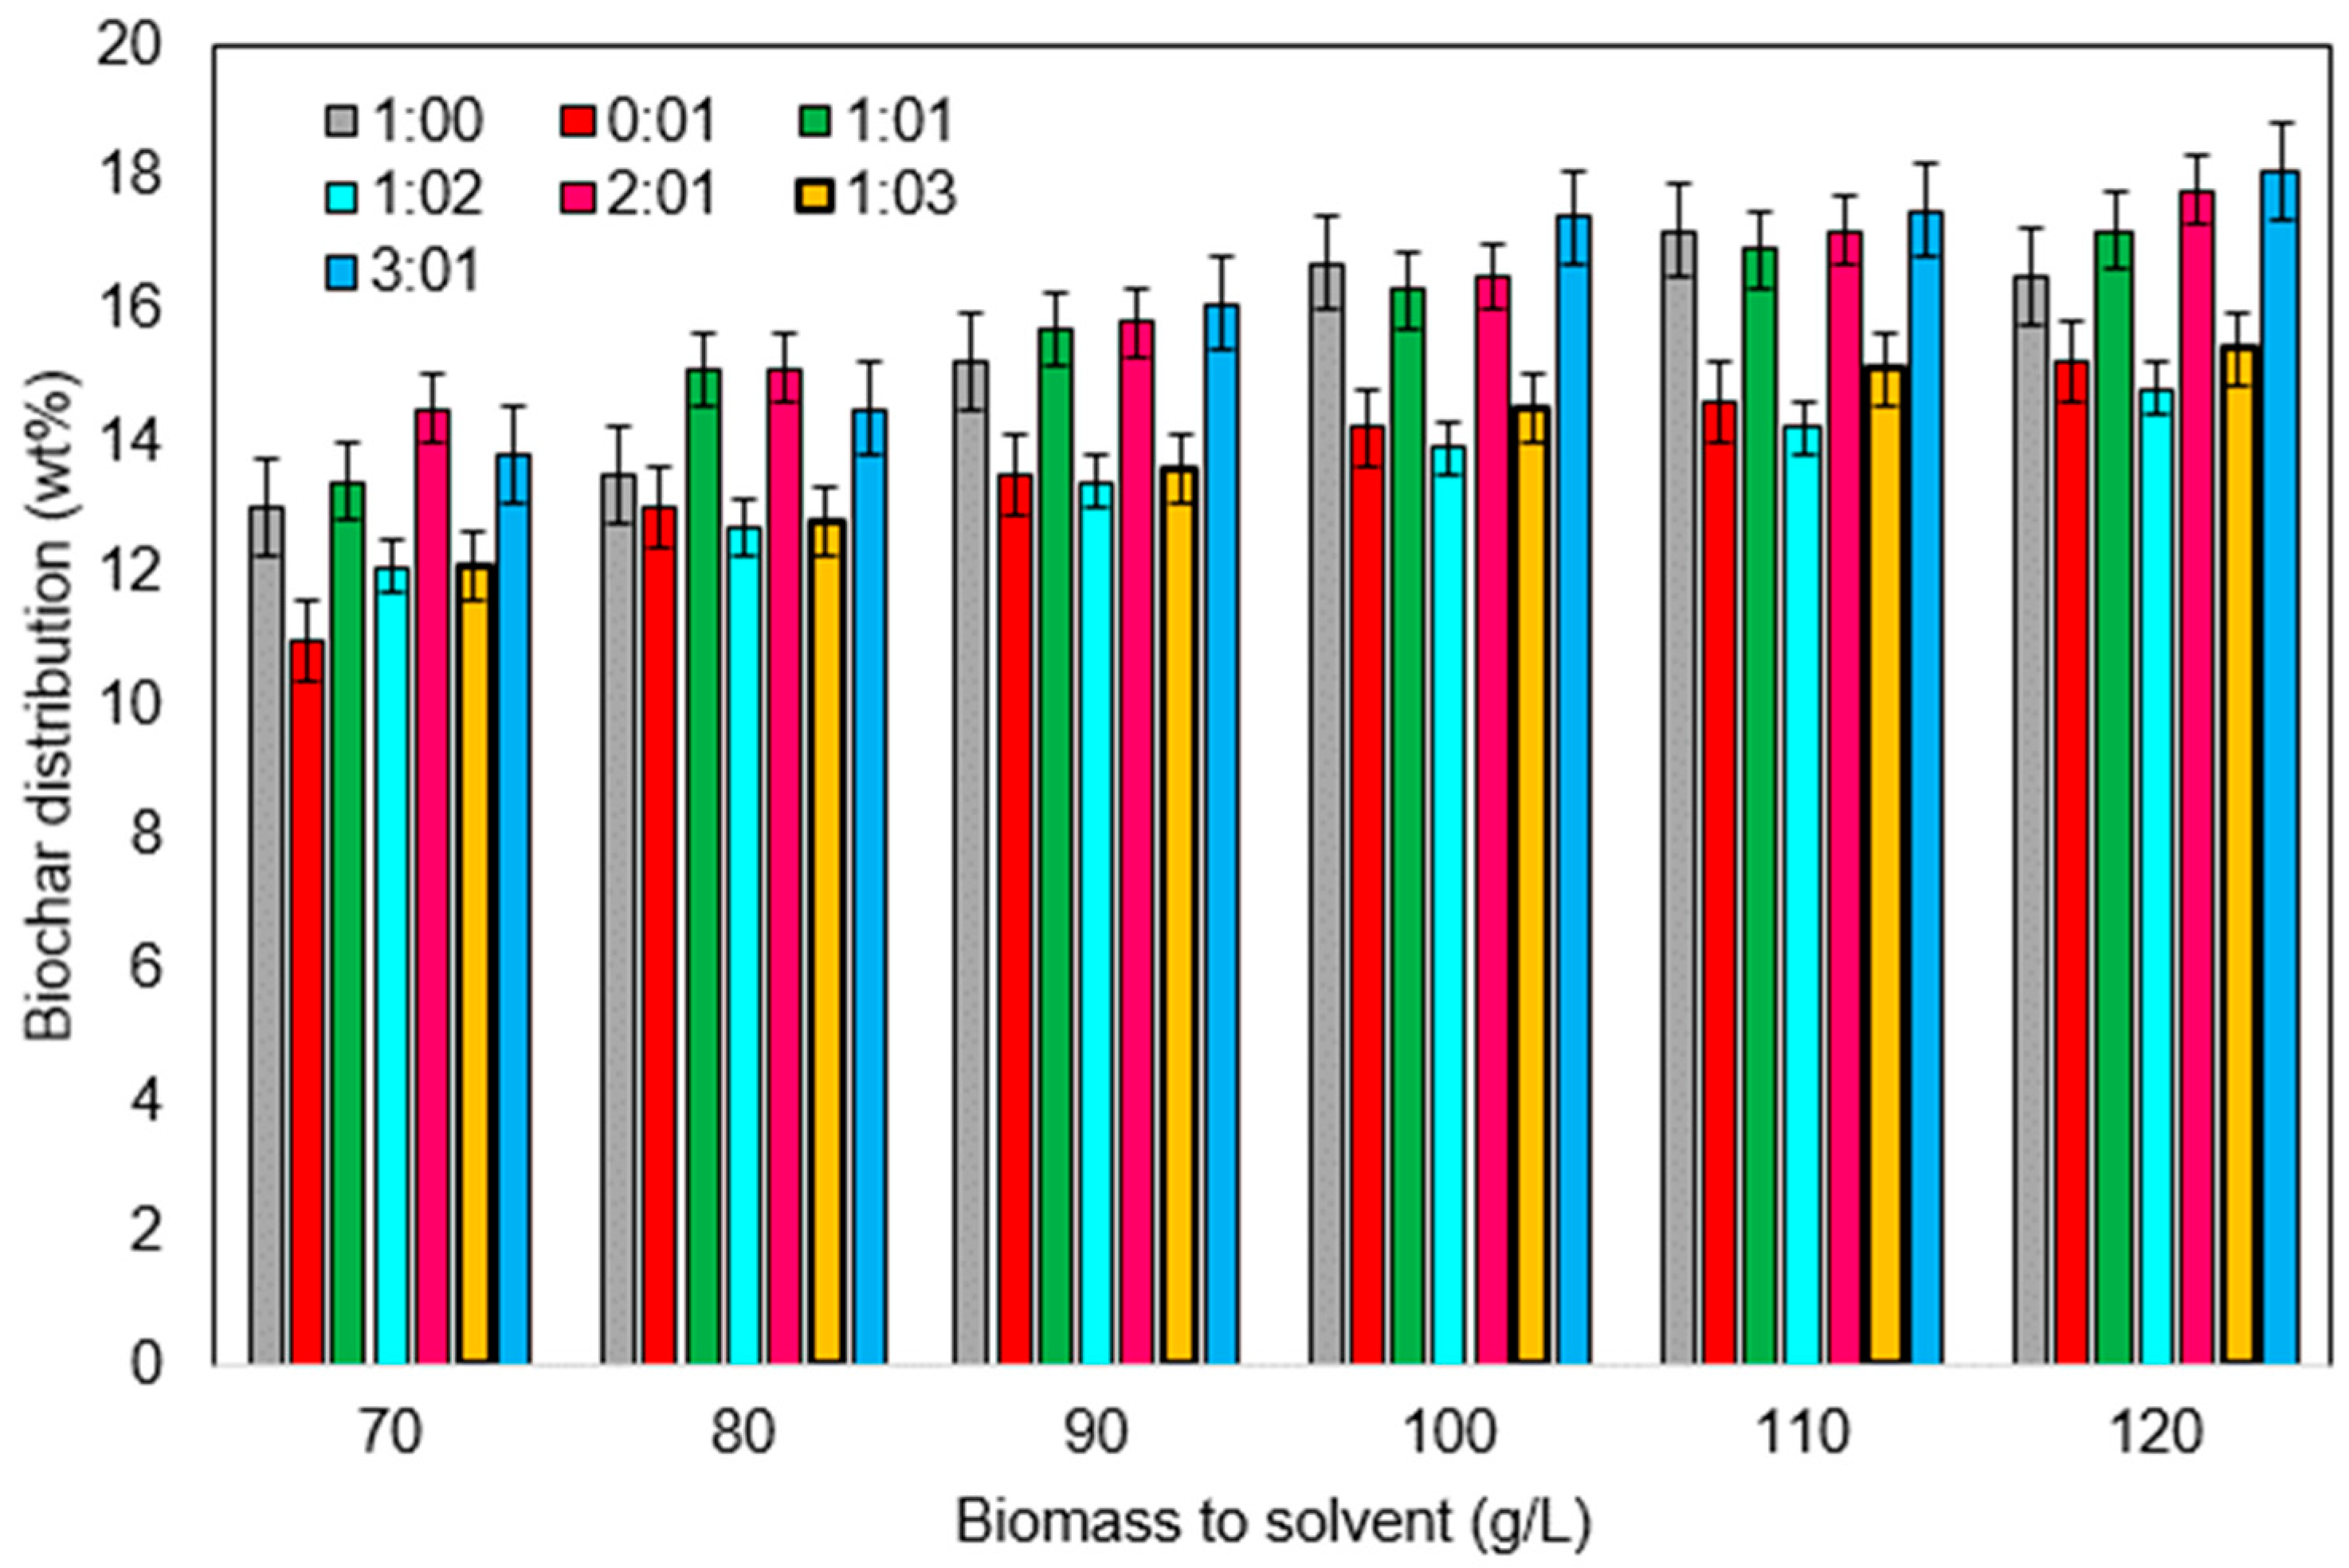
3.2.2. Effect of Solvent to Biomass Ratio

One important factor is the mass ratio of biomass to water. In general, a lot of water is good for producing liquids and yielding gases, presumably because a denser solvent medium improves extraction. A rise in the salvation of biomass components can be connected to this decrease. Solvents are used to derive the biomass components during hydrothermal treatment so that the biomass fragments dissolve more easily. The relative interactions between the water and biomass molecules become less significant at large biomass to water ratios, which can reduce the rate at which the biomass components dissolve. When the biomass to solvent ratios are extremely high, hydrothermal processes frequently behave like pyrolysis. However, increasing the biomass to water ratio does not always yield high liquid amounts [28]. In this study, the experimental results were summarized to understand the recovery of bio-oil and biochar as products using various ratios of biomass to solvent. The bio-oil and biochar as HTL products were obtained using the solvent to biomass ratios. Figure 4 and Figure 5 show the ratios of solvent to biomass of 110 g/L that generated the maximum amounts of bio-oil (29 wt%) and biochar (17.5 wt%).

3.3. HTL Product Analysis

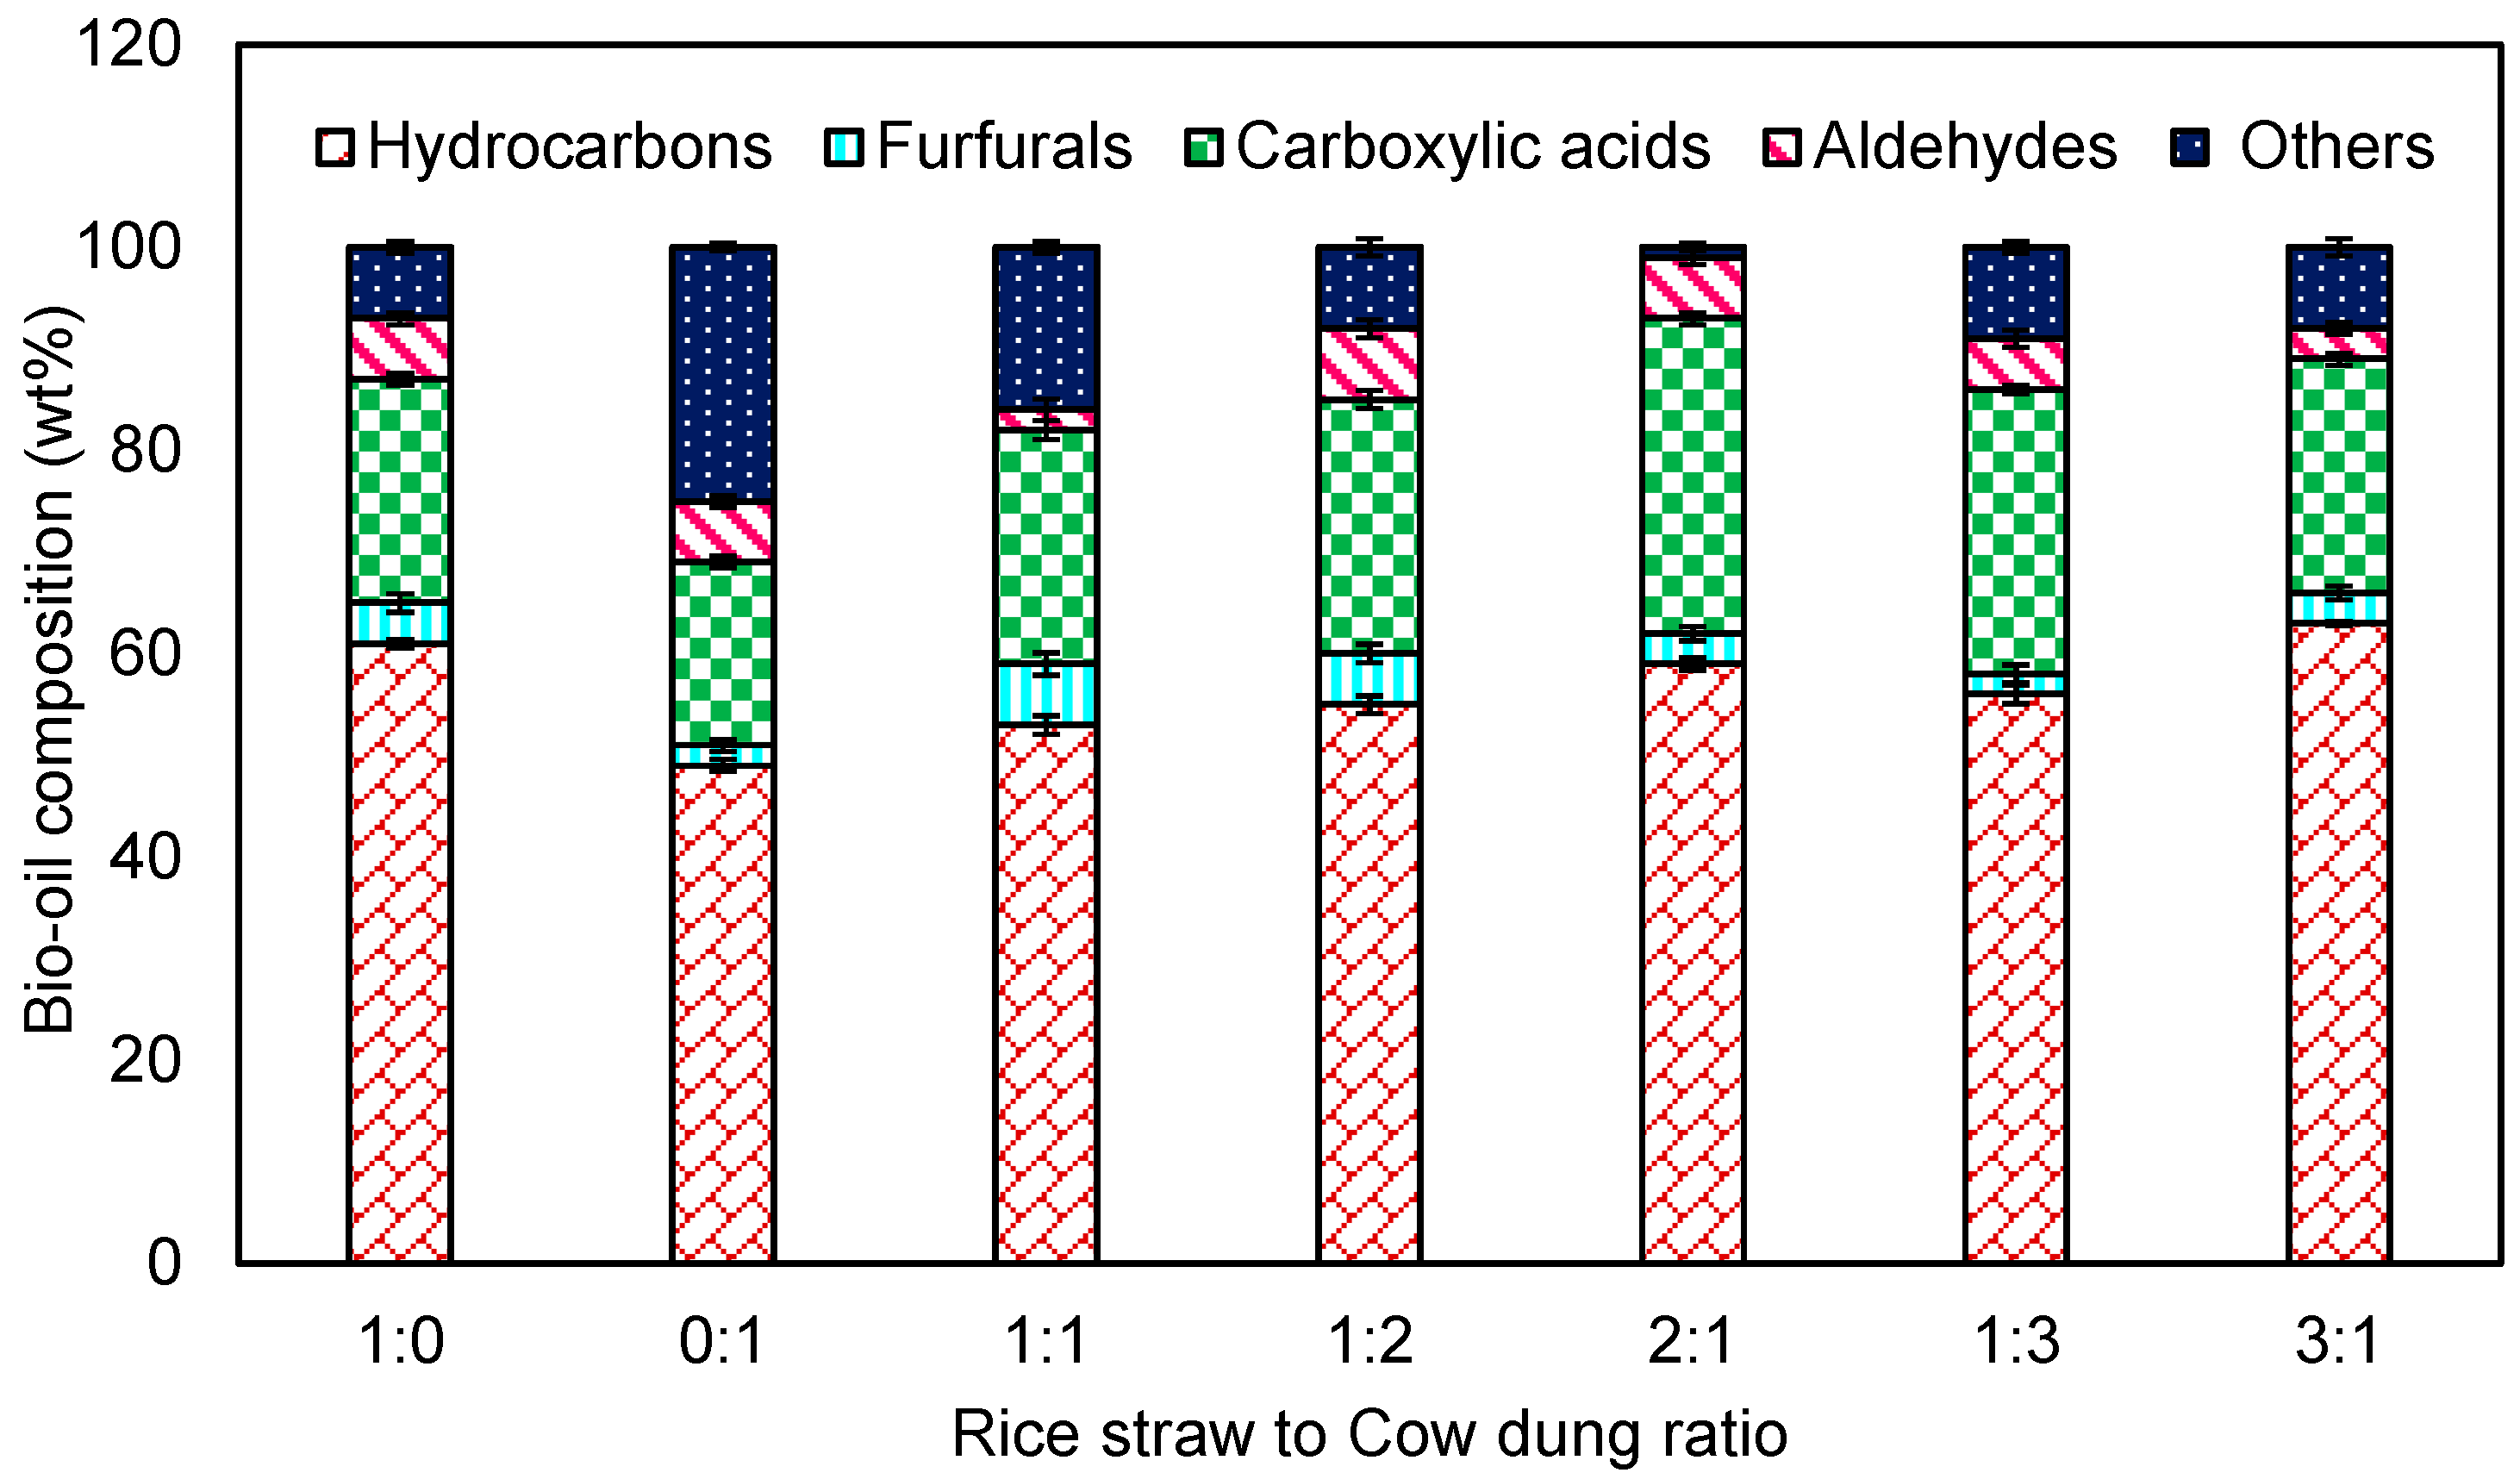
3.3.1. GC–FID for Bio-Oil

The GC–FID analysis of bio-oil acquired from the hydrothermal liquefaction of rice straw and cow dung was performed to determine the composition of hydrocarbons and other constituents available in the bio-oil. Different ratios of rice straw and cow dung, such as 1:0, 0:1, 1:1, 1:2, 2:1, 1:3 and 3:1, were subjected to compositional analysis using GC–FID. The various components present in the bio-oil are shown in Figure 6. From the results, we can observe that the bio-oil contains RS and CD components such as phenol-3-methyl, 4-octane-3-one, 6-ethyl-7-hydroxy, 2-butenamide, N,2,3-trimethyl, 4-ethylbiphenyl, benzenethiol,4-(1,1-dimethylethyl), phenol,4-[2-[2-(chloromethyl)-1,3-dioxolan-2-yl)], acetate, etc. Most of the substances found in bio-oil are divided into four main component classes: hydrocarbons, furfural, carboxylic acid, aldehydes and others. At all of the temperatures, hydrocarbons were the most prevalent product class in the bio-oil, making it appropriate for use as diesel fuel.
The rice straw at a 1:00 ratio was found to contain 31% hydrocarbons, 4% furfurals, 22% carboxylic acids, 6% aldehydes and 7% other compounds. The pure cow dung at a 0:01 ratio was found to contain 49% hydrocarbons, 2% furfurals, 18% carboxylic acids, 6% aldehydes and 25% other compounds. From the figure, we were able to see that the wt% of each compound varies at different proportions of rice straw and cow dung (1:01, 1:02, 2:01, 1:03, 3:01). From the 1:01 ratio of rice straw and cow dung, 53% hydrocarbons, 6% furfurals, 23% carboxylic acids, 2% aldehydes and 16% other components were estimated. The 1:02 ratio showed the presence of 55% hydrocarbons, 5% furfurals, 25% carboxylic acids, 7% aldehydes and 8% other components. The 2:01 ratio was found to contain 59% hydrocarbons, 3% furfurals, 31% carboxylic acids, 6% aldehydes and 1% other components. The 1:03 ratio showed the presence of 56% hydrocarbons, 2% furfurals, 28% carboxylic acids, 5% aldehydes and 9% other components. Likewise, the 3:01 ratio was found to contain 63% hydrocarbons, 3% furfurals, 23% carboxylic acids, 3% aldehydes and 8% other components. The maxima observed from the bio oil acquired through the HTL process were 63% hydrocarbons from the 3:01 ratio, 6% furfurals from the 1:01 ratio, 31% carboxylic acids from the 2:01 ratio, 7% aldehydes from the 1:02 ratio, and 25% other components from the 0.01 ratio. The nitrogen-containing substances found in the bio-oil could be a by-product of the breakdown of protein molecules. The ester compounds content was similar to that of the hydrocarbons, although that of the other compounds was quite low. The hydrothermal liquefaction of red oak and cattle manure, particularly cow manure, produced gaseous products that included similar sorts of chemicals [23].

3.3.2. Proximate and Ultimate Analyses of Bio-Oil and Biomass

The biomass mixture of 2:1 (RS:CD) had carbon, hydrogen, nitrogen, oxygen and sulphur contents of 48.1, 9.74, 3.71, 37.06 and 0.78 wt%, respectively. The bio-oil produced from the 2:1 biomass produced carbon, hydrogen, nitrogen, oxygen and sulphur contents of 70.23, 8.56, 1.15, 19.61 and 0.45 wt%, respectively. Table 1 provides detailed notes on elemental compositions of different biomass mixtures and bio-oil produced from biomass. The presence of sulphur and nitrogen in the bio-oil in lower quantities when compared to biomass shows that it would have been left out of the biochar or aqueous phase. The biomass composition of 1:2 showed a greater H/C ratio of 2.76, and the 2:1 composition showed a lower O/C ratio of 0.57. In the case of the bio-oil, the 1:2 composition showed a greater H/C ratio of 1.82, and the 2:1 composition showed a lower O/C ratio of 0.20.

3.4. Biochar Analysis

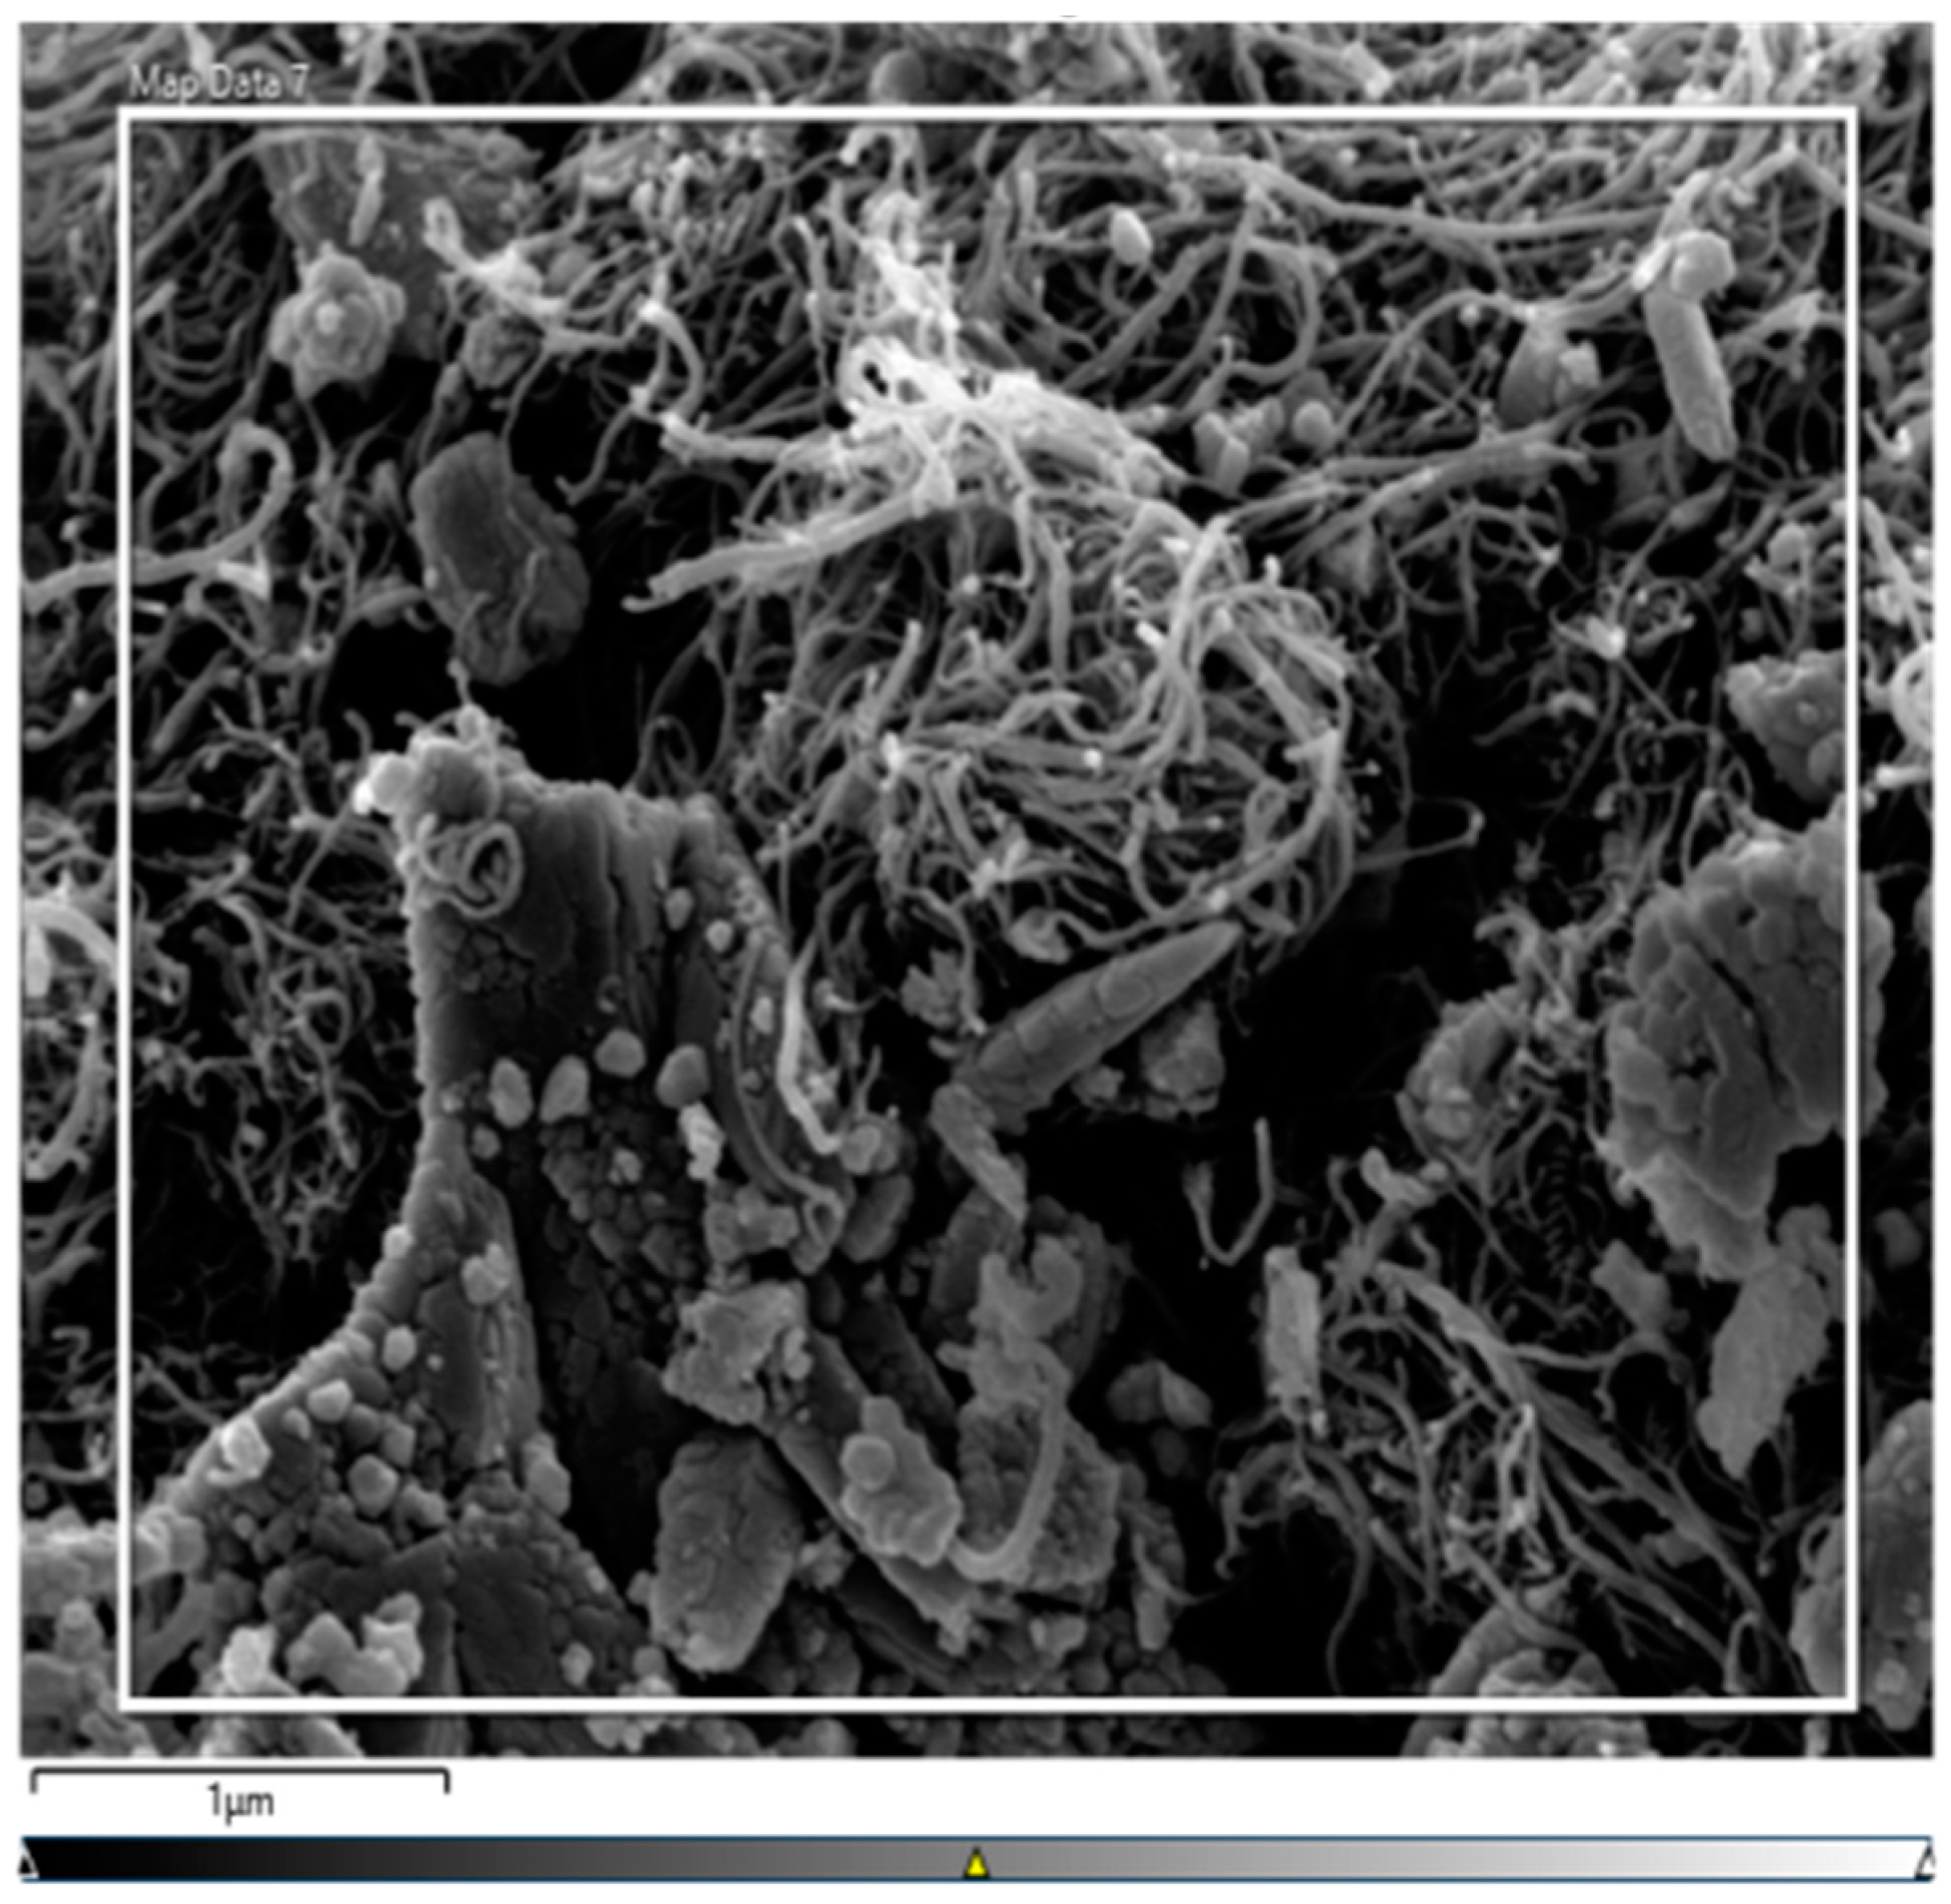
3.4.1. SEM and BET Analysis of Biochar

The mechanistic formation of biochar from the hydrothermal process was not yet completely depicted. However, based upon the type of biomass, the biochar yield varies. For example, the biochar yield from lignocellulosic biomass is greatly influenced by the presence of organic compounds like cellulose, lignin and hemicellulose [29]. At higher temperatures, the lignin in the biomass degrades through a hydrolysis process, and it becomes converted into phenolic compounds. Furthermore, at high temperature conditions, the phenolic compounds lead to the formation of solid residues via polymerization reactions rather than hydrolytic reactions. It can be seen from algae biomass, the oxidation, decarbonization, hydrolysis, aromatization and polymerization reactions are involved in biochar formation [30]. The surface properties and pore distribution of the formed biochar were analysed using SEM. The biochar synthesized from each biomass varied, as it can be seen by the presence of the lattice-like structure in the surface after the adsorption process as shown in Figure 7 and Figure 8. Furthermore, it can be seen that the temperature and feedstock combination define the structure and surface morphology of the produced biochar, which in return defines the adsorption efficiency. The lignin and cellulose in the rice straw lead to the domination of carbon structures in the biochar [31]. The BET analysis of all three biochar showed surface areas of 16.53, 43.63 and 36.23 m2/g, and average pore size diameters of 1.63, 2.85 and 1.86 nm, respectively. In another study, biochar synthesised from rice straw showed a surface area of 57.7 m2/g and a pore diameter of 2.74 nm.

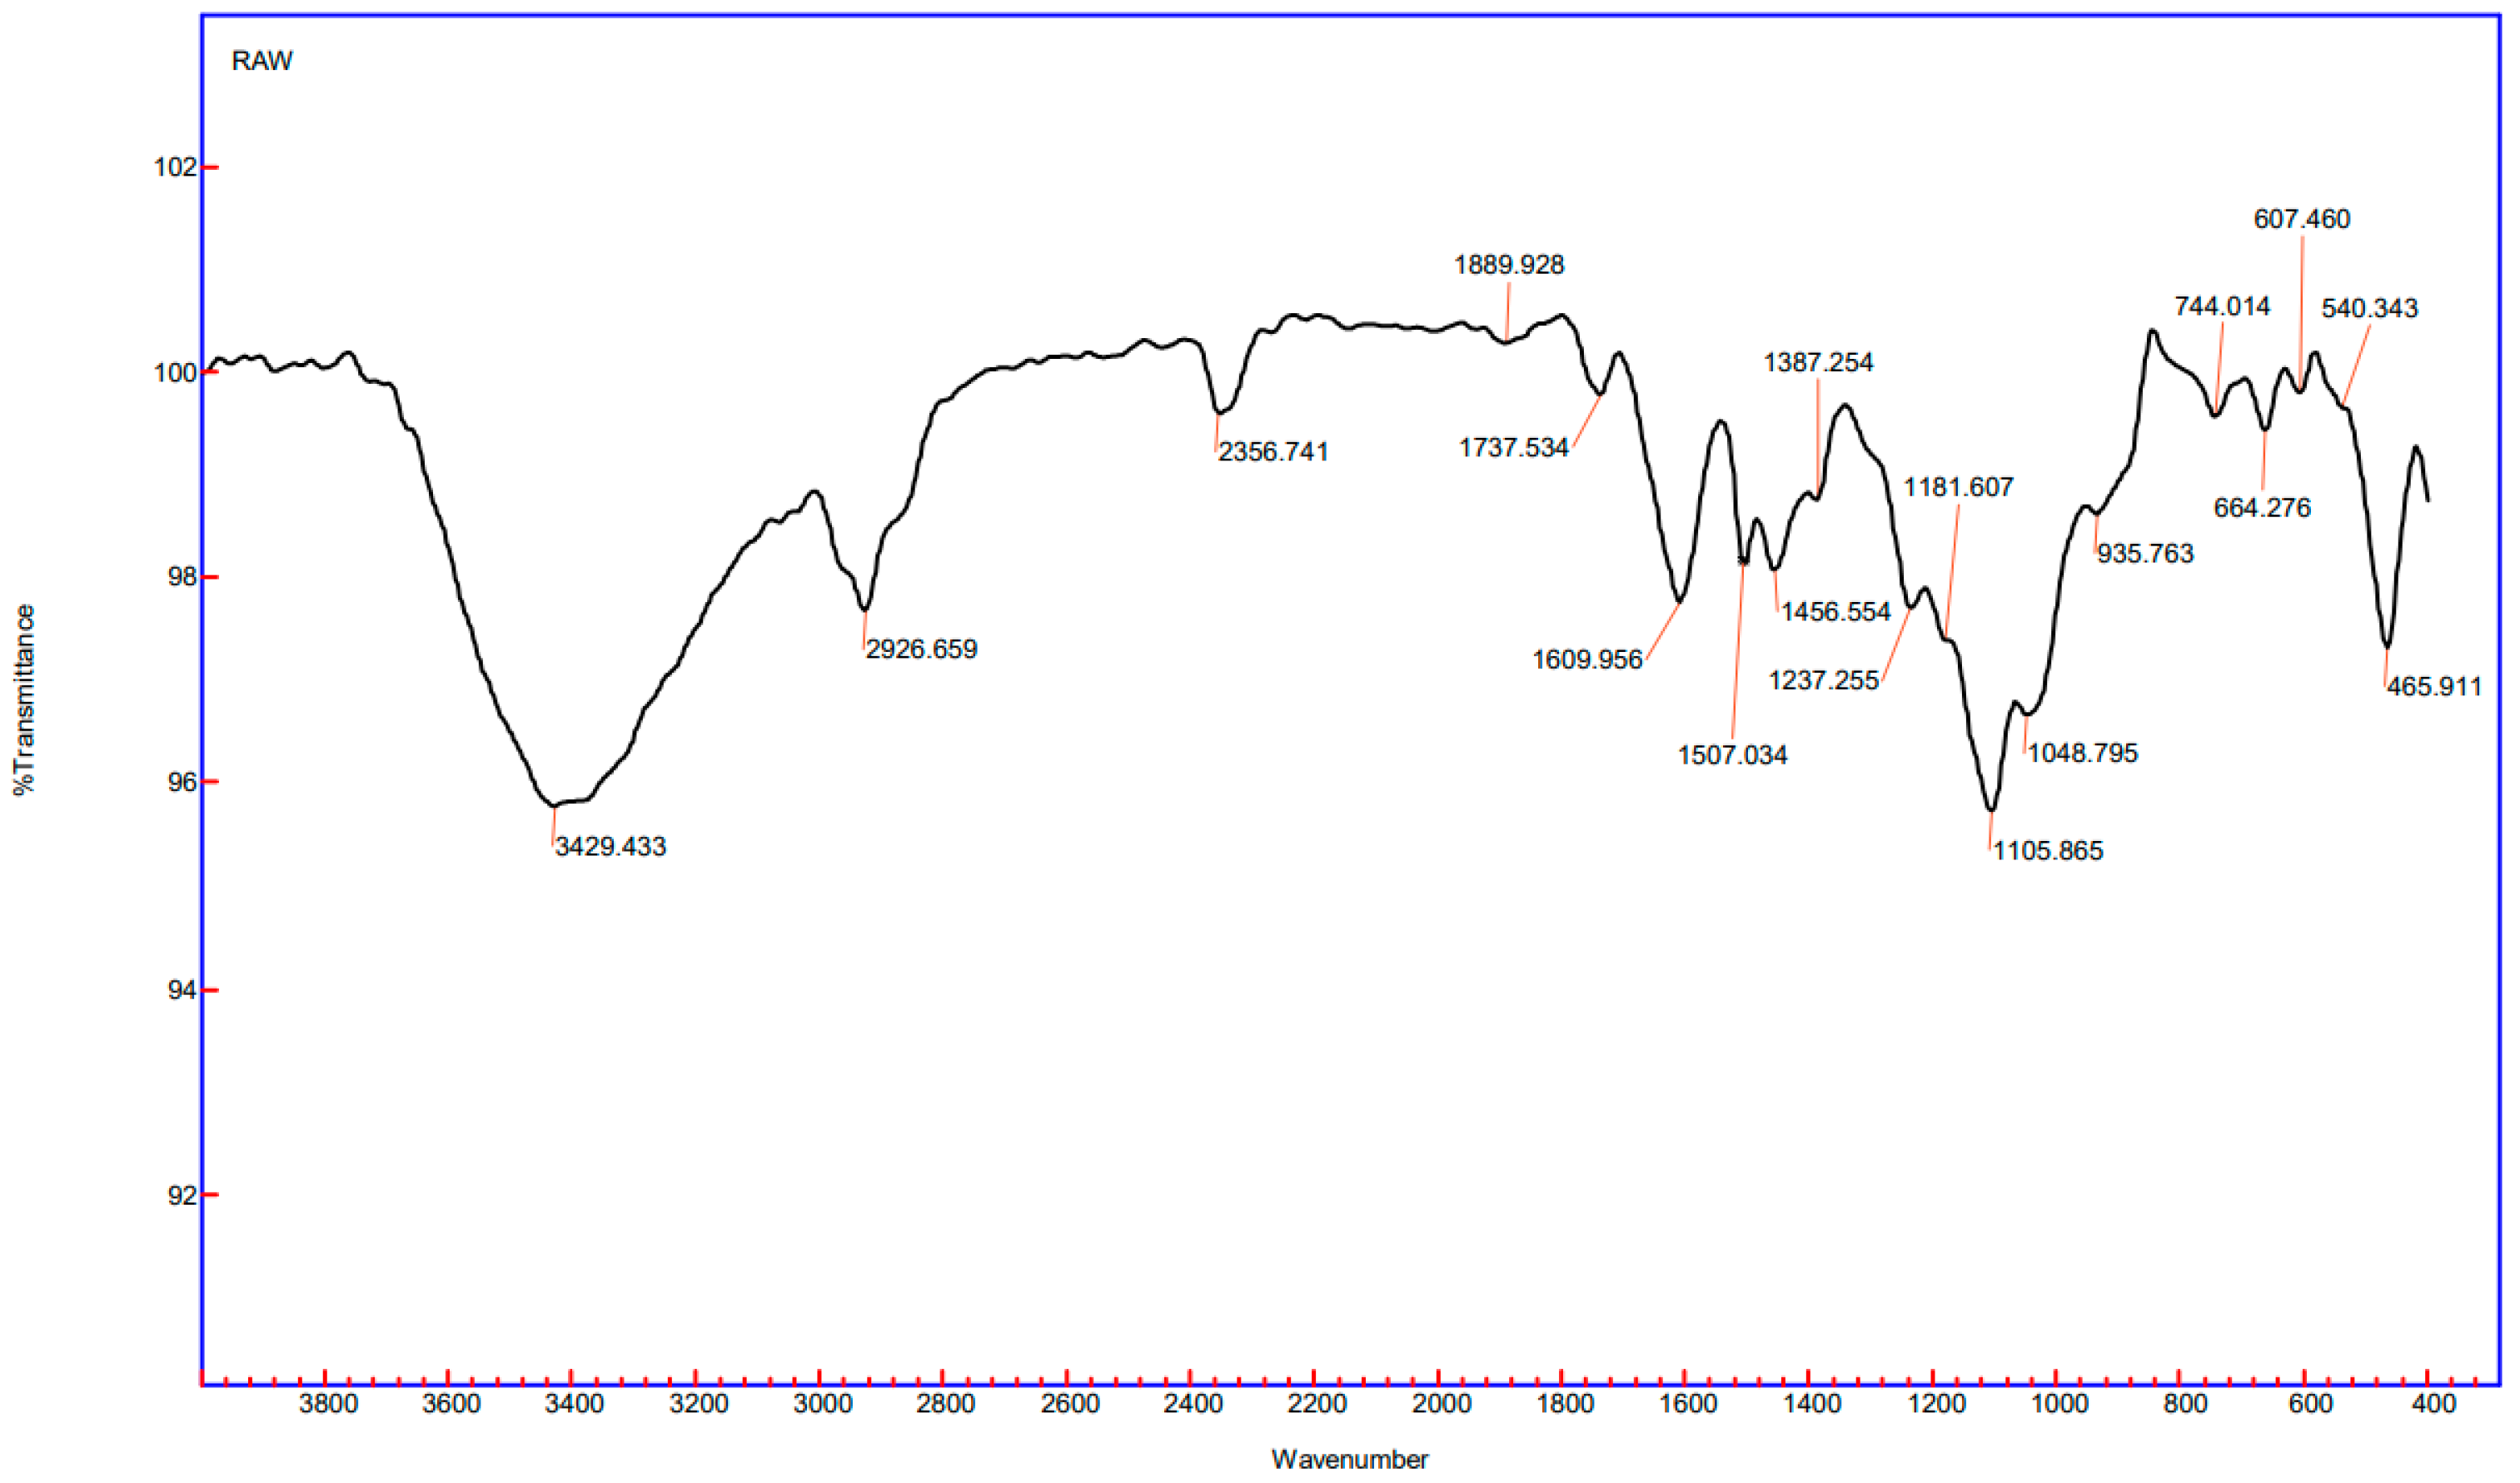
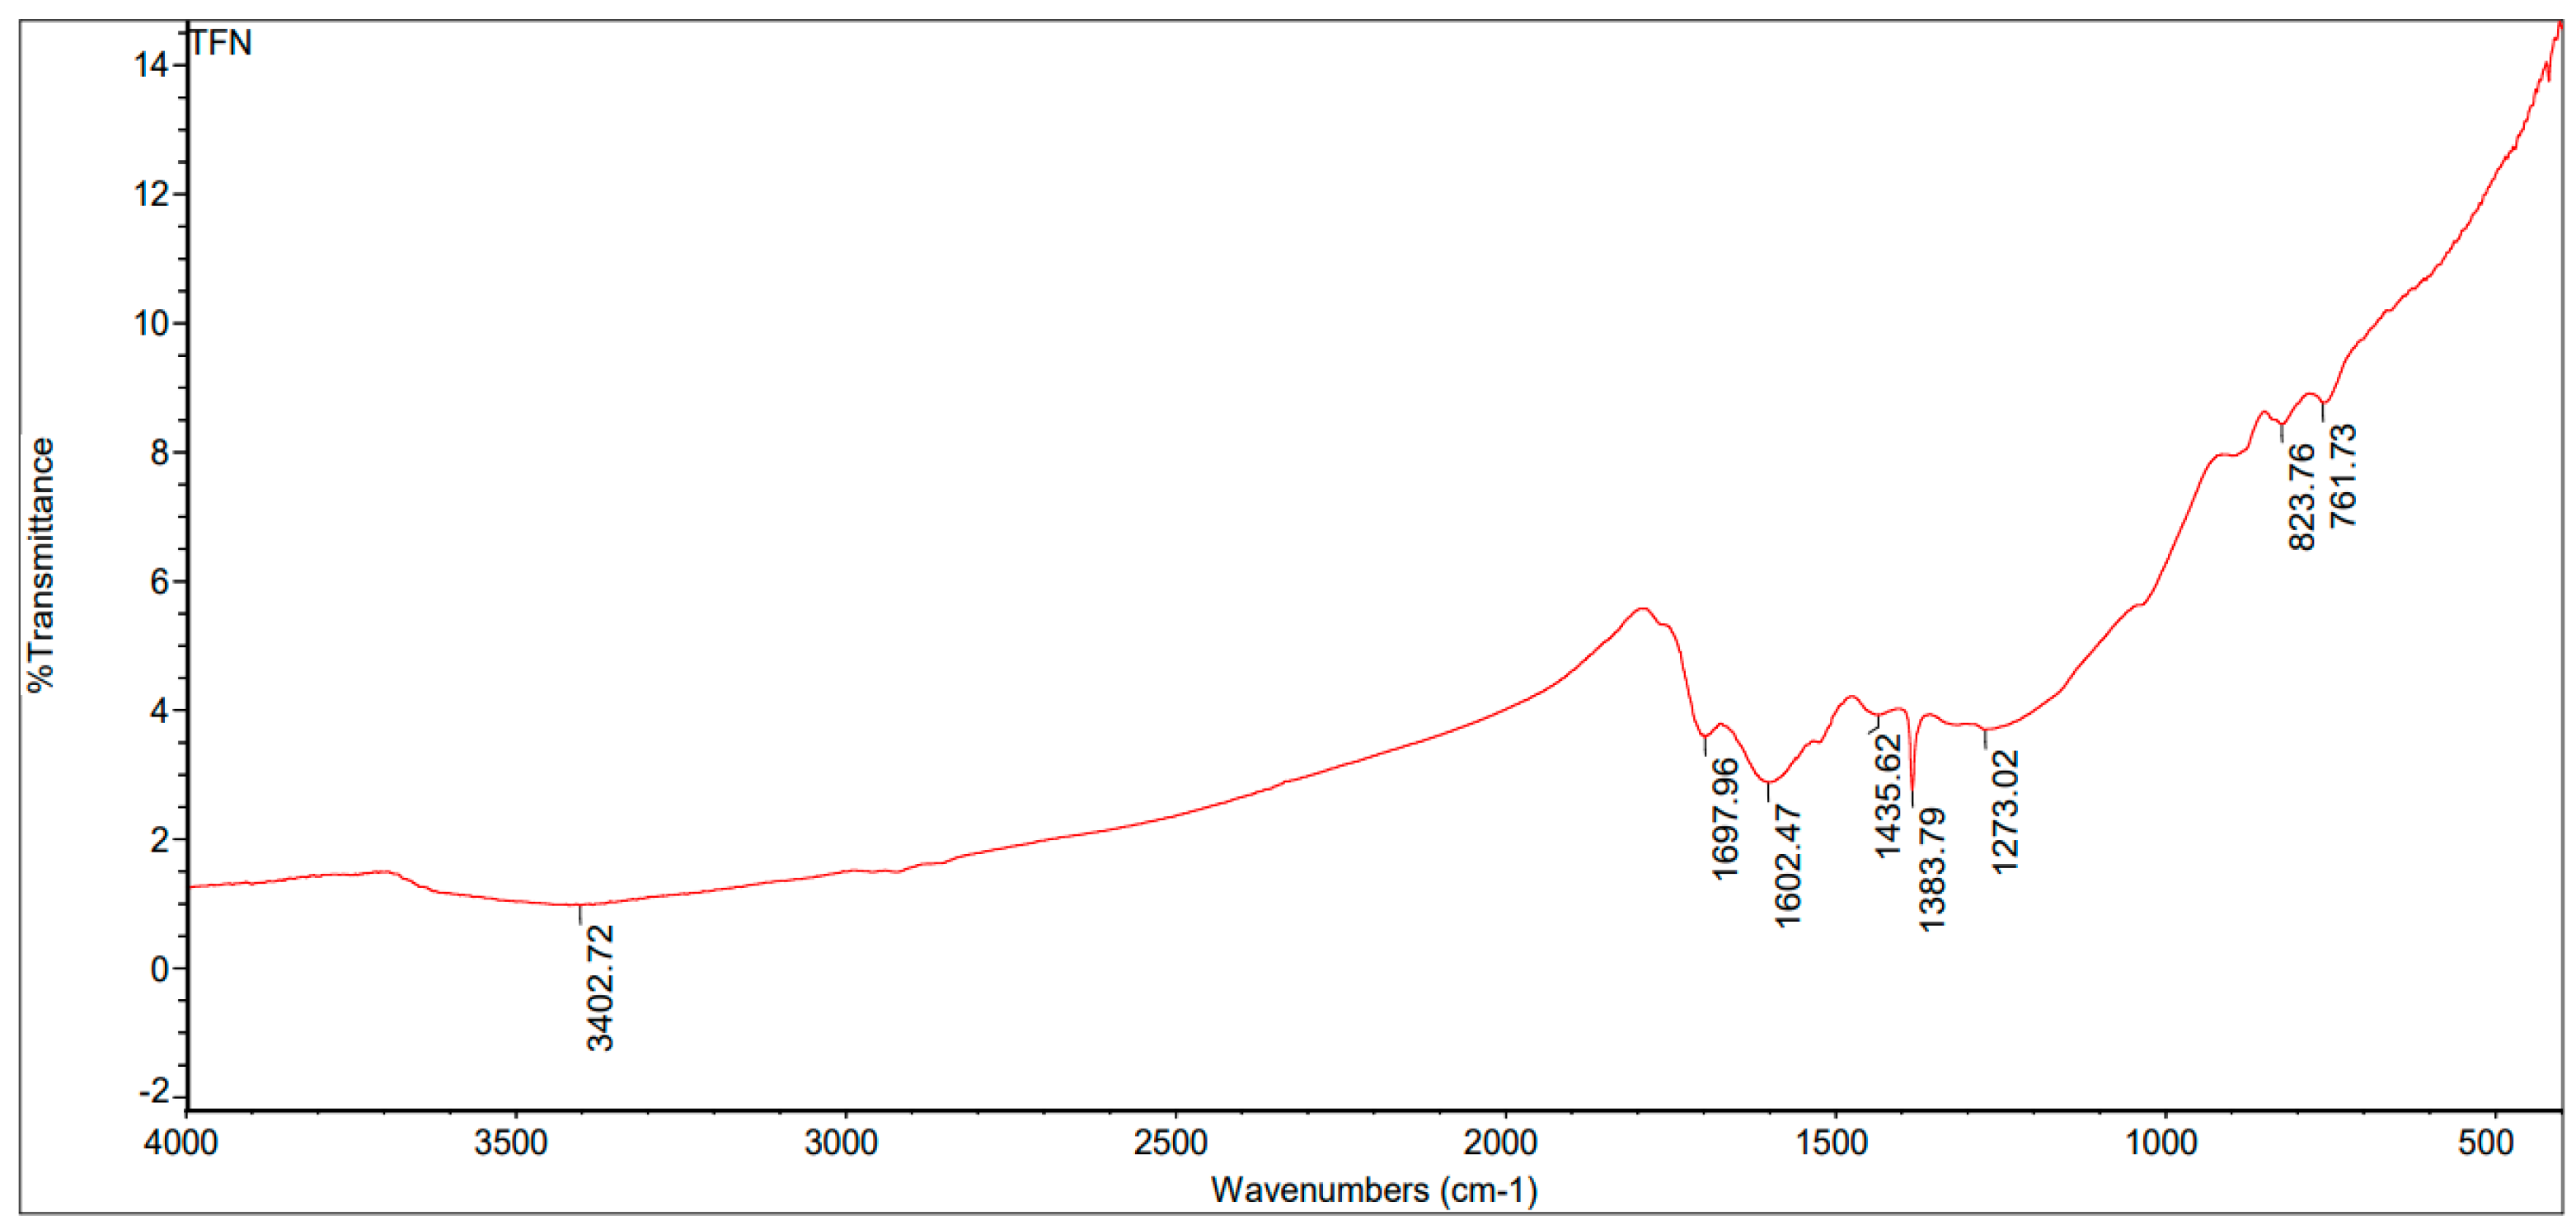
3.4.2. FTIR for Biochar
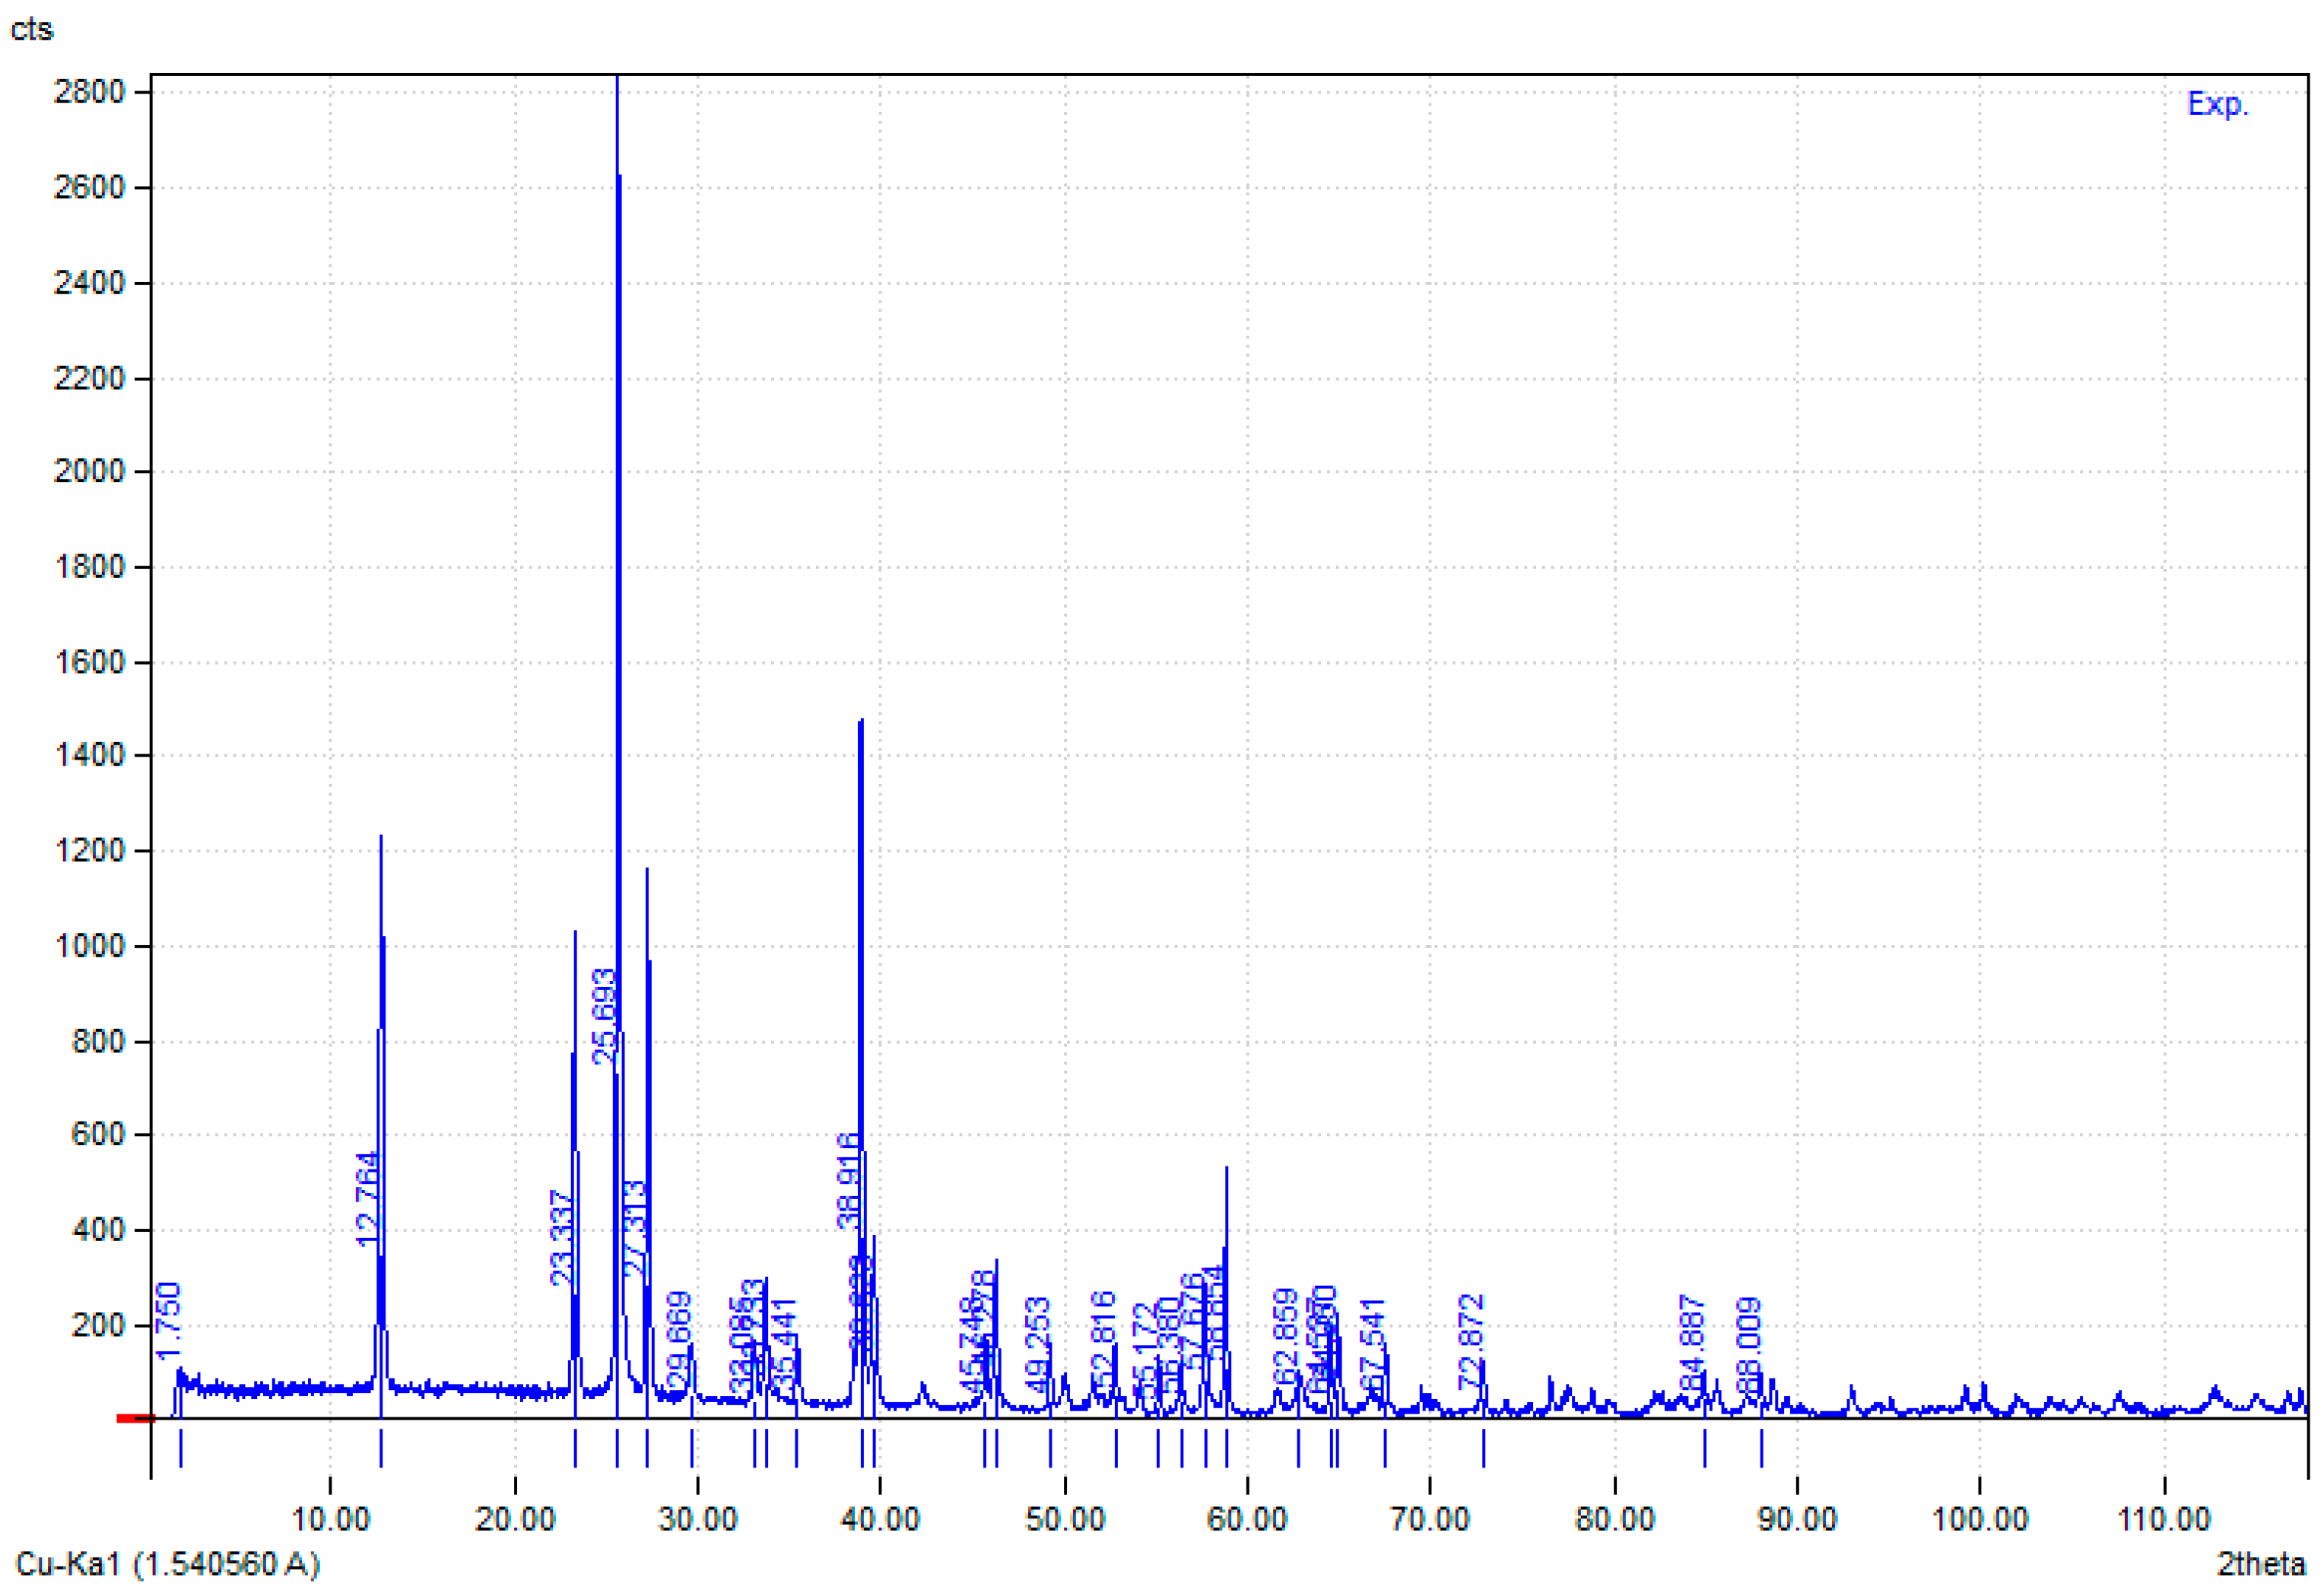
The functional groups present in the biochar synthesized from cow dung and rice straw in a proportion of 2:1 were identified via FT-IR analysis as presented in Figure 9, Figure 10 and Figure 11. The major functional groups identified were C=N, C-O, Si-O-Si and C=C, and their intensity varied in the biomass as their internal biological composition varied. In the biochar derived from cow dung biomass, the intensity of the peaks was lower, at 1609.95 cm−1, 1737.53 cm−1, 1889.92 cm−1, 2356.74 cm−1, 2926.65 cm−1 and 3429.42 cm−1. The biochar derived from the rice straw had peaks at 3402.72 cm−1, 1697.96 cm−1, 1602.47 cm−1, 1435.62 cm−1, 1383.79 cm−1 and 1273.02 cm−1. The biochar derived from the mixed biomass (2:1) had peaks at 3437.05 cm−1, 1705.82 cm−1, 1616.43 cm−1, 1383.72 cm−1 and 1102.20 cm−1.

3.4.3. XRD Analysis

XRD analysis provides the crystallographic structure, physical properties and chemical composition of a material. This functions on the basis of monochromatic X-rays analysis in a crystalline sample. The biochar obtained from the cow dung, rice straw and mixed biomass (2:1) samples were analyzed, and their corresponding XRD patterns are provided in Figure 12, Figure 13 and Figure 14. The peak intensity provides the extent of crystallinity of the particular plane present in the sample. A good peak to background ratio provides a better crystalline nature of the sample.

3.4.4. FT-Raman Analysis

Biochar from the hydrothermal liquification process is one example of a highly disordered carbonaceous material that can have its structural characteristics identified using Raman spectroscopy. The G (graphite band) and D (disordered structure) bands of the Raman spectrum are frequently used to examine the structure of biochar [18]. However, discovered that because biochar is not well ordered, its Raman spectra are different from those of ordered carbon compounds. The Raman spectrum (800–1800 cm−1) was separated into 10 bands by researchers, who then connected these bands to aromatic compounds in the char. Additionally, they connected the ratio of small to larger aromatic rings (respective peak regions) with the reactivity of the biochar [32].

3.5. Adsorption Experiments

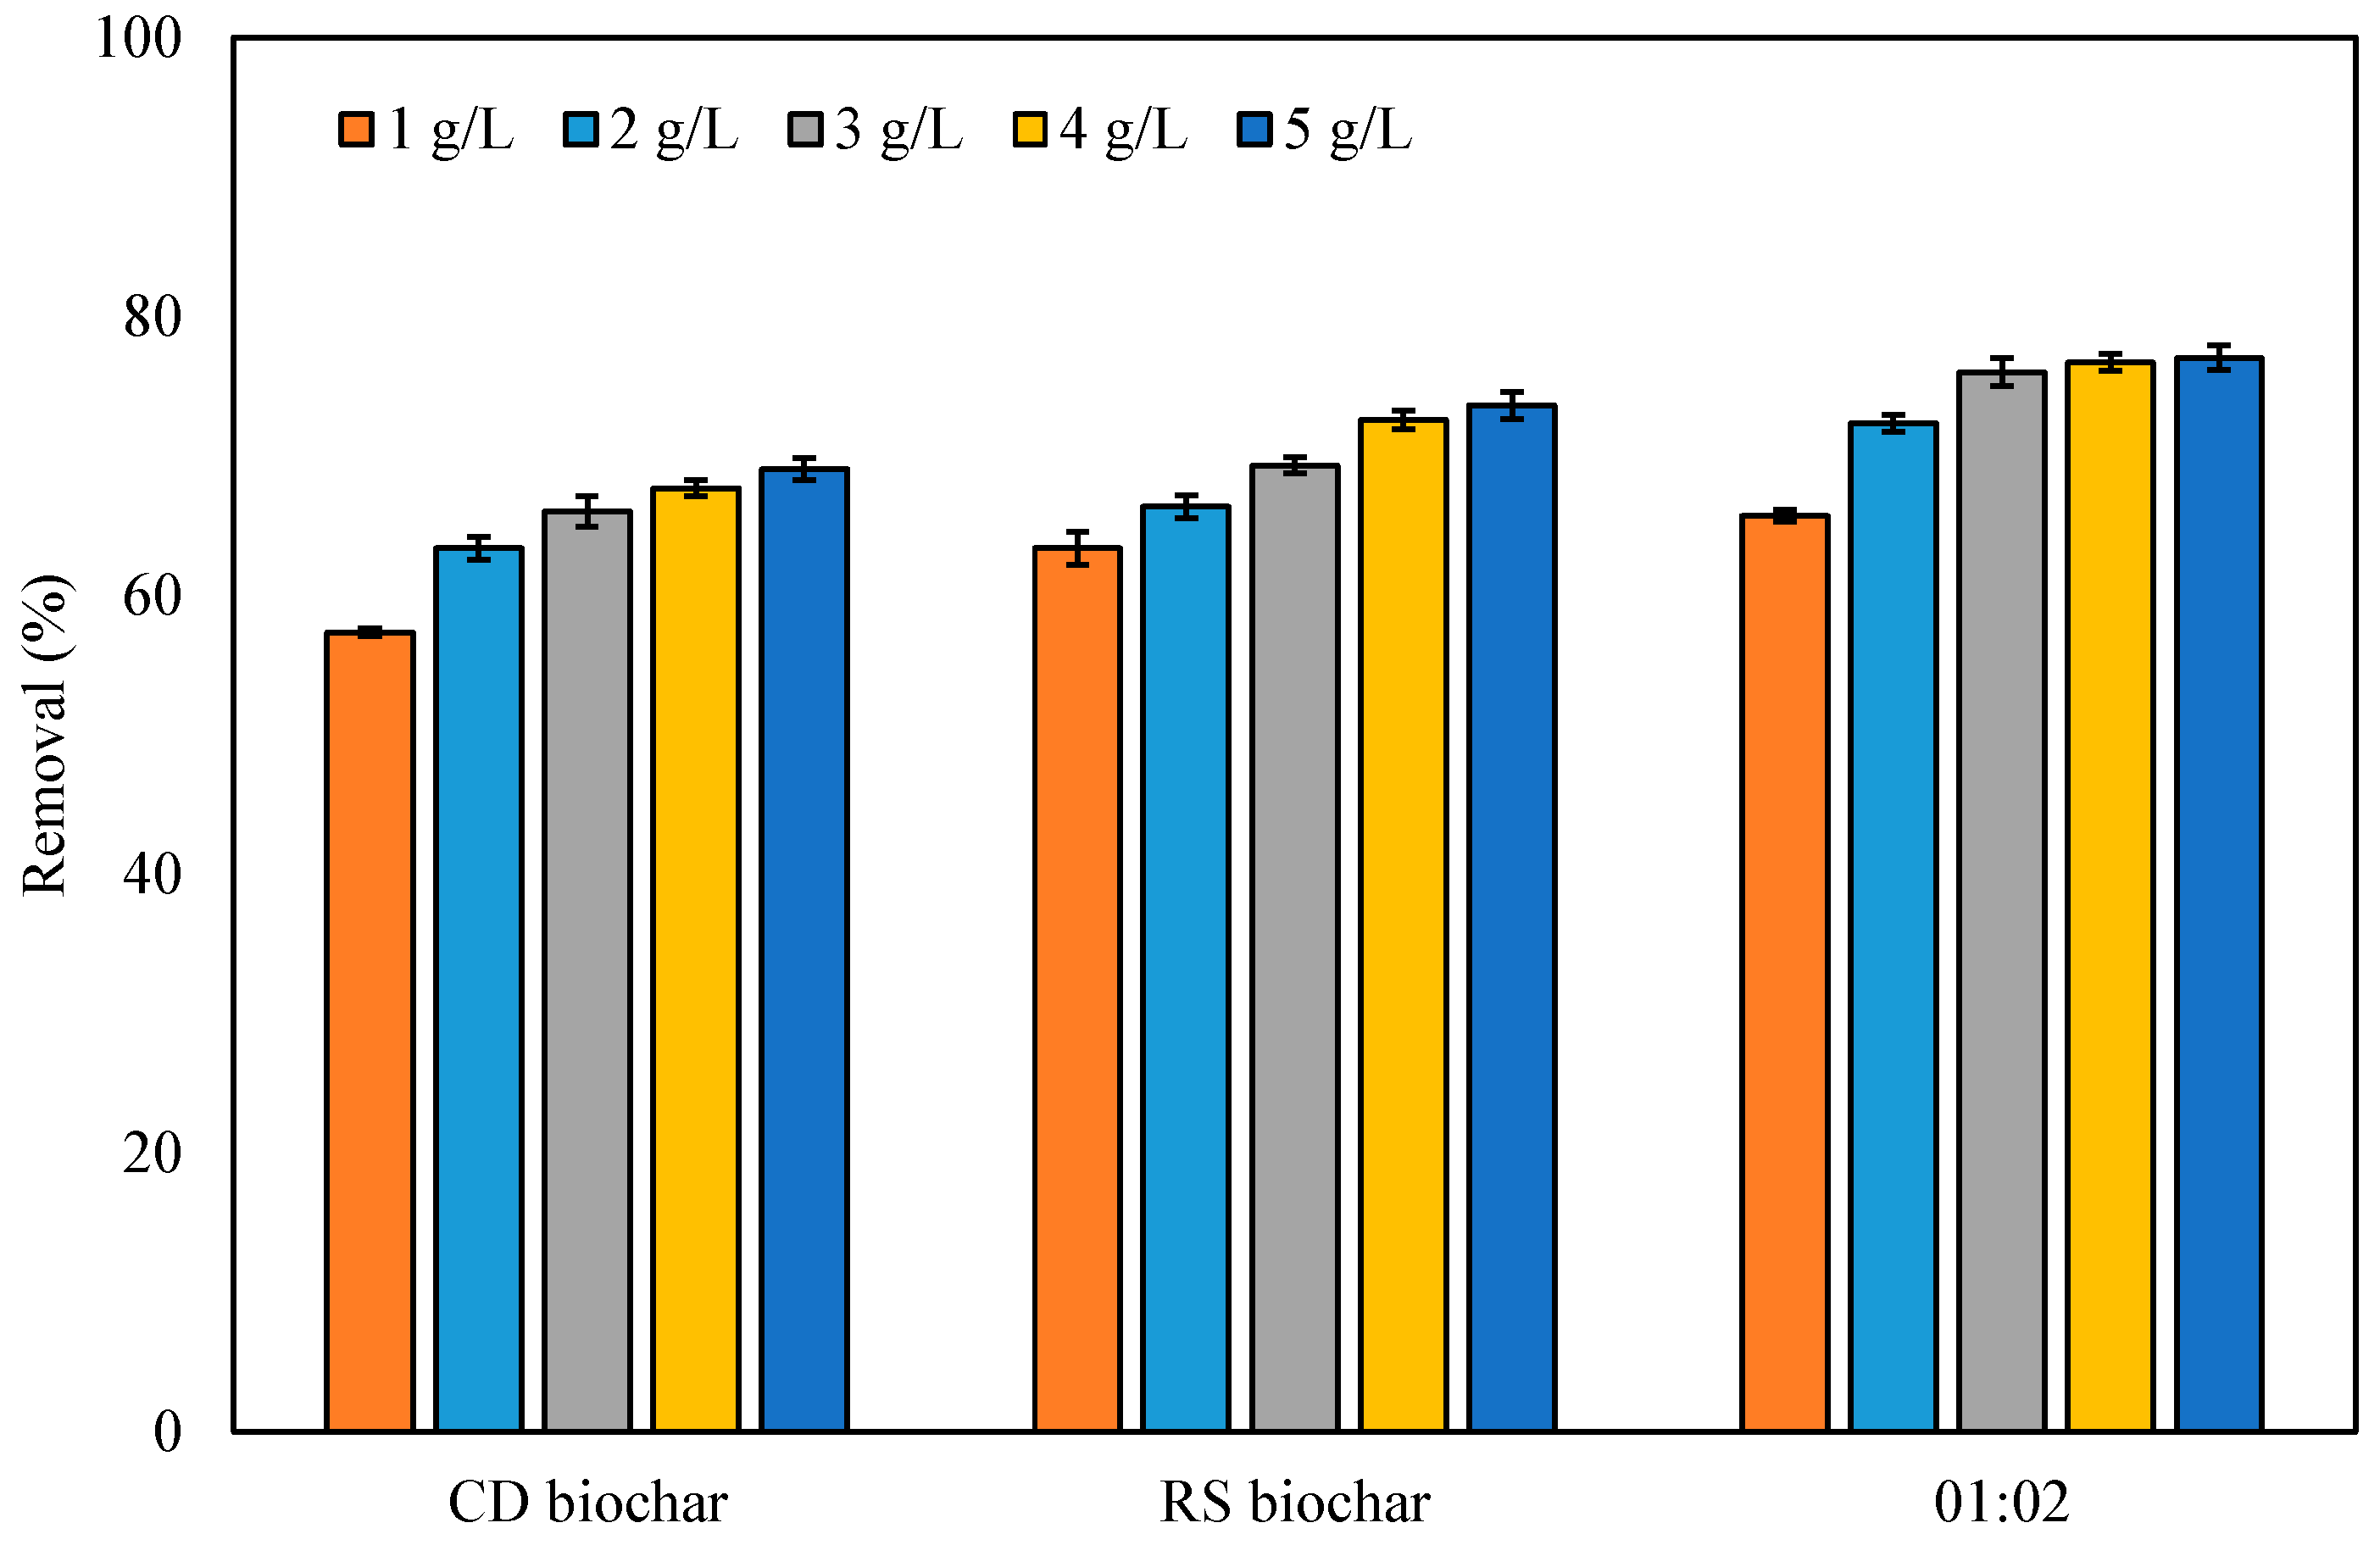
Effect of Biochar Dosage on Dye Removal

Three different biochar from rice straw, cow dung and a 1:2 concentration of rice straw and cow dung biochar were chosen for the adsorption of methylene blue dye removal investigation. Each of the biochar was subjected to the adsorption studies by varying its concentration in the removal of methylene blue dye (Figure 15, Figure 16 and Figure 17). Varying concentrations of about 1 to 5 g/L were taken and studied for methylene blue dye removal at 0.1–0.5 g/L. Each of the methylene blue dye removal studies were carried out separately by varying the concentrations of biochar produced from rice straw and cow dung. From the study, for 0.2 g/L of methylene blue dye it was observed that a maximum of 66.5% dye removal was achieved using cow dung; 72.5% dye removal was achieved using rice straw biochar; and about 71.5% dye removal was observed using the 1:2 concentration of rice straw and cow dung biochar. In the study for 0.3 g/L of methylene blue dye removal, it was observed that about 66% dye removal was observed with the cow dung-based biochar; about 69.3% methylene blue dye removal was observed with the rice straw biochar; and 76% methylene blue dye removal was observed with the 1:2 concentration rice straw and cow dung-based biochar. Likewise, for the 0.4 g/L methylene blue dye removal experiment, it was observed that about 66.5% dye removal was achieved using cow dung-based biochar; 72% dye removal was achieved using rice straw-based biochar; and about 74.75% dye removal was achieved using the 1:2 concentration of rice straw and cow dung-based biochar. In another study, biochar was used to remove methylene blue from wastewater, where it showed an adsorption capacity of 60.1 mg/g owing to its surface properties like surface area, porosity and deposition capacity. Similarly, in a study with pristine biochar synthesized via a pyrolysis process upon removal of erichrome black dye, it showed 94% removal efficiency at a 1.5 catalyst dose, 2 h time and a dye concentration of 20 mg/L.

4. Conclusions

It was seen that the hydrothermal liquefaction of cow dung, rice straw and both in a mixed combination (2:1) showed a sustainable solution for poultry waste management. HTL experiments were conducted at a temperature range of 240–340 °C, with solvent to biomass ratios of 1:1, 1:2, 2:1, 1:3 and 3:1, a time of 1 h and a pressure of 15 bar. The maximum bio-oil yield was 32.5 wt%, with a biochar yield of 18.5 wt% for the mixture of 2:1 (RS:CD) at a temperature of 320 °C. The major compounds seen in the bio-oil were hexadecane, heptadecane and octadecane. The adsorption efficiency of the biochar for the removal of dye from an aqueous environment was analyzed, and it showed efficiencies of more than 66, 69 and 76% for CD, RS and a 2:1 mixture, respectively.

Author Contributions

Conceptualization, A.H.S., M.R.K. and H.S.A.; Methodology, A.H.S., J.A.M., M.O.A. and A.H.; Software, A.H.S., M.R.K., J.A.M. and A.H.; Validation, H.F.A., I.A.A., M.R.K. and M.O.A.; Formal analysis, H.F.A., I.A.A., M.R.K., J.A.M., M.O.A. and A.H.; Investigation, I.A.A., M.R.K., M.O.A. and H.S.A.; Resources, A.H.S., H.F.A. and I.A.A.; Data curation, I.A.A., J.A.M., M.O.A. and A.H.; Writing—original draft, A.H.S., J.A.M. and H.S.A.; Writing—review & editing, H.S.A.; Visualization, J.A.M.; Supervision, A.H.S.; Funding acquisition, A.H.S. All authors have read and agreed to the published version of the manuscript.

Funding

This research was funded by the Deputyship for Research and Innovation, the Ministry of Education in Saudi Arabia (IFKSUDR-E162).

Data Availability Statement

The data presented in this study are available from the corresponding author upon reasonable request.

Acknowledgments

The authors extend their appreciation to the Deputyship for Research and Innovation, the Ministry of Education in Saudi Arabia, for funding this research through project number IFKSUDR-E162.

Conflicts of Interest

The authors declare no conflict of interest.

References

  1. Khan, N.; Chowdhary, P.; Ahmad, A.; Shekher Giri, B.; Chaturvedi, P. Hydrothermal liquefaction of rice husk and cow dung in Mixed-Bed-Rotating Pyrolyzer and application of biochar for dye removal. Bioresour. Technol. 2020, 309, 123294. [Google Scholar] [CrossRef]
  2. EswaryDevi, T.; Parthiban, R.; Arun, J.; Gopinath, K.P. Processing of marine microalgae biomass via hydrothermal liquefaction for bio-oil production: Study on algae cultivation, harvesting, and process parameters. Biomass Convers. Biorefin. 2022, 1–14. [Google Scholar] [CrossRef]
  3. López-García, M.; Lodeiro, P.; Herrero, R.; Barriada, J.L.; Rey-Castro, C.; David, C.; Sastre de Vicente, M.E. Experimental evidences for a new model in the description of the adsorption-coupled reduction of Cr(VI) by protonated banana skin. Bioresour. Technol. 2013, 139, 181–189. [Google Scholar] [CrossRef] [PubMed]
  4. Kan, T.; Strezov, V.; Evans, T.J. Lignocellulosic biomass pyrolysis: A review of product properties and effects of pyrolysis parameters. Renew. Sustain. Energy Rev. 2016, 57, 1126–1140. [Google Scholar] [CrossRef]
  5. Das, O.; Sarmah, A.K. Value added liquid products from waste biomass pyrolysis using pretreatments. Sci. Total Environ. 2015, 538, 145–151. [Google Scholar] [CrossRef]
  6. Durán-Sarmiento, M.A.; Del Portillo-Valdés, L.A.; Rueda-Ordonez, Y.J.; Florez-Rivera, J.S.; Rincón-Quintero, A.D. Study on the gasification process of the biomass obtained from agricultural waste with the purpose of estimating the energy potential in the Santander region and its surroundings. IOP Conf. Ser. Mater. Sci. Eng. 2022, 1253, 012001. [Google Scholar] [CrossRef]
  7. Doukeh, R.; Bombos, D.; Bombos, M.; Oprescu, E.E.; Dumitrascu, G.; Vasilievici, G.; Calin, C. Catalytic hydrotreating of bio-oil and evaluation of main noxious emissions of gaseous phase. Sci. Rep. 2021, 11, 6176. [Google Scholar] [CrossRef]
  8. Lee, S.Y.; Sankaran, R.; Chew, K.W.; Tan, C.H.; Krishnamoorthy, R.; Chu, D.-T.; Show, P.-L. Waste to bioenergy: A review on the recent conversion technologies. BMC Energy 2019, 1, 4. [Google Scholar] [CrossRef]
  9. Srifa, A.; Chaiwat, W.; Pitakjakpipop, P.; Anutrasakda, W.; Faungnawakij, K. Advances in bio-oil production and upgrading technologies. In Sustainable Bioenergy; Elsevier: Amsterdam, The Netherlands, 2019; pp. 167–198. [Google Scholar] [CrossRef]
  10. Hu, X.; Gholizadeh, M. Progress of the applications of bio-oil. Renew. Sustain. Energy Rev. 2020, 134, 110124. [Google Scholar] [CrossRef]
  11. Lazzari, E.; dos Santos Polidoro, A.; Onorevoli, B.; Schena, T.; Silva, A.N.; Scapin, E.; Jacques, R.A.; Caramão, E.B. Production of rice husk bio-oil and comprehensive characterization (qualitative and quantitative) by HPLC/PDA and GC × GC/qMS. Renew. Energy 2019, 135, 554–565. [Google Scholar] [CrossRef]
  12. Su, G.; Ong, H.C.; Mohd Zulkifli, N.W.; Ibrahim, S.; Chen, W.H.; Chong, C.T.; Ok, Y.S. Valorization of animal manure via pyrolysis for bioenergy: A review. J. Clean. Prod. 2022, 343, 130965. [Google Scholar] [CrossRef]
  13. Saxena, D.; Sandhwar, V.K. Cow farm wastes: A bioresource for sustainable development. In Bio-Based Materials and Waste for Energy Generation and Resource Management; Elsevier: Amsterdam, The Netherlands, 2023; pp. 411–429. [Google Scholar] [CrossRef]
  14. ASTM E871-82; Standard Test Method for Moisture Analysis of Particulate Wood Fuels. Available online: https://www.astm.org/e0871-82r19.html (accessed on 10 August 2023).
  15. ASTM E1755-01; Standard Test Method for Ash in Biomass. Available online: https://www.astm.org/e1755-01.html (accessed on 10 August 2023).
  16. Vaithyanathan, V.K.; Goyette, B.; Rajagopal, R. A critical review of the transformation of biomass into commodity chemicals: Prominence of pretreatments. Environ. Chall. 2023, 11, 100700. [Google Scholar] [CrossRef]
  17. Biswas, B.; Arun Kumar, A.; Bisht, Y.; Singh, R.; Kumar, J.; Bhaskar, T. Effects of temperature and solvent on hydrothermal liquefaction of Sargassum tenerrimum algae. Bioresour. Technol. 2017, 242, 344–350. [Google Scholar] [CrossRef] [PubMed]
  18. Mathanker, A.; Pudasainee, D.; Kumar, A.; Gupta, R. Hydrothermal liquefaction of lignocellulosic biomass feedstock to produce biofuels: Parametric study and products characterization. Fuel 2020, 271, 117534. [Google Scholar] [CrossRef]
  19. Arun, J.; Gopinath, K.P.; SundarRajan, P.S.; Malolan, R.; AjaySrinivaasan, P. Hydrothermal liquefaction and pyrolysis of Amphiroa fragilissima biomass: Comparative study on oxygen content and storage stability parameters of bio-oil. Bioresour. Technol. Rep. 2020, 11, 100465. [Google Scholar] [CrossRef]
  20. Arun, J.; Gopinath, K.P.; SundarRajan, P.S.; Malolan, R.; Adithya, S.; Sai Jayaraman, R.; Srinivaasan Ajay, P. Hydrothermal liquefaction of Scenedesmus obliquus using a novel catalyst derived from clam shells: Solid residue as catalyst for hydrogen production. Bioresour. Technol. 2020, 310, 123443. [Google Scholar] [CrossRef]
  21. Arun, J.; Gopinath, K.P.; Vigneshwar, S.S.; Swetha, A. Sustainable and eco-friendly approach for phosphorus recovery from wastewater by hydrothermally carbonized microalgae: Study on spent bio-char as fertilizer. J. Water Process. Eng. 2020, 38, 101567. [Google Scholar] [CrossRef]
  22. Arun, J.; Gopinath, K.P.; Sivaramakrishnan, R.; Shyam, S.; Mayuri, N.; Manasa, S.; Pugazhendhi, A. Hydrothermal liquefaction of Prosopis juliflora biomass for the production of ferulic acid and bio-oil. Bioresour. Technol. 2021, 319, 124116. [Google Scholar] [CrossRef]
  23. Ibrahim, I.; Tsubota, T.; Hassan, M.A.; Andou, Y. Surface Functionalization of Biochar from Oil Palm Empty Fruit Bunch through Hydrothermal Process. Processes 2021, 9, 149. [Google Scholar] [CrossRef]
  24. Xiu, S.; Shahbazi, A.; Shirley, V.; Cheng, D. Hydrothermal pyrolysis of swine manure to bio-oil: Effects of operating parameters on products yield and characterization of bio-oil. J. Anal. Appl. Pyrolysis 2010, 88, 73–79. [Google Scholar] [CrossRef]
  25. Tahir, M.H.; Cheng, X.; Irfan, R.M.; Ashraf, R.; Zhang, Y. Comparative chemical analysis of pyrolyzed bio oil using online TGA-FTIR and GC-MS. J. Anal. Appl. Pyrolysis 2020, 150, 104890. [Google Scholar] [CrossRef]
  26. Arellano, O.; Flores, M.; Guerra, J.; Hidalgo, A.; Rojas, D.; Strubinger, A. Hydrothermal Carbonization of Corncob and Characterization of the Obtained Hydrochar. Chem. Eng. Trans. 2016, 50, 235–240. [Google Scholar] [CrossRef]
  27. Tekin, K.; Karagöz, S.; Bektaş, S. Hydrothermal liquefaction of beech wood using a natural calcium borate mineral. J. Supercrit. Fluids 2012, 72, 134–139. [Google Scholar] [CrossRef]
  28. Akhtar, J.; Amin, N.A.S. A review on process conditions for optimum bio-oil yield in hydrothermal liquefaction of biomass. Renew. Sustain. Energy Rev. 2011, 15, 1615–1624. [Google Scholar] [CrossRef]
  29. Yi, Y.; Tu, G.; Zhao, D.; Tsang, P.E.; Fang, Z. Biomass waste components significantly influence the removal of Cr(VI) using magnetic biochar derived from four types of feedstocks and steel pickling waste liquor. Chem. Eng. J. 2019, 360, 212–220. [Google Scholar] [CrossRef]
  30. Hu, Y.; Gong, M.; Feng, S.; Xu, C.C.; Bassi, A. A review of recent developments of pre-treatment technologies and hydrothermal liquefaction of microalgae for bio-crude oil production. Renew. Sustain. Energy Rev. 2019, 101, 476–492. [Google Scholar] [CrossRef]
  31. Hoslett, J.; Ghazal, H.; Mohamad, N.; Jouhara, H. Removal of methylene blue from aqueous solutions by biochar prepared from the pyrolysis of mixed municipal discarded material. Sci. Total Environ. 2020, 714, 136832. [Google Scholar] [CrossRef]
  32. Qian, K.; Kumar, A.; Zhang, H.; Bellmer, D.; Huhnke, R. Recent advances in utilization of biochar. Renew. Sustain. Energy Rev. 2015, 42, 1055–1064. [Google Scholar] [CrossRef]
Figure 1. Thermogravimetric weight loss graph of individual and mixed biomass (rice straw and cow dung).
Processes 11 02779 g001
Figure 2. Effect of temperature and biomass mixture (rice straw and cow dung) on bio-oil yield.
Processes 11 02779 g002
Figure 3. Effect of temperature and biomass mixture (rice straw and cow dung) on biochar yield.
Processes 11 02779 g003
Figure 4. Effect of biomass mixture (rice straw and cow dung) to solvent ratio on bio-oil yield.
Processes 11 02779 g004
Figure 5. Effect of biomass mixture (rice straw and cow dung) to solvent ratio on biochar yield.
Processes 11 02779 g005
Figure 6. GC–MS profiles of bio-oil obtained from various combinations of cow dung and rice straw processed from hydrothermal process.
Processes 11 02779 g006
Figure 7. SEM image of biochar obtained from cow dung.
Processes 11 02779 g007
Figure 8. SEM image of biochar obtained from rice straw.
Processes 11 02779 g008
Figure 9. FTIR spectra of biochar derived from hydrothermally processed cow dung biomass.
Processes 11 02779 g009
Figure 10. FTIR spectra of biochar derived from hydrothermally processed rice straw biomass.
Processes 11 02779 g010
Figure 11. FTIR spectra of biochar derived from hydrothermally processed rice straw and cow dung (2:1) biomass.
Processes 11 02779 g011
Figure 12. XRD pattern of biochar derived from cow dung.
Processes 11 02779 g012
Figure 13. XRD analysis of biochar derived from rice straw.
Processes 11 02779 g013
Figure 14. XRD analysis of biochar derived from mixed biomass.
Processes 11 02779 g014
Figure 15. Effect of biochar on dye removal at dye concentration of 0.2 g/L.
Processes 11 02779 g015
Figure 16. Effect of biochar on dye removal at dye concentration of 0.3 g/L.
Processes 11 02779 g016
Figure 17. Effect of biochar on dye removal at dye concentration of 0.4 g/L.
Processes 11 02779 g017
Table 1. Elemental compositions of bio-oil and biomass of different biomass components.
Biomass Mixture (RS:CD)CHNSOHHV (MJ/Kg)H/CO/C
Biomass01:0047.519.345.232.4535.4723.064512.3590820.559935
00:0137.6512.29.121.0539.9523.059073.8980080.795817
01:0145.238.64.231.4540.4920.341082.2816710.671402
01:0241.569.564.892.141.8920.22162.7603460.755955
02:0148.719.743.710.7837.0623.757492.3995070.570622
01:0340.818.123.591.0746.4117.104962.387650.852916
03:0145.239.033.181.2341.3320.805182.3957550.685331
Bio-oil01:0071.237.123.120.8217.7131.081871.1994950.186473
00:0164.239.454.181.1221.0231.452271.765530.245446
01:0166.898.233.580.9120.3930.721651.4764540.228622
01:0261.589.562.451.4924.9230.01751.8629430.303508
02:0170.238.561.150.4519.6132.461041.4626230.209419
01:0367.237.892.230.7621.8930.08331.40830.244199
03:0168.916.781.970.4921.8529.07321.180670.23781
Disclaimer/Publisher’s Note: The statements, opinions and data contained in all publications are solely those of the individual author(s) and contributor(s) and not of MDPI and/or the editor(s). MDPI and/or the editor(s) disclaim responsibility for any injury to people or property resulting from any ideas, methods, instructions or products referred to in the content.

