Article

Analysis of the Support Failure Mechanism Caused by Bolt Pre-Tightening Force Loss

1
School of Mines, China University of Mining and Technology, Xuzhou 221116, China
2
Shandong Province Key Laboratory of Mine Mechanical Engineering, Shandong University of Science and Technology, Qingdao 266590, China
*
Author to whom correspondence should be addressed.
Processes 2024, 12(1), 113; https://doi.org/10.3390/pr12010113
Submission received: 6 December 2023 / Revised: 27 December 2023 / Accepted: 28 December 2023 / Published: 2 January 2024
(This article belongs to the Section Energy Systems)

Abstract

:
The pre-tightening force loss (PTFL) of bolts is an important but underestimated cause of roadway instability. In mine anchorage systems, the actual pre-tightening force of bolts is only 50% to 80% of the design value. Through a case study at Xiahuo Coal Mine, it was found that the essential causes of PTFL are the increasing friction coefficient between supporting units controlled by factors such as pre-tightening torque levels, pre-tightening cycles, and surrounding rock roughness. This study investigates the behavioral characteristics of PTFL and its influence on surrounding rock failure in roadways. This research reveals a linear correlation between pre-tightening force and torque, with an average torque conversion coefficient of approximately 0.19. However, the PTFL increases with higher levels of pre-tightening torque, increasing pre-tightening cycles, and rougher surrounding rock conditions. For every 30 N·m increase in pre-tightening torque, the PTFL increases by approximately 1.67 kN. Reducing the PTFL can expedite the stress redistribution process and shorten the self-stabilizing period of the roadway by approximately 10 days, thereby enhancing the active supporting potential of bolts.

1. Introduction

Roadways in soft rock, commonly encountered in coal mining systems, are prone to considerable deformation without adequate bolt support. This challenge is exacerbated in the presence of complex tectonic stresses, which can lead to severe deformation and the potential collapse of these roadways. As a pivotal component in stabilizing the rock surrounding these roadways, bolts are instrumental in preventing rock dilation and deformation. They enable the rock and bolts to share loads synchronously, enhancing stress distribution within the rock mass. Thus, applying an appropriate pre-tightening force to the bolts is crucial for maintaining stratum stability [1,2,3]. As shown in Figure 1, in field engineering, the pre-tightening force is typically applied by tightening the nut [4,5]. However, in many coal mines, the conversion of pre-tightening torque to force is often compromised by friction between support units and other factors, resulting in a significantly lower actual pre-tightening force than the intended value. This discrepancy leads to substantial deformation of the surrounding rock in the initial stages of roadway support. The traditional approach to address this issue involves replacing failed bolts with new ones. While this method curtails further deformation, it also escalates support costs [6]. Therefore, investigating the loss behavior of the pre-tightening force in bolts and developing corresponding remediation techniques is vital. This research aims to guide roadway support construction to enhance roadway stability.
The application of the pre-tightening force can effectively control fractured rock by modulating the stress distribution within the rock and managing its internal structure. Initially, by augmenting the pre-tightening force, a more uniform stress distribution is achieved. This alteration intensifies the stress gradient in the roadway’s plastic zone while diminishing it in the elastic zone. Moreover, the increase in the minimum principal stress within the anchorage body forms a stress superposition zone, boosting the anchorage structure’s load-bearing capacity. This process also contracts the tensile stress zone, further reinforcing the structure [7,8,9,10]. Regarding controlling the rock strata’s internal structure, a high pre-tightening force elevates the frictional force on the structural plane, thereby enhancing the rock’s shear strength. Additionally, the “axial-pressure fastening” effect, induced by bolt pre-tightening, effectively restrains the expansion and slippage of fractured surfaces [11,12,13]. Nevertheless, an excessively high pre-tightening force may promote fracture development within the anchorage body, diminishing its load-bearing and deformation resistance capabilities [14,15]. In essence, maintaining an optimal level of the pre-tightening force is imperative to avert roadway collapses.
In field construction, due to relatively low pre-tightening torque and friction between supporting units and other factors, the presence of PTFL (pre-tightening force loss), sometimes reaching 30–50%, is a significant concern [16]. Numerous studies have investigated the causes and characteristics of PTFL and identified it as a result of various factors, including material specifications, friction coefficients, tightening speed, and the number of support cycles. Under identical pre-tightening torque conditions, friction-reducing measures can enhance the bolt pre-tightening force by approximately 26.57–77.76% [17,18]. Liu et al. [19] conducted experiments to assess the impact of different lubrication methods on pre-tightening force variation. Additionally, the influence of factors such as tightening times, lubrication methods, and tightening speed on bolt pre-tightening torque efficiency has garnered scholarly interest. Zheng et al. [20] examined both initial and service PTFL in bolts, discovering correlations with pre-tightening force, tightening cycles, and lubrication methods. Yu [21] investigated the effects of tightening and loosening cycles, tightening speed, and lubricant types on the friction coefficient, observing that lubrication significantly impacts the friction and torque-tension relationship in threaded fasteners. Nassar [22] determined that the tightening speed and coating markedly affect the torque-tension relationship and wear patterns in threaded fasteners. While most studies emphasize bolt material properties and friction coefficients, fewer explore other factors such as pre-tightening torque levels, tightening cycles, and the degree of surrounding rock rupture on pre-tightening force.
Extensive research by numerous scholars has delved into the causes and characteristics of pre-tightening force loss in bolts. These studies have identified several factors contributing to this loss, including the material specifications of support components, friction coefficients, tightening speed, and the number of tightening cycles. However, the majority of existing research has centered on the impact of bolt material properties, dimensional parameters, and tightening cycles on the conversion process of pre-tightening force. Notably, there is a significant gap in the literature regarding the influence of geological factors, such as rock fragmentation and rock mass strength, on the pre-tightening process of bolts. Additionally, current studies lack comprehensive cause analysis and effective solution methods for pre-tightening force loss encountered in practical settings.
To address these gaps, this paper aims to elucidate the primary factors contributing to pre-tightening force loss, incorporating field tests that consider engineering conditions, geological factors, and construction environments. Our research focuses on the 2308 return air roadway in the Xiahuo Coal Mine, serving as the engineering context. Initially, we analyze the characteristics of pre-tightening force loss and its detrimental effects on soft rock roadways under complex tectonic stress. Subsequently, through field testing, we uncover the internal relationships between pre-tightening torque levels, surrounding rock roughness, pre-tightening frequency, and pre-tightening force loss. Lastly, we demonstrate the critical role of reducing pre-tightening force loss (PTFL) in controlling the surrounding rock of roadways through practical engineering applications.

2. Engineering Background

2.1. General Geology

The Xiahuo Coal Mine, situated in Changzhi City, Shanxi Province, China, is characterized by complex geological conditions. Notably, the mine is heavily influenced by faults and collapse columns, resulting in soft and fragmented rock surrounding its roadways. This complexity poses significant challenges for roadway support, particularly in the 2308 return air roadway. Within a 200 m radius north and south of this roadway, there are four collapse columns, and the Zhujiazhuang syncline is situated approximately 1000 m south of the roadway entrance (see Figure 2a). The 2308 return air roadway’s No. 3 coal seam has a buried depth of 451 m, a thickness of 4.65 m, and a dip angle of 3.5° (see Figure 2b).
During the excavation of the 2308 return airway, a specific technique involving tunneling beneath the roof was employed, progressing at an approximate rate of 9.0 m per day. Significantly, the tunnel’s surrounding area lacks other coal mining or tunneling activities, minimizing disturbances from such operations. Additionally, geological assessments have classified the Xiahuo Coal Mine as seismically stable, indicating the negligible impact of rock mass vibration on the effectiveness of anchor bolt support.
The supporting section of the 2308 return air roadway is shown in Figure 3. The rectangular roadway was excavated along the roof of the coal seam, and the roadway size was 5.6 m × 4.0 m (width × height). The support structure employs a “bolt-mesh-cable” combination: the bolts are Φ22 mm × 2400 mm; the plates are Φ170 mm × 10 mm arched steel; the designed pre-tightening torque is set at 300 N·m. For anchoring, resin agents MSK2335 and MSZ2360 were utilized.

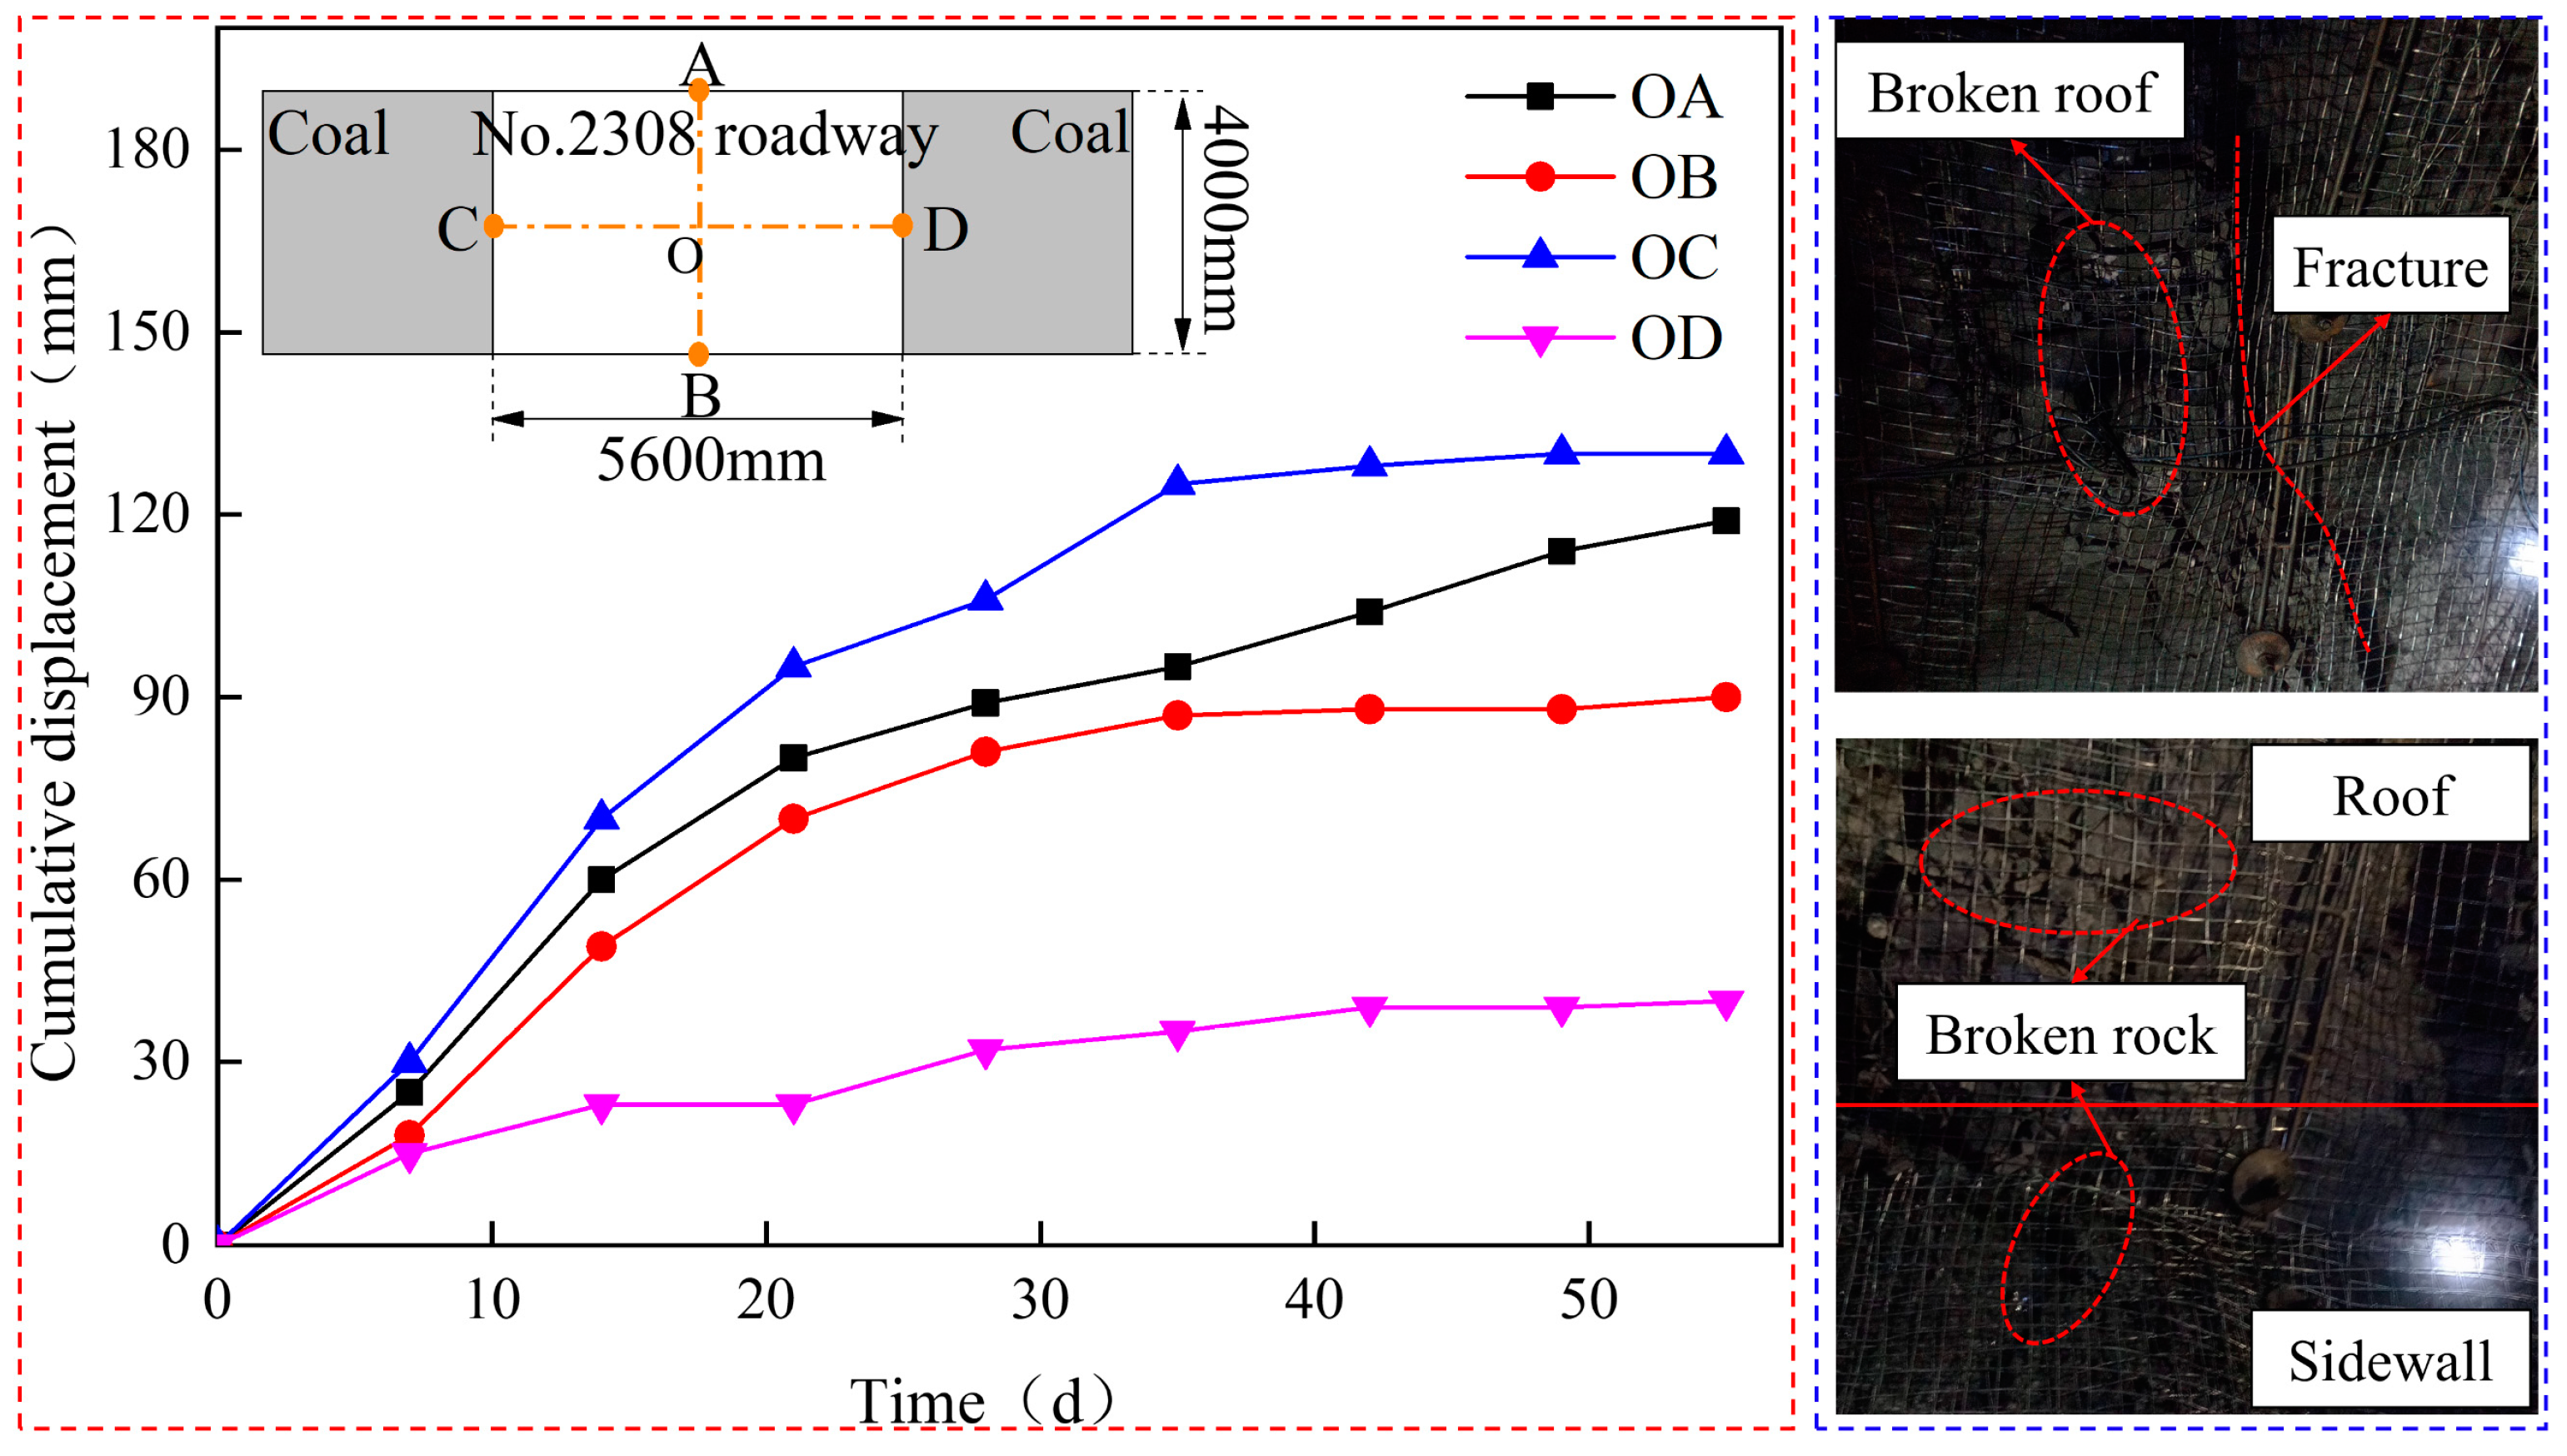
2.2. Analysis of Failure Characteristics of Roadway

Figure 4 presents the deformation observed at a distance of 120 m from the 2308 return air roadway. Four points A, B, C and D respectively represent the displacement monitoring points of the roof, floor and two sides of the roadway respectively. Analysis of the data indicates that in the initial 28 days following excavation, termed the “deformation development stage”, the roadway experienced an average roof-to-floor deformation rate of 6.0 mm/day and a side-to-side deformation rate of 4.9 mm/day. Beyond this period, in what is referred to as the “deformation stability stage”, cumulative deformations of 209 mm in the roof-to-floor direction and 170 mm in the side-to-side direction were recorded. This data collectively underscores a prolonged period of significant self-stabilization, ultimately leading to considerable deformation in the roadway. The primary factors contributing to this severe deformation include the following: (1) the complex tectonic stress resulting from the development of collapse columns and faults; (2) the low-strength sandy mudstone composition of the roadway’s roof and floor; (3) substantial loss of bolt pre-tightening force.
Further research reveals that when the pre-tightening torque is set to 300 N·m under actual field conditions, most bolts achieve an actual pre-tightening force ranging between 40 kN and 60 kN. This represents only 51% to 77% of the theoretical value (78 kN). Consequently, in the context of PTFL, the bolt and surrounding rock in the soft rock roadway struggle to form a timely, synergistic anchorage-bearing body due to the complex tectonic stress. Moreover, the biaxial stress state of the excavated roadway largely remains unaffected, thereby diminishing the bolt’s reinforcement impact on the bearing capacity of the surrounding rock.
As shown in Figure 5, an examination of the surrounding rock within the 0.0 m to 1.0 m range from the 2308 return air roadway roof reveals significant fragmentation, leading to a reduced bearing capacity in the rock mass. Between 1.0 m and 4.0 m, the rock mass appears comparatively intact, although some sections display less-developed longitudinal fractures. At a depth of 4.5 m, a distinct separation layer becomes evident between the immediate and main roofs. Furthermore, from 5.0 m to 10.0 m, the rock mass shows a high degree of integrity. Owing to PTFL, the bolts are unable to effectively constrain the deformation of the surrounding rock. This results in subsidence in both the shallow and deep rock strata, culminating in the formation of a pronounced separation layer at a depth of 4.5 m from the roof.
The loss of pre-tightening force does have an impact on the deformation and failure of the roof stratum as depicted in Figure 5. This phenomenon occurs because the actual pre-tightening force is lower than the designed value due to this loss. Consequently, the bolt’s effectiveness in suppressing crack development and adjusting stress distribution diminishes. This results in increased deformation in the shallow surrounding rock and subsequent failure in the deeper strata, as evidenced by the fractured rock in the shallow roof (0–1.0 m) and the roof stratification in the deeper section (4.5 m).

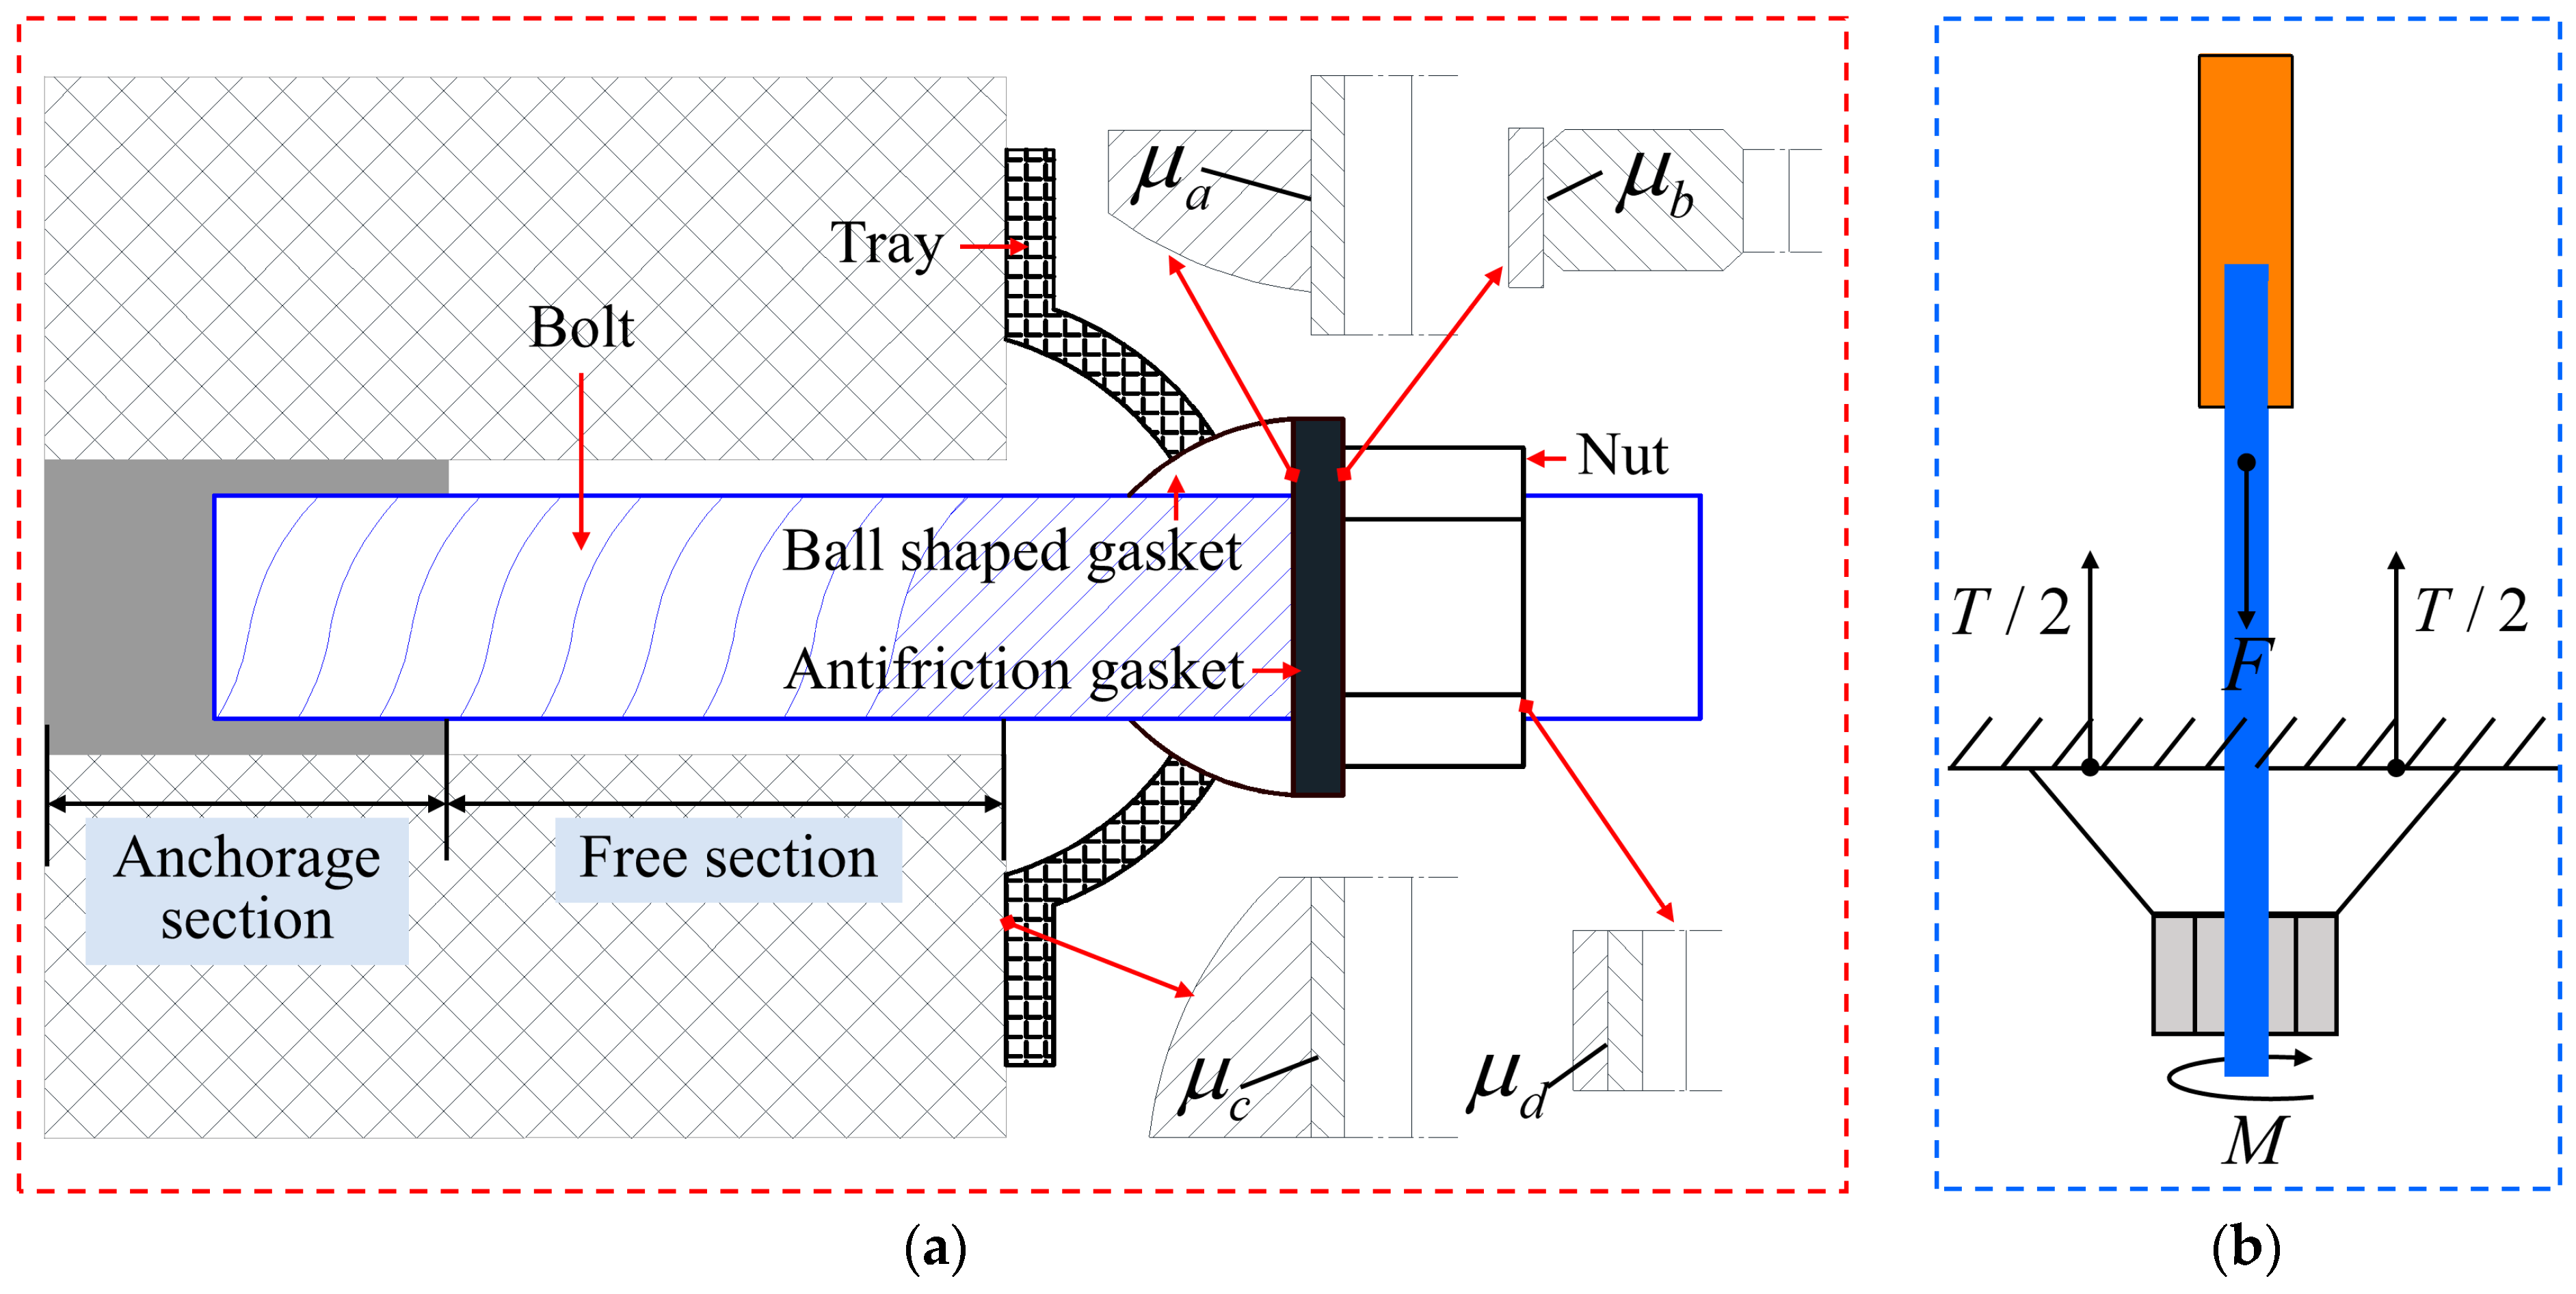
3. Material and Methods

The primary equipment utilized for the field test includes an anchor drilling rig, bolts, trays, an anchor dynamometer, and a torque wrench, among others. The following experimental equipment are purchased from Shandong Yinheng Technology Co., Ltd., Jinan, China. A brief overview of the experimental equipment is as follows:
(a) The MQT-130/3.2 pneumatic anchor drill operates at a rated air pressure of 0.5 mPa and a rotational speed of 230 r/min, with a maximum torque of approximately 130 N·m. The drilling tools employed are B19 hexagonal rods and Φ28 mm two-wing PDC drill bits.
(b) The Φ22 × 2400 mm bolt has a yield load of 127 kN. MSK2335 and MSZ2360 resin anchoring agents were used onsite with an anchoring length of 600 mm.
(c) The MCS-400 bolt dynamometer has a pressure measurement range of 0~400 kN. The NA-500N torque wrench, used for bolt pre-tightening, can apply a maximum torque of 500 N·m.
In the field test conducted approximately 120 m from the entrance of the 2308 return air roadway, specific protocols were followed. Three anchoring holes were drilled at 20 m intervals on the left side of the roadway. Bolts B1-B3 were then installed in each anchorage hole. After a 30 min anchoring period, varying levels of pre-tightening torque (as listed in Table 1) were applied to the Φ22 mm × 2400 mm left screw-thread steel bolts using a torque wrench. The MCS-400 bolt dynamometer monitored the pre-tightening force values under each torque level. To prevent gasket deformation from influencing the results (as depicted in Figure 6), no friction-reducing gasket was placed between the nut and the 125 mm × 125 mm × 10 mm arched plate. Additionally, to reduce data errors due to operational mistakes, each bolt underwent pre-tightening three times following a specific scheme. The corresponding pre-tightening force values were recorded as F1 (initial pre-tightening force), F2, and F3.

4. Experimental results

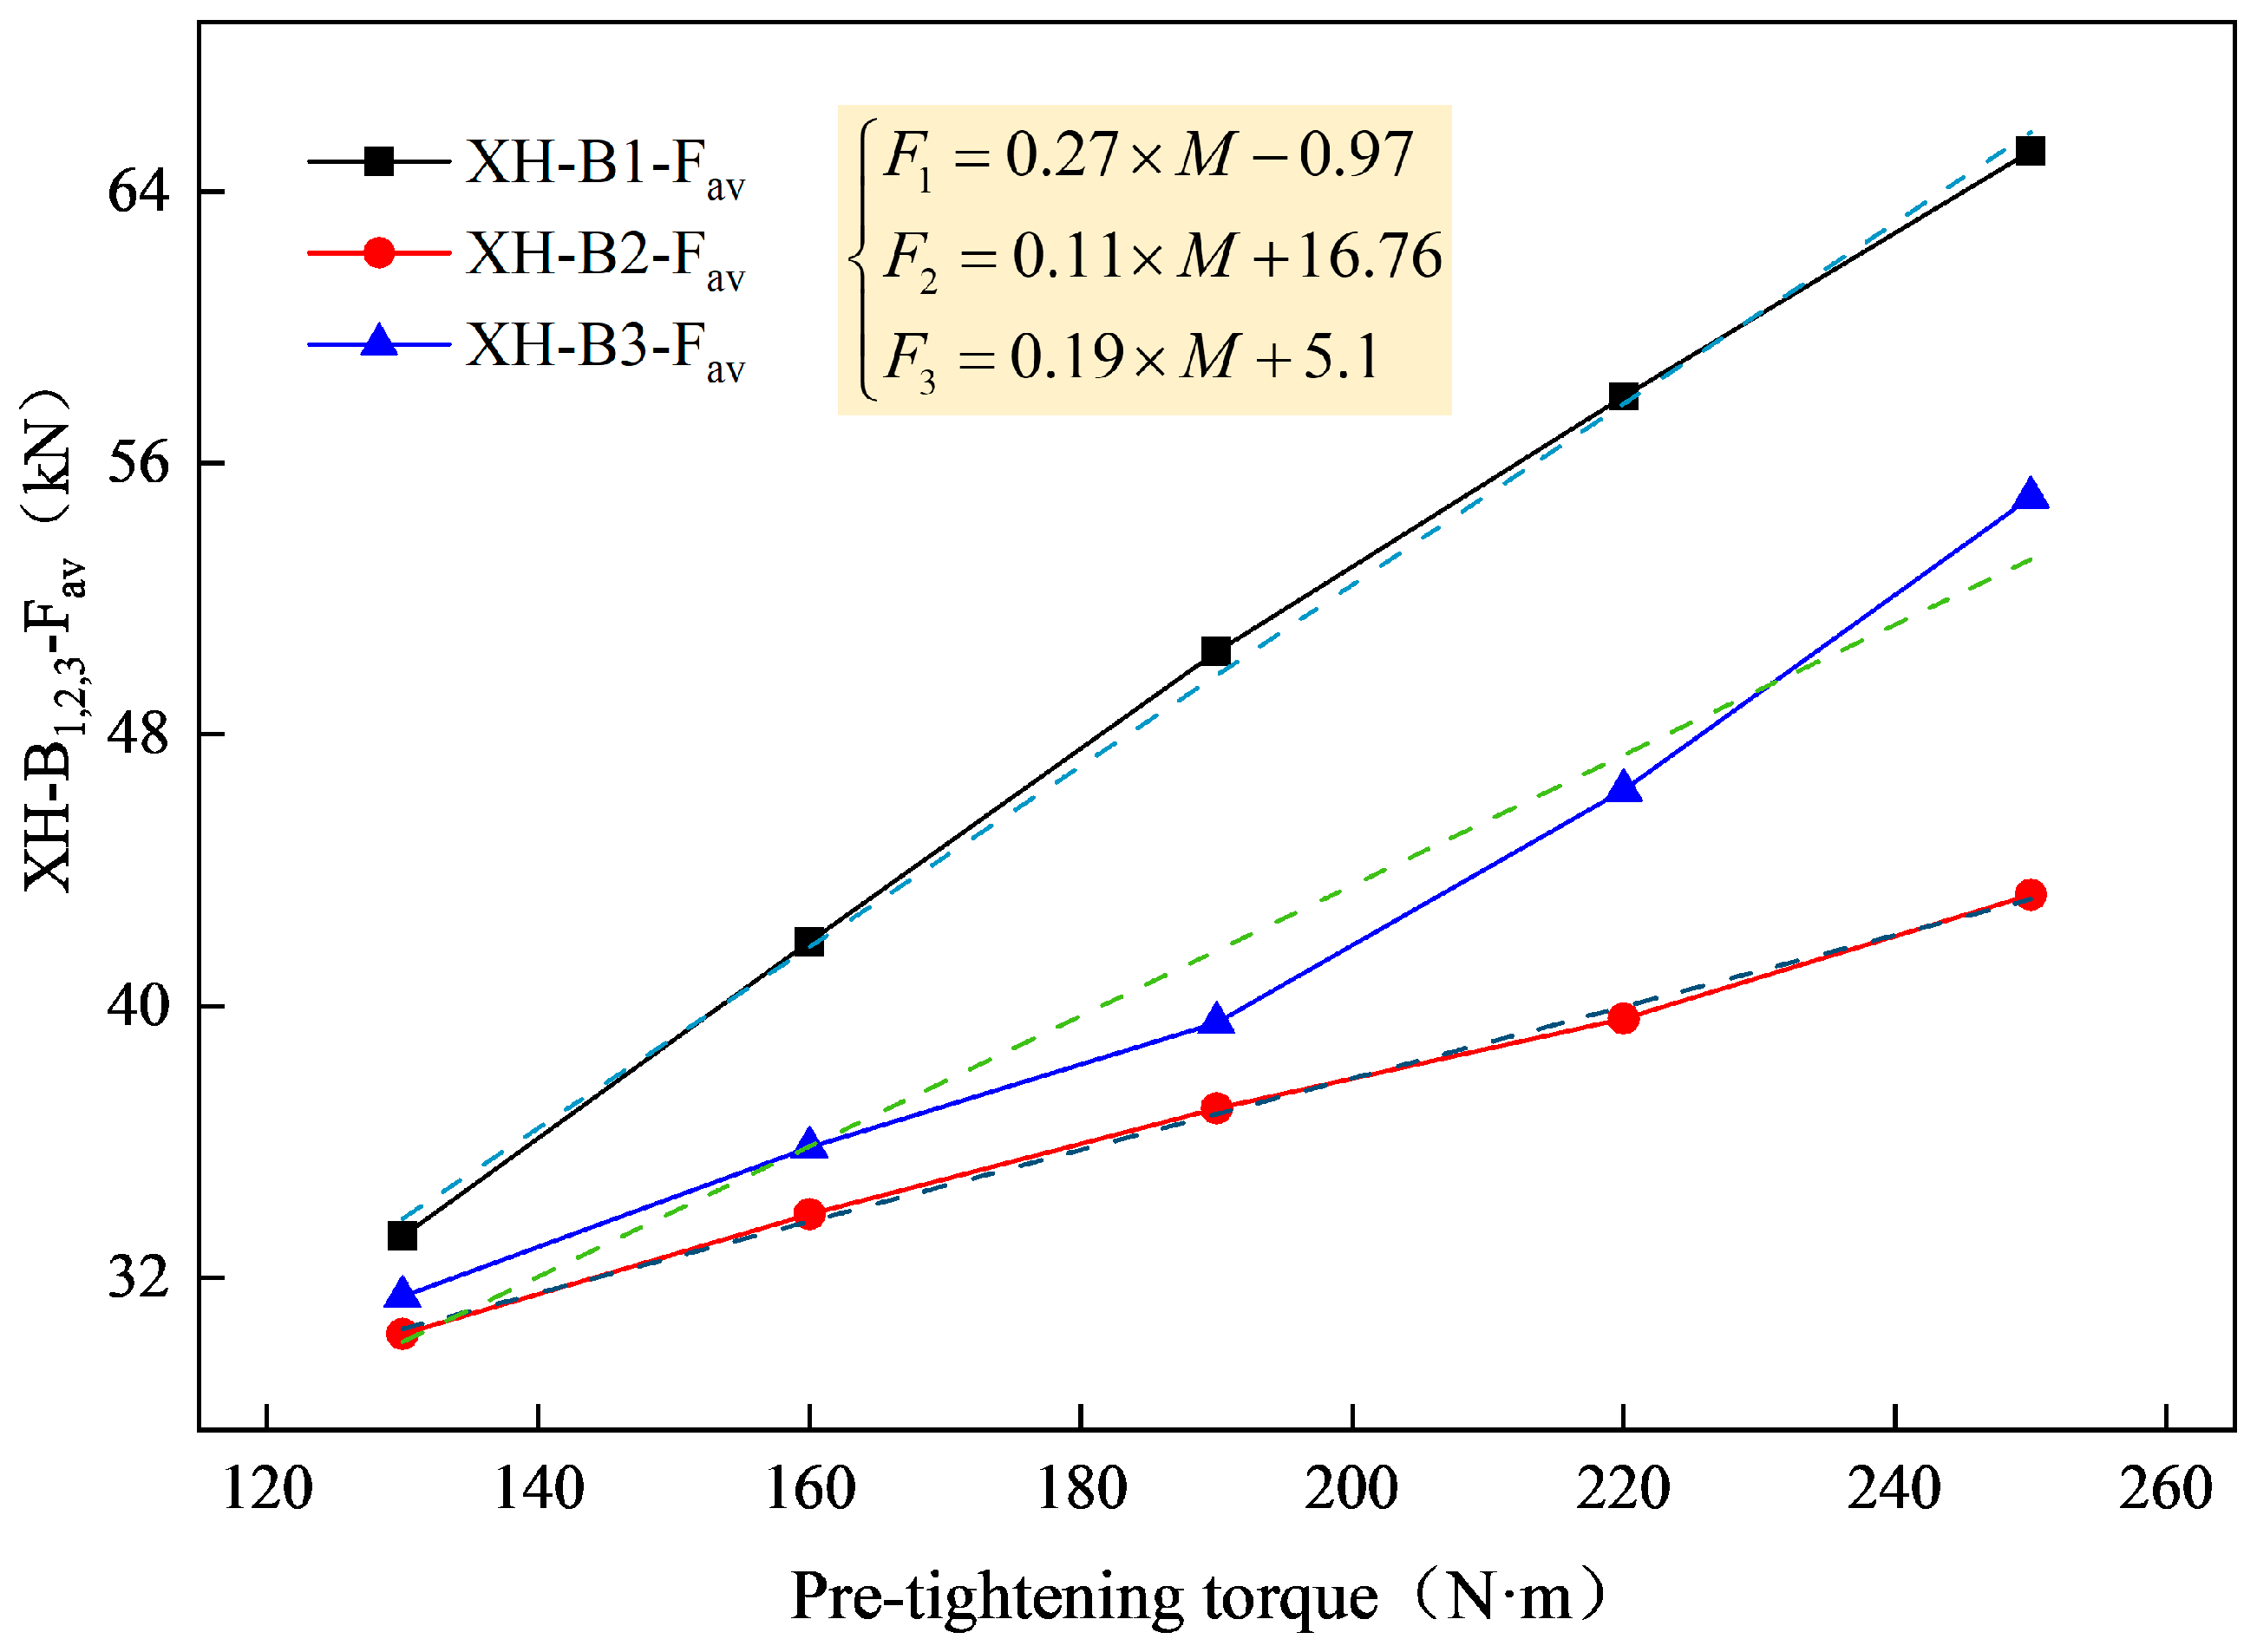
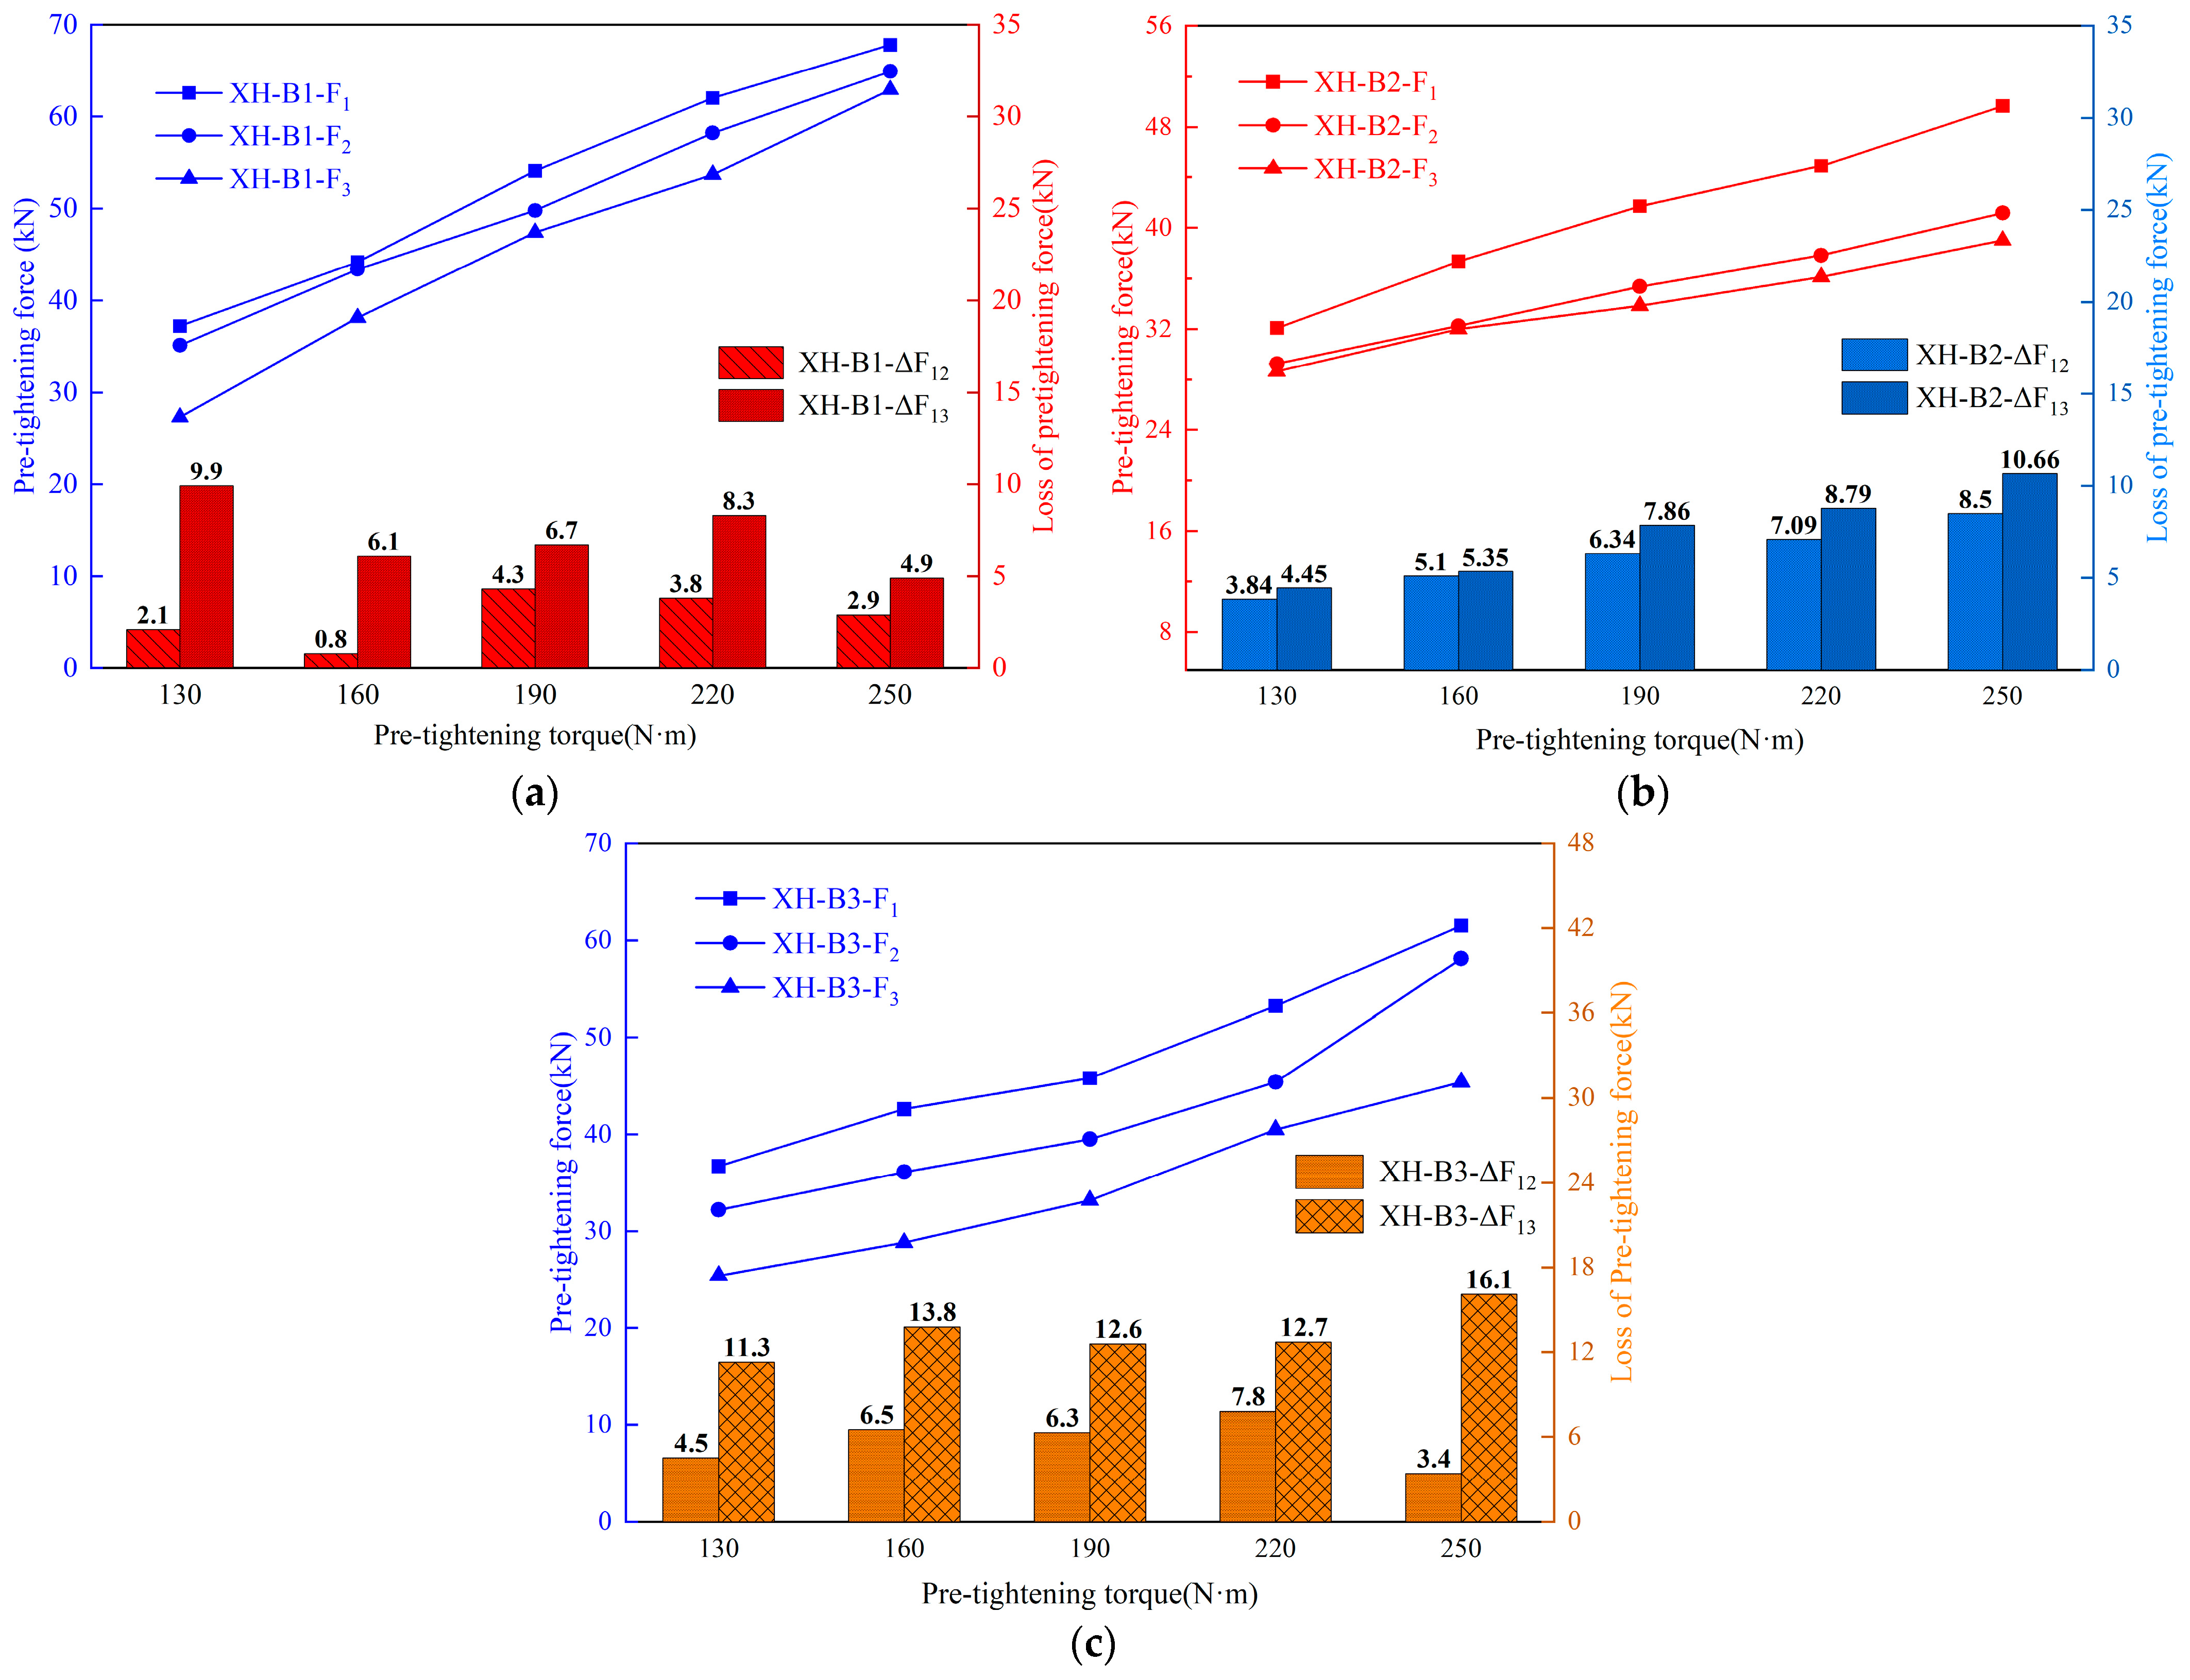
4.1. Relationship between Bolt Pre-Tightening Force and Bolt Pre-Tightening Torque

Figure 7 illustrates the variation curves of the average pre-tightening force for Bolts B1 to B3 as a function of changing pre-tightening torque. As demonstrated in Figure 7, a linear increase in the average pre-tightening force for all three bolts is observed with increasing pre-tightening torque. However, Bolt B2 exhibits relatively poorer linearity compared to Bolts B1 and B3. Under identical pre-tightening conditions, the average pre-tightening force for Bolts B1, B2, and B3 varies as follows: from 33.2 kN to 65.2 kN, 30.32 kN to 43.28 kN, and 31.43 kN to 55.0 kN, respectively, when the pre-tightening torque is increased from 130 N·m to 250 N·m. This indicates a significant variability in the efficiency of converting pre-tightening torque into pre-tightening force among different bolts.
The fitting curves in Figure 7 suggest a relationship between the average pre-tightening force of the bolt and the pre-tightening torque, which can be described by the following equation:
F = aM(x) + b
Here, F denotes the average pre-tightening force of the bolt, and M represents the pre-tightening torque. The coefficient a symbolizes the torque conversion coefficient, affected by factors such as the magnitude of the pre-tightening torque, the number of pre-tightening cycles, and friction reduction methods. The term b represents a constant, indicating the intercept of the fitting curve. The fitting results are consistent with the research conclusions of Chen and Hu et al. [23,24].
For Bolts B1, B2, and B3, the respective values of a are 0.27, 0.11, and 0.19, indicating that the torque conversion efficiencies of the bolts follow the order B1 > B3 > B2, with an average a value of 0.19. Referencing literature [25,26], the theoretical a value for a Φ22 mm × 2400 mm left screw-thread steel bolt is 0.26. This reveals that the actual torque conversion efficiency of the bolts in the Xiahuo Coal Mine is approximately 30% lower than the theoretical value.
The experimental findings revealed that Bolt B1 experienced no pre-tightening force loss, while anchor Bolts B2 and B3 showed significant pre-tightening force loss. This can be attributed to the high smoothness of the surrounding rock surface at the location of B1, allowing for a close fit of the tray against the rock surface. As a result, a minimal friction torque was generated by lateral compression between the supporting components, leading to a substantial reduction in friction during the pre-tightening process and thus minimal pre-tightening force loss for Bolt B1. In contrast, the surrounding rock at the locations of Bolts B2 and B3 exhibited poor flatness, resulting in an increased friction coefficient between the supporting components and a corresponding reduction in torque conversion efficiency.

4.2. Analysis of Loss Behavior of Bolt Pre-Tightening Force

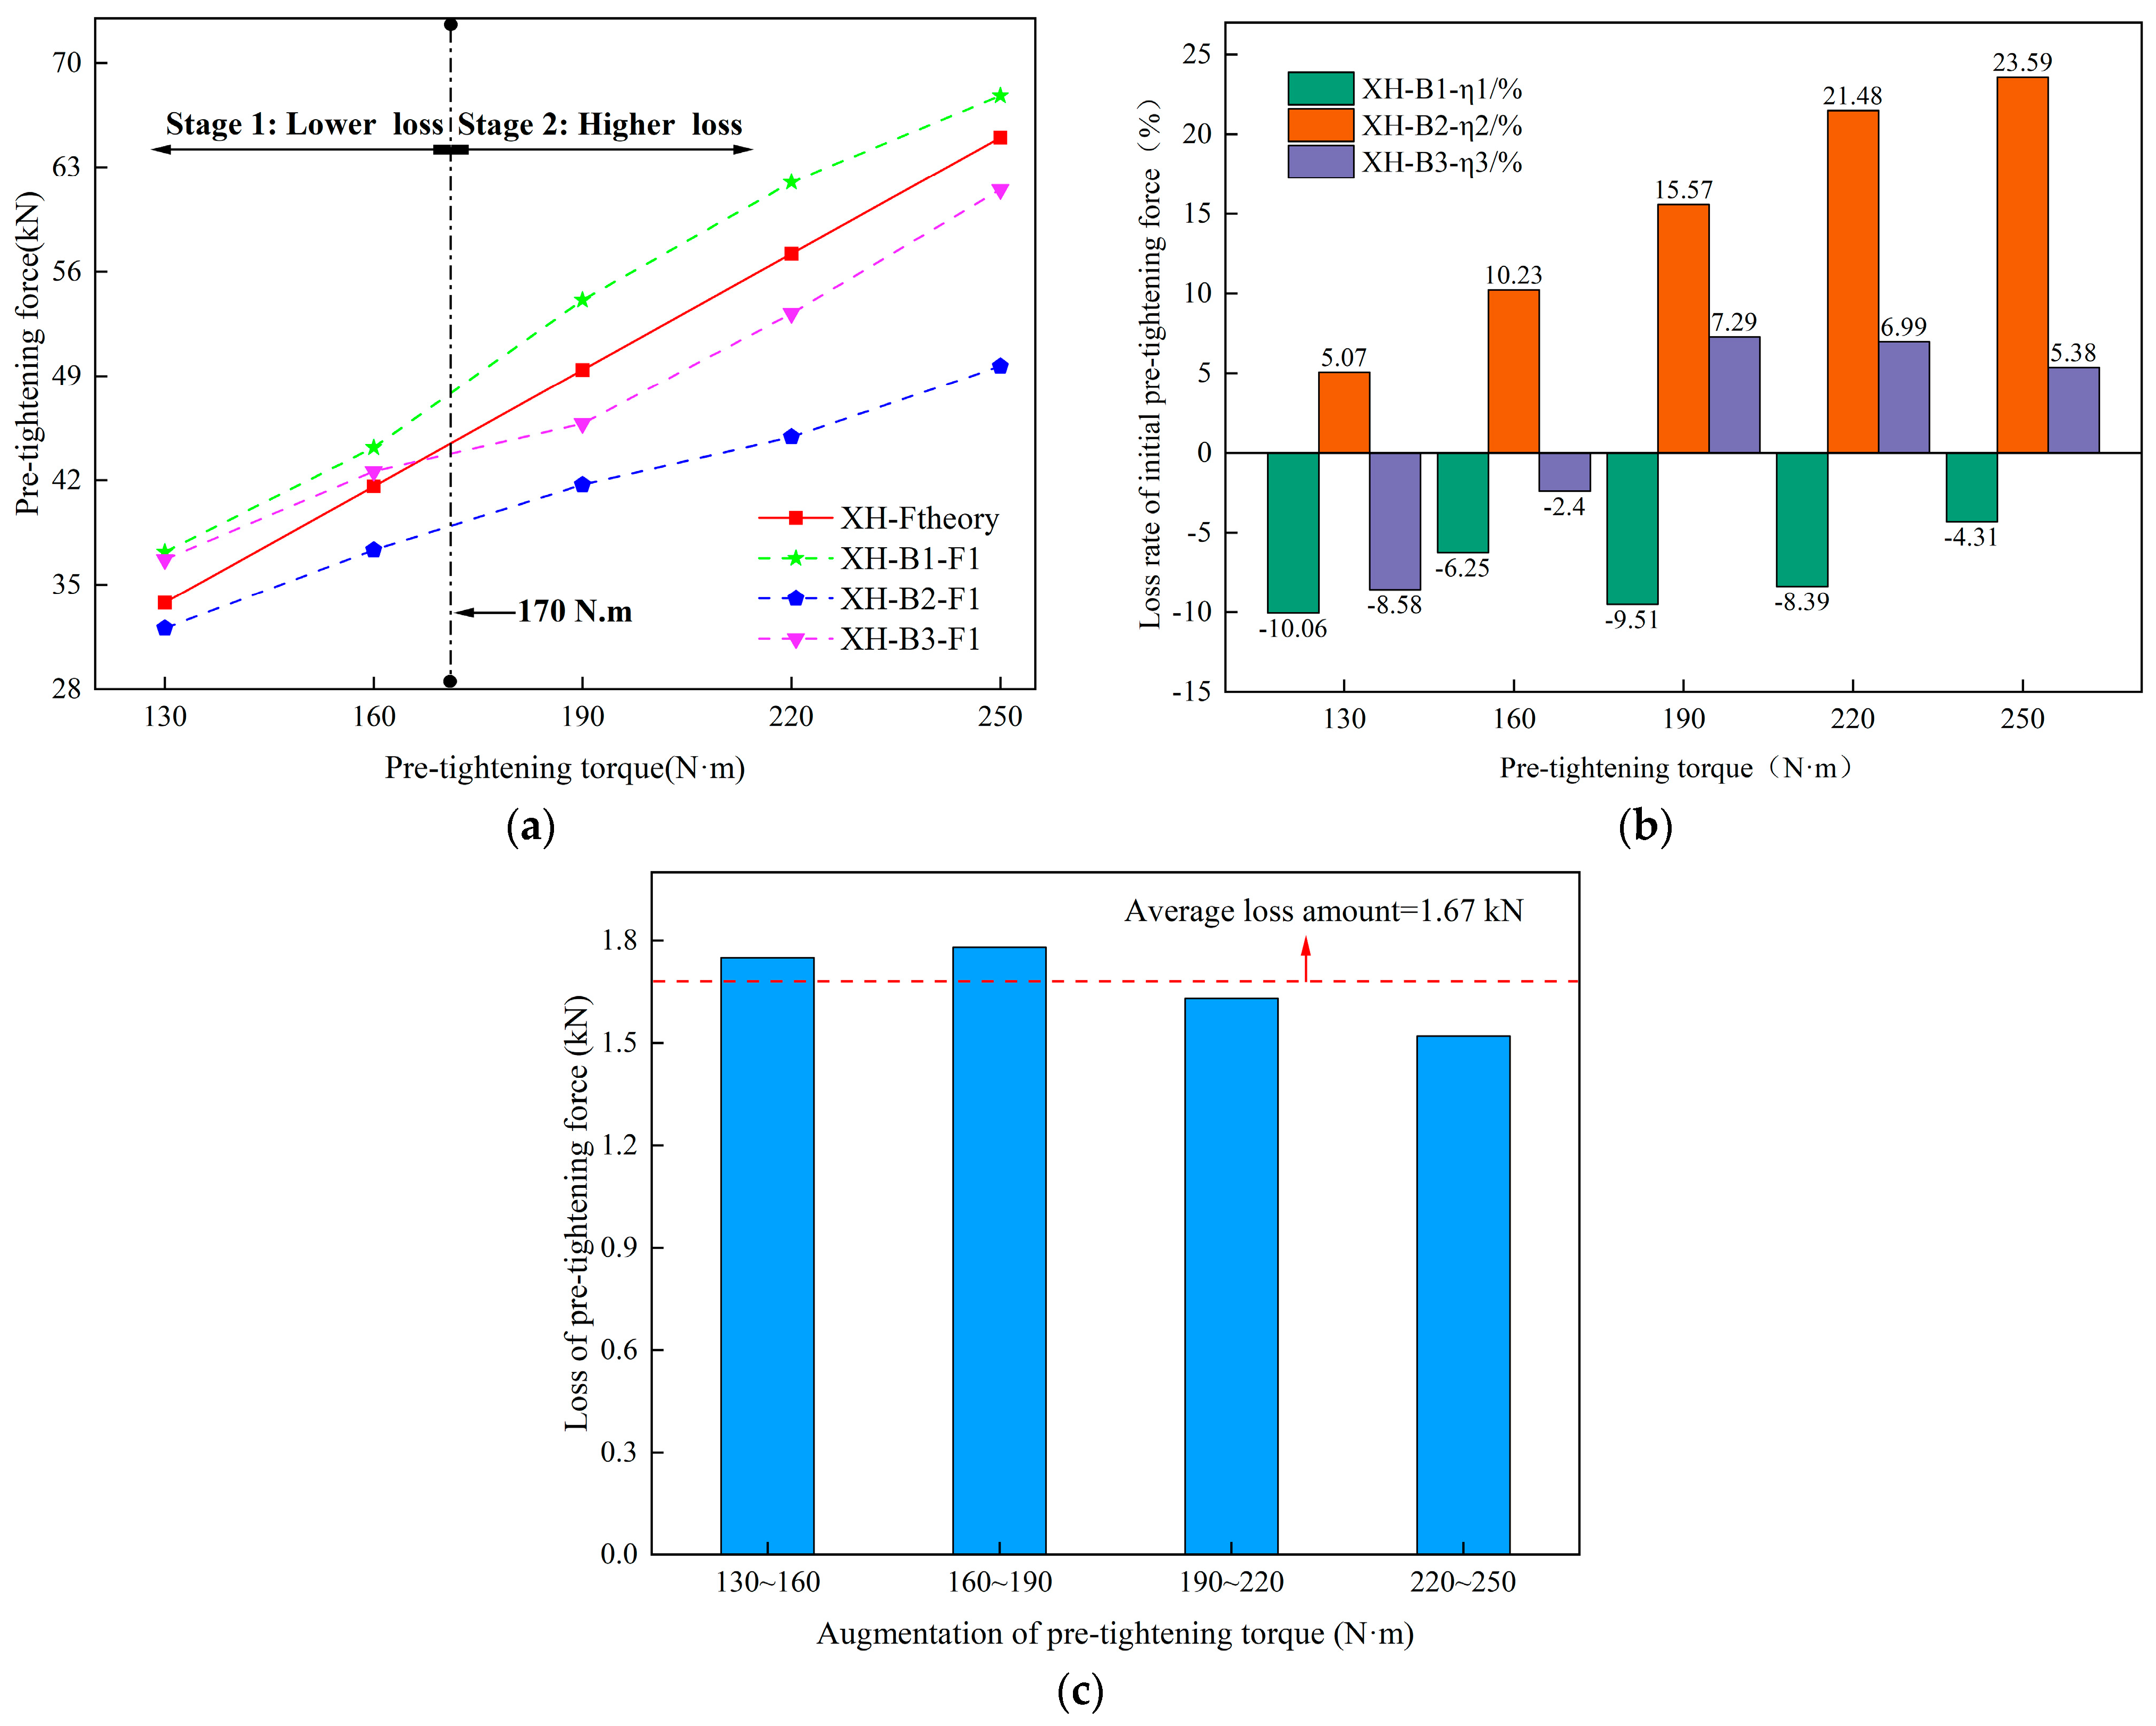
4.2.1. Characteristics of Initial Bolt Pre-Tightening Force Loss

Figure 8a presents a comparison diagram of the initial pre-tightening force loss (PTFL), displaying the initial pre-tightening force (F1) of the bolts alongside the theoretical pre-tightening force (Ftheory). The initial pre-tightening force loss rates, represented as η = (FtheoryF1)/Ftheory, under different pre-tightening torques are illustrated in Figure 8b. From Figure 8a and b, it is evident that the initial pre-tightening force can be categorized into two stages: a stage with a low pre-tightening force loss rate and a stage with a high pre-tightening force loss rate, with 170 N·m serving as the boundary. In the range of 130~170 N·m, the F1 values of the three bolts approximate Ftheory, resulting in initial PTFL values ranging from −3.4 kN to 4.26 kN and a maximum loss rate of 10.23%. At a higher pre-tightening torque of 190~250 N·m, the deviations between F1 values and Ftheory widen, with the initial PTFL values ranging from −4.8 kN to 15.34 kN and the maximum loss rate increasing to 23.59%. This suggests that the pre-tightening force loss rate escalates with the rise in pre-tightening torque. As shown in Figure 8c, for every 30 N·m increase in pre-tightening torque, the average PTFL of the bolts increases by 1.67 kN. In this study, the pre-tightening force loss coefficient is defined as k = ΔFav/ΔM, where k quantifies the impact of the pre-tightening torque level on PTFL. Using this formula, the pre-tightening force loss coefficient for the bolts in the 2308 return air roadway of Xiahuo Coal Mine is calculated to be 0.056.

4.2.2. Characteristics of Bolt Pre-Tightening Force Loss under Repeated Pre-Tightening

The dynamics of PTFL under repeated pre-tightening are depicted in Figure 9a–c, where the curves illustrate the variations in pre-tightening force, and the histograms represent the differences between F1 and F2F12 Δ F 12 indicating the PTFL from the first to the second pre-tightening) and between F1 and F3F13 Δ F 13 representing the PTFL from the second to the third pre-tightening) for each bolt.
As Figure 9 demonstrates, when the pre-tightening torque remains constant, the order of pre-tightening force for the three bolts is consistently F1 > F2 > F3. This pattern suggests that the pre-tightening force decreases with an increase in the number of pre-tightening cycles, thereby implying that repeated pre-tightening exacerbates the initial PTFL. The histogram data further reveal that the PTFL values for Bolts B2 and B3 are generally higher than those for Bolt B1, indicating that Bolts B2 and B3 experience a greater increase in initial PTFL due to repeated pre-tightening. Nonetheless, as the number of pre-tightening cycles increases, the rate of change in PTFL gradually diminishes, and the pre-tightening force tends to stabilize.

5. Discussion

This research underscores the critical role of several factors in the occurrence of PTFL, namely, the roughness of the surrounding rock, the number of pre-tightening cycles, and the level of pre-tightening torque. Based on the results obtained, the following discussion aims to identify the primary controlling factors and elucidate the underlying mechanism of PTFL.

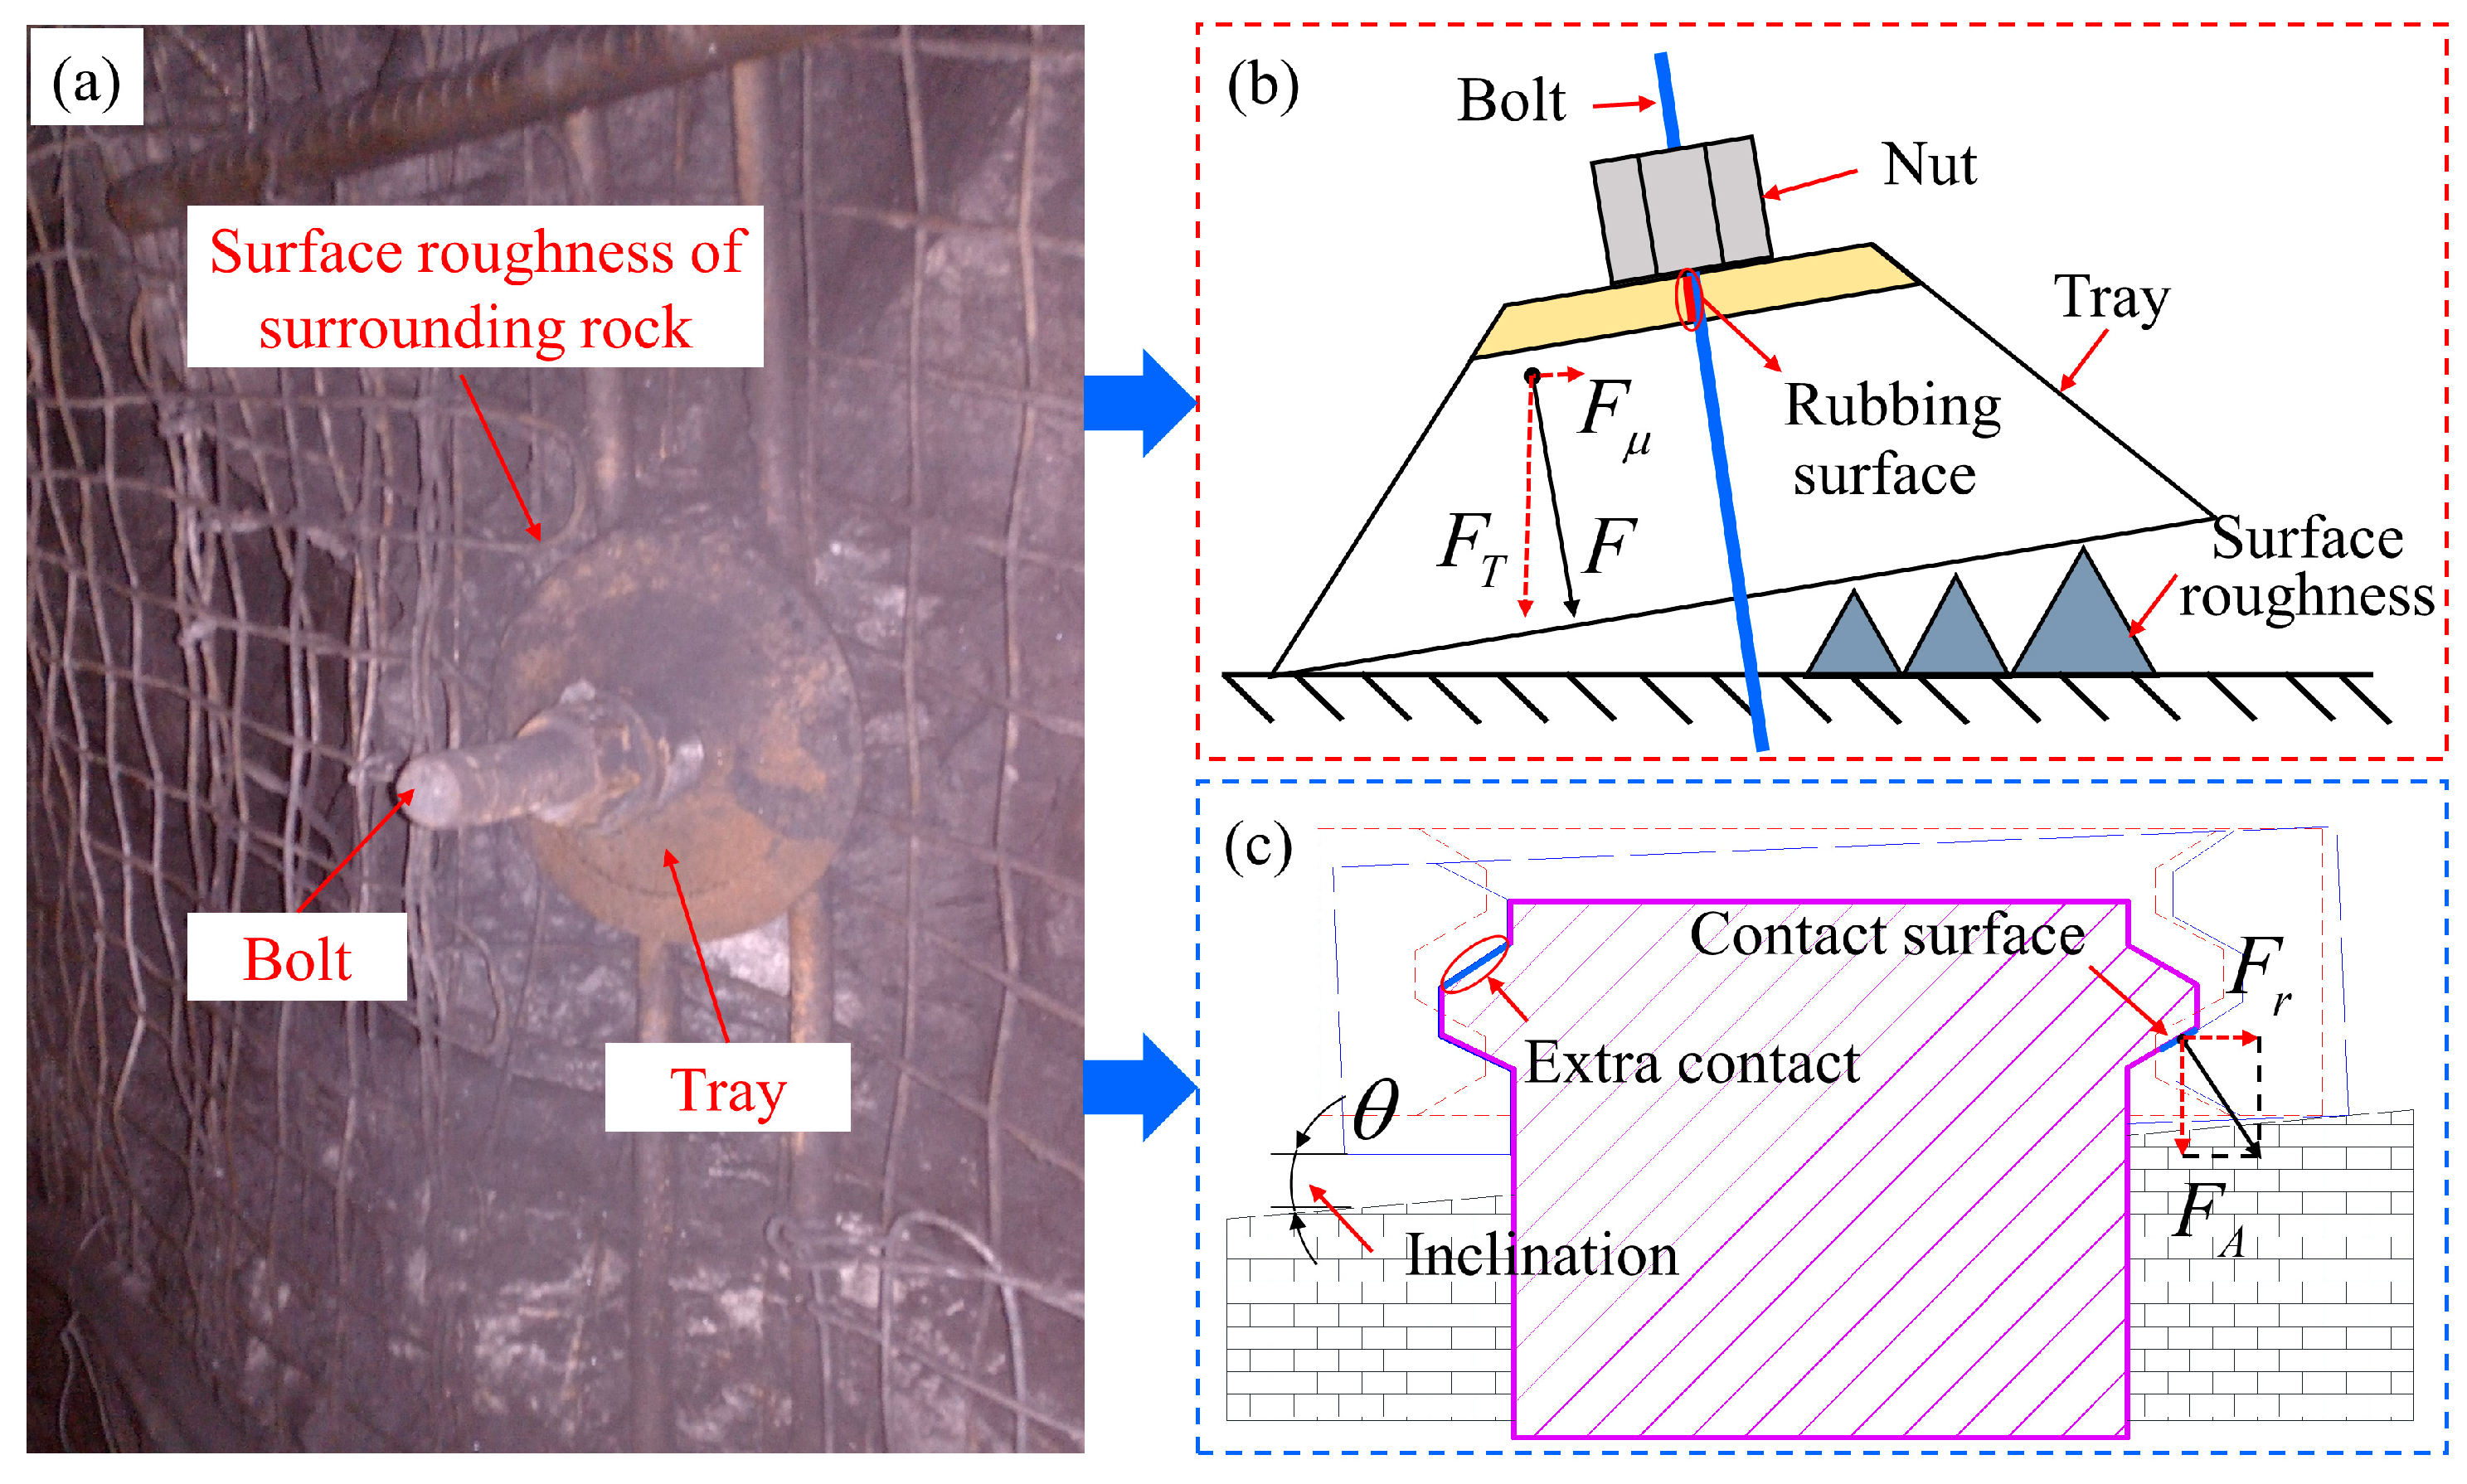
5.1. Influence of Roadway Surrounding Rock Roughness on Pre-Tightening Force Loss

The experimental conditions, including the bolt type, anchorage condition, and experimental operations, were kept consistent. However, it was observed that the bolts located at different positions along the roadway exhibited varying torque conversion efficiencies and pre-tightening force loss rates. This indicates that the surface roughness of the roadway plays a significant role in the occurrence of PTFL in bolts. Furthermore, it was noted that the roadway surface at Bolt B2 exhibited the highest roughness among the bolts. Correspondingly, it also displayed the highest pre-tightening force loss rate, reaching 23.6%. This observation further confirms the influence of surrounding rock conditions on the pre-tightening force of bolts.
Despite maintaining consistency in experimental conditions, including bolt type, anchorage condition, and operational procedures, notable variations in torque conversion efficiency and pre-tightening force loss rates were observed among the bolts positioned at different locations along the roadway. This variability highlights the significant impact of roadway surface roughness on the PTFL in bolts. Particularly, the roadway surface at the location of Bolt B2, which exhibited the highest roughness, correspondingly displayed the highest pre-tightening force loss rate of 23.6%. This finding further confirms the influence of surrounding rock conditions on bolt pre-tightening force.
The primary cause for this phenomenon, as observed in this experiment, is that uneven surfaces of the roadway surrounding rock prevent the plate from aligning parallel to the rock surface. This misalignment results in additional contact and lateral extrusion between the bolt and the self-aligning ball gasket, between the bolt and the plate, and be-tween the bolt and the nut thread (see Figure 10). Such interactions generate extra side pressure, leading to additional friction torque between the bolt and other supporting components, thereby contributing to the PTFL during bolt pre-tightening [27,28]. As the surface roughness of the roadway surrounding rock increases, the angle between the bolt and the supporting units enlarges, proportionally increasing the bending moment and additional friction torque of the bolt. Utilizing trigonometric functions, the maximum tilt angle between the tray and the bolt can be calculated. Given a bolt diameter of 22 mm and a tray center hole diameter of approximately 24 mm, the maximum tilt angle is estimated to be 9–10°. Research [29] indicates that with an applied torque of 70 N·m and a bolt inclination ranging from 2° to 4°, the resulting PTFL varies between 3.94% and 16.3%, aligning with the findings of this study.

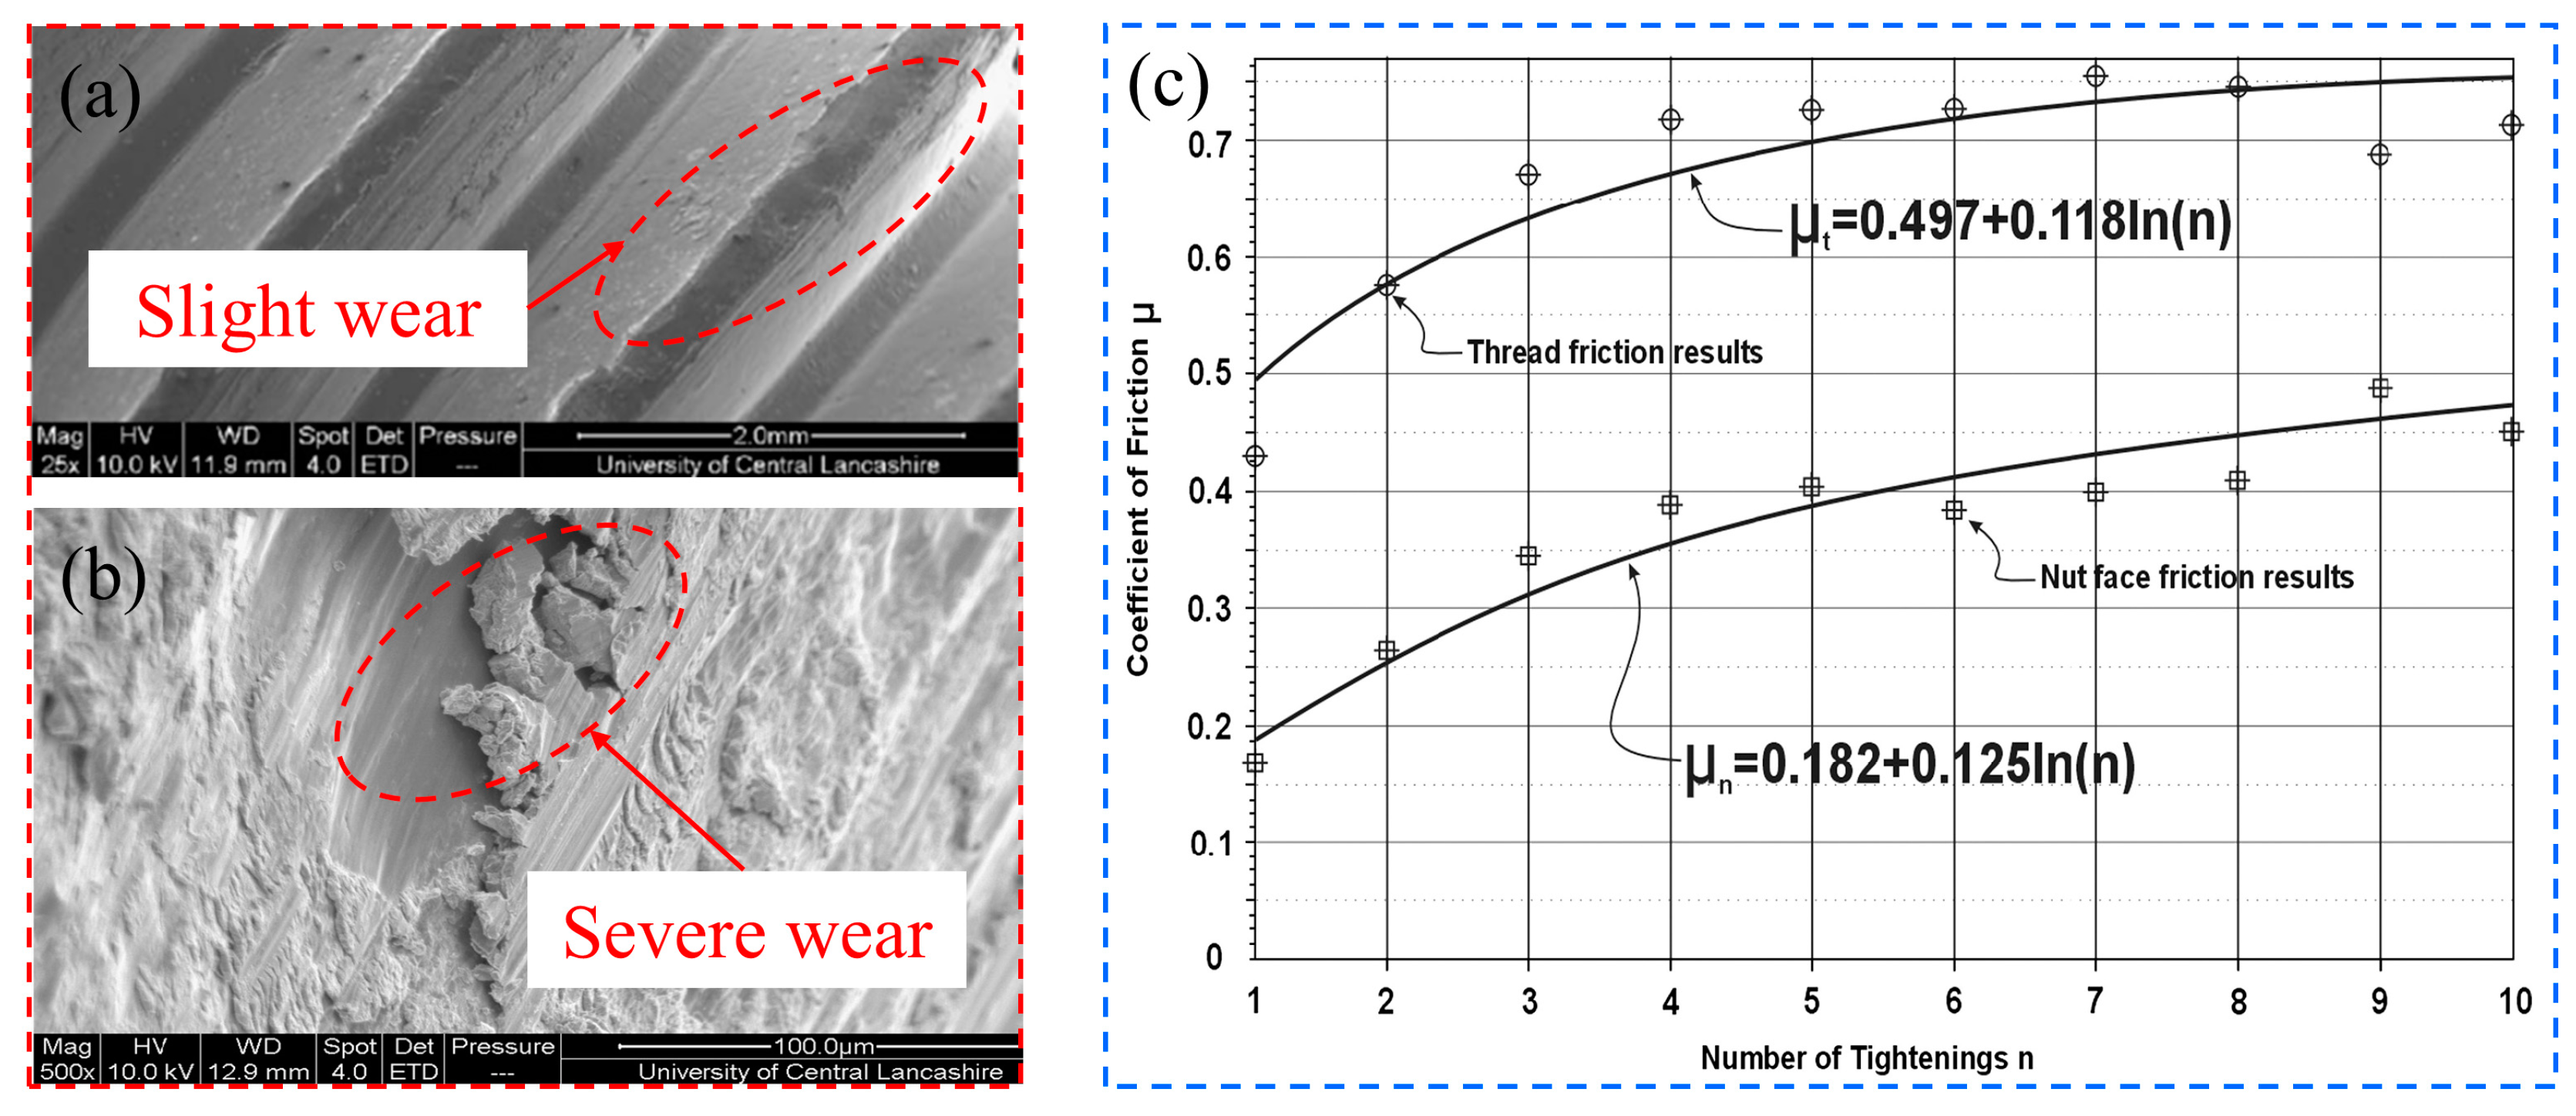
5.2. Influence of Tightening Times on Pre-Tightening Force Loss

In the Xiahuo Coal Mine, the theoretical and actual torque conversion coefficients for Bolts B1 to B3 are reported as 0.26 and 0.19, respectively. This discrepancy indicates a reduction in the pre-tightening torque conversion efficiency of approximately 30%. Prior research has identified the material specifications of supporting units and the friction between these units as key factors affecting torque conversion efficiency [30,31]. In this experiment, the omission of a friction-reducing gasket between the nut and the plate serves a dual purpose. Firstly, it eliminates the potential influence of gasket deformation on the results. Secondly, it increases the friction coefficient between the supporting units, leading to a decrease in the effective translation of pre-tightening torque into pre-tightening force, thereby elevating the initial PTFL.
Figure 11a illustrates the microscopic damage characteristics on the bolt surface after initial prestressing, revealing slight wear. In contrast, Figure 11b shows that the same material bolt, after undergoing five cycles of repeated pre-tightening, exhibits significant surface wear. This results in an increased friction coefficient between the supporting components, corroborating the variation trend depicted in Figure 11c. This figure demonstrates a logarithmic increase in the friction coefficient with each additional pre-tightening cycle.
The rise in the friction coefficient between the supporting units can be attributed to factors identified in previous studies [19,32]. Repeated screwing of the nut increases wear and roughness on the surfaces of both the bolt and the nut. Furthermore, the repeated pre-tightening process generates a higher amount of sloughed-off scrap iron due to friction between the supporting units. Additionally, the oxide layer on the surface of these units is compromised. Consequently, the friction coefficient between the bolt and nut thread increases by approximately 0.08, and the coefficient between the nut and the plate increases by about 0.1. However, as the number of pre-tightening cycles increases further, the degree of wear and damage between the supporting units approaches saturation, leading to a deceleration in the growth rate of the friction coefficient. This phenomenon is primarily responsible for the observed reduction in PTFL when the bolt undergoes repeated pre-tensioning.

5.3. Influence of Pre-Tightening Torque Level on Pre-Tightening Force Loss

Some researchers [33] have classified the range of low pre-tightening torque as being between 58 N·m and 190 N·m. Within this range, specifically from 130 N·m to 190 N·m, the maximum loss rate of bolt pre-tightening force is reported at 10.23%. In the high pre-tightening torque range of 190 N·m to 250 N·m, this loss rate escalates to 23.59%. These findings demonstrate that the loss rate of initial pre-tightening force escalates with an increase in pre-tightening torque, a trend that becomes more pronounced at higher torque levels. This phenomenon can be attributed to two primary factors. First, under high pre-tightening torque, the augmented friction between the nut and the plate leads to a reduced efficiency in torque conversion. Second, the bolt undergoes a tensile deformation of 1 mm to 2 mm due to the high pre-tightening force [34], increasing the PTFL as the bolt tension grows.
In conclusion, the principal cause of PTFL is the friction between the supporting components. Specifically, as the bolt applies pre-tightening torque through nut tightening, the friction between the nut and tray diminishes torque conversion efficiency. Additionally, under high pre-tightening torque conditions, the rock bolt is subject to relaxation deformation over time, which significantly contributes to the PTFL. Furthermore, when the surface roughness of the surrounding rock is suboptimal, the tray cannot be firmly installed against the rock surface. This misalignment results in lateral compression between the bolt, nut, and tray, generating additional friction torque and thereby exacerbating the PTFL.

6. Preventive Actions and Engineering Application

6.1. Method of Reducing Pre-Tightening Force Loss

(1) The PTFL of bolts is predominantly influenced by the friction between supporting units and the conditions of the roadway’s surrounding rock. To optimize the installation process and enhance the efficiency of pre-tightening torque conversion, it is recommended to install the plate as parallel to the surrounding rock surface as possible. This alignment minimizes the potential for inclined contact and subsequent generation of additional friction torque between the supporting units. Further efficiency can be achieved by incorporating a friction-reducing gasket with desirable plasticity and a low friction coefficient between the nut and the plate, reducing friction and thereby improving torque conversion. Additionally, the application of lubricating oil between the nut and bolt thread can significantly reduce friction, further enhancing the conversion efficiency of pre-tightening torque into pre-tightening force.
(2) Bolts subjected to continuous high-level pre-tightening force are prone to gradual tensile deformation. This deformation can lead to a deterioration in the proximity between the plate and the rock, impairing the effective transmission of anchoring force to the bolt. Moreover, pre-tightening force may diminish over time due to stress redistribution following the excavation of surrounding rock. To mitigate these effects, a second pre-tightening of the bolt during the initial support stage is recommended, ideally within 8 to 12 h after the first pre-tightening [35]. This timely intervention can help maintain the efficacy of the anchoring system.
(3) Maintaining an appropriate level of pre-tightening force is crucial for ensuring an effective load-bearing interaction between the bolt and the rock in the initial support stage. However, it is important to recognize that excessively high pre-tightening force can exacerbate the loss of pre-tightening force, necessitating a higher torque to achieve the desired force level. This increased demand may place additional strain on the material and strength of the bolt. To ensure safe and cost-effective roadway anchor support, it is essential to find a balance between the desired pre-tightening force and its potential loss, while also taking into account material costs and other factors. A well-considered approach to this balance can lead to optimal and efficient roadway anchor support that satisfies both safety and economic considerations.

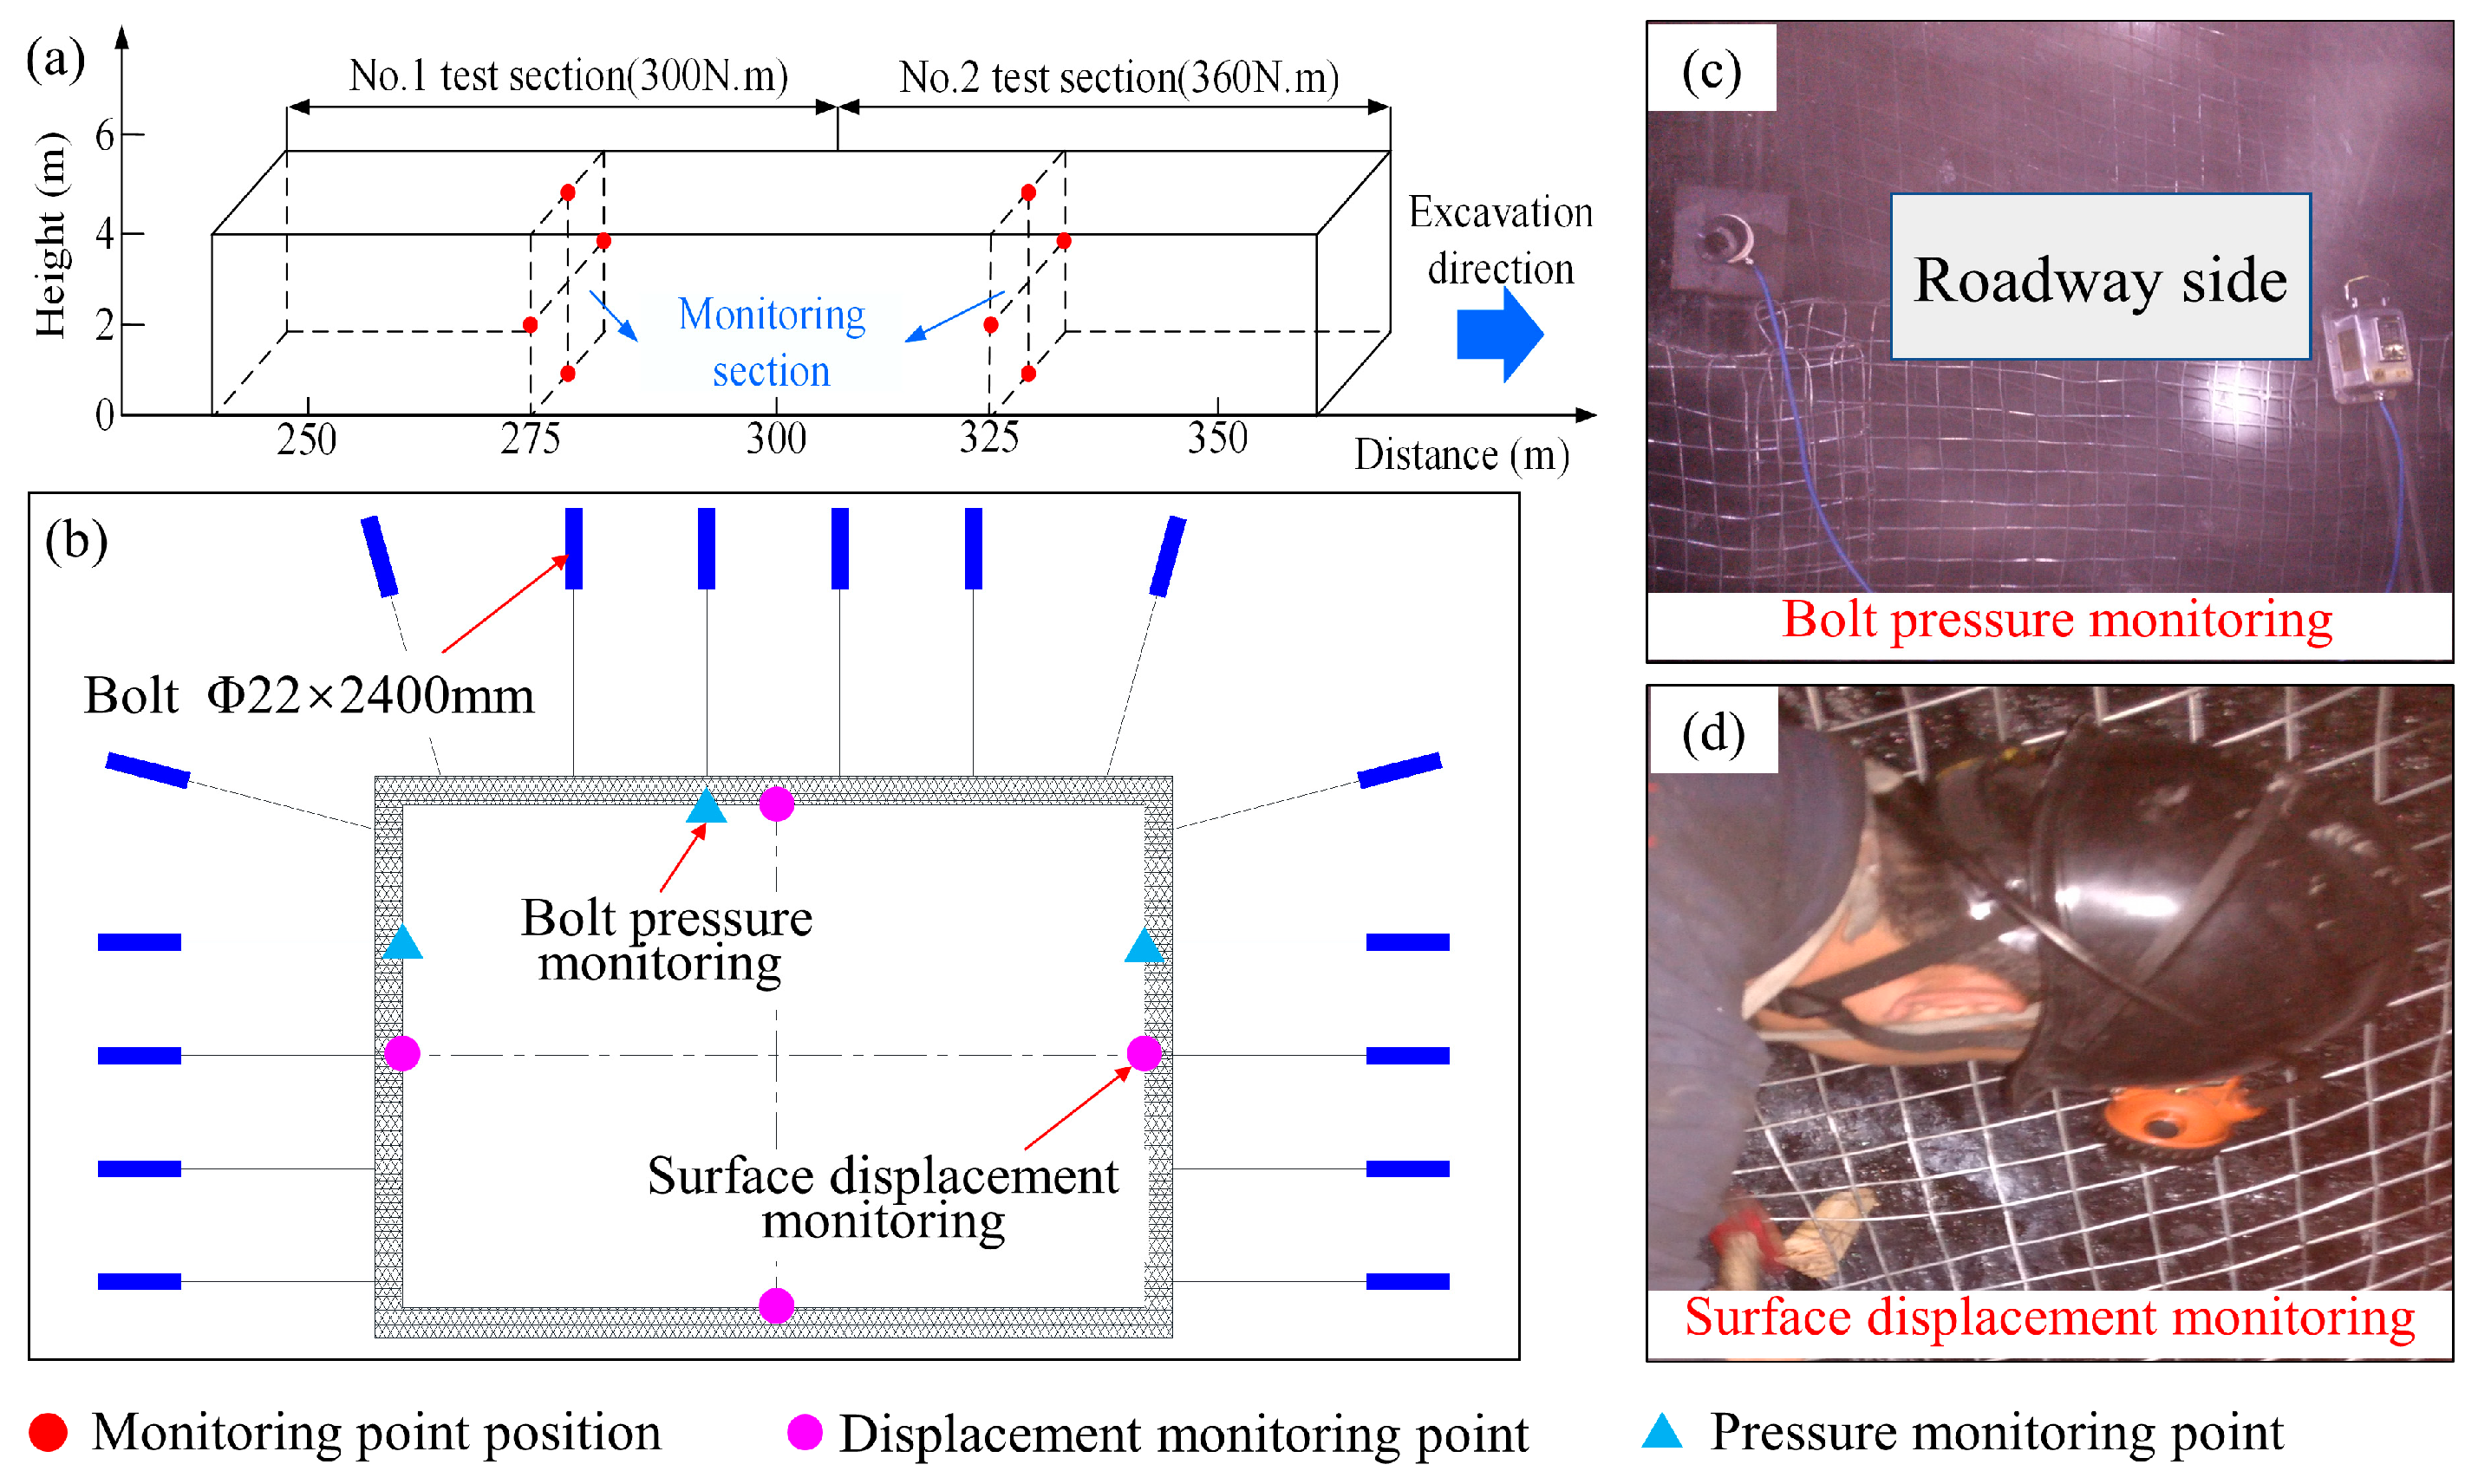
6.2. Engineering Application and Effect of Preventive Actions

In the realm of bolt support, the typically designed pre-tightening force is set between 60% and 80% of a bolt’s yield load. This study focuses on Φ22 mm × 2400 mm left-hand threaded steel anchor bolts, which exhibit a yield load of approximately 127 kN. Consequently, the pre-tightening force is designed at 78 kN, corresponding to a torque conversion coefficient of 0.26. For the specific case of the Xiahuo Coal Mine, the pre-tightening torque was initially calculated to be 300 N·m. However, given the actual torque conversion coefficient of about 0.19, an increase to 360 N·m is recommended to compensate for the potential loss in pre-tightening force, thereby ensuring the efficacy of bolt support.
To validate the proposed measures for mitigating pre-tightening force loss, a section spanning 250 m to 350 m within the 2308 return air roadway was selected for empirical verification. As delineated in Figure 12a, the selected section was divided into two 50 m-long test sections, i.e., the No. 1 test section and the No. 2 test section. During the pre-tightening of the bolts, no specific measures were implemented in the No. 1 test section, whereas in the No. 2 test section, pre-tightening measures were taken. For both sections, lubricating oil was applied to the nut and bolt. The surrounding rock at the anchorage hole was smoothed, and the bolts were pre-tightened once again after 12 h of the initial pre-tightening. Furthermore, as shown in Figure 12b, mine pressure monitoring stations were strategically positioned at the midpoint of each test section. As illustrated in Figure 12c and d, these stations played a crucial role in measuring the stress and surface displacement of the bolts, thereby facilitating an evaluation of the impact of pre-tightening techniques on the management of surrounding rock stability.

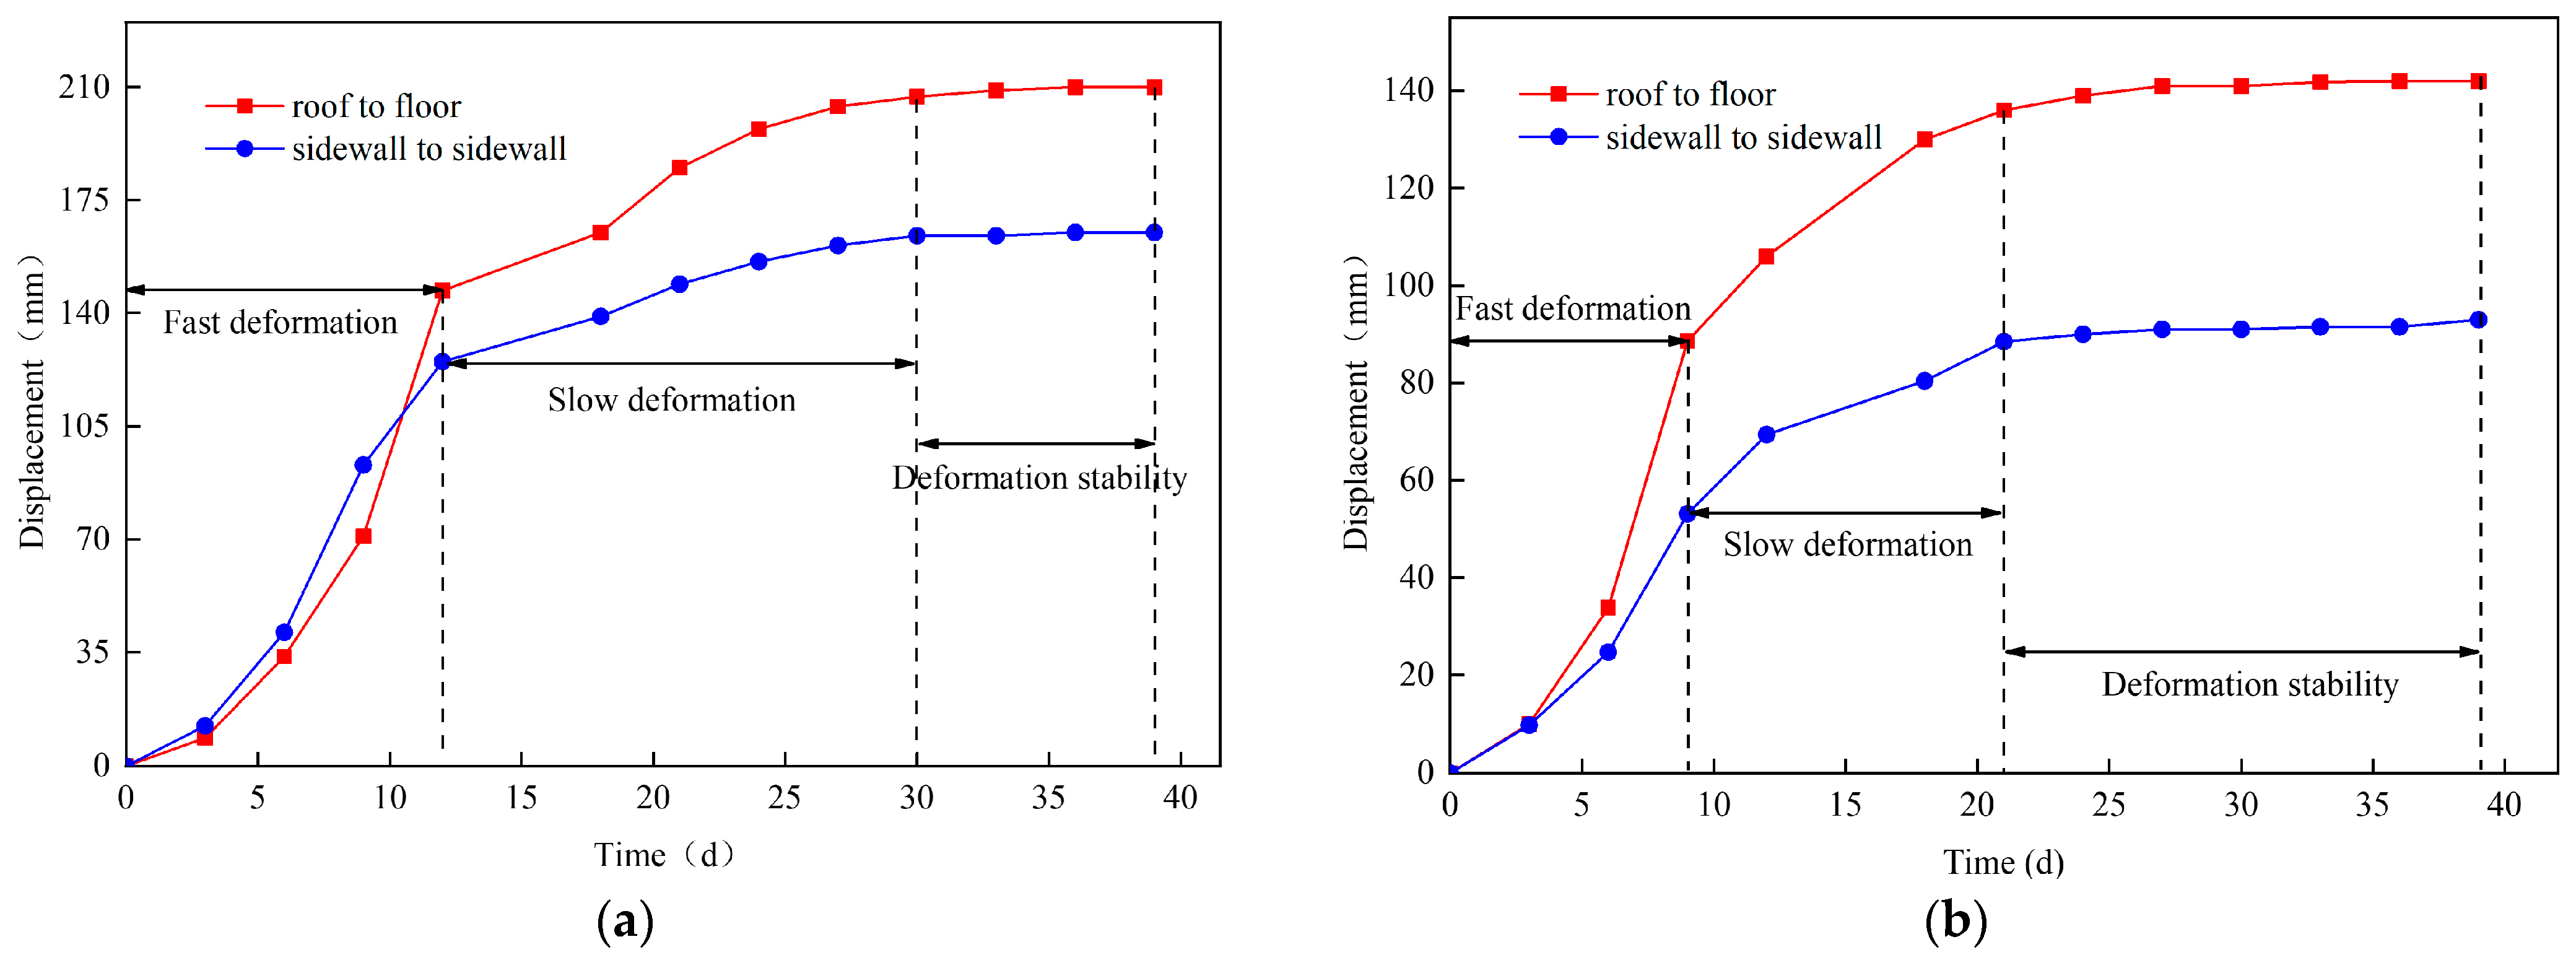
6.2.1. Monitoring Results of Roadway Displacement

In this investigation, roadway deformation is categorized into three stages based on deformation velocity. The rapid deformation stage is defined by velocities exceeding 8 mm/d, while velocities ranging from 2 mm/d to 8 mm/d are considered indicative of the slow deformation stage. Velocities below 2 mm/d signify the stable deformation stage. As shown in Figure 13a and b, roadway deformation patterns under various pre-tightening conditions display similar trends. Initially, following roadway excavation, rapid deformation of the surrounding rock is observed. As excavation progresses, this rate of deformation steadily decreases. A notable observation is the onset of deformation in the No. 1 test section on the 30th day post-excavation, compared to the 21st day in the No. 2 test section. This difference underscores the efficacy of pre-tightening measures in significantly reducing the pre-tightening force loss, accelerating the effectiveness of bolt support, moderating stress redistribution, and diminishing the self-stabilization duration of the roadway in its early excavation phase.
During the stable deformation stage, the roof-to-floor and side-to-side displacements in the No. 1 test section were 210 mm and 165 mm, respectively. In contrast, these displacements in the No. 2 test section were notably less at 142 mm and 93 mm. This translates to a reduction in roadway displacement by 32.4% and 43.6%, respectively, as a result of implementing pre-tightening measures.

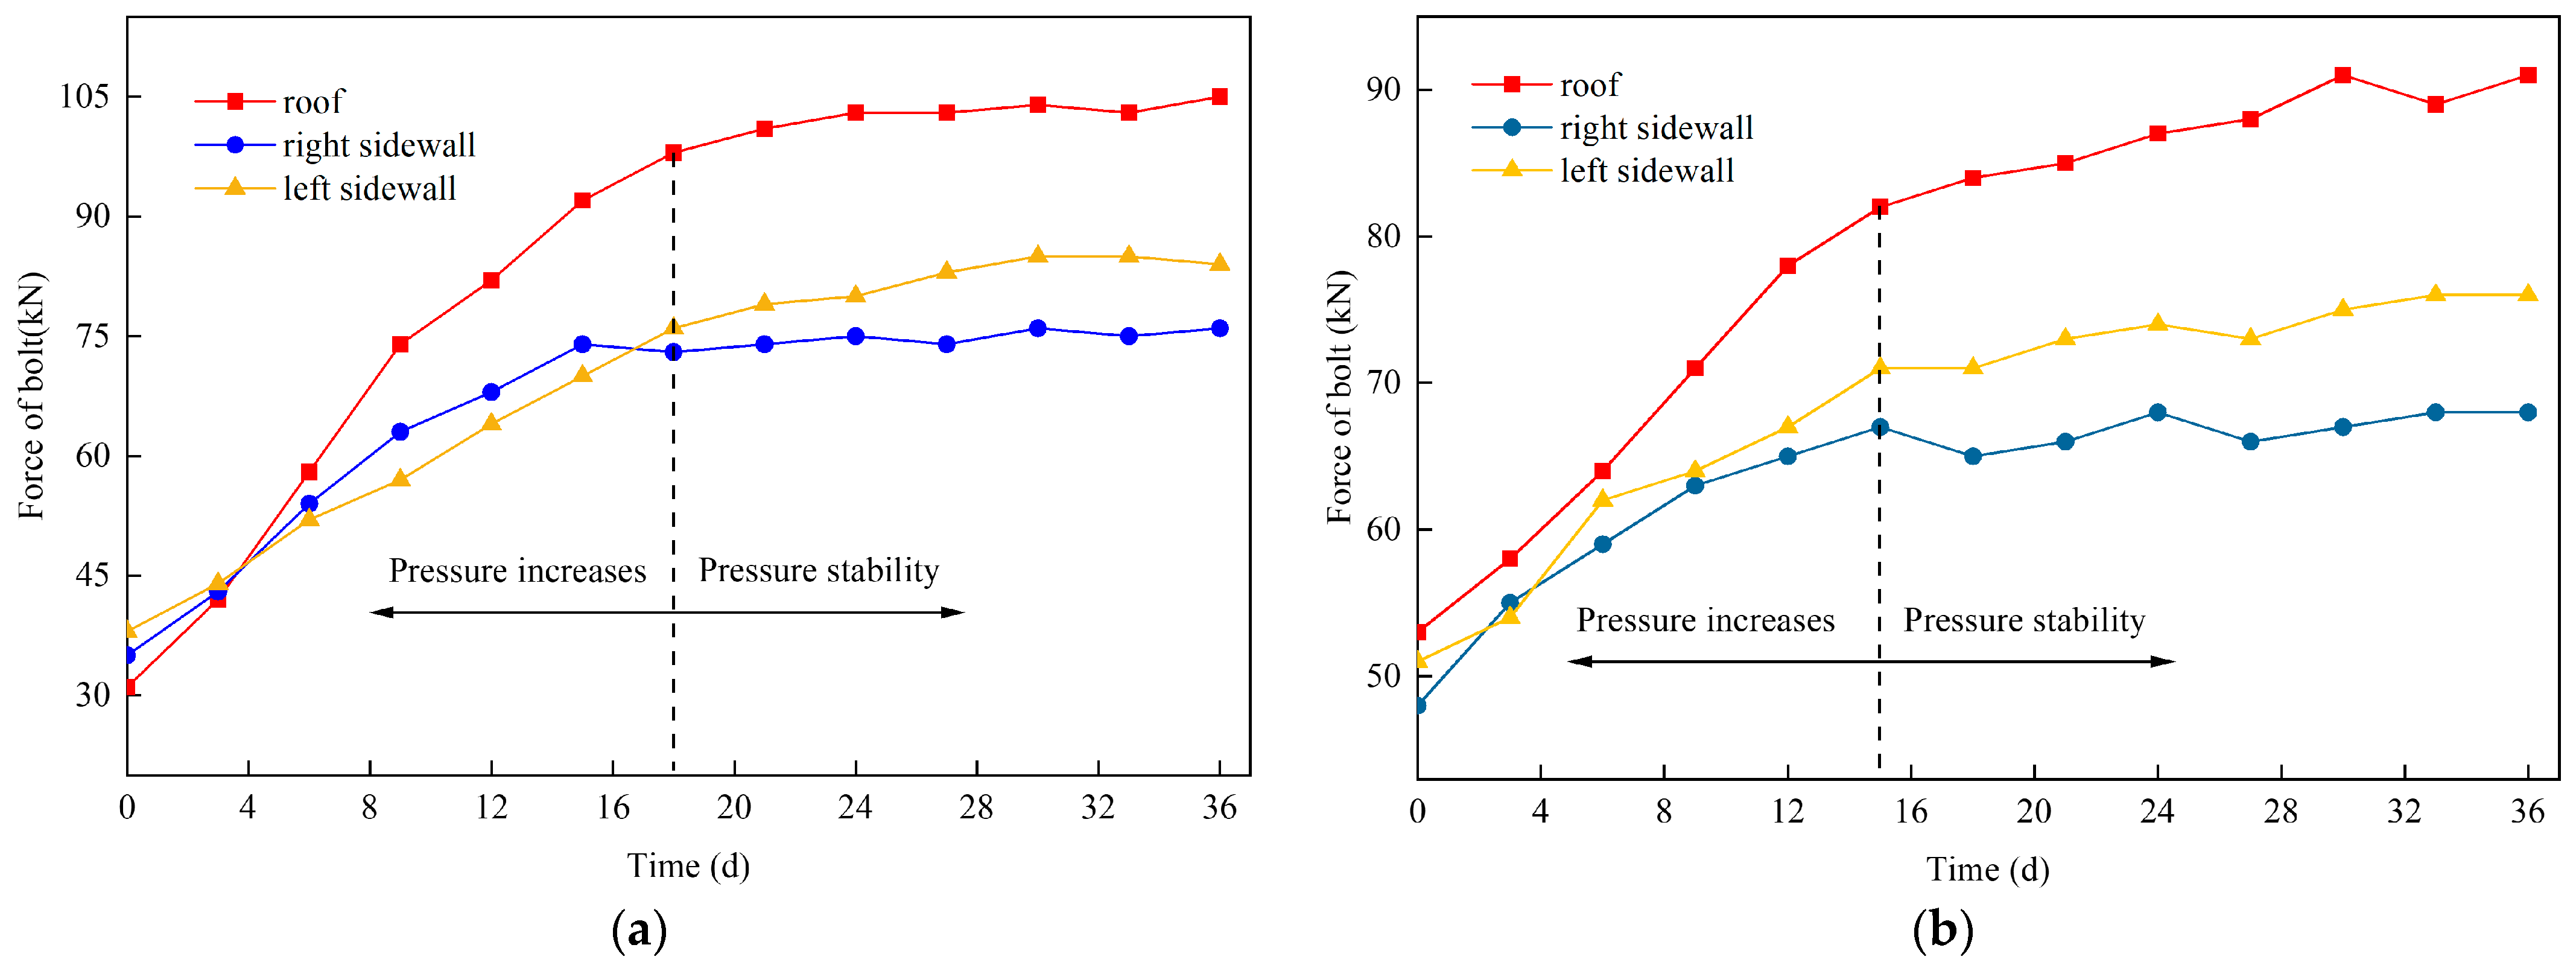
6.2.2. Monitoring Results of Bolt Stress

Figure 14a and b demonstrate that in the initial phase of support, the self-stabilizing durations for the pre-tightening force in the two test sections are 15 days and 10 days, respectively. This finding indicates that the application of pre-tightening measures effectively shortens the period required for the bolt to fully realize its support and load-bearing capabilities.
Table 2 presents data highlighting the significant influence of pre-tightening measures on the initial pre-tightening force of bolts installed in the roof and on the left and right sides of the roadway in the No. 2 test section. These forces show increases of 71.0%, 34.2%, and 37.1%, respectively. However, it is important to note that the final readings of these forces exhibit a decrease of 13.3%, 9.5%, and 10.5%, respectively. Therefore, the implementation of pre-tightening measures not only augments the initial pre-tightening force of the bolts but also contributes to a reduction in stress during the stable stage. This dual effect enables the bolts to provide effective support more promptly and helps in mitigating the convergence of the surrounding rock in the roadway during the early stages of support.

7. Conclusions

This study conducted a comprehensive field test to investigate the characteristics of bolt pre-tightening force loss (PTFL) and its impact on mine safety and efficiency. The primary findings from the Xiahuo Coal Mine are summarized as follows:
(1) The analysis reveals that under the complex tectonic stresses characteristic of the Xiahuo Coal Mine, the actual pre-tightening force of bolts amounts to only 51% to 77% of the theoretical value. This pronounced PTFL significantly undermines the collaborative load-bearing synergy between the bolts and rock, resulting in a marked deformation of the 2308 return air roadway.
(2) There exists a linear relationship between the pre-tightening force and torque of the bolt. However, it is observed that the efficiency of converting pre-tightening torque to pre-tightening force diminishes by approximately 30%, influenced by factors such as friction between support units, roadway surface roughness, the magnitude of pre-tightening force, and the frequency of tightening.
(3) The loss coefficient of pre-tightening force is defined as k = ΔFavM in this paper. It is found that with each 30 N·m increment in pre-tightening torque, the average PTFL for bolts increases by 1.67 kN. Furthermore, the maximum loss rates of the initial pre-tightening force at the low and high pre-tightening force stages are 10.23% and 23.59%, respectively.
(4) The primary factor contributing to PTFL is identified as the friction between supporting components. In the realm of roadway support engineering, several measures can be adopted to mitigate the PTFL. These include reducing friction, increasing pre-tightening torque, ensuring snug contact between the tray and surrounding rock, and minimizing the number of pre-tightening cycles. Such measures can effectively lessen the stress on bolts during the deformation stabilization stage of the roadway and expedite the process of stress redistribution in the surrounding rock.

Author Contributions

All the authors made contributions to this work. Conceptualization, X.S. and K.L.; methodology, X.S. and J.L.; software, X.S. and J.L.; formal analysis and investigation, K.G and Z.W.; resources, J.C. and Z.W.; data curation, K.L.; writing, X.S. and J.C.; funding acquisition, J.C., K.G. and X.S. All authors have read and agreed to the published version of the manuscript.

Funding

The work was supported by the Natural Science Foundation of China (Grant Numbers 52274102), the Postgraduate Research & Practice Innovation Program of Jiangsu Province (Grant Numbers 123623034) and the Fundamental Research Funds for the Central Universities (Grant Numbers 2018QNA24).

Data Availability Statement

Data are contained within the article.

Acknowledgments

The authors would like to thank the editors and the anonymous reviewers for their valuable comments and suggestions, which helped to improve the manuscript.

Conflicts of Interest

The authors declare no conflicts of interest.

References

  1. Kang, H.P.; Lin, J.; Fan, M.J. Investigation on support pattern of a coal mine roadway within soft rocks—A case study. Int. J. Coal Geol. 2015, 140, 31–40. [Google Scholar] [CrossRef]
  2. Stone, R. Design of primary ground support during roadway development using empirical databases. Int. J. Min. Sci. Technol. 2016, 26, 131–137. [Google Scholar] [CrossRef]
  3. Zhang, H.; Li, H.; Zhang, T.; Wang, Q.; Wang, W.; Wang, X.; Zhao, H.; Chang, T.; Guo, T. Research and engineering application of high pre-stressed resistance enhancement large deformation bolt in deep soft rock roadway. J. China Coal Soc. 2019, 44, 409–418. [Google Scholar] [CrossRef]
  4. Wang, T.; Tan, B.H.; Lu, G.T.; Liu, B.; Yang, D. Bolt Pretightening Force Measurement Based on Strain Distribution of Bolt Head Surface. J. Aerosp. Eng. 2020, 33, 04020034. [Google Scholar] [CrossRef]
  5. Wang, X.Y.; Zhang, W.D.; Wang, G.H.; Wu, B.W.; Li, J.C.; Zheng, Z. Study on high-energy strengthening anchor mechanism of tension pre-tightening bolt support system. Coal Sci. Technol. 2021, 49, 38–44. [Google Scholar] [CrossRef]
  6. Wang, F.T.; Shang, J.J.; Zhao, B.; Cao, Q.H.; Niu, T.C. Strengthened anchor cable support mechanism and its parameter optimization design for roadway’s dynamic pressure section. J. China Univ. Min. Technol. 2022, 51, 56–66. [Google Scholar] [CrossRef]
  7. Chang, J.C.; Xie, G.X. Research on response characteristics of bolt pretension on supporting effect of rock roadway in coal mine. J. Min. Saf. Eng. 2012, 29, 657–661. [Google Scholar]
  8. Wang, Q.; Pan, R.; Li, S.C.; Wang, H.T.; Jiang, B. The control effect of surrounding rock with different combinations of the bolt anchoring lengths and pre-tightening forces in underground engineering. Environ. Earth Sci. 2018, 77, 501. [Google Scholar] [CrossRef]
  9. Jing, H.W.; Wu, J.Y.; Yin, Q.; Wang, K. Deformation and failure characteristics of anchorage structure of surrounding rock in deep roadway. Int. J. Min. Sci. Technol. 2020, 30, 593–604. [Google Scholar] [CrossRef]
  10. Yang, H.; Han, C.; Zhang, N.; Pan, D.; Xie, Z. Research and Application of Low Density Roof Support Technology of Rapid Excavation for Coal Roadway. Geotech. Geol. Eng. 2020, 38, 389–401. [Google Scholar] [CrossRef]
  11. Zheng, X.G.; Zhang, N.; Hong, H.; Feng, X.W.; Liu, N.; Hua, J.B. Relation of Bolt’s Pre-tightening Force and Anchoring Force in Deep Mines. Disaster Adv. 2013, 6, 108–115. [Google Scholar]
  12. Wang, Q.; Wang, H.; Pan, R.; Li, S.; He, M.; Jiang, B.; Qin, Q.; Zhang, C.; Xu, Y. Mechanical Effect Analysis and Comparative Site Tests on Surrounding Rock with Different Bolt Anchoring Lengths and Pre-tightening Forces. Geotech. Geol. Eng. 2019, 37, 1195–1209. [Google Scholar] [CrossRef]
  13. Li, Z.; Wang, J.; Ning, J.G.; Qiu, P.Q.; Yang, S.H.; Shen, Z. Experimental research on influence of pre-tension on dynamic load impact resistance of anchorage body. J. China Univ. Min. Technol. 2021, 50, 459–468. [Google Scholar] [CrossRef]
  14. Wang, Z.Y.; Jiang, P.F.; Meng, X.F.; Zhang, Z.T. Numerical study of support effectiveness and mechanism of pre-stressed bolts. J. Min. Strat. Control Eng. 2022, 4, 56–66. [Google Scholar] [CrossRef]
  15. Wu, D.Y.; Li, N.Y.; Zhou, S. Thickness and Strength Analysis of Prestressed Anchor (Cable) Compression Arch Based on Safe Co-Mining of Deep Coal and Gas. Sustainability 2023, 15, 10716. [Google Scholar] [CrossRef]
  16. Lin, J.; Kang, H.P. Cause analysis of pre-tightening loss of anchor cable and settling approach. Coal Min. Technol. 2008, 13, 6–8. [Google Scholar]
  17. Tian, Y.; Qian, H.; Cao, Z.F.; Zhang, D.H.; Jiang, D. Identification of Pre-Tightening Torque Dependent Parameters for Empirical Modeling of Bolted Joints. Appl. Sci. 2021, 11, 9134. [Google Scholar] [CrossRef]
  18. Liu, J.; Guo, T.; Wei, Y.; Wang, L.B.; Zou, X.X. Investigation of the effect of pre-tightening forces on bolted connection for FRP-steel joints. Case Stud. Constr. Mater. 2023, 19, e02348. [Google Scholar] [CrossRef]
  19. Liu, Z.F.; Zheng, M.P.; Yan, X.; Zhao, Y.S.; Cheng, Q.; Yang, C.B. Changing behavior of friction coefficient for high strength bolts during repeated tightening. Tribol. Int. 2020, 151, 106486. [Google Scholar] [CrossRef]
  20. Zheng, M.; Liu, Z.; Yan, X.; Niu, N.; Zhang, T.; Li, Y. Initial losing behavior of pre-tightening force for threaded fastener during repeated tightening. Eng. Fail. Anal. 2022, 134, 106021. [Google Scholar] [CrossRef]
  21. Yu, Q.M.; Zhou, H.L.; Wang, L.B. Finite element analysis of relationship between tightening torque and initial load of bolted connections. Adv. Mech. Eng. 2015, 7, 1687814015588477. [Google Scholar] [CrossRef]
  22. Nassar, S.A.; Ganeshmurthy, S.; Ranganathan, R.M.; Barber, G.C. Effect of tightening speed on the torque-tension and wear pattern in bolted connections. J. Press. Vessel. Technol. Trans. ASME 2007, 129, 426–440. [Google Scholar] [CrossRef]
  23. Hu, J.; Zhang, K.; Cheng, H.; Qi, Z. Mechanism of bolt pretightening and preload relaxation in composite interference-fit joints under thermal effects. J. Compos. Mater. 2020, 54, 4929–4946. [Google Scholar] [CrossRef]
  24. Chen, W.; Wu, Z.; Zhu, Z.H.; Chen, W.Y.; Wang, W.D.; Zeng, Z.P. Pull out and pre-tightening force tests for plastic dowel of the railway sleeper considering the influence of installing torque and frost force. Constr. Build. Mater. 2021, 267, 120948. [Google Scholar] [CrossRef]
  25. Wang, C.; Du, Z.S.; Li, Z.B. Calculation and prediction of initial support pressure in bolt support. J. China Coal Soc. 2012, 37, 1982–1986. [Google Scholar] [CrossRef]
  26. Huang, S.; Jin, X.; Wang, Z.F.; Zhang, Z.J.; Xiao, M.Z.; Cui, C. A study of the relationship between pre-tightening force and torque in precision instrument assembly. In Civil, Architecture and Environmental Engineering, Proceedings of the International Conference on Civil, Architecture and Environmental Engineering (ICCAE), Taipei, Taiwan, 4-6 November 2016; Kao, J., Sung, W.P., Eds.; VOLS 1 AND 2; CRC: London, UK, 2017; pp. 985–990. [Google Scholar]
  27. Mouda, M.; Nabhani, M.; El Khlifi, M. Surface roughness effects on non-Newtonian MHD non-parallel squeeze film bearing. Ind. Lubr. Tribol. 2021, 73, 45–51. [Google Scholar] [CrossRef]
  28. Tan, L.; Wang, C.; Liu, Y.; Sun, W.; Zhang, W. Study on hysteresis and threaded fitting behavior of bolted joint with non-parallel bearing surface. Mech. Syst. Signal Pr. 2022, 168, 108655. [Google Scholar] [CrossRef]
  29. Chen, D.; Ma, Y.; Hou, B.; Liu, R.; Zhang, W. Tightening behavior of bolted joint with non-parallel bearing surface. Int. J. Mech. Sci. 2019, 153–154, 240–253. [Google Scholar] [CrossRef]
  30. Croccolo, D.; De Agostinis, M.; Vincenzi, N. Influence of tightening procedures and lubrication conditions on titanium screw joints for lightweight applications. Tribol. Int. 2012, 55, 68–76. [Google Scholar] [CrossRef]
  31. Otsu, T.; Komatsu, K.; Hashimura, S.; Imado, K. Shear properties under the starved condition of polyisobutylene lubricant for use in screw tightening-effect of operating condition on lubrication properties. Tribol. Int. 2018, 122, 133–142. [Google Scholar] [CrossRef]
  32. Eccles, W.; Sherrington, I.; Arnell, R.D. Frictional changes during repeated tightening of zinc plated threaded fasteners. Tribol. Int. 2010, 43, 700–707. [Google Scholar] [CrossRef]
  33. Kang, H.P.; Jiang, T.M.; Gao, F.Q. Effect of pretensioned stress to rock bolting. J. China Coal Soc. 2007, 7, 680–685. [Google Scholar]
  34. Zhou, Y.; Zhu, Y.P.; Ren, Y.Z. Anchor deformation of flexible supporting system with prestressed anchors. China Railw. Sci. 2015, 36, 58–65. [Google Scholar]
  35. Mei, X.; Chen, G.; Liu, H.Y. Experimental study on high strength bolt pre-tightening force of friction energy dissipation device. In Proceedings of the First International Conference on Information Sciences, Machinery, Materials and Energy (ICISMME 2015), Chongqing, China, 11–13 April 2015; Ching, X., Dvorik, V., Eds.; Volume 126, pp. 246–250. [Google Scholar]
Figure 1. Composition of anchorage structure and stress on supporting units in the pre-tightening process: (a) anchor structure; (b) pre-tightening process.
Processes 12 00113 g001
Figure 2. Layout of the 2308 return air roadway and histogram of roof-floor of coal seam: (a) layout of No.2308 return air roadway; (b) coal seam stratum synthesis histogram.
Processes 12 00113 g002
Figure 3. Diagram of the support section of the 2308 return air roadway.
Processes 12 00113 g003
Figure 4. Deformation monitoring results of surrounding rock in the 2308 return air roadway. (Four points A, B, C and D respectively represent the displacement monitoring points of the roof, floor and two sides of the roadway respectively.)
Processes 12 00113 g004
Figure 5. Borehole observation results of roof strata in the 2308 return air roadway.
Processes 12 00113 g005
Figure 6. Bolt pre-tightening equipment and process.
Processes 12 00113 g006
Figure 7. Relationships and fitting curves between pre-tightening torques and average pre-tightening force.
Processes 12 00113 g007
Figure 8. Comparison of the initial pre-tightening force of Bolts B1-B3 and their losses: (a) variation of initial pre-tightening force; (b) initial pre-tightening force loss rate; (c) histogram of average pre-tightening force loss variations.
Processes 12 00113 g008
Figure 9. Characteristics of different bolt pre-tightening force losses under repeated pre-tightening: (a) Bolt B1; (b) Bolt B2; (c) Bolt B3.
Processes 12 00113 g009
Figure 10. Field conditions of surrounding rock on the roadway surface: (a) surface roughness of surrounding rock; (b) bolt-plate extra friction; (c) bolt-nut extra friction.
Processes 12 00113 g010
Figure 11. Damage characteristics of the material surface and variation of friction coefficients under repeated pre-tightening: (a) nut is tightened once; (b) nut is tightened for five times; (c) variation of friction coefficient.
Processes 12 00113 g011
Figure 12. Layout of the test roadway and the mine pressure monitoring station: (a) field test sections; (b) layout monitoring stations; (c) bolt pressure monitor; (d) surface displacement monitor.
Processes 12 00113 g012
Figure 13. Roadway surface displacements under different pre-tightening measures: (a) roadway deformation in No. 1 test section; (b) roadway deformation in No. 2 test section.
Processes 12 00113 g013
Figure 14. Bolt pressure curves under different pre-tightening measures: (a) bolt pressure in No. 1 test section; (b) bolt pressure in No. 2 test section.
Processes 12 00113 g014
Table 1. Correspondence between pre-tightening torque and theoretical pre-tightening force.
Pre-tightening torque/N·m130160190220250
Theoretical pre-tightening force /kN33.841.649.457.265
Table 2. Bolt stresses under different pre-tightening measures.
LocationInitial Pre-Tightening Force/kNStabilized Pre-Tightening Force/kN
No. 1 Test SectionNo. 2 Test SectionIncreasing Rate No. 1 Test SectionNo. 2 Test SectionDecreasing Rate
Roof315371.0%10591−13.3%
Left side385134.2%8476−9.5%
Right side354837.1%7668−10.5%
Disclaimer/Publisher’s Note: The statements, opinions and data contained in all publications are solely those of the individual author(s) and contributor(s) and not of MDPI and/or the editor(s). MDPI and/or the editor(s) disclaim responsibility for any injury to people or property resulting from any ideas, methods, instructions or products referred to in the content.

