Article

CO2 Compression and Liquefaction Processes Using a Distillation Column for the Flexible Operation of Transportation

1
CoSPE, Department of Chemical Engineering, Hankyong National University, Jungang-ro 327, Anseong-si 17579, Gyeonggi-do, Republic of Korea
2
A-ONE Co., Ltd., 35, Jeongwangcheondong-ro 94beon-gil, Danwon-gu, Ansan-si 15415, Gyeonggi-do, Republic of Korea
*
Author to whom correspondence should be addressed.
Processes 2024, 12(1), 115; https://doi.org/10.3390/pr12010115
Submission received: 14 December 2023 / Revised: 29 December 2023 / Accepted: 30 December 2023 / Published: 2 January 2024

Abstract

:
Impurities in the CO2 stream should be removed to prevent eventual phase changes in CO2 transportation because a two-phase flow caused by the phase change in the pipeline necessitates additional overpressure and can induce equipment damage. In this study, CO2 compression and liquefaction (CCL) processes with a distillation column were used to remove non-condensable impurities and were compared with those with a flash. Three different feeds with a flow rate of 50.1 t/h (400,500 t/y) were supplied to the CCL processes and compressed to 65 bar to gauge pressure (barg) and 20 °C. Although the CO2 mixtures obtained through dehydration and flashing met the purity requirements for transportation and storage recommended in literature, the flash-separated CO2 product at 65 barg demonstrated the coexistence of gas and liquid phases, which restricted the temperature window for liquid CO2 transportation. When the distillation column was used instead of the flash, the operating temperature window at 65 barg widened by 3–6 °C owing to the high purity of CO2. However, the levelized cost of CO2 liquefaction (LCCL) increased by 2–4 $/t-CO2 varying with the feed purity because the distillation column consumed more cooling and heating duties than the flash. This study highlighted that a two-phase flow existed under certain operating conditions despite a high purity of CO2 (over 97 mol%), and the distillation column enhanced the operability of liquid CO2 transportation.

1. Introduction

To meet the global energy demands, CO2 emissions from fossil fuels continue to increase [1]. CO2 capture and storage (CCS) is crucial for mitigating the CO2 concentration in the atmosphere for sustainable development considering the environment [2,3]. The CCS technology consists of CO2 capture (using absorption, adsorption, cryogenic purification, and membranes), CO2 compression and liquefaction (CCL), CO2 transportation (via trucks, ships, and pipelines), and sequestration in the ground, sea, and depleted reservoirs [4,5,6]. The composition of a CO2-rich mixture captured from combustion processes depends on the fuel type (e.g., coal, natural gas, oil, and biomass) and capture technologies, such as pre-, post-, and oxy-combustion [7,8,9]. The CO2 mixture contains various impurities such as H2O, H2S, CO, SO2, Ar, H2, CH4, O2, N2, and NH3 [10,11]. Water is produced by the combustion of fossil fuels. H2 and CH4 are the main impurities in steam methane reforming (SMR) for H2 production. O2 remains in the flue gas of oxy-combustion plants [12].
The purity of the CO2 mixture for pipeline transportation and storage is determined by considering the pipeline corrosion, undesirable side reactions, as well as environmental and economic factors [7,13,14]. Table 1 lists the recommended CO2 compositions [7,10]. The European project DYNAMIS (2008) proposed guidelines regarding the quality of CO2 for pipeline transportation [15], recommending a CO2 purity of greater than 95.5 vol% and a water content below 500 ppm-volume based (ppmv) [10]. NETL (2012) recommended purity limits for pipeline transportation and saline reservoir sequestration, indicating that the total amount of non-condensable components (N2, O2, Ar, CH4, CO, and H2) was less than 4 vol%, and the water content was less than 300 ppm-weight based (ppmwt) [10]. Abbas et al. (2013) reported the purification limits for the geological storage of CO2, recommending a CO2 purity of greater than 90 vol% and a water content below 500 ppmv [7]. The non-condensable gas content was limited to less than 4 vol% to avoid a two-phase flow in the pipeline transportation [7,10], increase the storage capacity, and decrease the compressor duty required for geological storage [11].
The strength of the pipelines must be increased to minimize the possibility of ductile fracture because N2, CH4, and H2 have low critical temperatures [8]. Toxic components such as CO and H2S pose safety concerns owing to exposure or leakage from the pipelines and geological sequestration [11,16]. Despite the purity limits of CO2 being satisfied, small amounts of impurities can affect the phase behavior during transportation, storage, and injection [13,16,17].
Pure CO2 is liquefied between the triple (5.2 bar, −56.5 °C) and critical points (73.8 bar, 31.1 °C) [18]. A CO2 stream with impurities has an increased critical pressure (Pc) and is liquefied at a higher pressure than pure CO2, which results in an increased power consumption [16]. Additionally, the pressure drop of an impure CO2 stream is higher than that of pure CO2 during pipeline transportation [19]. For a CO2 stream containing impurities, the pipeline pressure should be increased to prevent the phase change [16], and the liquefying temperature should be lower than that of pure CO2 owing to its low critical temperature (Tc).
Brownsort et al. (2019) reported that 99.7 vol% of CO2 is required to prevent the formation of dry ice during ship transportation [20]. Peletiri et al. (2019) analyzed the effect of impurities on CO2 fluid behavior, such as the density, viscosity, phase envelope, and critical point [8]. Goos et al. (2011) compared the phase envelopes of CO2 mixtures containing 5 and 10 mol% N2 during a CO2 compression process [21]. To remove volatile gases from an impure CO2 stream, a distillation column was used instead of a flash for the CO2 conditioning process for both pipeline and ship transport [13]. Xu et al. (2014) proposed a distillation column to produce high-purity CO2 from mixtures with CO2, N2, O2, and Ar to satisfy the specifications for CO2 transportation and storage [22].
Seo et al. (2016) compared the cost of CO2 liquefaction processes, including a liquefaction unit, storage tanks in the intermediate terminal, a CO2 carrier, and pumps, demonstrating an optimal liquefaction pressure of 15 bar (−27 °C) for ship-based CCS chains [23]. Adu et al. (2020) evaluated the CO2 avoidance cost ($72–$94/t-CO2) in CO2 capture and compression processes from 550 MW coal and natural gas-fired power plants [24]. The CO2 liquefaction cost under the purity requirements was assessed for pure and impure CO2 feeds at different pressures [25]. Gong et al. (2022) compared the total capital investment (TCI) and utility costs for open- and closed-cycle CO2 liquefaction processes at 7 and 15 bar for transportation [26]. Although these studies demonstrated scientific and technological advances in CCL, they failed to present the extent to which the CCL process with a distillation column removing impurities from the CO2-rich mixture improved the operability of pipeline and ship transportation. They also overlooked the increase in the CO2 liquefaction costs for the removal of impurities using distillation columns.
In this study, a process flow diagram (PFD) of CCL processes involving a flash or distillation column is presented, which focuses on the impurity removal from three different CO2-rich mixtures for stable CO2 transportation. The operating ranges that prevent the two-phase flow in CO2 transportation were investigated by analyzing the phase envelopes of liquefied CO2 produced from the bottom of the flash or distillation column. The levelized cost of CO2 compression and liquefaction (LCCL) was evaluated to examine the economic impact of the impurity removal from CO2-rich mixtures. This study demonstrated that a CCL process equipped with a distillation column improves the operability of CO2 transportation by removing non-condensable gases and preventing two-phase flow.

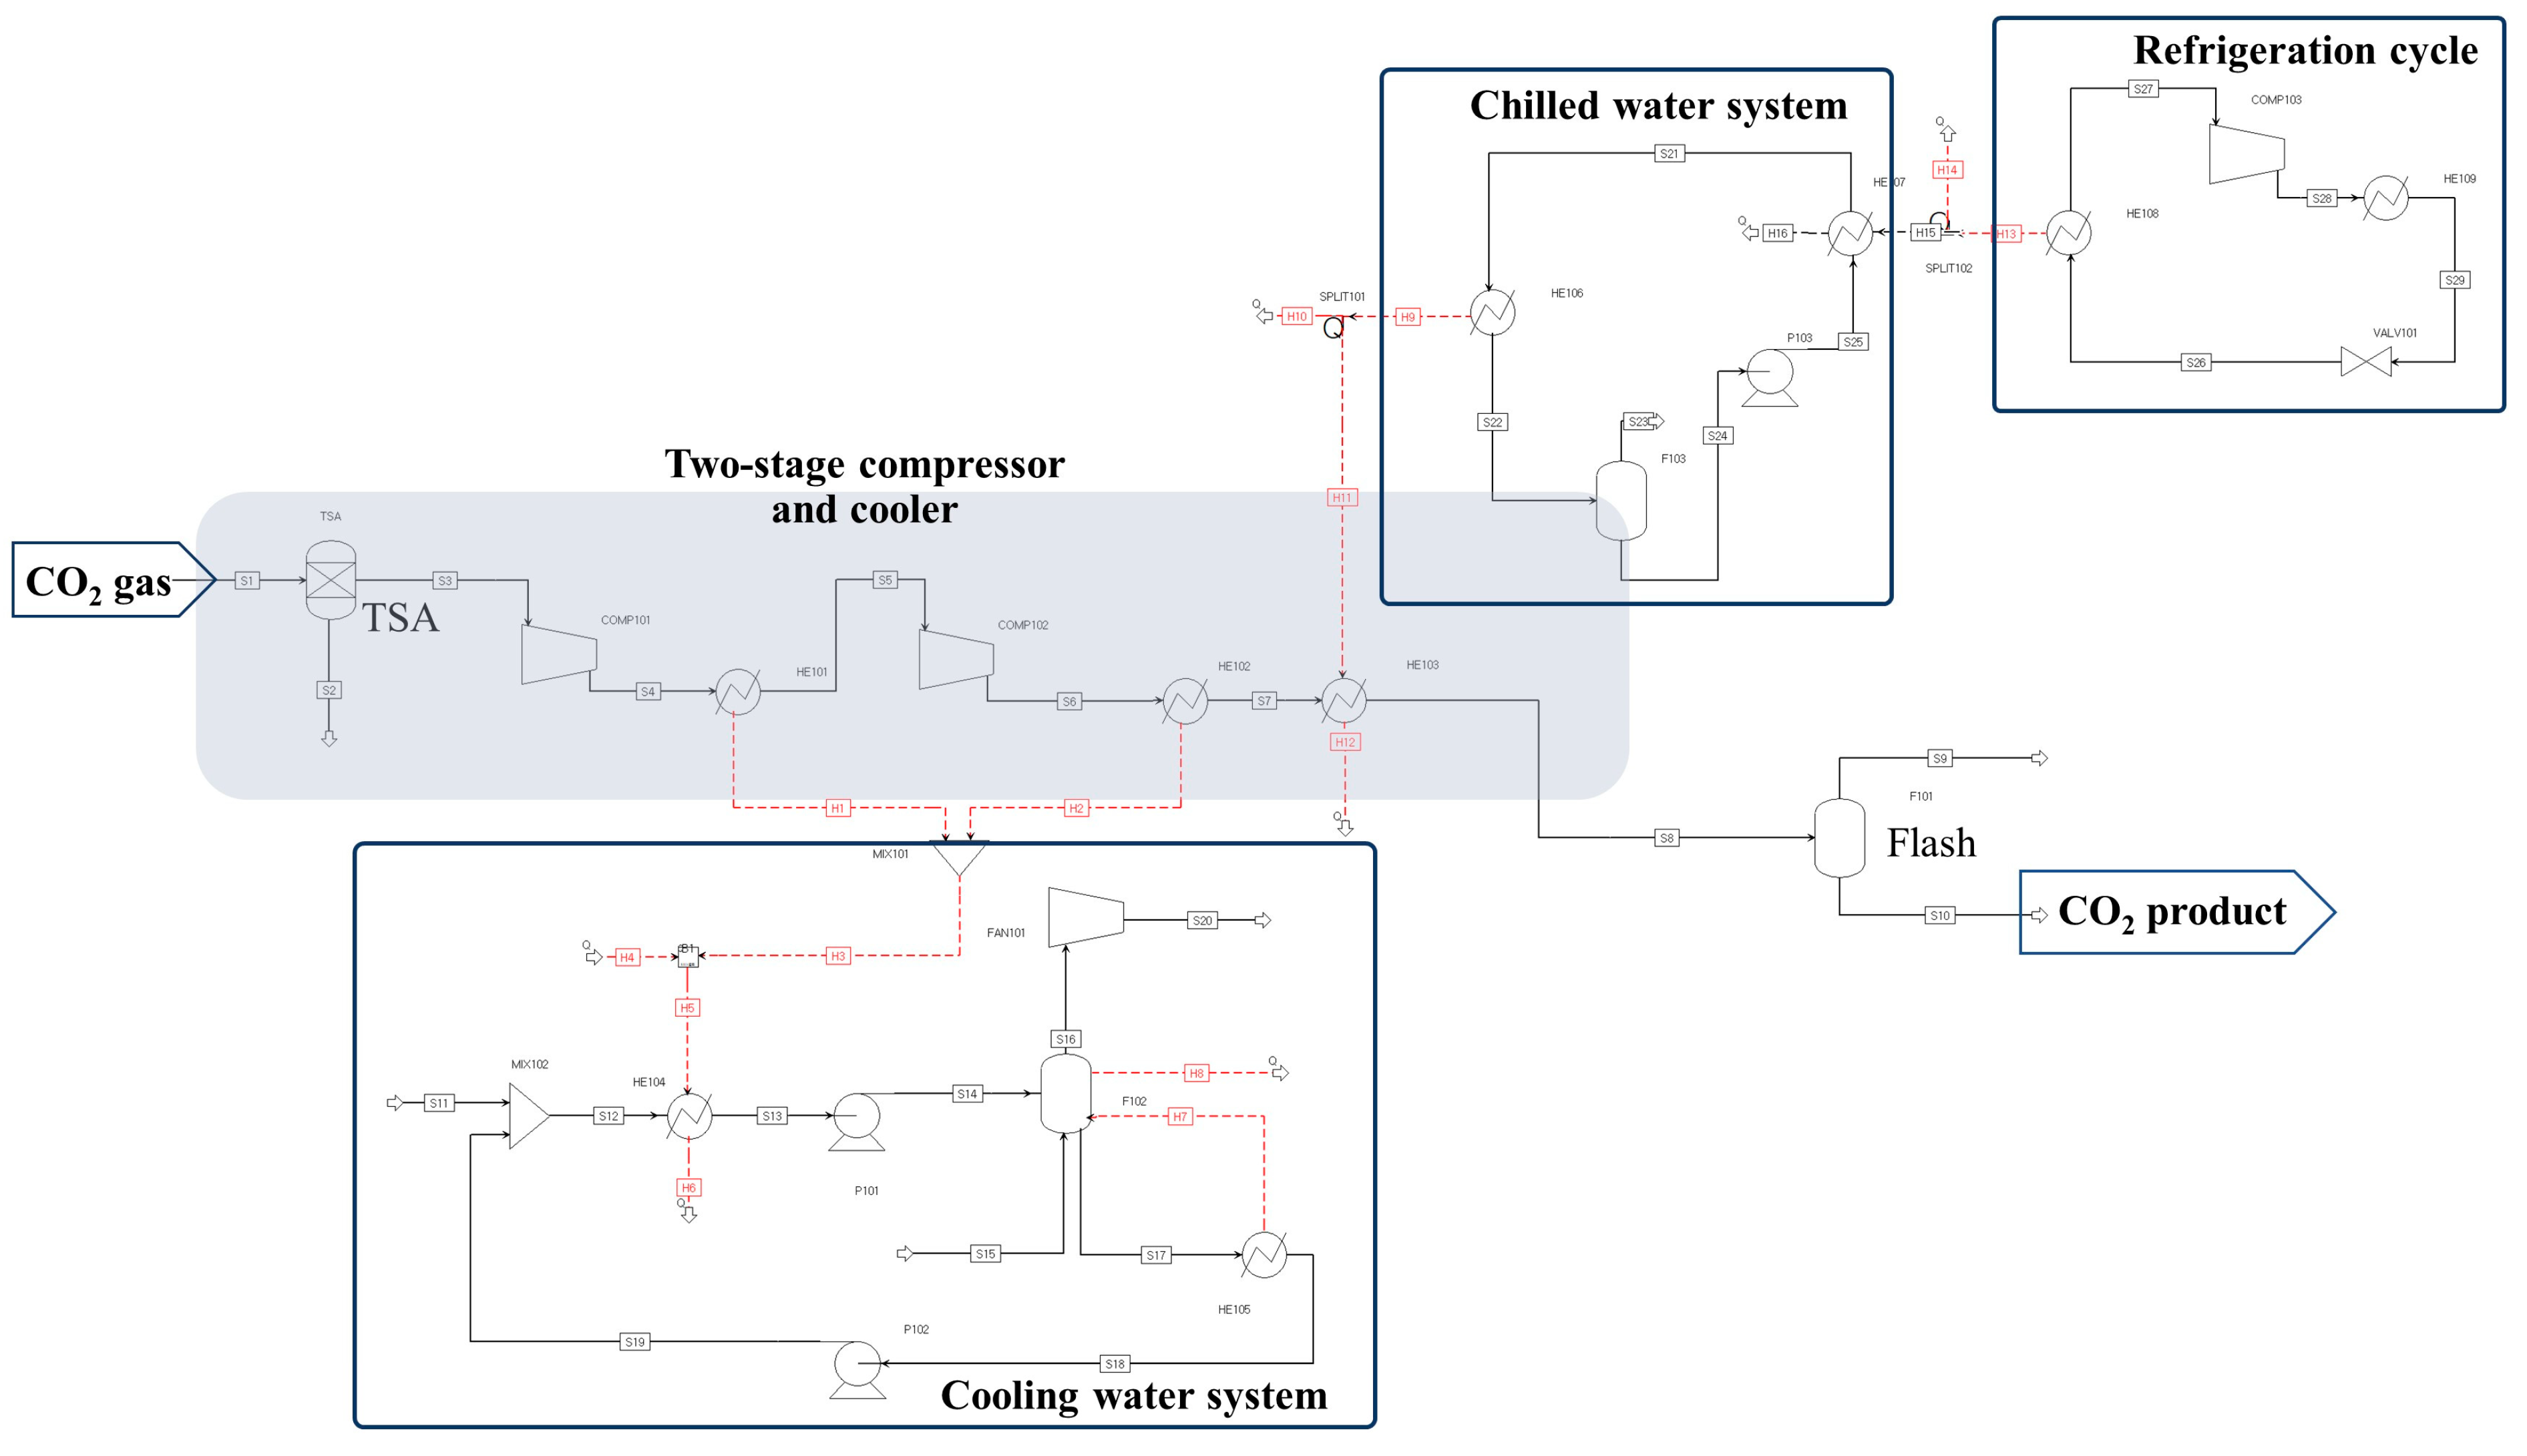
2. Process Description of CO2 Compression and Liquefaction

A CO2-rich mixture (50.068 t/h or 400,544 t/y) was supplied to a CCL process in an intermediate terminal for transportation and sequestration. The supplied CO2 mixture was assumed to be at 25 °C and 15 bar to gauge pressure (barg). Three CO2-rich mixtures satisfying the purity limits of DYNAMIS (see Table 1), except H2O, were considered as the CO2 feed: (i) CO2 captured from an SMR plant (Feed 1), (ii) CO2 captured from post-combustion with a main impurity of N2 (Feed 2), and (iii) CO2 containing H2 as an impurity (Feed 3).
Table 2 lists the temperature (T), pressure (P), mass flow rate (F), and composition (yi) of the three feeds. Feed 1 contained 99.13 mol% CO2, 0.7 mol% non-condensable gas (0.61 mol% H2, 0.09 mol% CH4), 200 ppm CO, and 1500 ppm H2O, which was provided by a Korean company. The compositions of Feeds 2 and 3 were 97 mol% CO2, 1500 ppm H2O, and 2.85 mol% N2 or H2, respectively, which were used to investigate the possibility of the two-phase flow in CO2 transportation at various operating conditions.
ASPEN Plus V14 (ASPEN Tech., Bedford, MA, USA, 2022) was used to conceptually design the CCL process. The Peng–Robinson (PR) equation of state (EOS), which is a cubic equation of state with binary interaction parameters accounting for the non-ideality of the fluid mixture, was selected to predict the thermodynamic properties of the fluids [27,28]. The PR EOS is frequently used for the phase equilibria of CO2 mixtures [29,30].
Figure 1 presents the phase envelopes obtained from the PR EOS, as well as the Pc and Tc values of pure CO2 [29] and a CO2 mixture with 14 mol% N2 [31]. The PR EOS was calculated using the density marching method [32], which is appropriate for calculating the phase envelope around the critical point (Tc, Pc), which was located at the edge of the phase envelope on the P and T plane (PT phase envelope). The left line of the critical point indicates the bubble points and the right line indicates the dew points. Two phases appeared between the bubble and dew points within certain ranges of P and T, as illustrated in Figure 1. The gas and liquid phases did not coexist for pure CO2 (thick black solid line) below the critical point, whereas the two phases appeared for the CO2 mixture with 14 mol% N2 (thin blue solid line).
The experimentally measured critical points are indicated by the circles. The mean error of Pc between the PR EOS and experimental values was 0.55%, whereas that of Tc was 6.40%. The critical points obtained from the PR EOS sufficiently agreed with the experimental data. The Tc value was lower and the Pc value was higher for the CO2 mixtures containing N2, when compared to those of pure CO2. Li et al. (2015) used the PR EOS to explain the effect of the impurities in CO2 mixtures on the phase change [10]. Babar et al. (2018) reported that the deviation between the PR EOS and experimental data in a CO2-CH4 binary system was ±3% for the three-phase locus [33]. Peletiri et al. (2017) selected the PR EOS to identify the pressure drop and phase change in pipeline transportation of CO2 flows containing impurities [34].
The CCL process includes a temperature swing adsorption (TSA) unit for H2O removal, a two-stage compressor and cooler, cooling water and chiller systems, an R134a refrigerant cycle system, and a flash or distillation column for non-condensable gas removal, as shown in Figure 2 and Figure 3. The CO2 feed first entered a TSA unit for dehydration to 49 ppmv H2O, which is the recommendation for CO2 transportation and storage based on the guideline [35]. The pressure drop in the TSA unit was 2 bar and the dewatered CO2 stream exited at 13 barg and 25 °C. The CO2 stream was compressed to 25.5 and 66.2 barg using the first and second compressors, respectively. The efficiencies of the compressors were set to 72%. The temperature that was elevated by compression was lowered to 40 °C by using the cooling water system, where the pressure drop in the coolers was 0.5 bar. The cooling tower was operated at 32–37 °C, where the heat loss was 5%.
The CO2 stream at 65.7 barg and 40 °C was cooled once again to 20 °C using a chiller. The chilled water system, which was capable in lowering the temperature of a fluid to 20 °C, was operated at 6–12 °C. The pressure drop in the chilled water cooler was 0.7 bar. For the production of chilled water at 6 °C in the chilled water system, a refrigeration cycle with an R134a refrigerant was used, which was operated at −2.9–35 °C and 1.6–7.9 barg [36]. The leakage fraction of the valves in the refrigeration cycle and chilled water system was set to 0.0001.
Liquefied CO2 was produced at the bottom of the flash or distillation column. The flash was operated at 65 barg and 20 °C. The eight-stage distillation column was used, where the feed was supplied to the third stage and the reflux ratio was 7.04 for Feeds 1 and 2, and 9.97 for Feed 3. The operating pressure of the distillation column ranged from 65 to 65.1 barg. A chiller was used to lower the condenser temperature of the distillation column; chiller from the chilled water system at 17.9 °C for Feed 1, and chiller from the refrigeration cycle at 2.7 and 3.3 °C for Feeds 2 and 3, respectively. Low-pressure steam was supplied to the reboiler of the distillation column. A chiller was used to adjust the temperature of the liquefied CO2 product to 20 °C at the bottom of the distillation column. The CO2 recovery of the distillation column was set to 93%, which was commonly used in other studies [13,22]. The liquefied CO2 was produced at 65 barg and 20 °C from both the flash and distillation column.

3. Methodology of Techno-Economic Analysis (TEA)

A techno-economic analysis (TEA) method [37,38] was employed to evaluate the economic feasibility of the CCL processes. An Aspen Process Economic Analyzer V14 (ASPEN Tech., Bedford, MA, USA, 2022) was used to calculate the total direct and indirect costs (TDIC) of each equipment, which included 4% for instrumentation and control, 9% for piping, and 4% for electrical systems of the total equipment cost [38]. The fixed capital investment (FCI) was obtained by adding the TDIC and project contingency (PC), which was set to 10% of the TDIC. The working capital (WC) was assumed to be 5% of the FCI, and the total capital investment (TCI) was the sum of the FCI and WC.
The total production cost (TPC) was calculated as the sum of the raw materials, utilities, and fixed costs. The raw material cost of CO2 was ignored, which was directly supplied by the CO2 capturing unit. The utility costs included those used for the cooling water, chiller, R134a refrigerant, LNG for steam, and electricity for compressors and pumps. The fixed cost consisted of the operating labor cost, maintenance cost (2% of FCI), operating charges (25% of labor cost), plant overhead (70% of labor cost), and general and administrative costs (8% of labor cost) [38,39,40].
Several economic assumptions were applied for the calculation of TPC: (i) the plant operates 8000 h per year, (ii) the plant life (Lp) and depreciation period is 30 years [40], (iii) the debt-to-equity ratio is 70% of the TCI [4], (iv) the inflation rate (α), corporation tax rate (β), and interest rate (γ) are 2%/y, 20%, and 6%/y, respectively [38]; (v) the supervisors and workers receive wages of $400,000 and $640,000 per year, respectively, (vi) a total of 16 workers and 5 supervisors work with three shifts a day [41], (vii) the operating cost of TSA is $0.371 per ton of the inlet stream [42], (viii) the electricity and LNG prices are 98 $/MWhe and 26.8 $/MWhth, respectively [38], (ix) the prices of cooling and chilled water are 0.273 $/m3 and 1.0 $/m3, respectively [4], and (x) the R134a refrigerant cost is 8.1 $/kg, which was converted from 6.7 €/kg in 2017 [43] using the inflation rate (2%/y) and a USD/EUR exchange rate of 1.1. All prices and costs were based on 2022.
The levelized cost of CO2 liquefaction (LCCL) was calculated using the total present values of the capital expenditure cost (Ccap), debt cost (Cdebt), and TPC for the plant life (N), which were divided by the total present value of the CO2 production rate (Fout) without impurities:
LCCL   ( $ / t CO 2 ) = n = 1 L p C c a p , n + C d e b t , n + T P C n 1 + γ n n = 1 L p F o u t 1 + α n
Ccap was given as an annually-equal value of 30% FCI (equity) divided by Lp. Cdebt was calculated as the fully amortized principal and interest during the life of the plant (Lp). The annual TPC (TPCn) increased according to the inflation rate (α).

4. Results and Discussion

The CO2-product at 65 barg and 20 °C satisfied the purity requirements for transportation and sequestration shown in Table 1. The phase envelopes of the CO2 products obtained from the three feeds were compared, which demonstrated the range of two-phase flow in the P and T plane. The LCCL was calculated for the CCL processes equipped with a flash or distillation column.

4.1. Process Performance of CCL with Flash or Distillation Column

The product flow rate and purity, CO2 recovery, as well as the electricity and steam consumptions of the three feeds at a flow rate of 50.068 t/h (or 400, 544 t/y) are listed in Table 3. The product flow rates of the CCL processes with the flash were obtained from a phase equilibrium of a flash at 65 barg and 20 °C, whereas those of the CCL processes with the eight-stage distillation column were obtained from an operating condition achieving a 93% CO2 recovery. For Feed 1, with a high CO2 purity of 99.13 vol%, the purity of the product was slightly improved with a 100% recovery using a flash. The product flow rates from the CCL processes with a flash were relatively low for Feeds 2 and 3 owing to their high impurity content of N2 and H2, respectively. Liquefied products of 42.9 t/h (97.8 mol% CO2 and 2.2 mol% N2) and 33.1 t/hr (98.9 mol% CO2 and 1.1 mol% H2) were produced at the bottom of the flash for Feeds 2 and 3, resulting in low CO2 recoveries.
When the distillation column maintaining a recovery of 93% was used for the removal of impurities, high CO2 purities of 99.95, 99.81, and 99.99 mol% were achieved for Feeds 1, 2, and 3, respectively, implying that the CCL process with a distillation column can produce CO2 with a high purity for various feeds with different qualities, unlike a flash.
Feeds 1, 2, and 3 were compressed to 66.2 barg, consuming 1747, 1830, and 1867 kWe, respectively. When a flash was used, the CO2 streams after the two-stage compressor entered a cooler to reduce the temperature from 40 to 20 °C, and the heat duties of this cooler were 2.43, 2.06, and 1.78 MWth for Feeds 1–3, respectively, in which the cooling utility system consumed 707, 648, and 564 kWe of electricity, respectively. When the distillation column was used for Feed 1, chilled water (1539 = 3964 − 2425 kW) was used to cool the top product in the condenser to 17.9 °C and the CO2 product of the bottom to 20 °C, where 432 kWe (=1139 − 707 kWe) of electricity was additionally consumed. The R134a refrigerant was used to cool the top product to 2.7 °C in the condenser and a chiller was used to cool the liquefied CO2 at the bottom for Feed 2 containing N2, where an electricity of 556 kWe (=1204 − 648 kWe) was required to supply a cooling duty of 2.1 MW (=4.1 − 2.1 MW). Feed 3 containing H2 required 3.1 MW (=4.9 − 1.8 MW) to decease the temperature of the top product to 3.3 °C in the distillation column and the CO2 product at the bottom to 20 °C using the refrigeration cycle and chilled water system, respectively.
Steam was used to evaporate the bottom product in the reboilers of the distillation column. The reboiler temperatures were 26.2, 25.8, and 26.3 °C, where the heat duties were 1.70, 1.87, and 2.61 MWth for Feeds 1–3, respectively. The electricity and heat duty of Feed 3 in the cooling system and reboiler, respectively, were the highest, achieving 93% recovery.

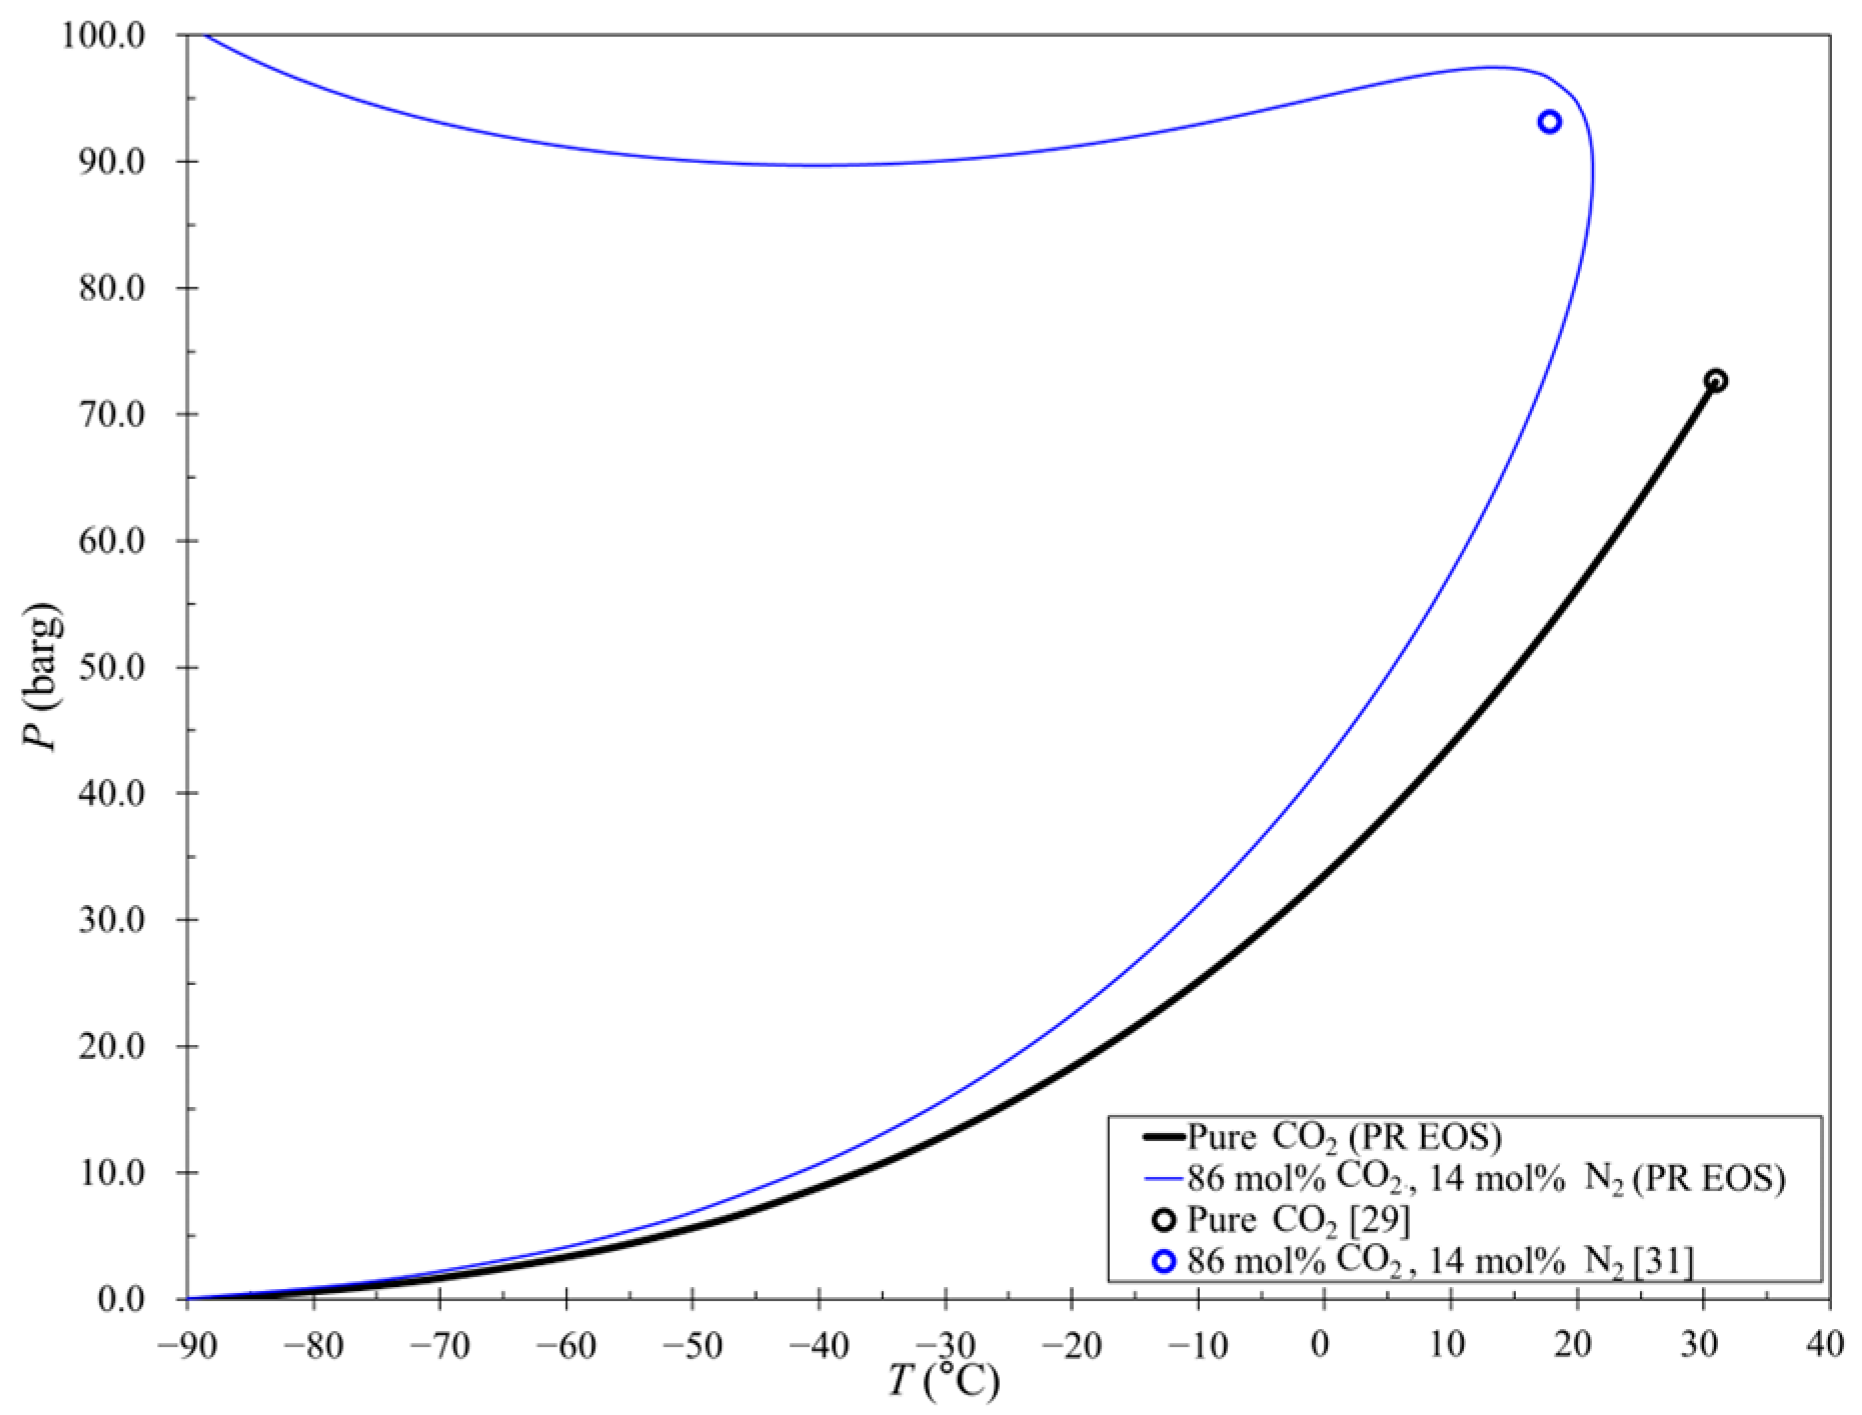
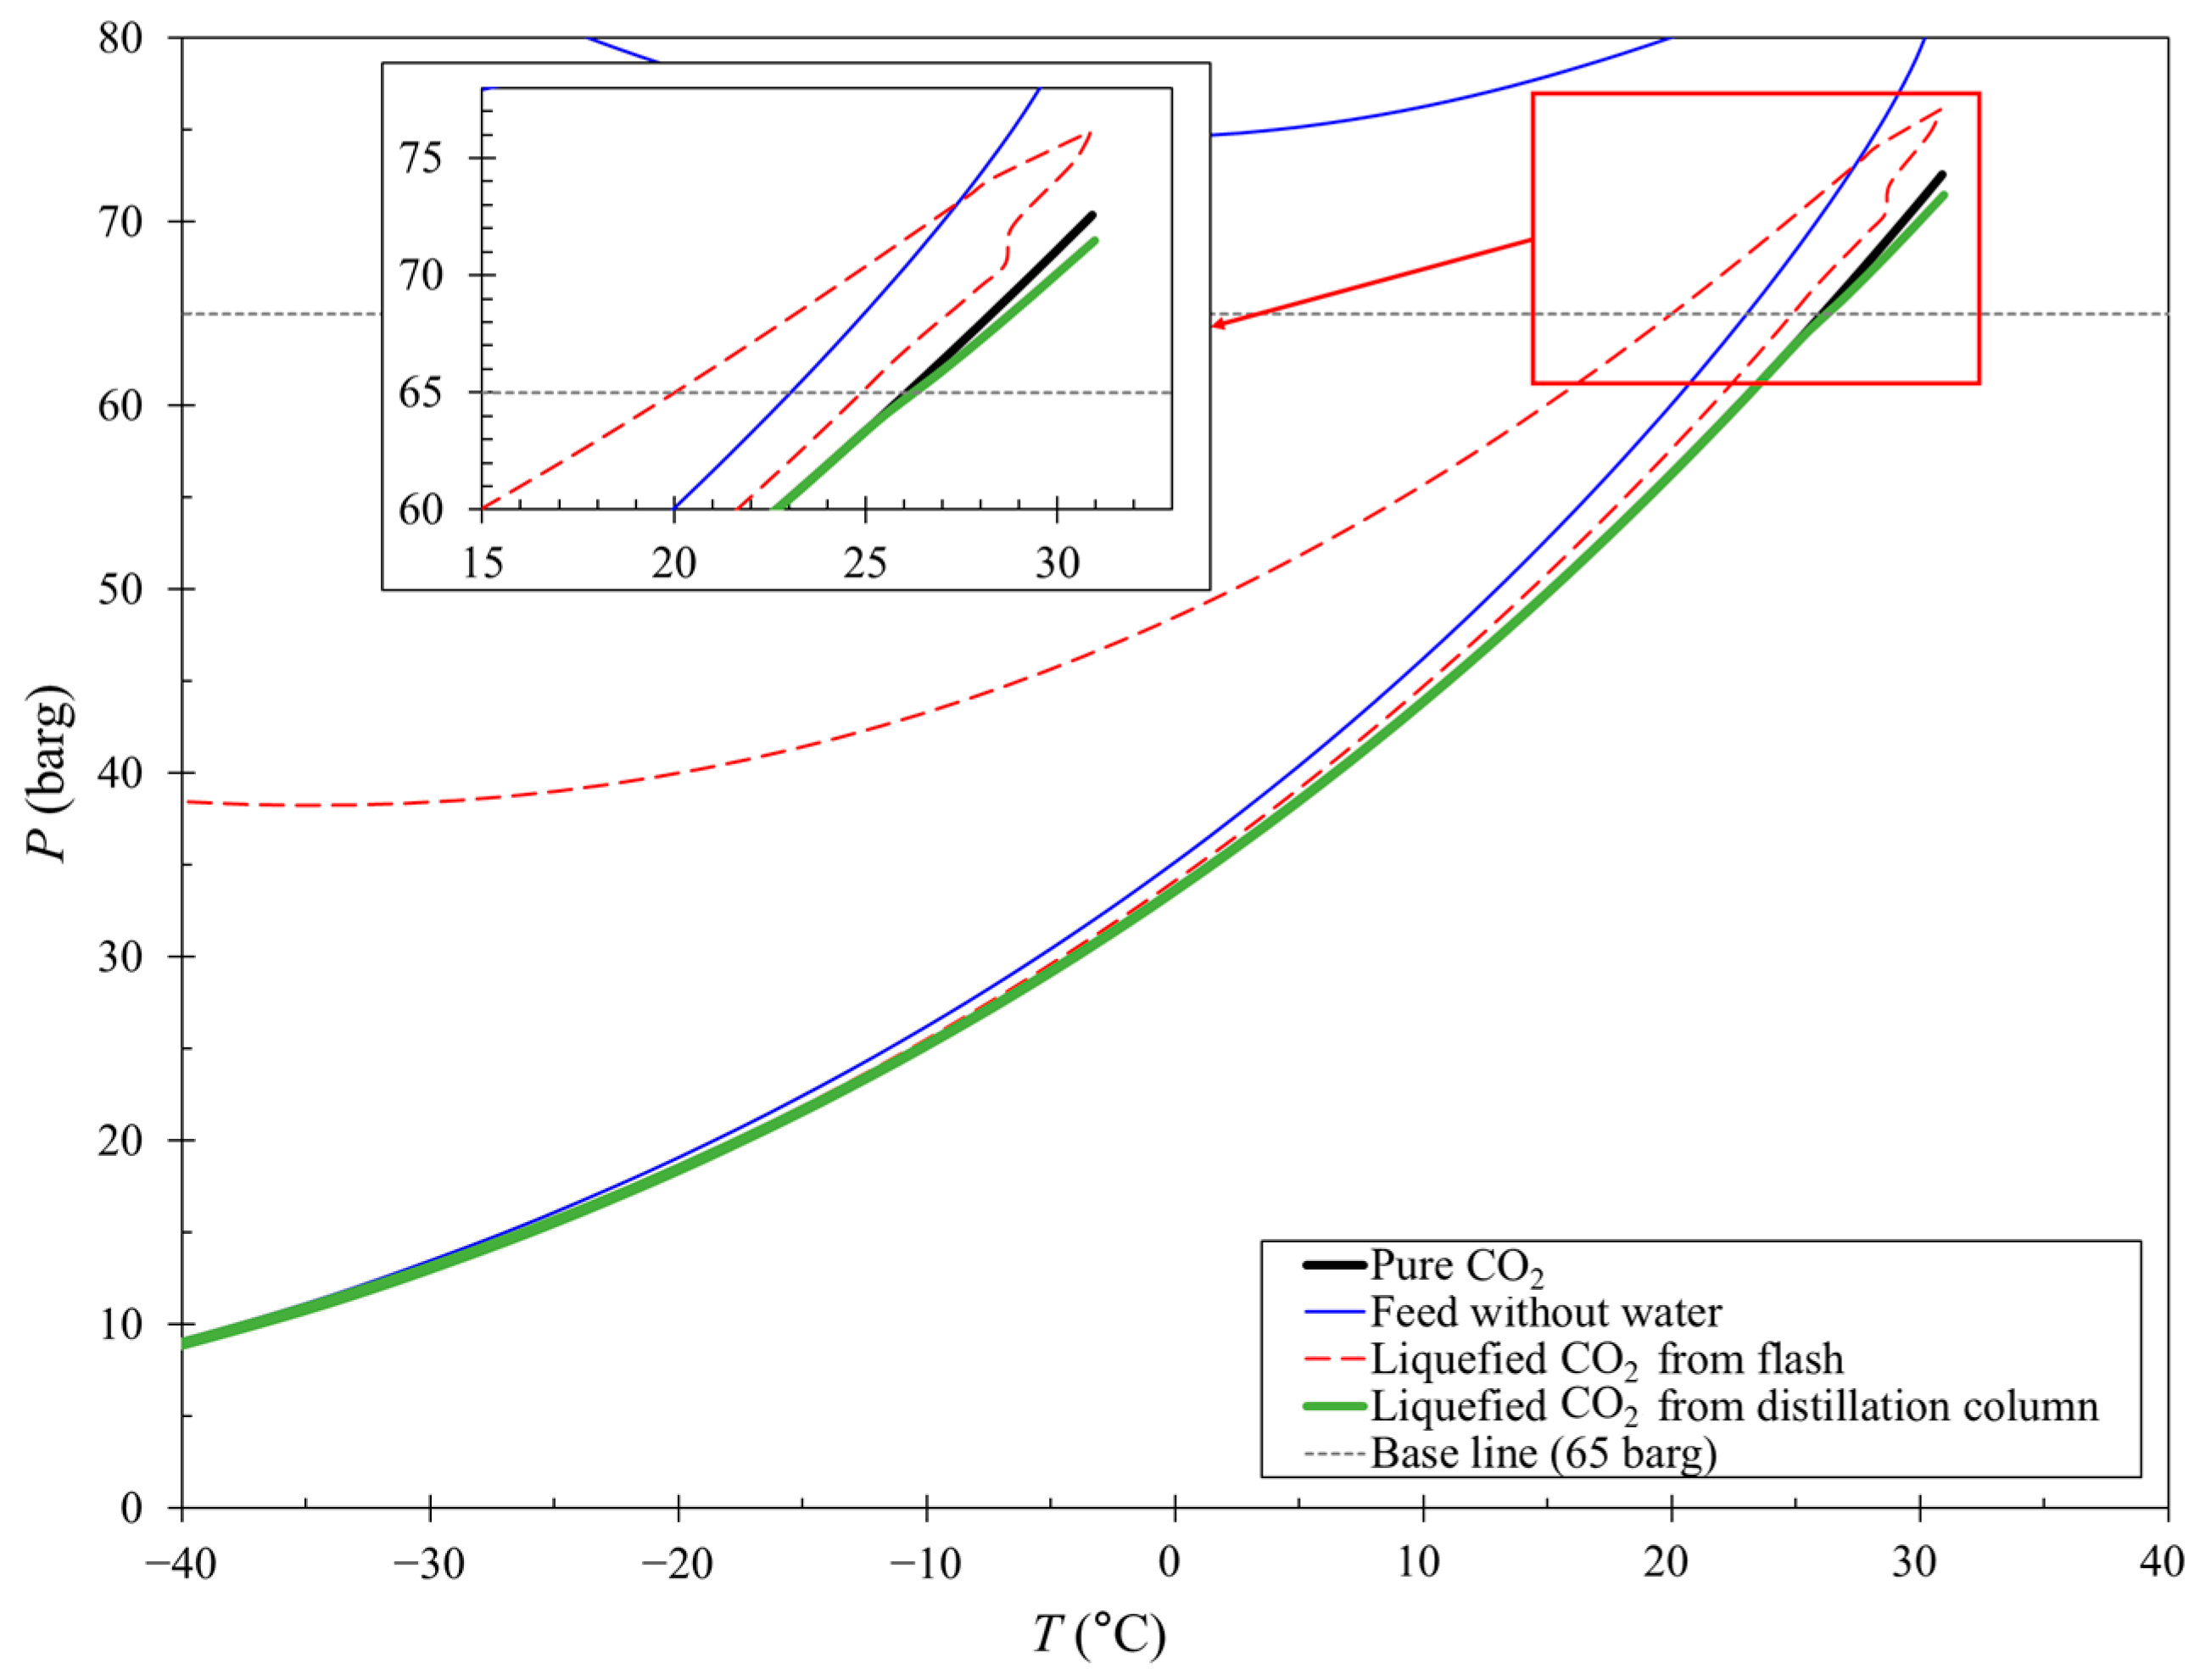
4.2. Phase Envelope for CCL with a Flash or Distillation Column

The phase envelopes on the P and T plane were compared for the pure CO2, feed without water, and liquefied CO2 products separated from the flash and distillation columns for Feeds 1–3, as shown in Figure 4, Figure 5 and Figure 6, respectively. The critical point of pure CO2 was 31.1 °C and 72.8 barg, which is represented by a single line (thick black solid line) on the phase envelope, as shown in Figure 4. The left side of the single line represents the liquid phase, and the right side represents the gas phase. The phase envelope (thick green solid line) of the liquefied CO2 product from the distillation column is also a single line because its purity (99.95%) is high. However, the dehydrated Feed 1 (thin blue solid line) and liquefied CO2 product from the flash (thin red dashed line) indicate two phases at P = 65 barg, despite the purity (99.28%) being slightly lower than that of the CO2 product from the distillation column.
At 65.0 barg, the pure CO2 and CO2 product from the distillation column were in the liquid phase below 26.1 °C (inset of Figure 4). The CO2 product from the flash had a composition of 99.28 mol% CO2, 0.02 mol% CO, 0.61 mol% H2, and 0.09 mol% CH4, demonstrating a two-phase range from 22.8 to 25.3 °C at 65 barg. Assuming that the liquefied CO2 at 20 °C and 65 barg is transported via a pipeline or ship, the transportation temperature should be below 22.8 and 26.1 °C for the CO2 products from the flash and distillation columns, respectively. For Feed 1, the operating window of the CO2 product from the distillation column was approximately 3 °C wider during transportation than that of the CO2 from the flash.
The phase envelopes of the CO2-rich mixtures from the flash (thin red dashed line) and distillation column (thick green solid line) for Feed 2, which contained 2.9 mol% N2, are shown in Figure 5. The feed without water (thin blue solid line) at 65 barg has two phases ranging from 17.8 to 23.4 °C, whereas the gas and liquid phases coexist between 19.9 and 24.0 °C for the CO2 product from the flash (purity = 97.79%), as shown in the inset of Figure 5. The CO2 product at 65 barg should be transported below 19.9 °C to avoid the gas phase. Because the CO2 product from the distillation column (purity = 99.81%) does not exhibit the two-phase region, its temperature window for the liquid transportation is approximately 6 °C wider compared to that of the CO2 product from the flash.
The gas phase was inevitable for Feed 3 containing 2.9 mol% H2 (thin blue solid line) at 65 barg. Therefore, the purification of Feed 3 is necessary for liquid transportation at 65 barg. The gas and liquid phases coexist from 19.9 to 24.9 °C for the CO2 product from the flash (inset of Figure 6). As the CO2 product from the distillation column had a purity of 99.99 mol%, the two-phase region did not appear at 65 barg. Using a distillation column in the CCL process enables the flexible operation of CO2 transportation, widening the temperature window in which two-phase flow does not occur.

4.3. Economic Evaluation of CCL with a Flash or Distillation Column

The removal of impurities by the distillation column enhances the operability of CO2 transportation in the liquid, but increases the capital and production costs in the CCL process. Table 4 presents the TCI, TPC, and LCCL values of the CCL processes for Feeds 1–3.
The TCI for the flash separation with Feed 1 was the highest at 17.6 M$ because the amount of heat required to reduce the temperature to 20 °C was higher than those of Feeds 2 and 3, increasing the equipment cost of the cooling systems. Although the CO2 compressors consumed less electricity, the utility consumption was the highest, which resulted in the highest TPC (6.0 M$/yr) for Feed 1.
The TCI and TPC of the CCL processes with the distillation column were higher than those with the flash because the eight-stage distillation column consumed additional steam and refrigerant (or chiller). When the CCL processes with the distillation column were used, the LCCLs increased compared to those with the flash, except for Feed 3, where the LCCL of the CCL process with the flash was higher than that with the distillation column owing to the low recovery (see Eq. (1)). The LCCL of the CCL process with the flash for Feed 1 was the lowest at $13.2/t-CO2 owing to the high purity of Feed 1 (99.1%) and high recovery (100%). As the purity of the feed decreased, the LCCL increased, as demonstrated by Feeds 2 and 3.

5. Conclusions

Captured CO2 containing non-condensable impurities such as N2 and H2 can exhibit a two-phase region under certain operating conditions of transportation, injection, and sequestration. In this study, a CO2 compression and liquefaction (CCL) process with a distillation column was proposed to remove the impurities and avoid an eventual two-phase flow during transportation and storage. The CCL process included a temperature swing adsorption (TSA) for water removal, a two-stage compressor with a cooler, utility systems with a cooling water system, chilled water system, refrigeration cycles, and flash or distillation. The flash was operated at 65 barg and 20 °C, whereas the eight-stage distillation column was operated at a fixed CO2 recovery of 93%. The Peng–Robinson equation of state (PR EOS) was used to calculate the phase equilibrium, which was in sufficient agreement with the experimental critical points. The phase envelopes of the CO2 mixtures in the temperature (T) and pressure (P) plane were obtained using the PR EOS to identify the existence of a two-phase flow. Feed 1 (99.1 mol% CO2, 1500 ppm H2O, and 0.7 mol% non-condensable gases), Feed 2 (97.0 mol% CO2, 1500 ppm H2O, and 2.85 mol% N2), and Feed 3 (97.0 mol% CO2, 1500 ppm H2O, and 2.85 mol% H2) were supplied and liquefied at 65 barg and 20 °C.
The CO2 mixtures obtained through the TSA and flash met the purity requirements for transportation and storage, based on the recommendations reported in the literature. However, when a flash at 65 barg and 20 °C was used, the CO2 recoveries of Feeds 2 and 3 were low owing to non-condensable impurities (N2 and H2). In addition, the flash-separated CO2 product at 65 barg demonstrated the co-existence of the gas and liquid phases, restricting the temperature window of liquid CO2 transportation. Pure CO2 at 65 barg maintained the liquid phase below 26 °C, whereas the CO2 products from the flash should be transported below 23 °C for Feed 1 and below 20 °C for Feeds 2 and 3 to avoid a two-phase flow. The CO2 products from the distillation column exhibited a behavior similar to that of pure CO2 owing to their high purity. The CCL processes with a distillation column consumed more cooling and heating duties than those with the flash.
The total capital investment (TCI, 17–20 M$) and total production cost (TPC, 7–8 M$/y) of the CCL process with the distillation column were higher for Feeds 1–3, compared to the TCI (15–17 M$) and TPC (5–6 M$/y) with the flash. The levelized cost of CO2 liquefaction (LCCL) of the CCL process with the distillation column (17–18 $/t-CO2) was higher than that with the flash (13–19 $/t-CO2), except for Feed 3, where the recovery was low. Using the distillation column widened the operating temperature window of liquid transportation but increased the LCCL. The CCL process was limited to the CO2 products at 65 barg. Two-phase flow under various operating conditions during transportation and storage must be investigated. A more rigorous validation of the EOS is also required for the accurate prediction of the phase equilibrium. This study demonstrated that a two-phase flow existed under certain operating conditions, despite the CO2 purity being high (over 97 mol%), and the distillation column enhanced the operability of liquid CO2 transportation. The scientific findings will provide a valuable guideline for process design in the field of CCL for CCS.

Author Contributions

Conceptualization: H.K. and H.-M.M. Methodology: S.K. and P.-G.J. Writing—original draft preparation: S.K. Writing—review and editing: Y.-I.L. Supervision: Y.-I.L. Funding acquisition: H.-M.M. All authors have read and agreed to the published version of the manuscript.

Funding

This work was funded by the Korea Institute of Energy Technology Evaluation and Planning (KETEP) (grant no. 20214710100060) by the Korean Government (MOTIE).

Data Availability Statement

Data are contained within the article.

Acknowledgments

We thank Seok-Gyun Yun for his engineering advice and internal communications.

Conflicts of Interest

The authors declare that the research was conducted in the absence of any commercial or commercial or financial relationships that could be construed as a potential conflict of interest.

References

  1. IEA. World Energy Outlook 2020; International Energy Agencey (IEA): Paris, France, 2020. [Google Scholar]
  2. Sun, X.; Shang, A.; Wu, P.; Liu, T.; Li, Y. A review of CO2 marine geological sequestration. Processes 2023, 11, 2206. [Google Scholar] [CrossRef]
  3. Lu, H.; Xin, X.; Ye, J.; Yu, G. Analysis of factors impacting CO2 assisted gravity drainage in oil reservoirs with bottom water. Processes 2023, 11, 3290. [Google Scholar] [CrossRef]
  4. Kim, S.; Lim, Y.I.; Lee, D.; Seo, M.W.; Mun, T.Y.; Lee, J.G. Effects of flue gas recirculation on energy, exergy, environment, and economics in oxy-coal circulating fluidized-bed power plants with CO2 capture. Int. J. Energy Res. 2021, 45, 5852–5865. [Google Scholar] [CrossRef]
  5. Li, H.; Jakobsen, J.P.; Wilhelmsen, Ø.; Yan, J. PVTxy properties of CO2 mixtures relevant for CO2 capture, transport and storage: Review of available experimental data and theoretical models. Appl. Energy 2011, 88, 3567–3579. [Google Scholar] [CrossRef]
  6. Pal, M.; Karaliūtė, V.; Malik, S. Exploring the potential of carbon capture, utilization, and storage in Baltic sea region countries: A review of CCUS patents from 2000 to 2022. Processes 2023, 11, 605. [Google Scholar] [CrossRef]
  7. Abbas, Z.; Mezher, T.; Abu-Zahra, M.R. CO2 purification. Part I: Purification requirement review and the selection of impurities deep removal technologies. Int. J. Greenh. Gas Control 2013, 16, 324–334. [Google Scholar] [CrossRef]
  8. Peletiri, S.P.; Mujtaba, I.M.; Rahmanian, N. Process simulation of impurity impacts on CO2 fluids flowing in pipelines. J. Clean. Prod. 2019, 240, 118145. [Google Scholar] [CrossRef]
  9. Morland, B.H.; Svenningsen, G.; Dugstad, A. The challenge of monitoring impurity content of CO2 streams. Processes 2021, 9, 570. [Google Scholar] [CrossRef]
  10. Li, H.; Wilhelmsen, Ø.; Yan, J. Properties of CO2 mixtures and impacts on carbon capture and storage. In Handbook of Clean Energy Systems; John Wiley & Sons, Ltd.: Hoboken, NJ, USA, 2015; pp. 1–17. [Google Scholar]
  11. Woods, M.; Matuszewski, M. Quality Guideline for Energy System Studies: CO2 Impurity Design Parameters; DOE/NETL-341/011212; National Energy Technology Laboratory (NETL): Pittsburgh, PA, USA; Morgantown, WV, USA, 2013. [Google Scholar]
  12. Hussain, B.Y. Dynamic Simulations of Carbon Dioxide Pipeline Transportation for the Purpose of Carbon Capture and Storage. Ph.D. Thesis, University of Birmingham, Birmingham, UK, 2017. [Google Scholar]
  13. Aspelund, A.; Jordal, K. Gas conditioning-The interface between CO2 capture and transport. Int. J. Greenh. Gas Control 2007, 1, 343–354. [Google Scholar] [CrossRef]
  14. Porter, R.T.; Fairweather, M.; Pourkashanian, M.; Woolley, R.M. The range and level of impurities in CO2 streams from different carbon capture sources. Int. J. Greenh. Gas Control 2015, 36, 161–174. [Google Scholar] [CrossRef]
  15. De Visser, E.; Hendriks, C.; Barrio, M.; Mølnvik, M.J.; De Koeijer, G.; Liljemark, S.; Le Gallo, Y. Dynamis CO2 quality recommendations. Int. J. Greenh. Gas Control 2008, 2, 478–484. [Google Scholar] [CrossRef]
  16. Onyebuchi, V.E.; Kolios, A.; Hanak, D.P.; Biliyok, C.; Manovic, V. A systematic review of key challenges of CO2 transport via pipelines. Renew. Sust. Energ. Rev. 2018, 81, 2563–2583. [Google Scholar] [CrossRef]
  17. Kahlke, S.-L.; Pumpa, M.; Schütz, S.; Kather, A.; Rütters, H. Potential dynamics of CO2 stream composition and mass flow rates in CCS clusters. Processes 2020, 8, 1188. [Google Scholar] [CrossRef]
  18. Raimondi, L. CO2 transportation with pipelines-model analysis for steady, dynamic and relief simulation. Chem. Eng. Trans. 2014, 36, 619–624. [Google Scholar]
  19. Verma, S.; Oakes, C.; Chugunov, N.; Ramakrishnan, T. Effect of contaminants on the thermodynamic properties of CO2-rich fluids and ramifications in the design of surface and injection facilities for geologic CO2 sequestration. Energy Procedia 2011, 4, 2340–2347. [Google Scholar] [CrossRef]
  20. Brownsort, P.A. Briefing on Carbon Dioxide Specifications for Transport. CCUS Projects Network, Norway, EU. 2019. Available online: https://www.ccusnetwork.eu/sites/default/files/TG3_Briefing-CO2-Specifications-for-Transport.pdf (accessed on 29 December 2023).
  21. Goos, E.; Riedel, U.; Zhao, L.; Blum, L. Phase diagrams of CO2 and CO2-N2 gas mixtures and their application in compression processes. Energy Procedia 2011, 4, 3778–3785. [Google Scholar] [CrossRef]
  22. Xu, G.; Liang, F.; Yang, Y.; Hu, Y.; Zhang, K.; Liu, W. An improved CO2 separation and purification system based on cryogenic separation and distillation theory. Energies 2014, 7, 3484–3502. [Google Scholar] [CrossRef]
  23. Seo, Y.; Huh, C.; Lee, S.; Chang, D. Comparison of CO2 liquefaction pressures for ship-based carbon capture and storage (CCS) chain. Int. J. Greenh. Gas Control 2016, 52, 1–12. [Google Scholar] [CrossRef]
  24. Adu, E.; Zhang, Y.; Liu, D.; Tontiwachwuthikul, P. Parametric process design and economic analysis of post-combustion CO2 capture and compression for coal-and natural gas-fired power plants. Energies 2020, 13, 2519. [Google Scholar] [CrossRef]
  25. Deng, H.; Roussanaly, S.; Skaugen, G. Techno-economic analyses of CO2 liquefaction: Impact of product pressure and impurities. Int. J. Refrig. 2019, 103, 301–315. [Google Scholar] [CrossRef]
  26. Gong, W.; Remiezowicz, E.; Fosbøl, P.L.; Dlamini, G.M.; von Solms, N. Techno-economic analysis of novel CO2 liquefaction processes. In Proceedings of the 16th Greenhouse Gas Control Technologies Conference (GHGT-16), Lyon, France, 23–24 October 2022. [Google Scholar]
  27. Øi, L.E.; Eldrup, N.; Adhikari, U.; Bentsen, M.H.; Badalge, J.L.; Yang, S. Simulation and cost comparison of CO2 liquefaction. Energy Procedia 2016, 86, 500–510. [Google Scholar] [CrossRef]
  28. Porter, R.T.; Mahgerefteh, H.; Brown, S.; Martynov, S.; Collard, A.; Woolley, R.M.; Fairweather, M.; Falle, S.A.E.G.; Wareing, C.J.; Nikolaidis, I.K.; et al. Techno-economic assessment of CO2 quality effect on its storage and transport: CO2QUEST: An overview of aims, objectives and main findings. Int. J. Greenh. Gas Control 2016, 54, 662–681. [Google Scholar] [CrossRef]
  29. Zhao, Q.; Li, Y.-X. The influence of impurities on the transportation safety of an anthropogenic CO2 pipeline. Process Saf. Environ. Prot. 2014, 92, 80–92. [Google Scholar] [CrossRef]
  30. Martynov, S.; Daud, N.; Mahgerefteh, H.; Brown, S.; Porter, R. Impact of stream impurities on compressor power requirements for CO2 pipeline transportation. Int. J. Greenh. Gas Control 2016, 54, 652–661. [Google Scholar] [CrossRef]
  31. Ke, J.; Oag, R.M.; King, P.; George, M.W.; Poliakoff, M. Sensing the critical point of high-pressure mixtures. Angew. Chem. Int. Ed. 2004, 43, 5192–5195. [Google Scholar] [CrossRef]
  32. Venkatarathnam, G. Density marching method for calculating phase envelopes. Ind. Eng. Chem. Res. 2014, 53, 3723–3730. [Google Scholar] [CrossRef]
  33. Babar, M.; Bustam, M.; Ali, A.; Maulud, A. Identification and quantification of CO2 solidification in cryogenic CO2 capture from natural gas. Int. J. Automot. Mech. Eng. 2018, 15, 5367–5376. [Google Scholar] [CrossRef]
  34. Peletiri, S.P.; Rahmanian, N.; Mujtaba, I.M. Effects of impurities on CO2 pipeline performance. Chem. Eng. Trans. 2017, 57, 355–360. [Google Scholar]
  35. Forbes, S.M.; Verma, P.; Curry, T.E.; Friedmann, S.J.; Wade, S.M. Guidelines for Carbon Dioxide Capture, Transport and Storage; World Resources Institute: Washington, DC, USA, 2008. [Google Scholar]
  36. Wilson, D.; Basu, R. Thermodynamic properties of a new stratospherically safe working fluid-refrigerant 134a. ASHRAE Trans. 1988, 94, 2095–2118. [Google Scholar]
  37. Kim, S.; Lim, Y.-I. Heat integration and economic analysis of dry flue gas recirculation in a 500 MWe oxy-coal circulating fluidized-bed (CFB) power plant with ultra-supercritical steam cycle. Korean Chem. Eng. Res. 2021, 59, 60–67. [Google Scholar]
  38. Kim, S.; Lim, Y.-I.; Lee, D.; Cho, W.; Seo, M.W.; Lee, J.G.; Ok, Y.S. Perspectives of oxy-coal power plants equipped with CO2 capture, utilization, and storage in terms of energy, economic, and environmental impacts. Energy Convers. Manag. 2022, 273, 116361. [Google Scholar] [CrossRef]
  39. Do, T.X.; Mujahid, R.; Lim, H.S.; Kim, J.-K.; Lim, Y.-I.; Kim, J. Techno-economic analysis of bio heavy-oil production from sewage sludge using supercritical and subcritical water. Renew. Energy 2020, 151, 30–42. [Google Scholar] [CrossRef]
  40. Vu, T.T.; Lim, Y.-I.; Song, D.; Mun, T.-Y.; Moon, J.-H.; Sun, D.; Hwang, Y.-T.; Lee, J.-G.; Park, Y.C. Techno-economic analysis of ultra-supercritical power plants using air-and oxy-combustion circulating fluidized bed with and without CO2 capture. Energy 2020, 194, 116855. [Google Scholar] [CrossRef]
  41. Turton, R.; Bailie, R.C.; Whiting, W.B.; Shaeiwitz, J.A. Analysis, Synthesis, and Design of Chemical Processes; Pearson Education: London, UK, 2018. [Google Scholar]
  42. Kemper, J.; Sutherland, L.; Watt, J.; Santos, S. Evaluation and analysis of the performance of dehydration units for CO2 capture. Energy Procedia 2014, 63, 7568–7584. [Google Scholar] [CrossRef]
  43. Botticella, F.; De Rossi, F.; Mauro, A.; Vanoli, G.; Viscito, L. Multi-criteria (thermodynamic, economic and environmental) analysis of possible design options for residential heating split systems working with low GWP refrigerants. Int. J. Refrig. 2018, 87, 131–153. [Google Scholar] [CrossRef]
Figure 1. Phase envelopes obtained from the PR EOS. Critical pressure (Pc) and temperature (Tc) of pure CO2 (thick black solid line), CO2 mixtures with 14 mol% N2 (thin blue solid line), and experimental points (circles) are shown.
Processes 12 00115 g001
Figure 2. Process flow diagram (PFD) of a CO2 compression and liquefaction (CCL) process with a flash.
Processes 12 00115 g002
Figure 3. Process flow diagram (PFD) of a CO2 compression and liquefaction (CCL) process with a distillation column.
Processes 12 00115 g003
Figure 4. Phase envelopes of pure CO2, feed without water, and liquefied CO2 products from the flash and distillation column for Feed 1.
Processes 12 00115 g004
Figure 5. Phase envelopes of the pure CO2, feed without water, and liquefied CO2 products from the flash and distillation column for Feed 2.
Processes 12 00115 g005
Figure 6. Phase envelopes of the pure CO2, feed without water, and liquefied CO2 products from the flash and distillation column for Feed 3.
Processes 12 00115 g006
Table 1. Recommended purity of CO2 mixtures for pipeline transportation and geological storage [7,10].
ComponentPurity Limits for PipelinePurity Limits for Geological Storage
DYNAMISNETL
CO2 >95.5 vol%95 vol%>90 vol%
H2O 500 ppmv300 ppmwt<500 ppmv
H2S 200 ppmv0.01 vol%<1.5%
CO2000 ppmv35 ppmv<4 vol% (all non-condensable gasses)
CH4Aquifer < 4 vol%4 vol%
N2<4 vol%
(all non-condensable gasses)
4 vol%
Ar4 vol%
H24 vol%
O2-4 vol%
NOx-100 ppmv<200 ppmv
SOx-100 ppmv<200 ppmv
NH3-50 ppmv
Table 2. Inlet conditions of three CO2-rich feeds.
Feed 1Feed 2Feed 3
Temperature (T, °C)252525
Pressure (P, barg)151515
Mass flow rate (F, kg/hr)50,06850,06850,068
Mole fraction (yi)
CO20.99130.97000.9700
CO0.00020.00000.0000
H20.00610.00000.0285
CH40.00090.00000.0000
H2O0.00150.00150.0015
N20.00000.02850.0000
Total 1.00001.00001.0000
Table 3. Process performances for CO2 compression and liquefaction (CCL) with a flash or distillation column from three different CO2-rich mixtures.
Process PerformanceFeed 1Feed 2Feed 3
FlashDistil.FlashDistil.FlashDistil.
FeedFlow rate (kg/h)
CO2 purity (mol%)
50,068
99.13
50,068
99.13
50,068
97.00
50,068
97.00
50,068
97.00
50,068
97.00
ProductFlow rate (kg/h)
CO2 purity (mol%)
50,038
99.28
46,508
99.95
42,892
97.79
45,735
99.81
33,084
98.94
46,472
99.99
CO2 recovery (%)100.093.086.193.066.293.0
Electricity consumption (kWe)CO2 compression174717471830183018671867
Cooling utilities707113964812045641396
Cooling duty after compressor (kW)242539642060412517754886
Steam consumption in reboiler (kWth)-1699-1871-2608
Table 4. Economic values of the CO2 compression and liquefaction (CCL) processes with a flash or distillation column.
Economic ValuesFeed 1Feed 2Feed 3
FlashDistil.FlashDistil.FlashDistil.
Total capital investment
(TCI, M$)
17.55 20.56 16.00 17.60 15.57 19.44
Total production cost
(TPC, M$/y)
5.96 7.17 5.80 7.10 5.68 7.69
Levelized cost of CO2 liquefaction (LCCL, $/t-CO2) 13.2417.0714.9016.9018.9018.07
Disclaimer/Publisher’s Note: The statements, opinions and data contained in all publications are solely those of the individual author(s) and contributor(s) and not of MDPI and/or the editor(s). MDPI and/or the editor(s) disclaim responsibility for any injury to people or property resulting from any ideas, methods, instructions or products referred to in the content.

