Article

Simulation Study on the Prediction of Macroscale Young’s Modulus Based on the Mesoscale Characteristics of Tight Glutenite Reservoirs

1
State Key Laboratory of Petroleum Resources and Prospecting, China University of Petroleum (Beijing), Beijing 102249, China
2
Changqing Downhole Technology Company, CNPC Chuanqing Drilling Engineering Co., Ltd., Xi’an 710018, China
3
Strategic Research Center of Oil and Gas Resources, Ministry of Natural Resources, Beijing 100034, China
*
Author to whom correspondence should be addressed.
Processes 2024, 12(1), 185; https://doi.org/10.3390/pr12010185
Submission received: 14 December 2023 / Revised: 10 January 2024 / Accepted: 12 January 2024 / Published: 14 January 2024
(This article belongs to the Special Issue Oil and Gas Drilling Rock Mechanics and Engineering)

Abstract

:
To obtain the macroscale Young’s modulus of glutenite under gravel inclusions, a numerical simulation of macroscale Young’s modulus prediction based on the mesoscale characteristics of glutenite was carried out. Firstly, the micron indentation test was used to obtain the meso-mechanical parameters of gravel and matrix in glutenite to ensure the reasonableness of the numerical simulation parameter settings; secondly, a two-dimensional glutenite physical model generation method based on the secondary development of Python was put forward; and then, the macroscale Young’s modulus variation rule of glutenite under different gravel sizes, particle size ratios, and content characteristics were analyzed using the finite element method (FEM). The results show that Young’s modulus of gravel is larger than Young’s modulus of the matrix, and Young’s modulus of different gravel and matrix has some differences. The gravel content is the main controlling factor affecting the macroscale Young’s modulus of glutenite; the gravel content and Young’s modulus of glutenite show a strong positive correlation, and the gravel size and particle size ratio have less influence on the macroscale Young’s modulus of glutenite. The difference in Young’s modulus between gravel and matrix causes the formation of local stress concentrations during loading and compression of glutenite. The smaller the gravel grain size, the higher the degree of non-uniformity of the grain size, the more likely it is to form higher local stresses. The results of the study provide a new prediction method for the prediction of the macroscale Young’s modulus of a glutenite reservoir.

1. Introduction

In recent years, significant deposits of rich, tight glutenite oil reservoirs have been discovered through domestic exploration [1,2,3], leading to successful industrial oil production using large-scale, horizontal well volume fracturing technology [4,5,6,7]. Nevertheless, accurately predicting the mechanical properties of glutenite reservoirs remains a complex challenge for effective hydraulic fracturing, primarily due to the intricate distribution of gravel [8]. Traditional methods for assessing the mechanical parameters of glutenite typically involve costly downhole core experiments such as three-point bending [9] or triaxial compression tests [10], flexural excitation testing [11], and resonance testing [12], as well as numerical simulation methods. Payan et al. [13,14] and Wichtmann et al. [15] have constructed formulas to describe the relationship between particle size distribution, particle shape and content, and the Young’s modulus of sandy and gravelly soils through extensive experimental studies. However, the downhole core experiments encounter difficulties in the core acquisition and are financially burdensome [16]. Consequently, the use of numerical simulation methods to comprehend the mechanical characteristics of glutenite presents itself as a cost-effective alternative.
Scholars from both China [17,18,19,20,21,22] and abroad [23,24,25,26,27] mainly use finite element and discrete element numerical simulation methods to model the mechanical behavior of glutenite during force loading. Guo et al. [17] established an evolutionary function between strength parameters and strain-softening parameters and simulated the dynamic stress–strain behavior of samples with different cement strengths. Zhang et al. [18] and Liu et al. [19] used the finite element method to simulate and analyze the effects of gravel size and strength characteristics on the mechanical parameters of glutenite. Ma et al. [20] utilized the discrete element method to analyze the effects of particle size and shape on glutenite mechanical properties. Lu et al. [21] conducted numerical simulations of a series of biaxial compression tests on a sandstone model, studying the influence of rock content and morphology on specimen strength at both macroscopic and microscopic scales. They found that when the gravel content is less than 60%, the inclusion of gravel may not increase peak stress. Xu et al. [22] established a random microstructure model of gravel and found a close correlation between the macroscopic mechanical behavior of specimens and their localized deformation. Akram et al. [23] treated stones as particles with different diameters, disregarding the geometric characteristics of gravel shapes, and studied the effect of gravel particle size distribution and scale effects. They found that the particle size distribution affects the mechanical response and damage mode of the specimens. Furthermore, under unchanged microstructures, the specimen size has a similar influence on the strength and elastic deformation of gravel rocks as compared to other natural rocks. Cho et al. [24,25,26] respectively established the Clump model and Cluster model to characterize the irregular shapes of minerals or gravel in rock materials. Jeong [27], based on finite element and discrete element methods, simulated and analyzed the macroscopic failure patterns of glutenite under different confinement pressures, weak cement interfaces, and rock sample sizes. Previous research has conducted extensive numerical simulation studies on the macroscopic mechanical parameters and mechanical behavior predictions of glutenite fracture characteristics, enriching the understanding of the mechanical properties of tight glutenite. However, the characterization of complex gravel features in the research is not comprehensive enough, and the influence of different gravel matrix support pattern types on the macroscopic Young’s modulus still requires further study.
In this work, the authors established a series of different glutenite physical models based on a stochastic algorithm and conducted triaxial compression finite element simulation experiments to study the variation patterns of Young’s modulus in glutenites with different gravel inclusions. Using micron indentation testing techniques [28,29,30] to obtain the microscale indentation Young’s modulus of gravel and matrix, different physical models of glutenite with varying gravel particle sizes, size distributions, and contents were constructed. Through finite element numerical simulation of compressed glutenite, the study analyzed the influence of different gravel intermixing characteristics on the macroscopic Young’s modulus of glutenite. The research findings are expected to supplement and improve the understanding of the mechanical properties of gravel-intermixed glutenite, providing a fundamental theoretical basis for predicting the macroscopic Young’s modulus of tight glutenite reservoirs.

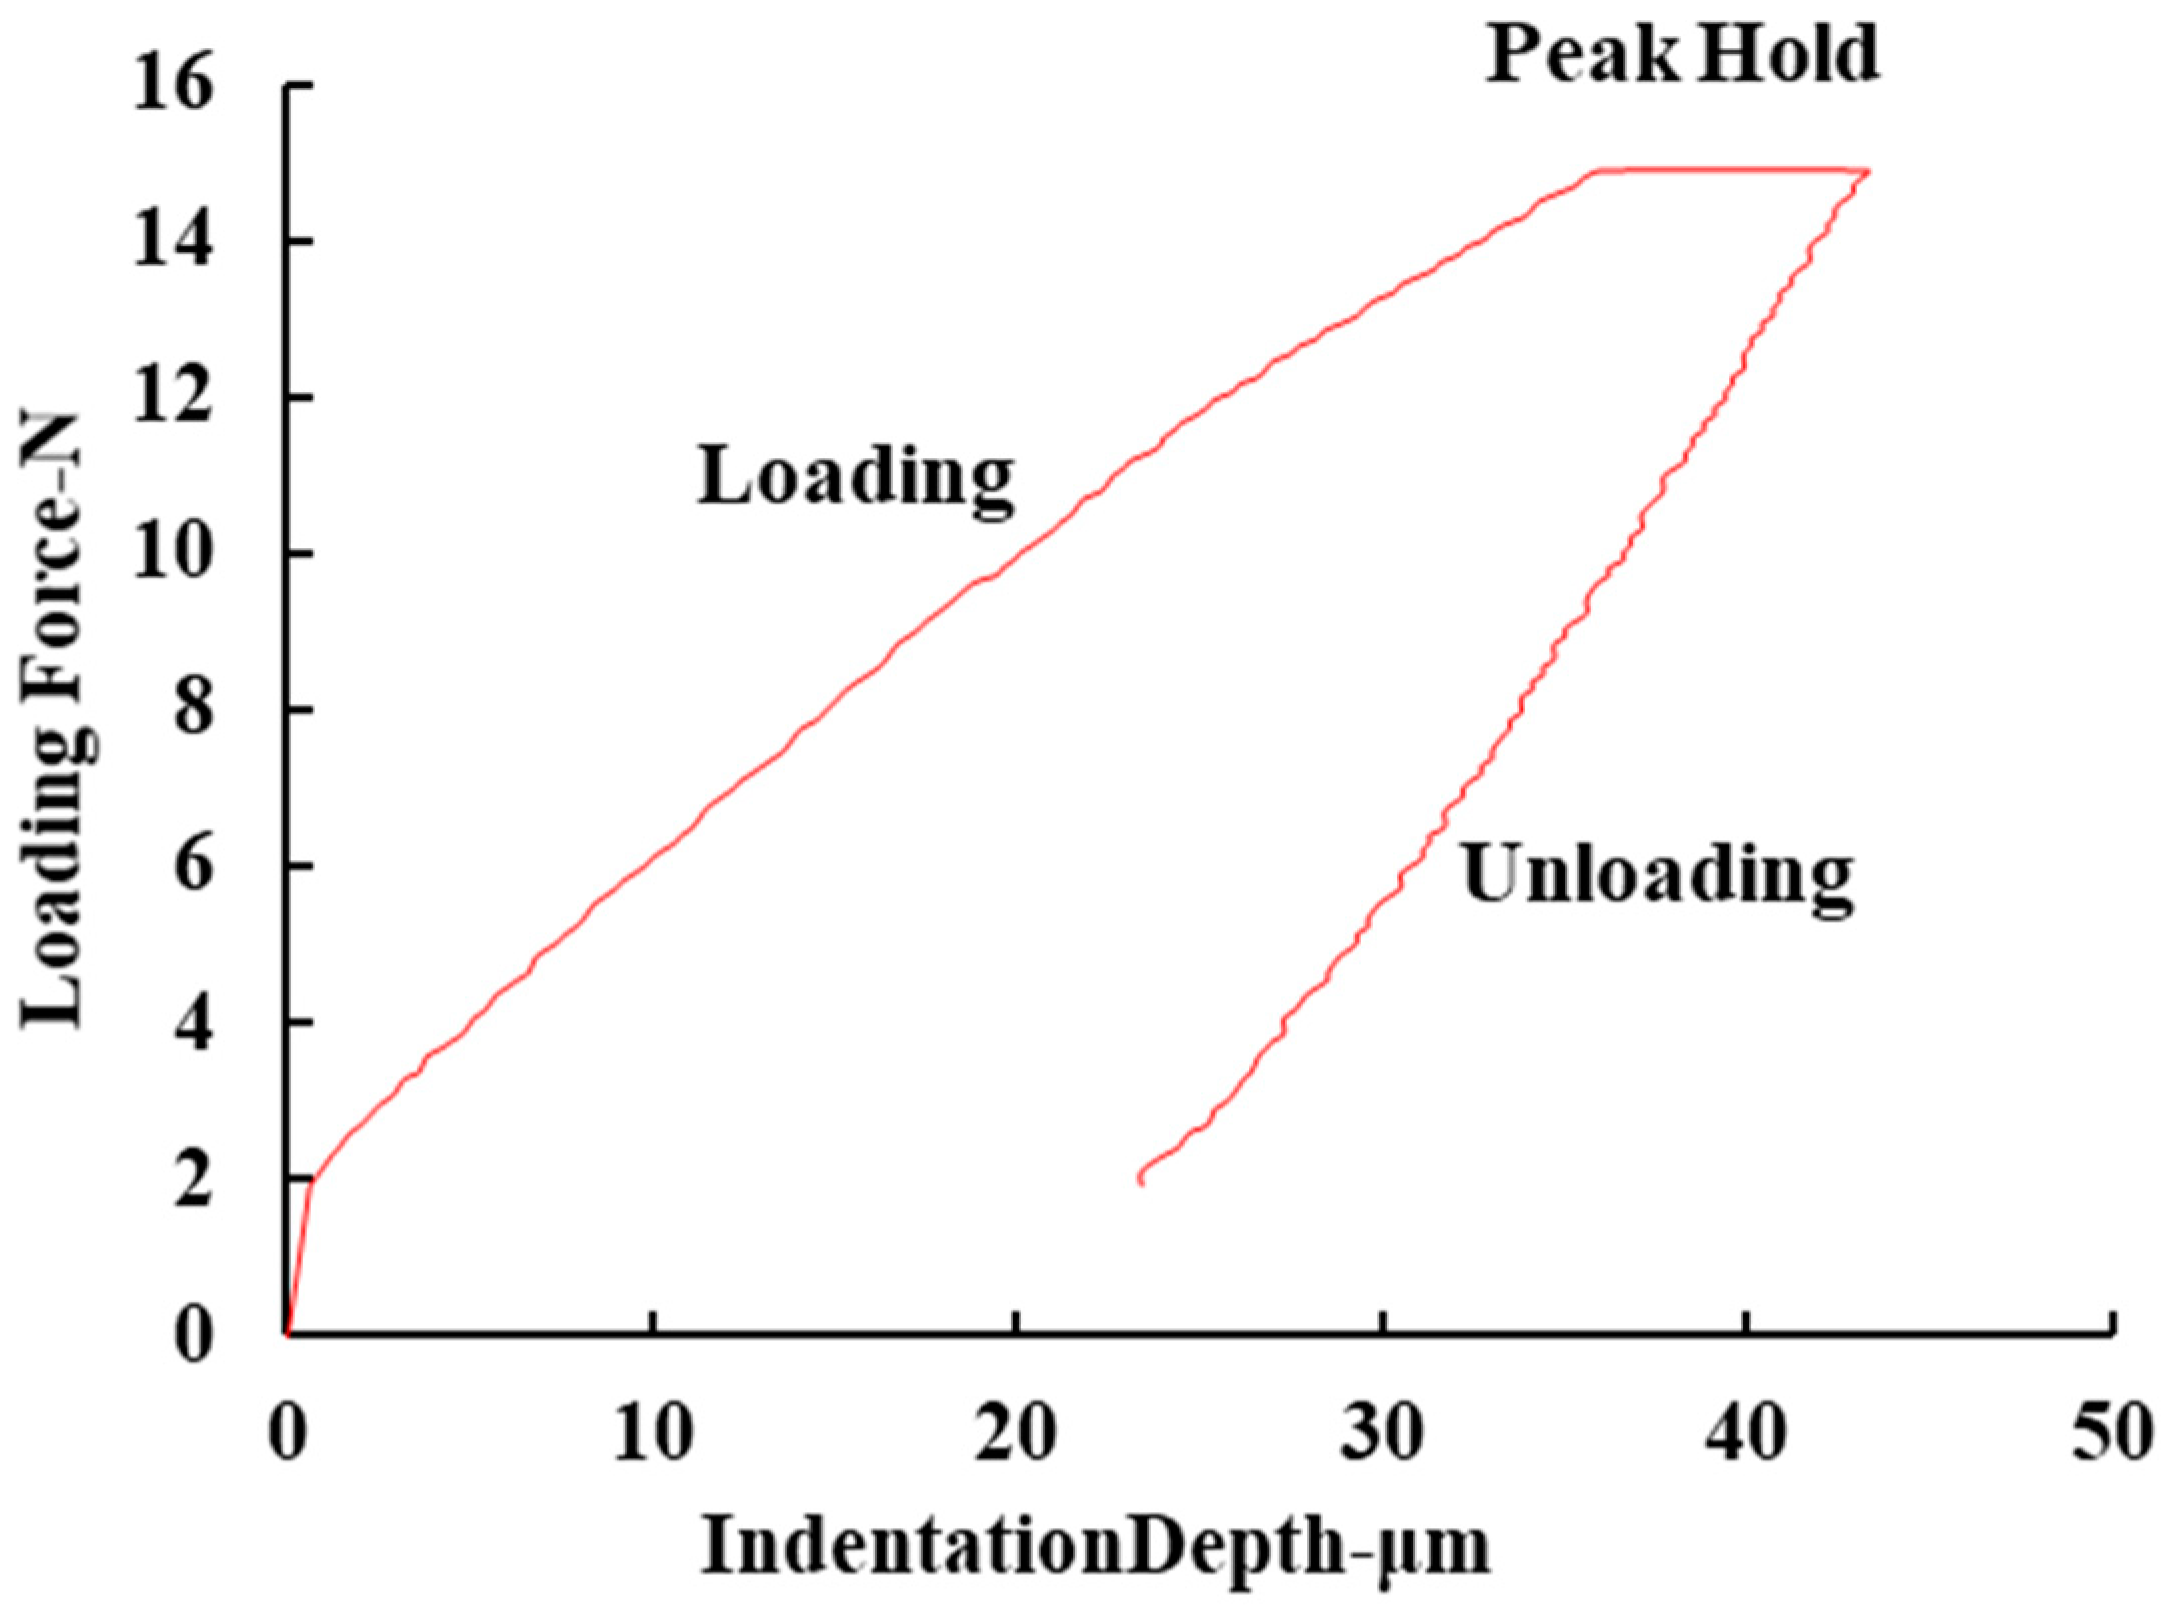
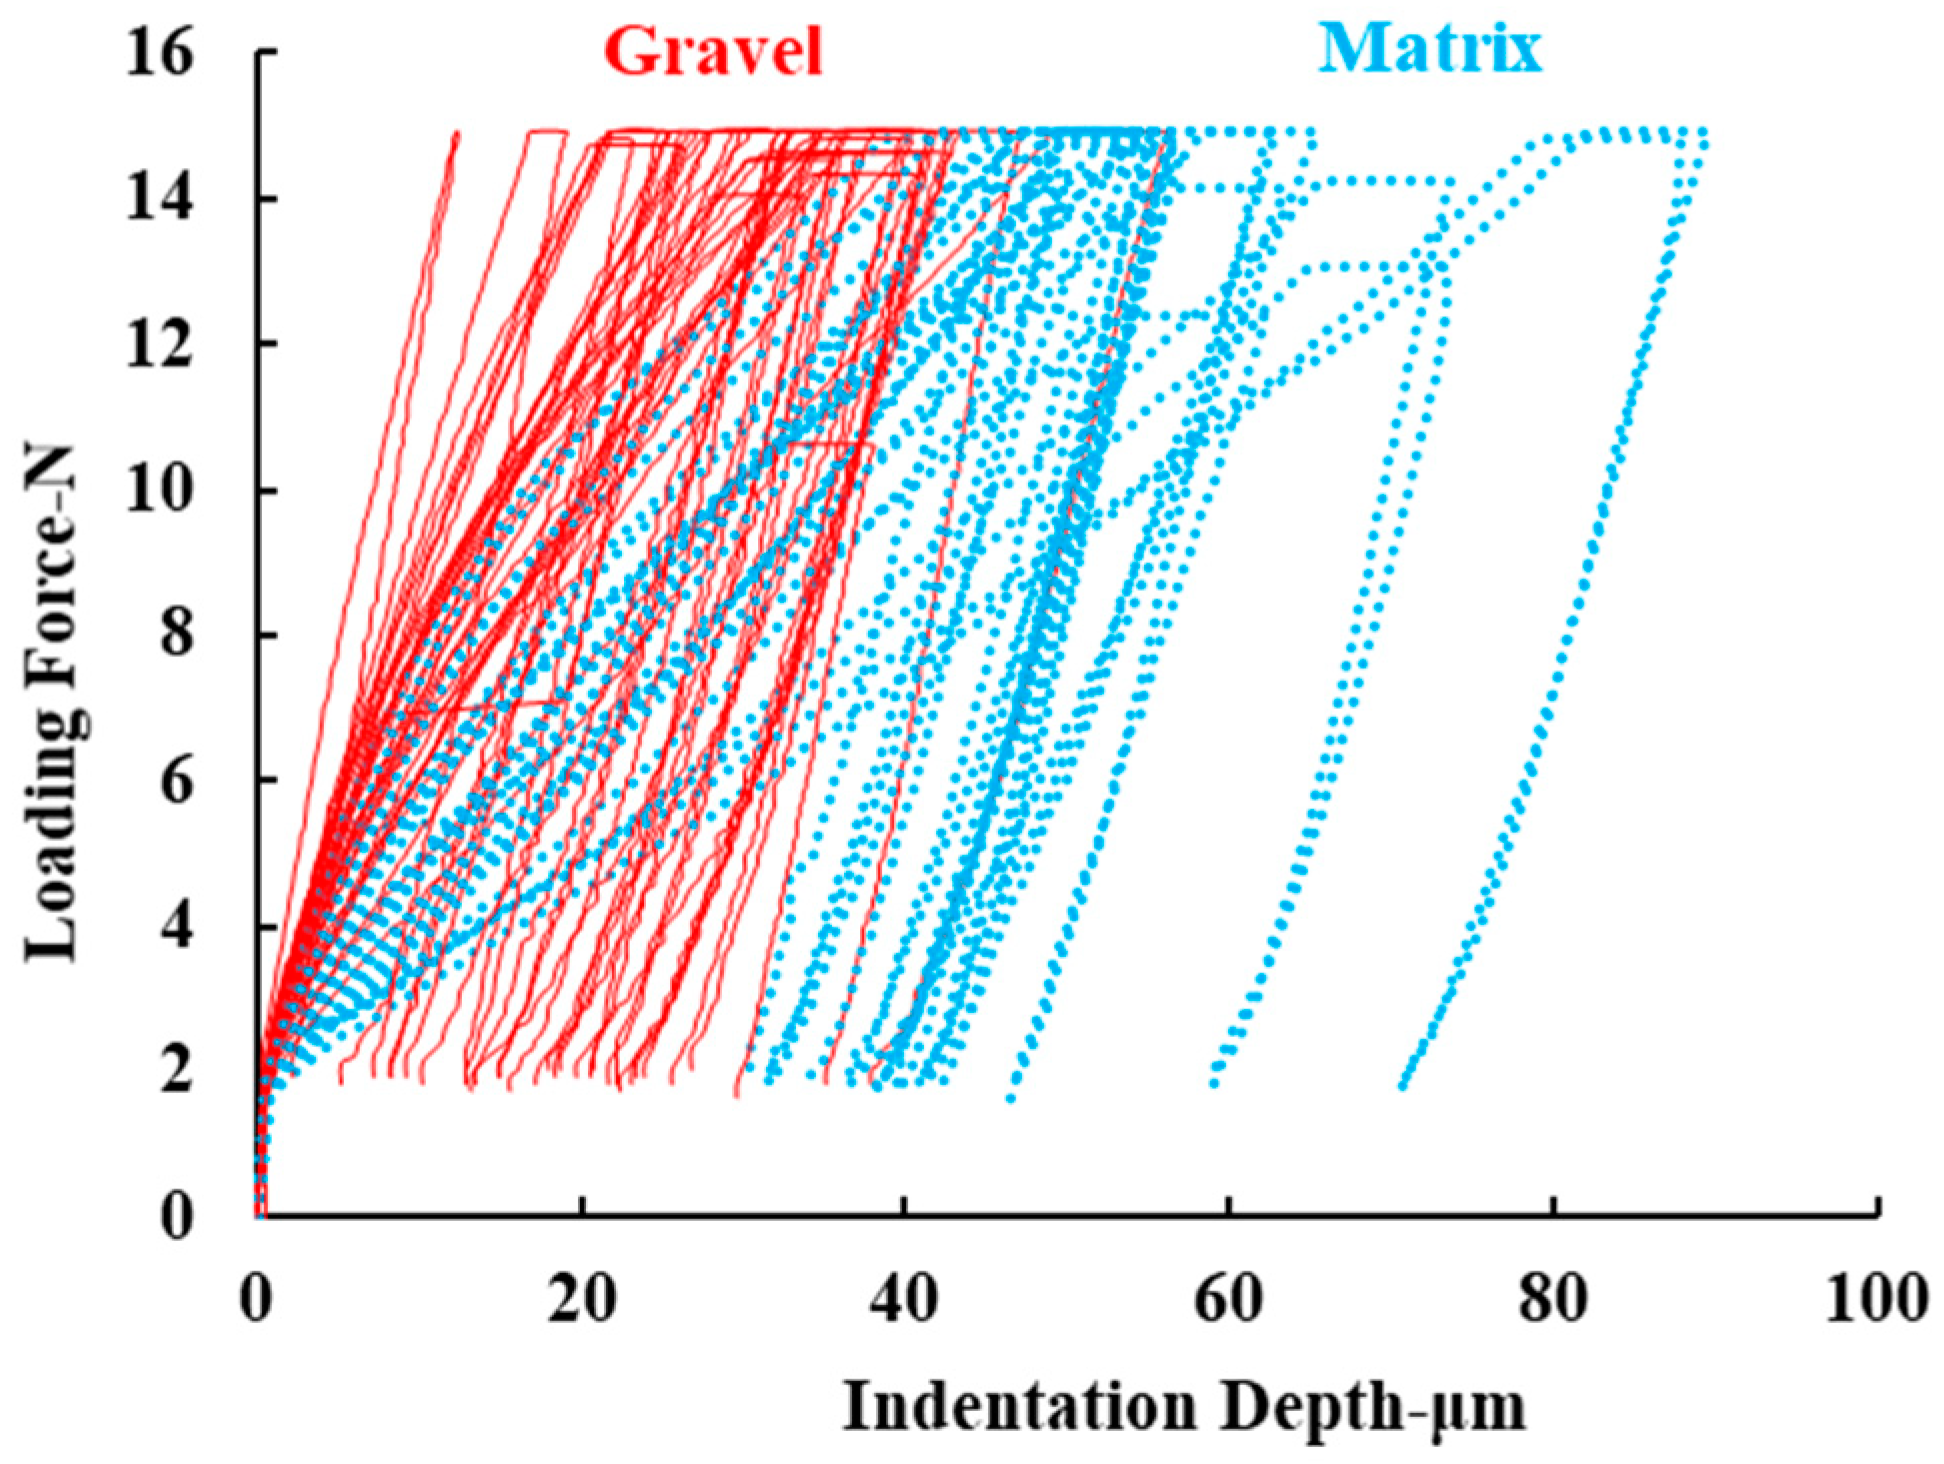
2. Obtaining Microscale Mechanical Parameters of Glutenite

Using the MFT-4000 multifunctional material surface performance tester (as shown in Figure 1) to conduct microscale mechanical parameter tests on the gravel and matrix of glutenite, the experimental loading/unloading rate referenced in [29] is set at 10 N/min. The maximum loading force in the experiment is 15 N, and the peak holding time at maximum load is 5 s. The small cylindrical sample with a diameter of ϕ25 mm and a height of 10 mm was used for the experiment, and the core was taken from the tight glutenite of the Junggar basin, NW China. Core samples obtained from underground were subjected to triaxial compression tests, determining that Young’s modulus of the entire core section ranges from 26.18 to 44.08 GPa, compressive strength from 176.27 to 274.90 MPa, and Poisson’s ratio from 0.18 to 0.39. Samples with different Young’s moduli were prepared at intervals of 5 GPa for micro-indentation experiments. The load–displacement relationship (as shown in Figure 2) of gravel and matrix was obtained by using the grid point array method (as shown in Figure 1) for indentation.
This study focuses on the linear elastic characteristics of glutenite. Therefore, the experiment used the Oliver–Pharr (O-P) method [31] to calculate the Young’s modulus of gravel and matrix. The specific calculation method is shown in Equations (1) and (2).
S = d P d h = 2 β π E r A
E r o c k = 1 ν 2 1 E r 1 ν i 2 E i
where S is the contact stiffness (N/m); β is a constant related to the shape of the indenter, with a value of 1.034; A is the contact area (m²); Er is the indentation modulus at the test point (Pa); Ei is the indentation modulus of the indenter (Pa), with a value of 1140 GPa; ν is the Poisson’s ratio of the indenter; νi is the Poisson’s ratio of the indenter, with a value of 0.25.
Figure 3 shows the load–displacement curves for the indentation experiments of gravel and matrix, and Figure 4 displays the distribution of Young’s modulus at the indentation points. The load–displacement curves for gravel and matrix exhibit distinct differentiation, with the overall Young’s modulus of gravel being higher than that of the matrix. The Young’s modulus distribution range of gravel is relatively large, ranging from 24.95 to 82.68 GPa, with an average of 47.42 GPa. Meanwhile, the Young’s modulus distribution range of the matrix is relatively smaller, ranging from 10.24 to 33.73 GPa, with an average of 20.61 GPa.

3. Finite Element Numerical Simulation

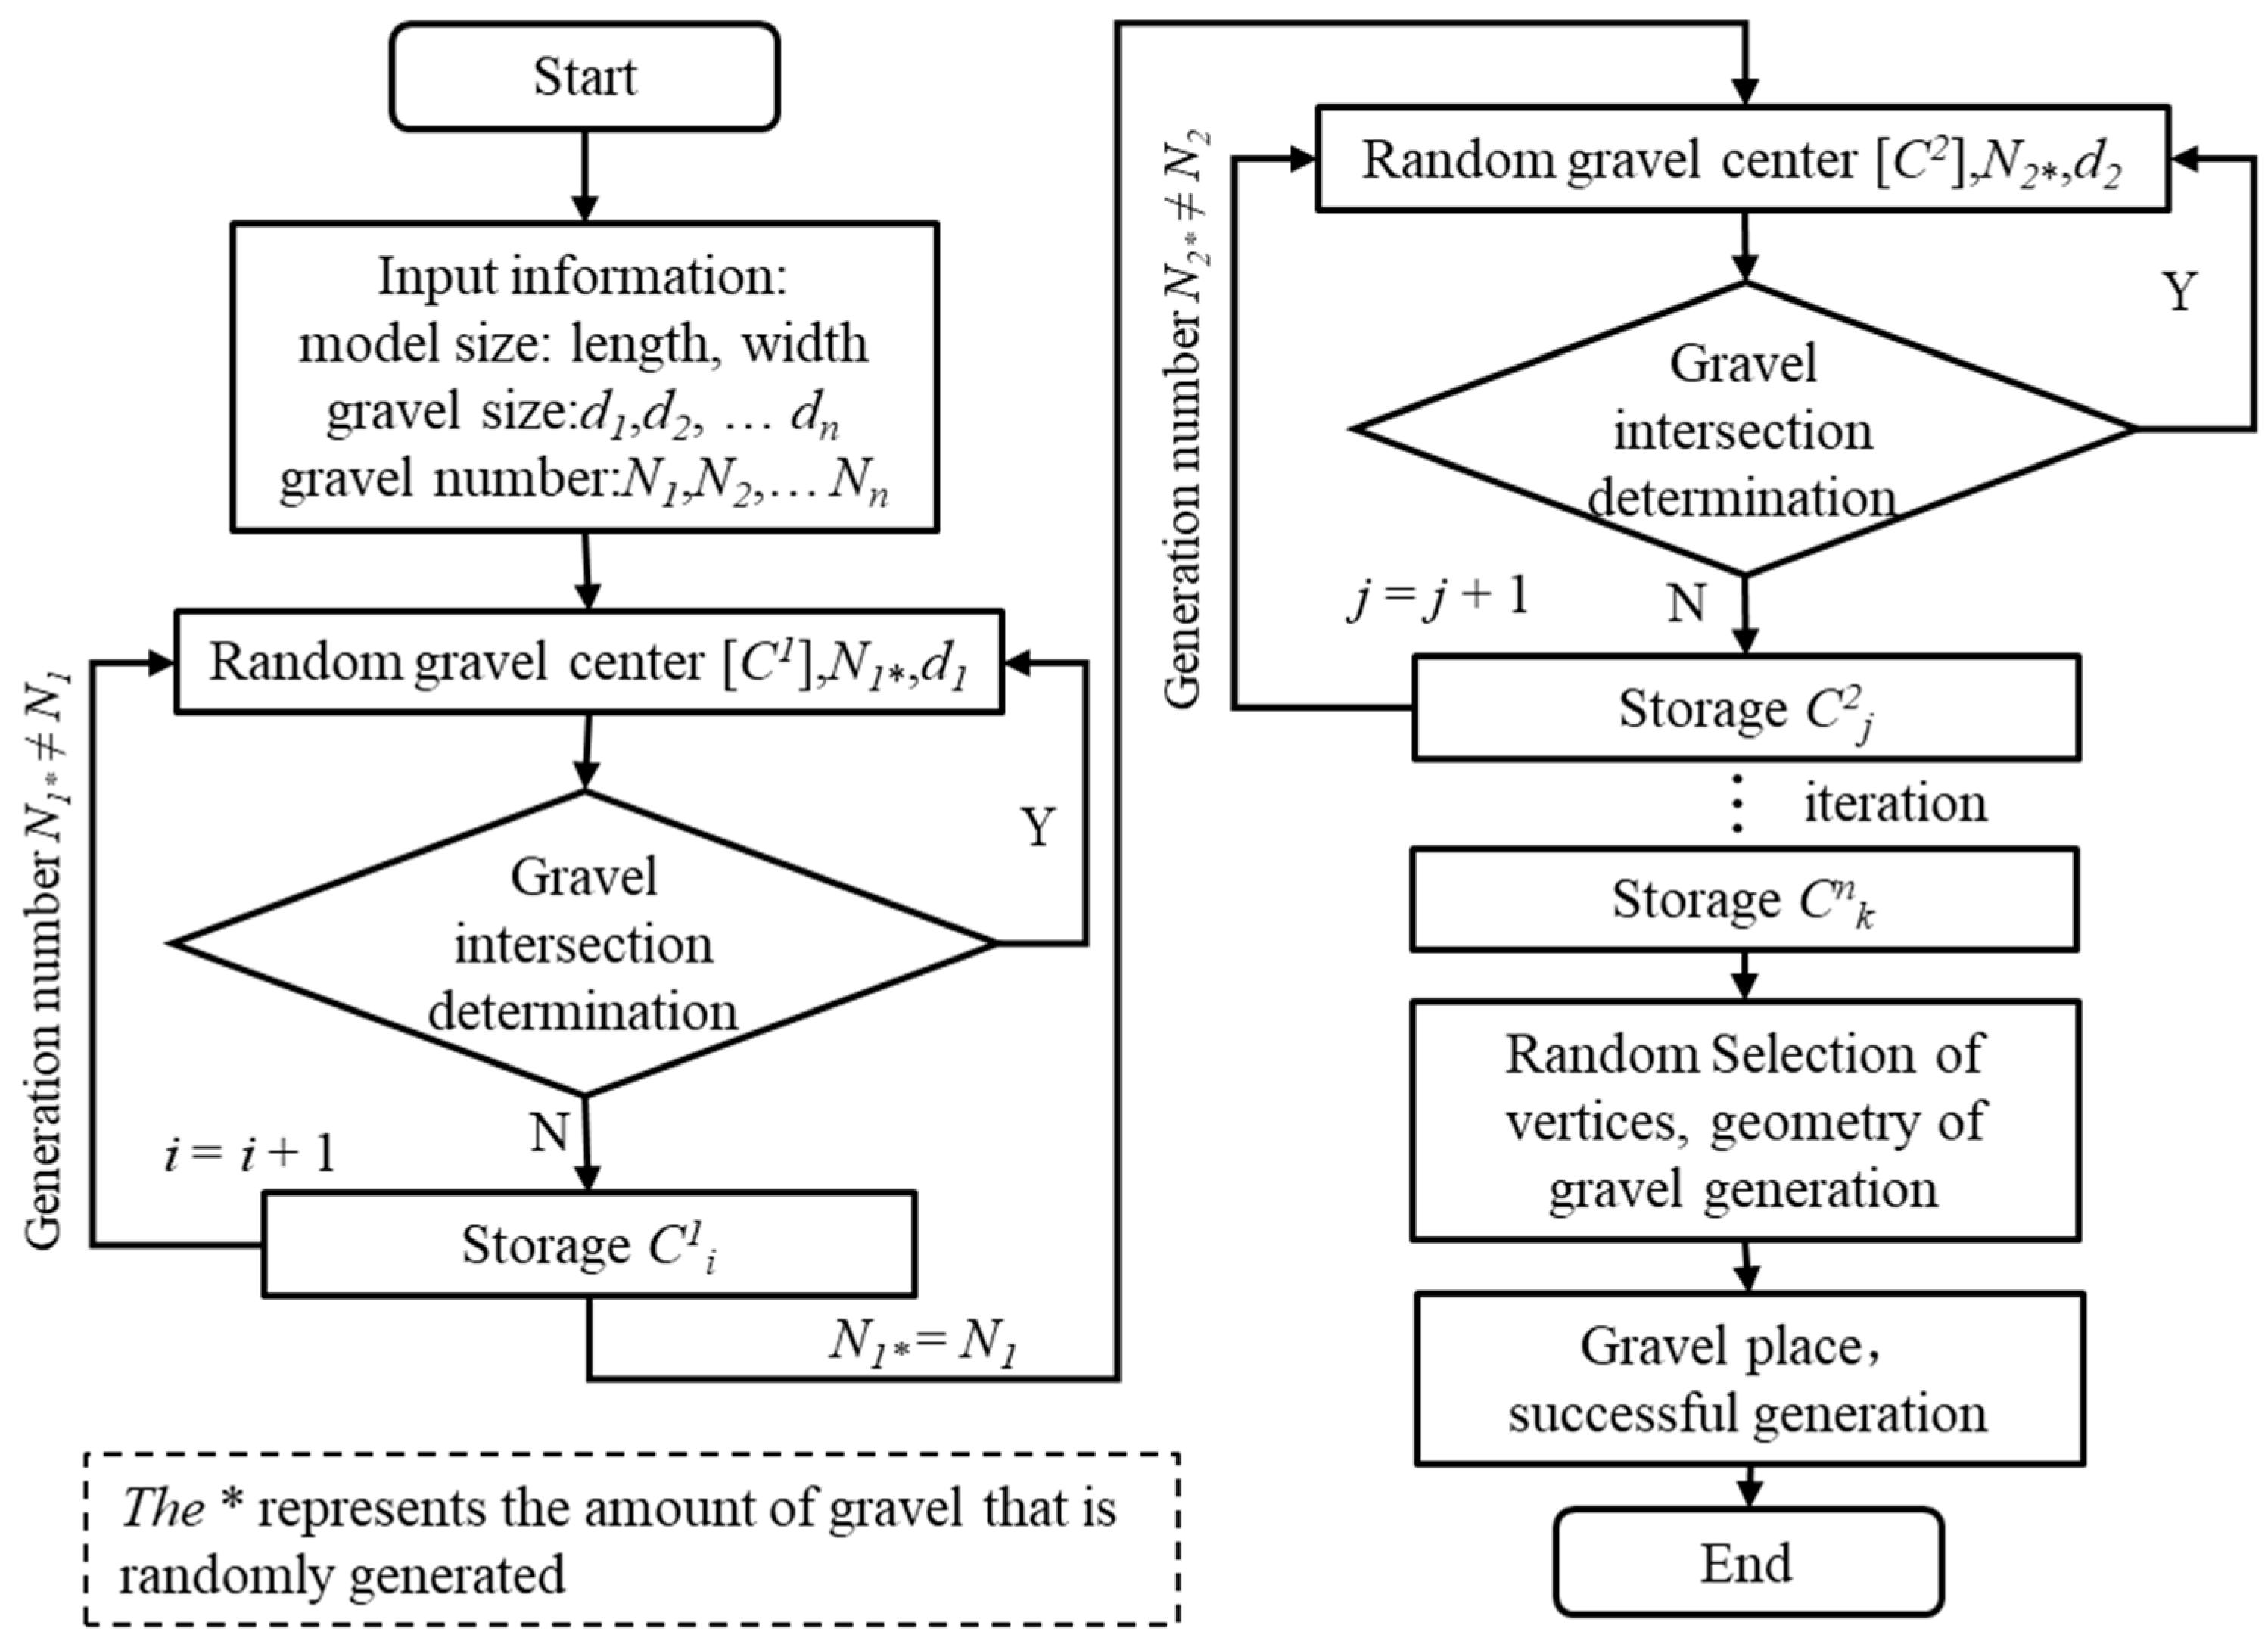
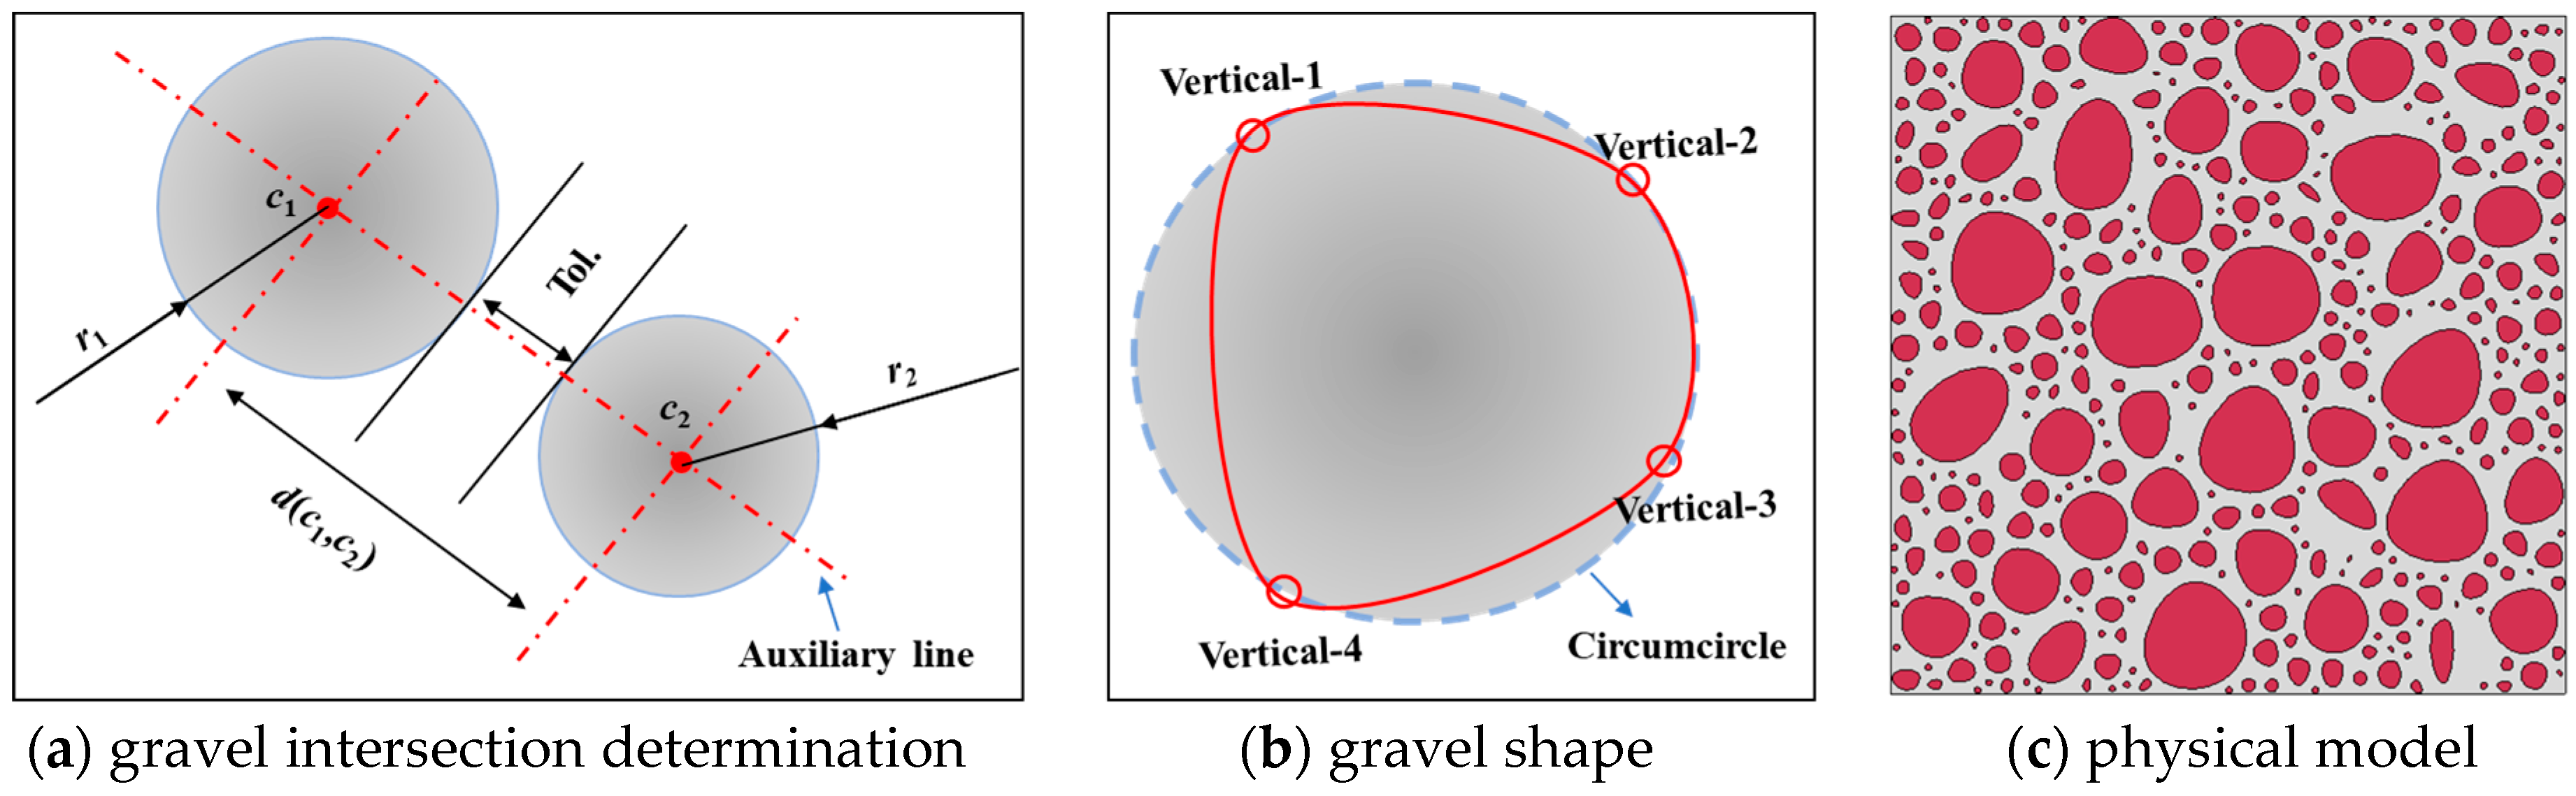
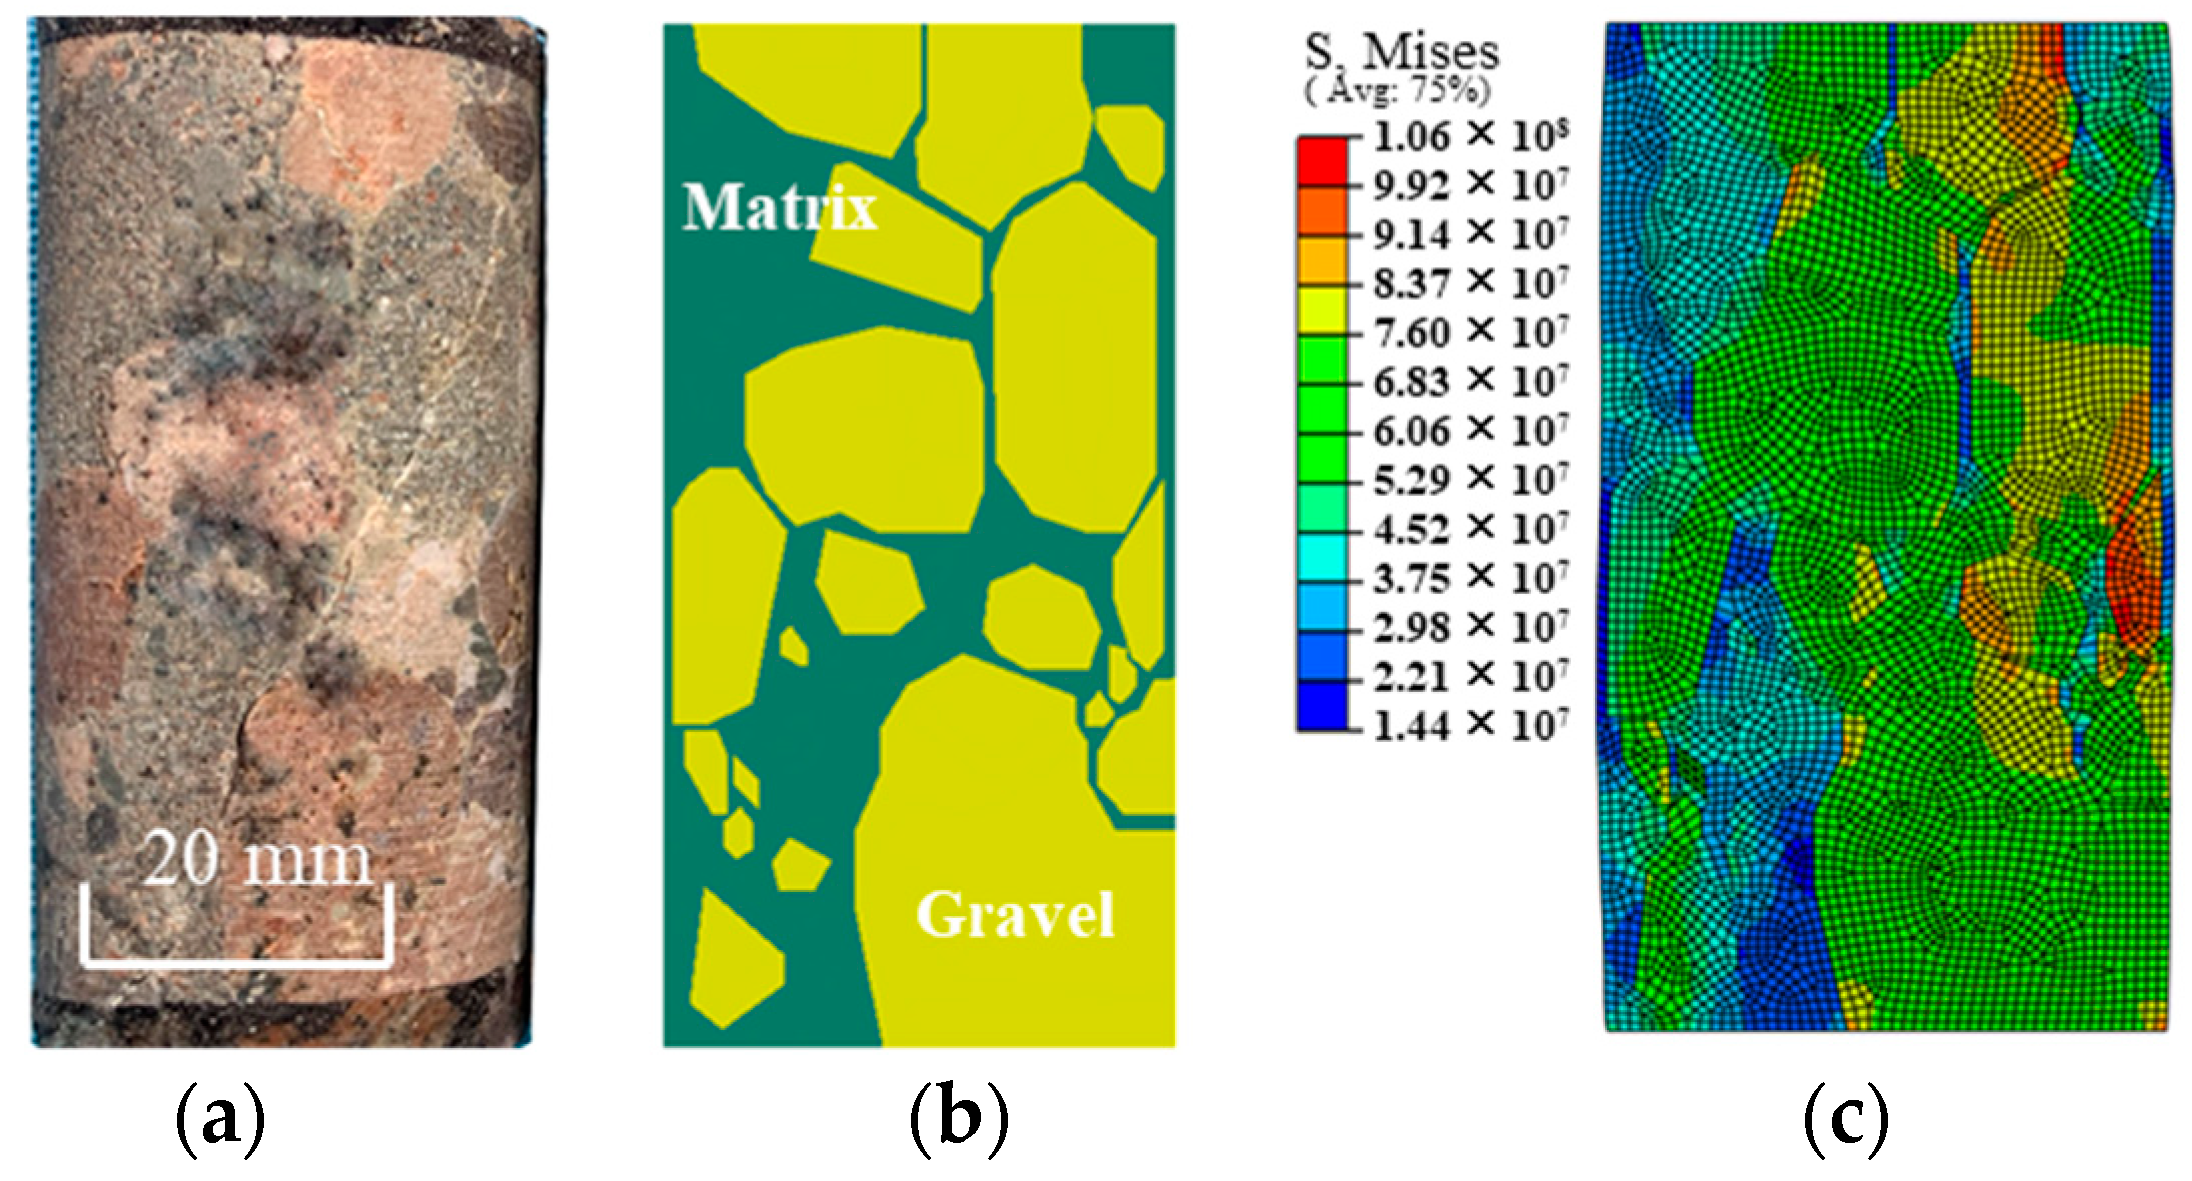
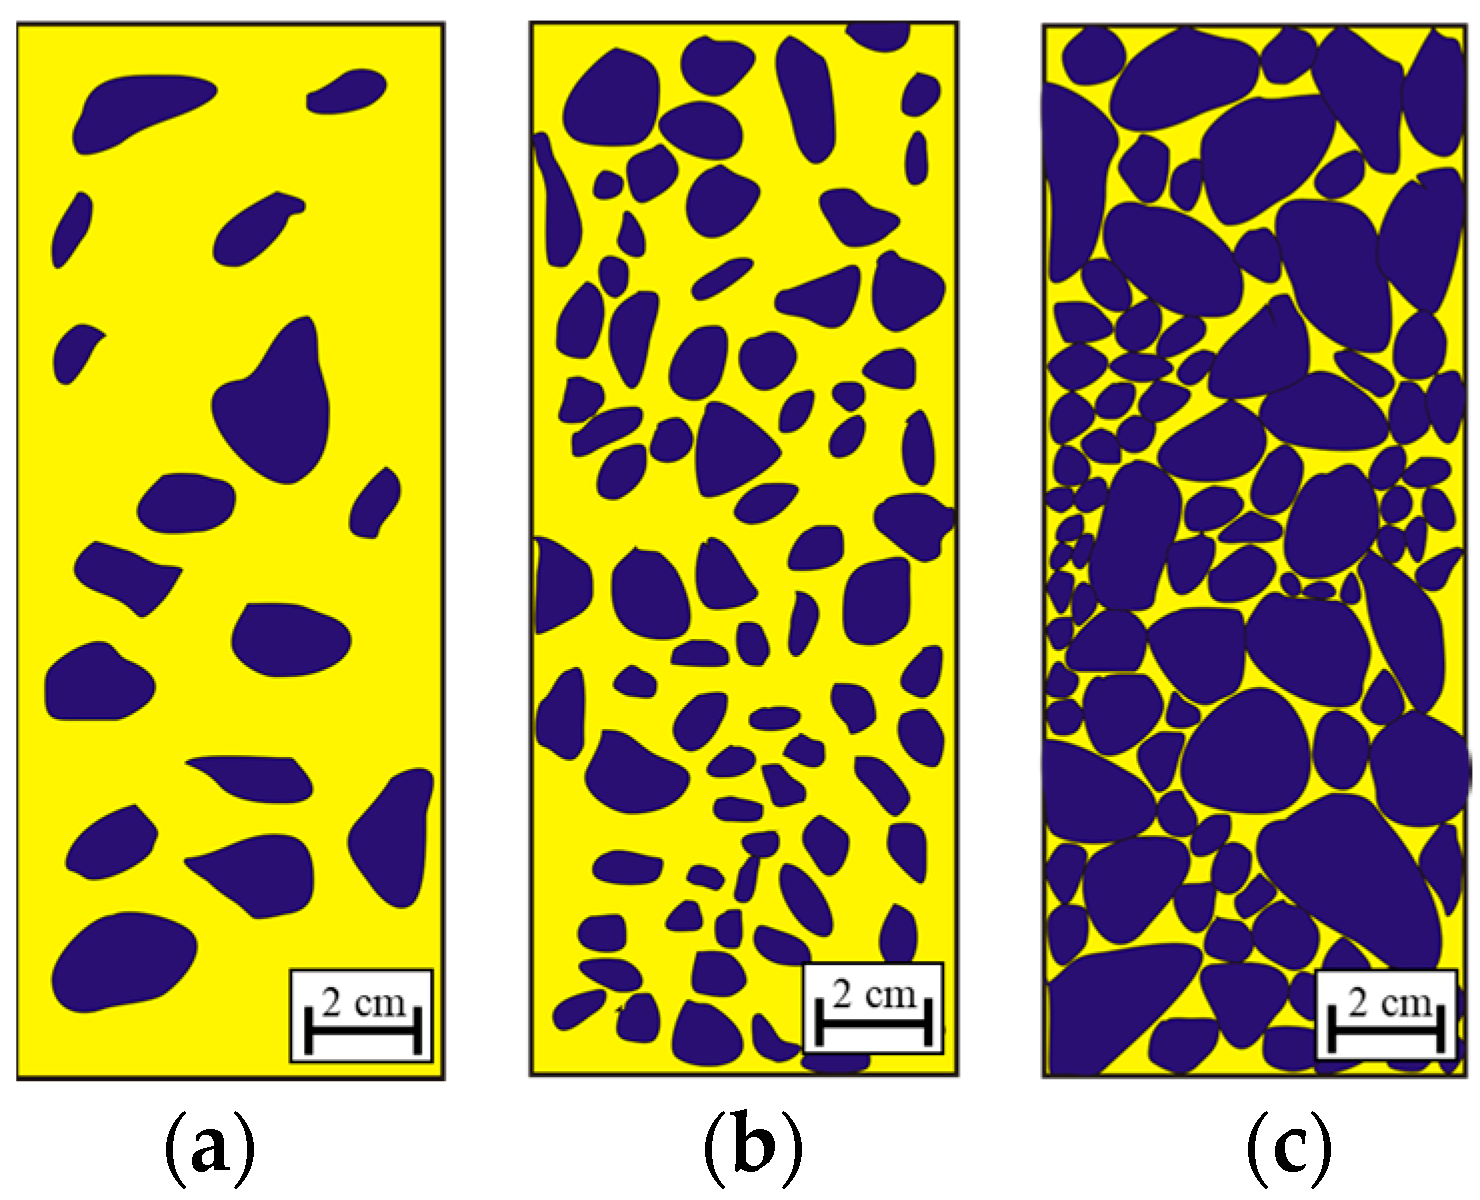
3.1. Glutenite Modeling

The sorting of gravels in glutenite is poor, and there is a large difference in particle size and geometric shape distribution. The arrangement of gravels is complex, making it difficult to describe them effectively. This study constructs a two-dimensional physical model of the glutenite based on Python secondary development. The specific modeling process is shown in Figure 5, and the generated two-dimensional physical model of the glutenite is shown in Figure 6c. The construction of the two-dimensional model includes two core steps: (1) determining whether gravels intersect based on the relationship between the centroid distance (d) and the sum of two circle radii (c1 + c2), with a certain tolerance (Tol.), as shown in Figure 6a; (2) based on the generated circular gravels, randomly selecting a certain number of points on the circle to construct a closed curve, forming irregular gravel particle shapes, as shown in Figure 6b. In addition, the gravel content in the two-dimensional glutenite physical model can be obtained by image processing technology (pixel statistics).

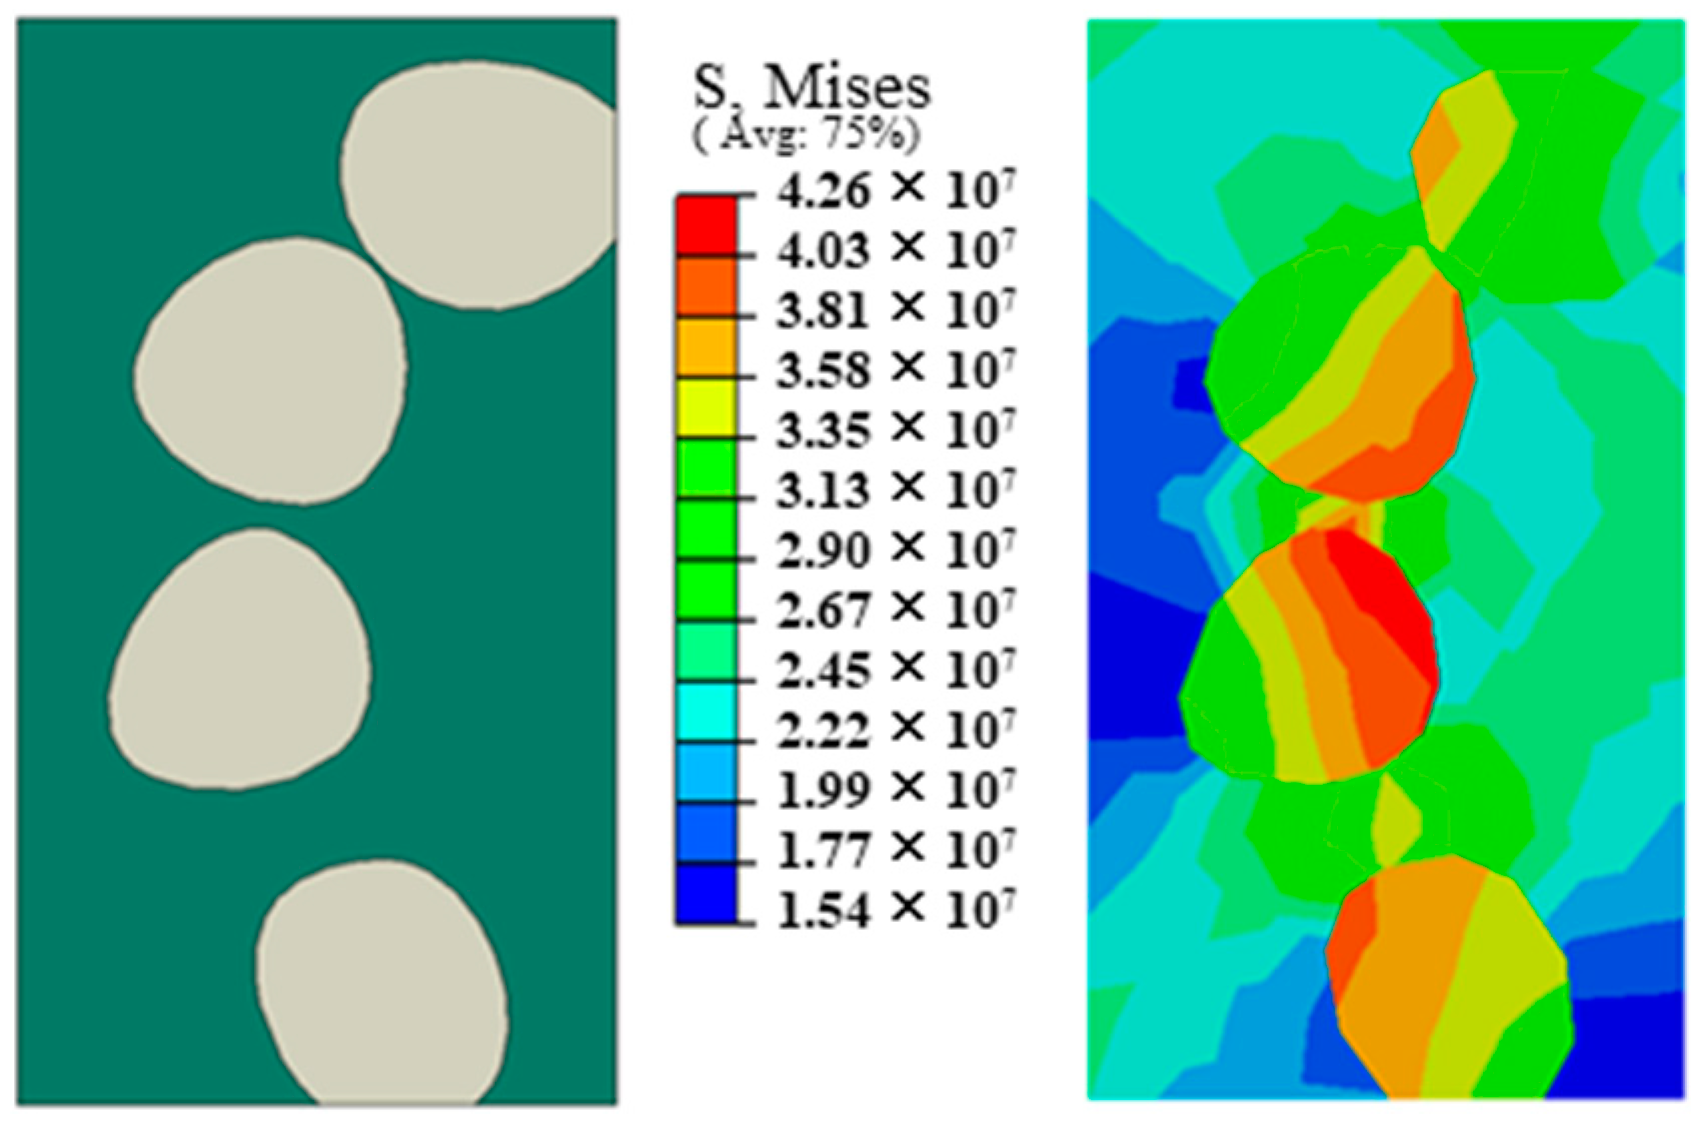
3.2. Numerical Implementation and Scheme

To predict the macroscopic Young’s modulus of glutenite, it is only necessary to study the linear elastic stage of the compression loading process of glutenite. Therefore, with the assistance of the ABAQUS platform, a 2D static linear elastic quasi-three-axis compression numerical model was established. As indicated in [32], the size effect affects the mechanical properties of the glutenite, suggesting that the sample size should not be less than 10 cm. Therefore, the model size in this study was set to 10 cm × 20 cm, and triangular solid elements (CPS3) were used for mesh division. To ensure mesh quality, the spacing between mesh nodes was set at 0.1 to 0.5 mm. Following the quasi-three-axis compression experimental loading process, the top of the specimen was subjected to loading displacement while the bottom was fixed. The model loading simulation used an implicit solution algorithm to handle the displacement and load relationship. In the simulation, the loading displacement was set to 0.2 mm, and the confining pressure was set at 30 MPa. The Young’s modulus of the gravel and matrix in the glutenite was taken as the mean value, obtained from micrometer indentation tests. The Young’s modulus of the gravel was taken as 47.72 GPa, with a Poisson’s ratio of 0.25, while the Young’s modulus of the matrix was taken as 20.61 GPa, with a Poisson’s ratio of 0.3. To explore the macroscopic Young’s modulus characteristics of glutenite with different gravel inclusion features, the focus was primarily on the gravel size, size distribution, and gravel content. Five gravel sizes were set (as shown in Figure 7), namely, 1 cm, 2 cm, 3 cm, 4 cm, and 5 cm, and different gravel contents were also set. A total of 205 gravel size distribution ratios were established, as shown in Figure 8, and the number of samples with different gravel contents conformed to a normal distribution, as shown in Figure 9. The coefficient of uniformity of the particle size distribution (C) (Equation (3)) was introduced to characterize the particle size distribution characteristics. A C of 0.1 to 0.3 is considered ideal, and when it exceeds 0.3, the uniformity of particle distribution is considered poor. The calculation for C is
C = ( P i ) 2
where C represents the coefficient of uniformity of the particle size distribution, and Pi represents the quantity proportion of various particle sizes, which is dimensionless.

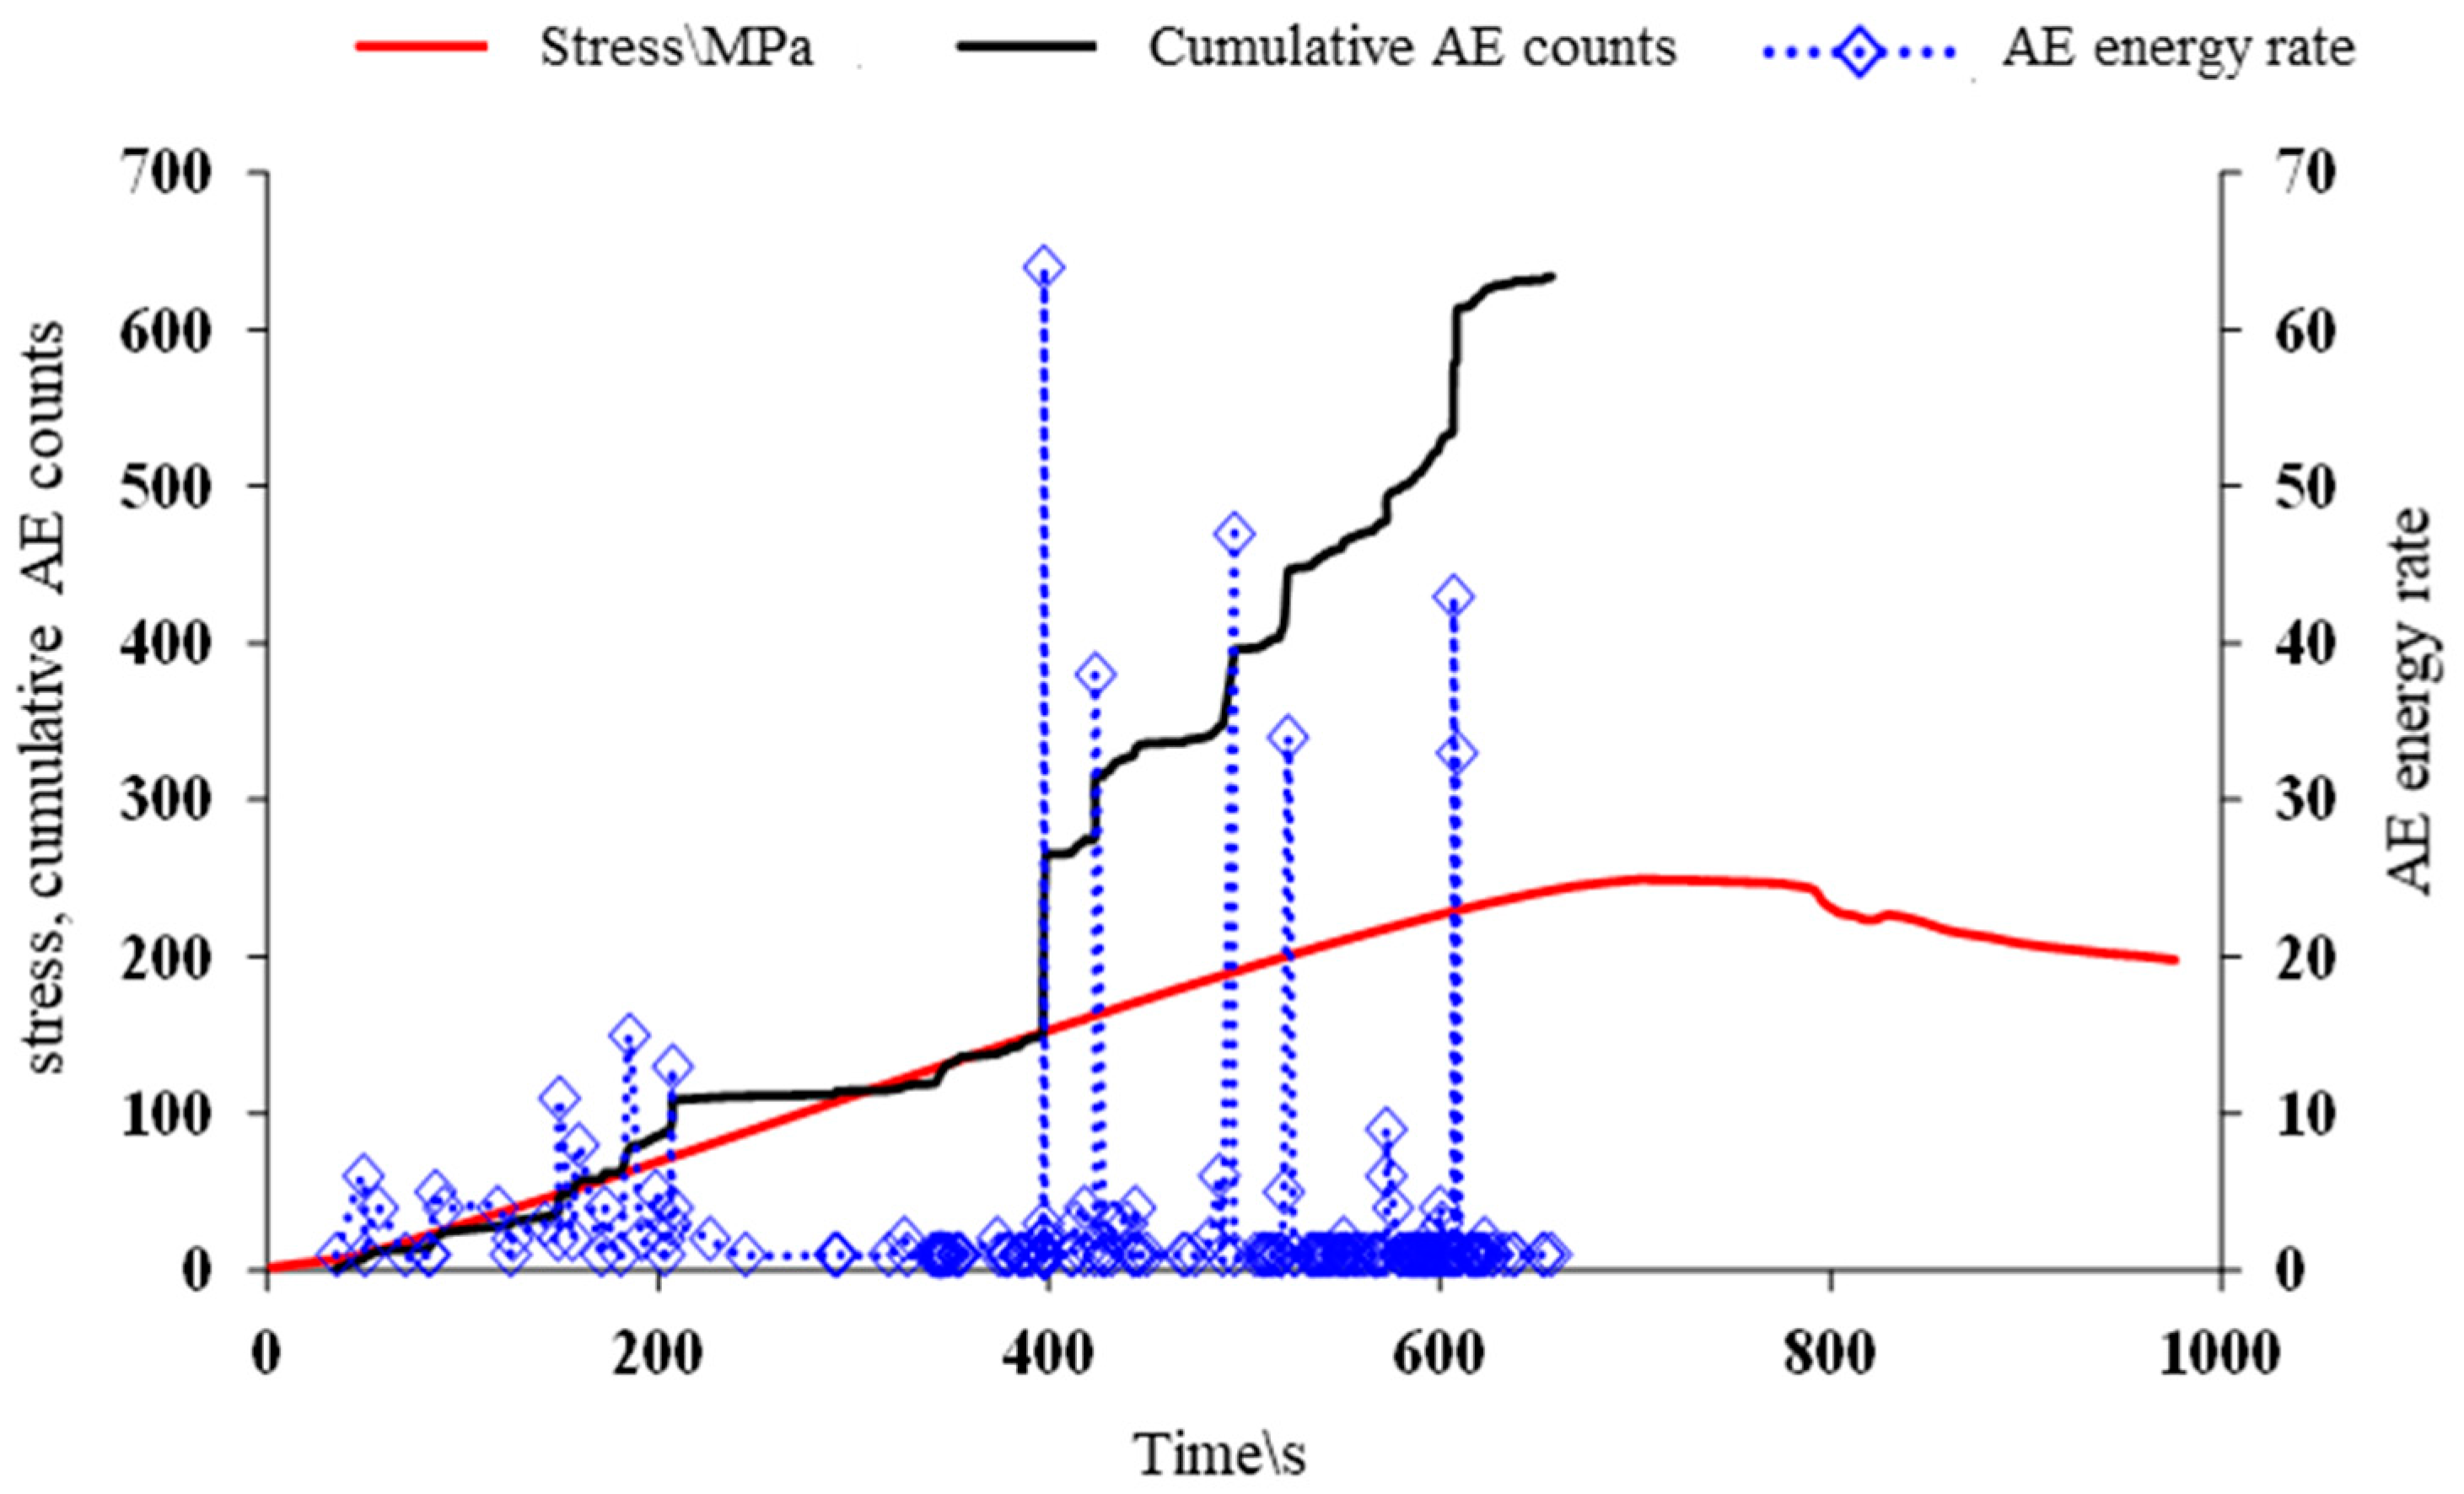
3.3. Numerical Verification

To validate the numerical simulation method for predicting the macroscopic Young’s modulus of glutenite, a compression experiment was conducted, and a stress–strain curve-fitting analysis was performed during the linear elastic phase of the rock compression experiment. Combining compression acoustic emission monitoring and stress–strain curves, it was found that the rock sample was in the stage of crack closure compaction and linear elasticity during the first 400 s of the loading process [33,34], as shown in Figure 10. With the aid of image processing technology to identify the gravel and matrix in the rock core and construct an equivalent physical model, compression experiments were conducted, as depicted in Figure 11. The equivalent model used CPS3 triangular solid elements for mesh division, with a mesh node spacing of 0.2 mm, a loading displacement of 0.15 mm, and a confining pressure set to 30 MPa, according to the experimental conditions. As shown in Figure 11c, the stress distribution of gravel and matrix exhibits a significant difference in magnitude with localized stress concentration. Through parameter sensitivity analysis, when the matrix Young’s modulus was 15 GPa and the gravel Young’s modulus was 70 GPa, the numerical simulation results could fit well with the linear elastic phase of the uniaxial compression experiment, as shown in Figure 12. The fitted parameters fell within the range of micron indentation test values, and the fitting results matched the values of gravel and matrix Young’s modulus based on the upscaling method predicted in the literature [32].

4. Results

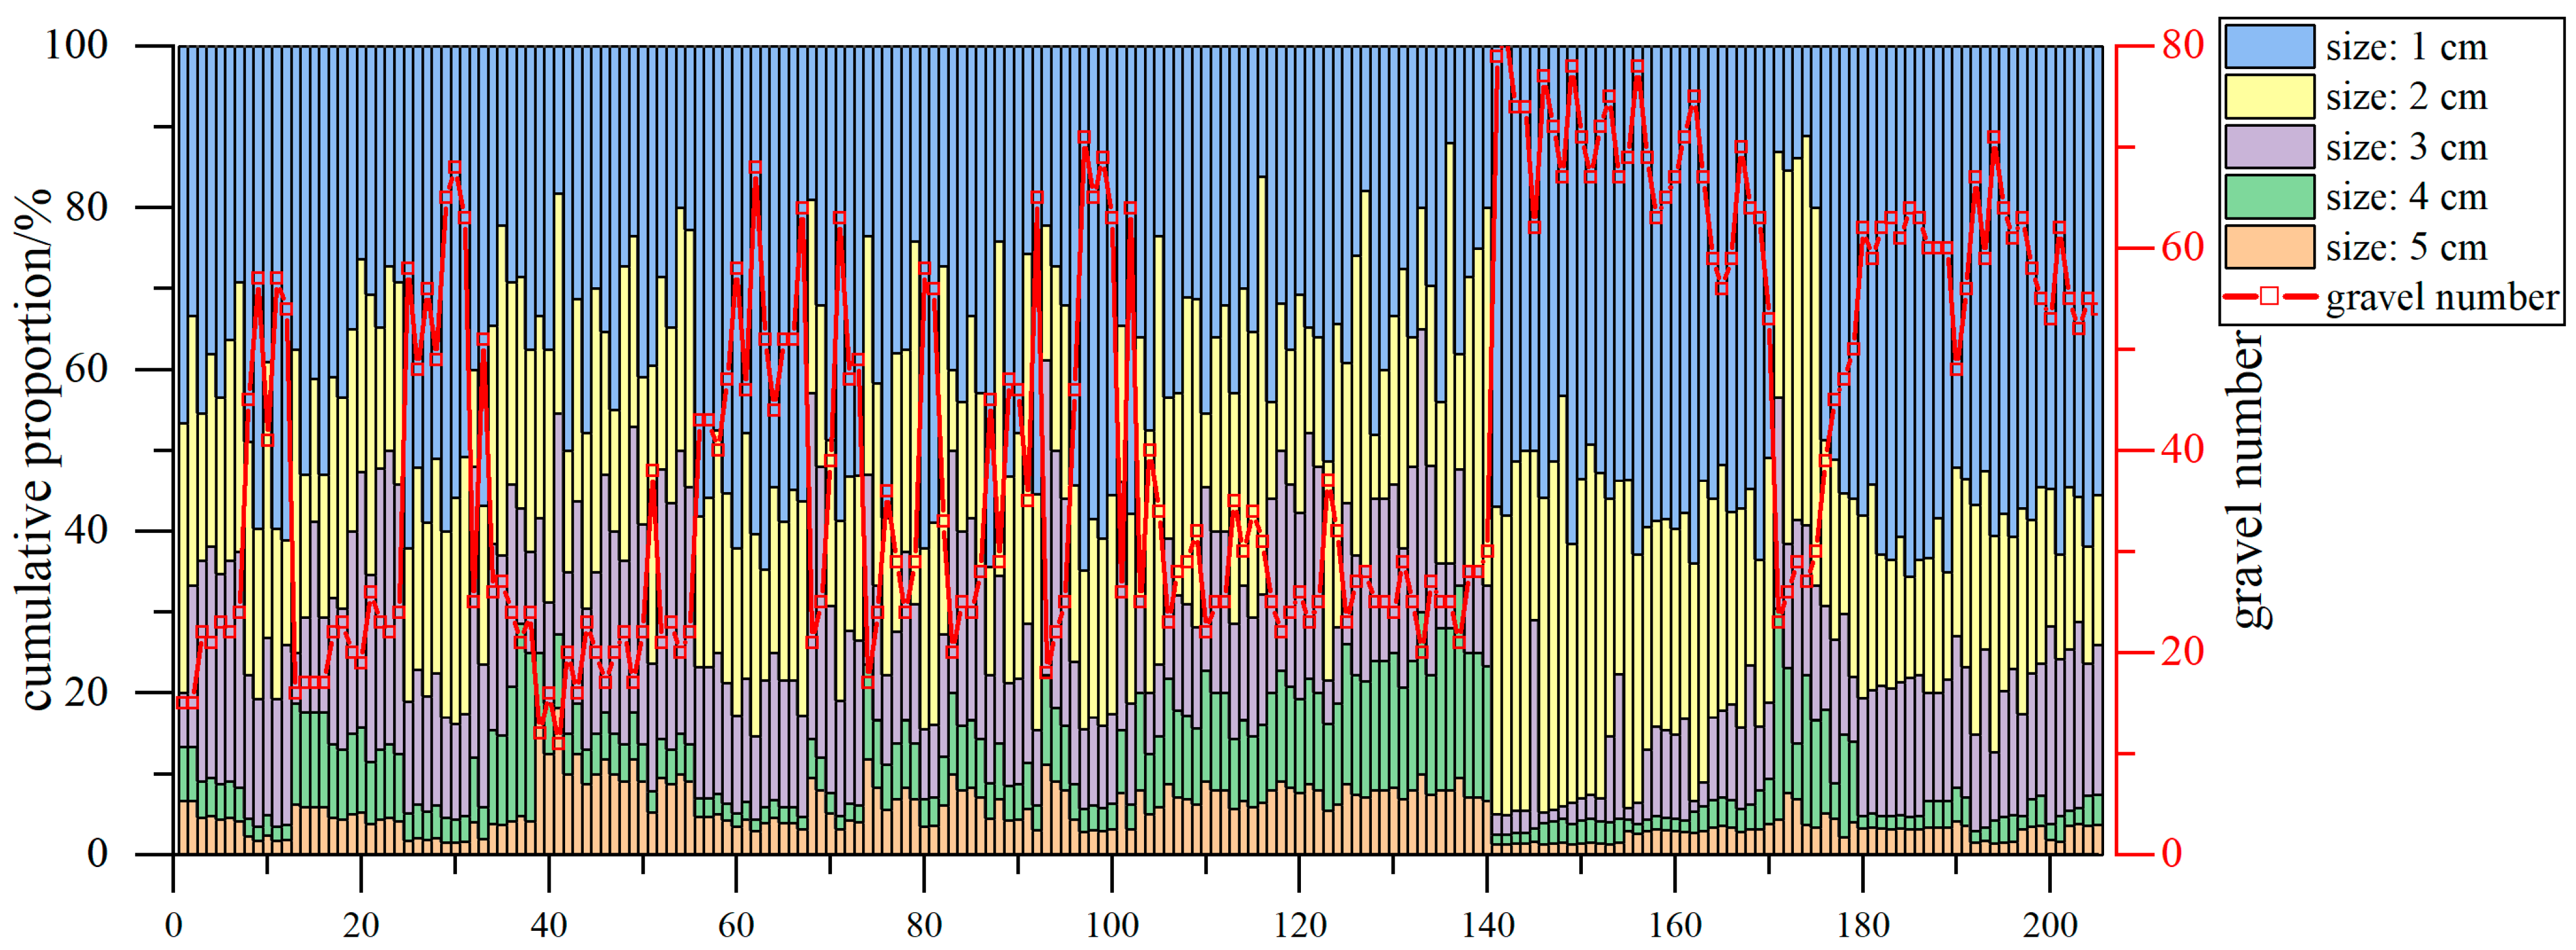
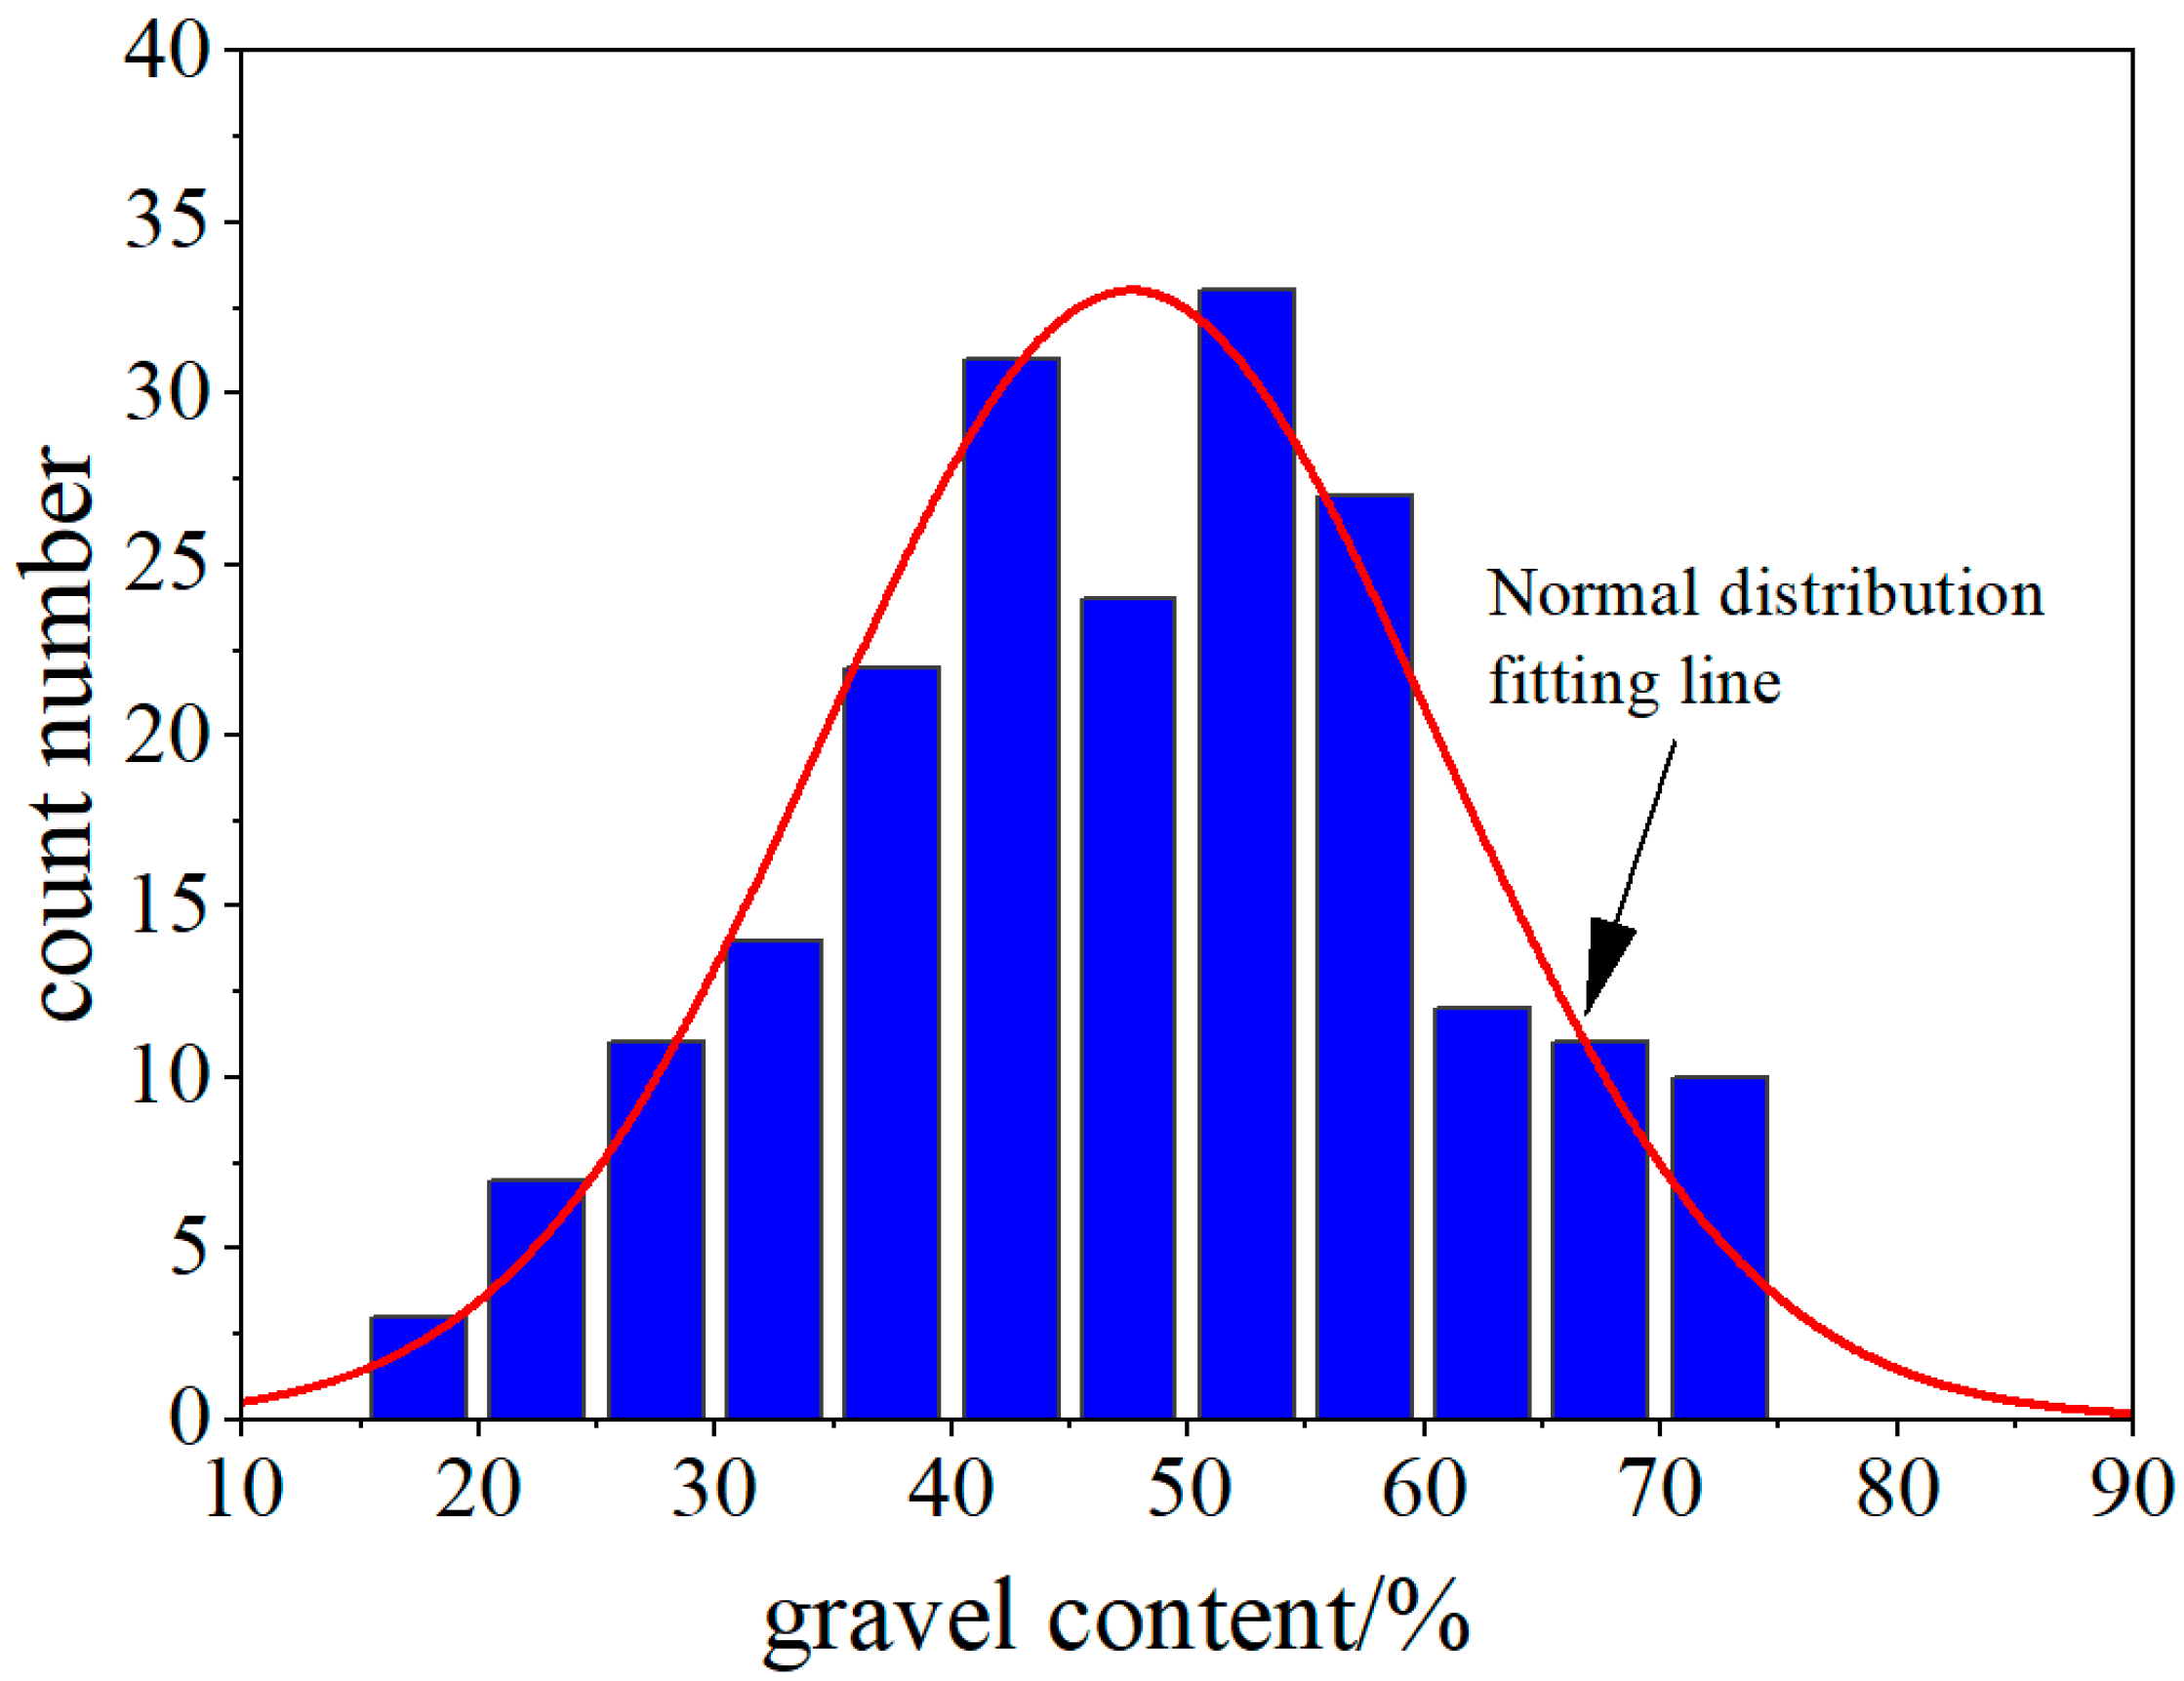
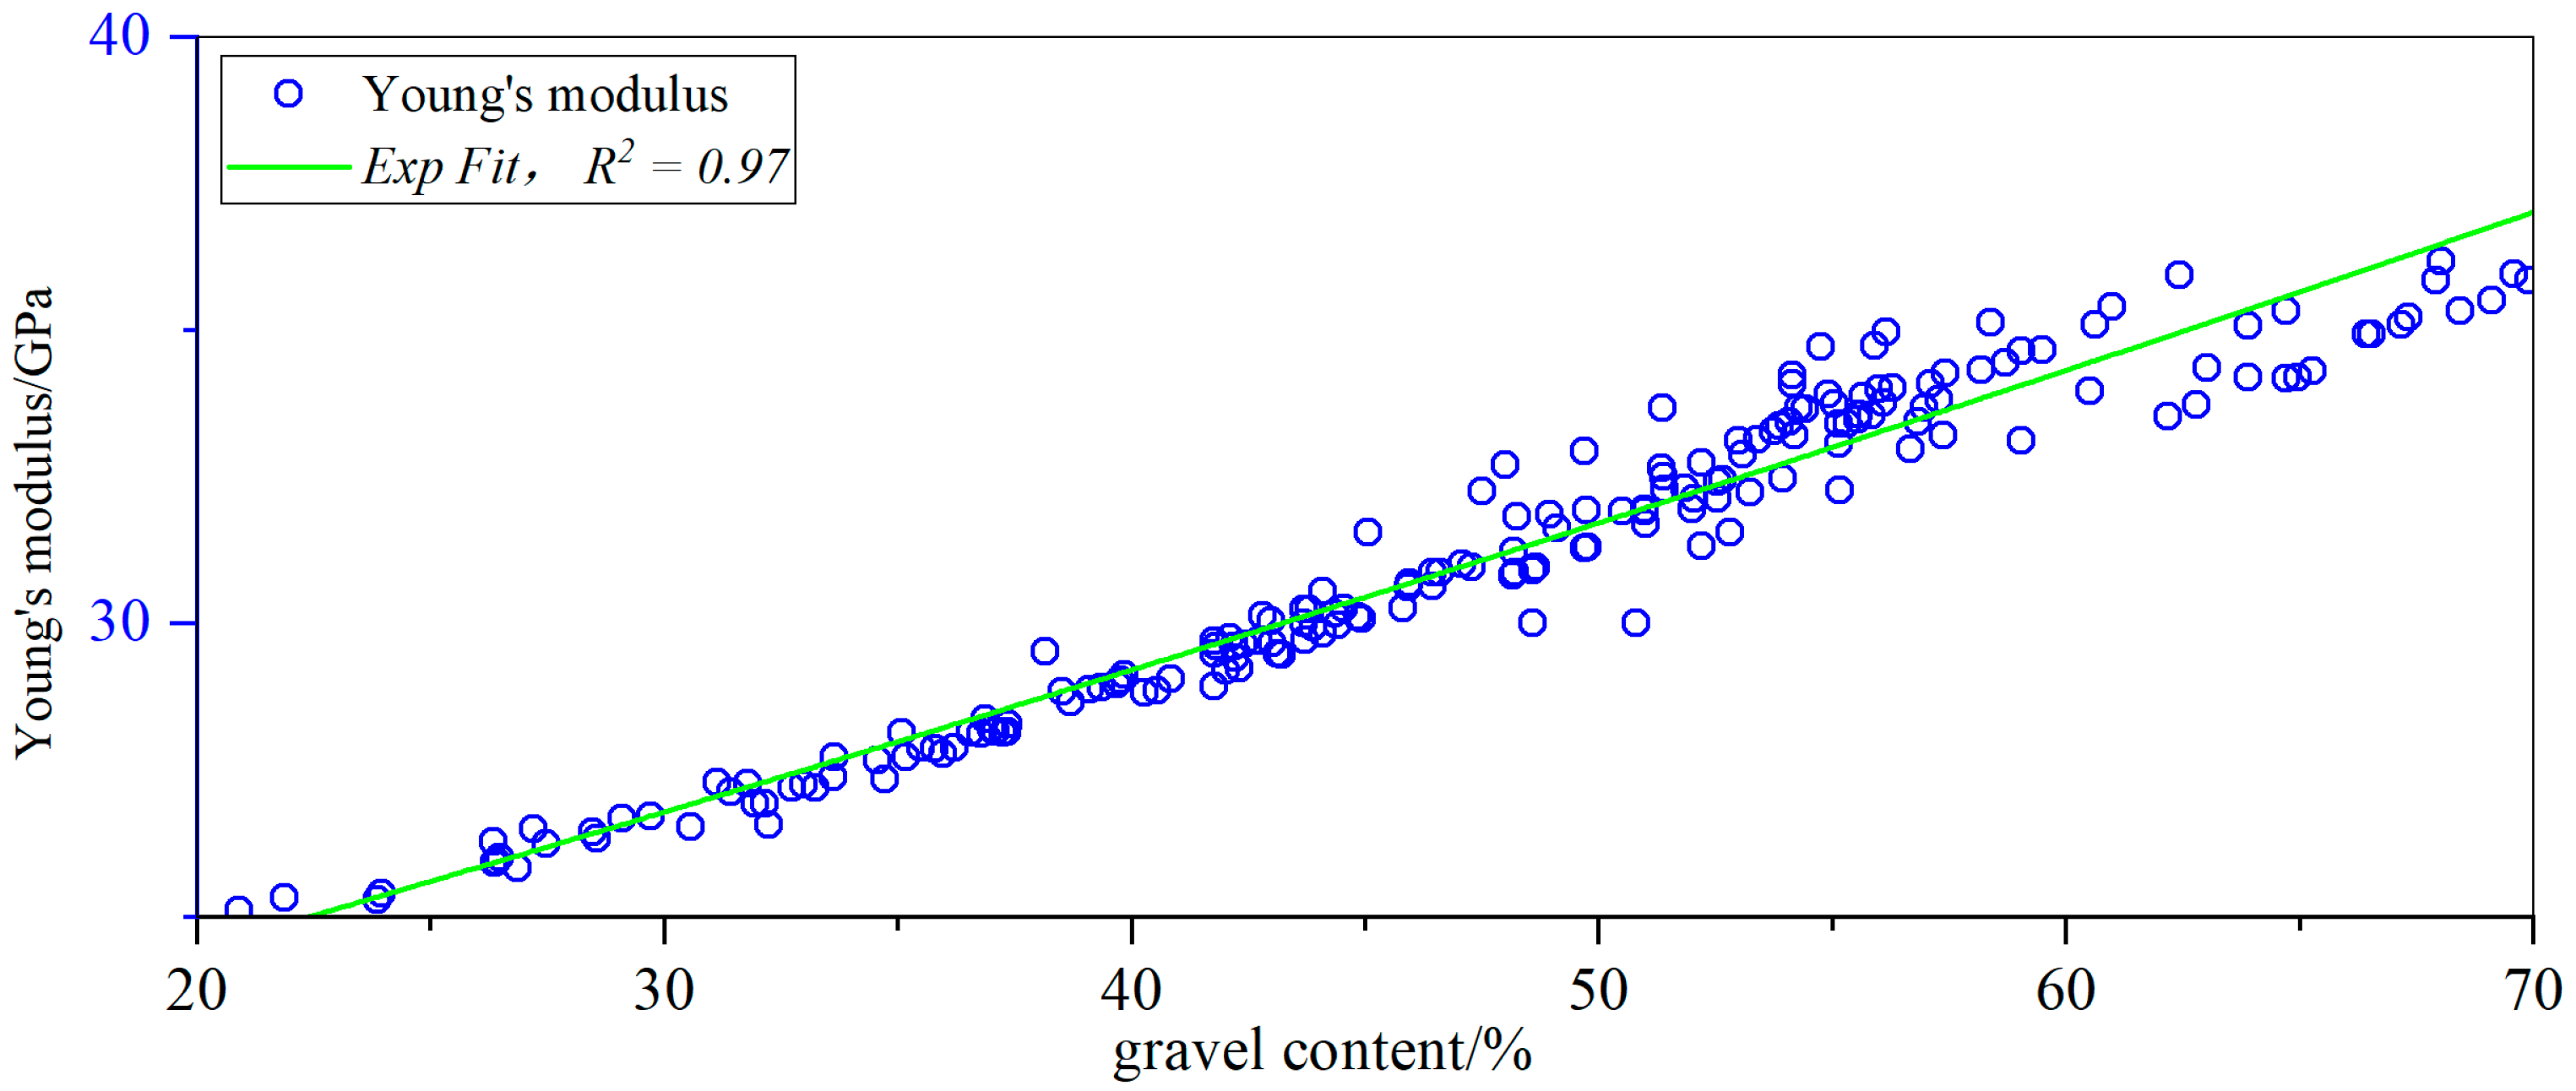
4.1. The Impact of Gravel Size and Content

Figure 13 shows the predicted Young’s modulus of glutenite under different gravel sizes and contents. Overall, there is no clear correlation between the size of gravel and the Young’s modulus of glutenite under the same content conditions, and the change in size has a relatively small impact on the modulus, resulting in fluctuations of the Young’s modulus within 1 GPa. Figure 14 illustrates the stress field distribution during the compression of glutenite. The inclusion of high Young’s modulus gravel leads to local high stress and localized stress in the area where the high modulus gravel intersects with the low modulus matrix. Further statistical analysis of the local maximum stress conditions under different gravel sizes and contents during the compression of glutenite is presented in Figure 15. The statistical results show that under the same particle size conditions, the local maximum stress exponentially increases with an increase in gravel content. Under low gravel content (less than 35%), the particle size has a relatively small impact on the local maximum stress. However, under high gravel content, the particle size has a greater impact on the local maximum stress, with a maximum difference of up to 28.9 MPa. Taking the predicted results for 1 cm and 5 cm gravel sizes as an example, at a gravel content of 10%, the local maximum stress for the smaller size increases by 4.88% compared to the larger size; at a gravel content of 50%, the local maximum stress for the smaller size increases by 50.34% compared to the larger size.

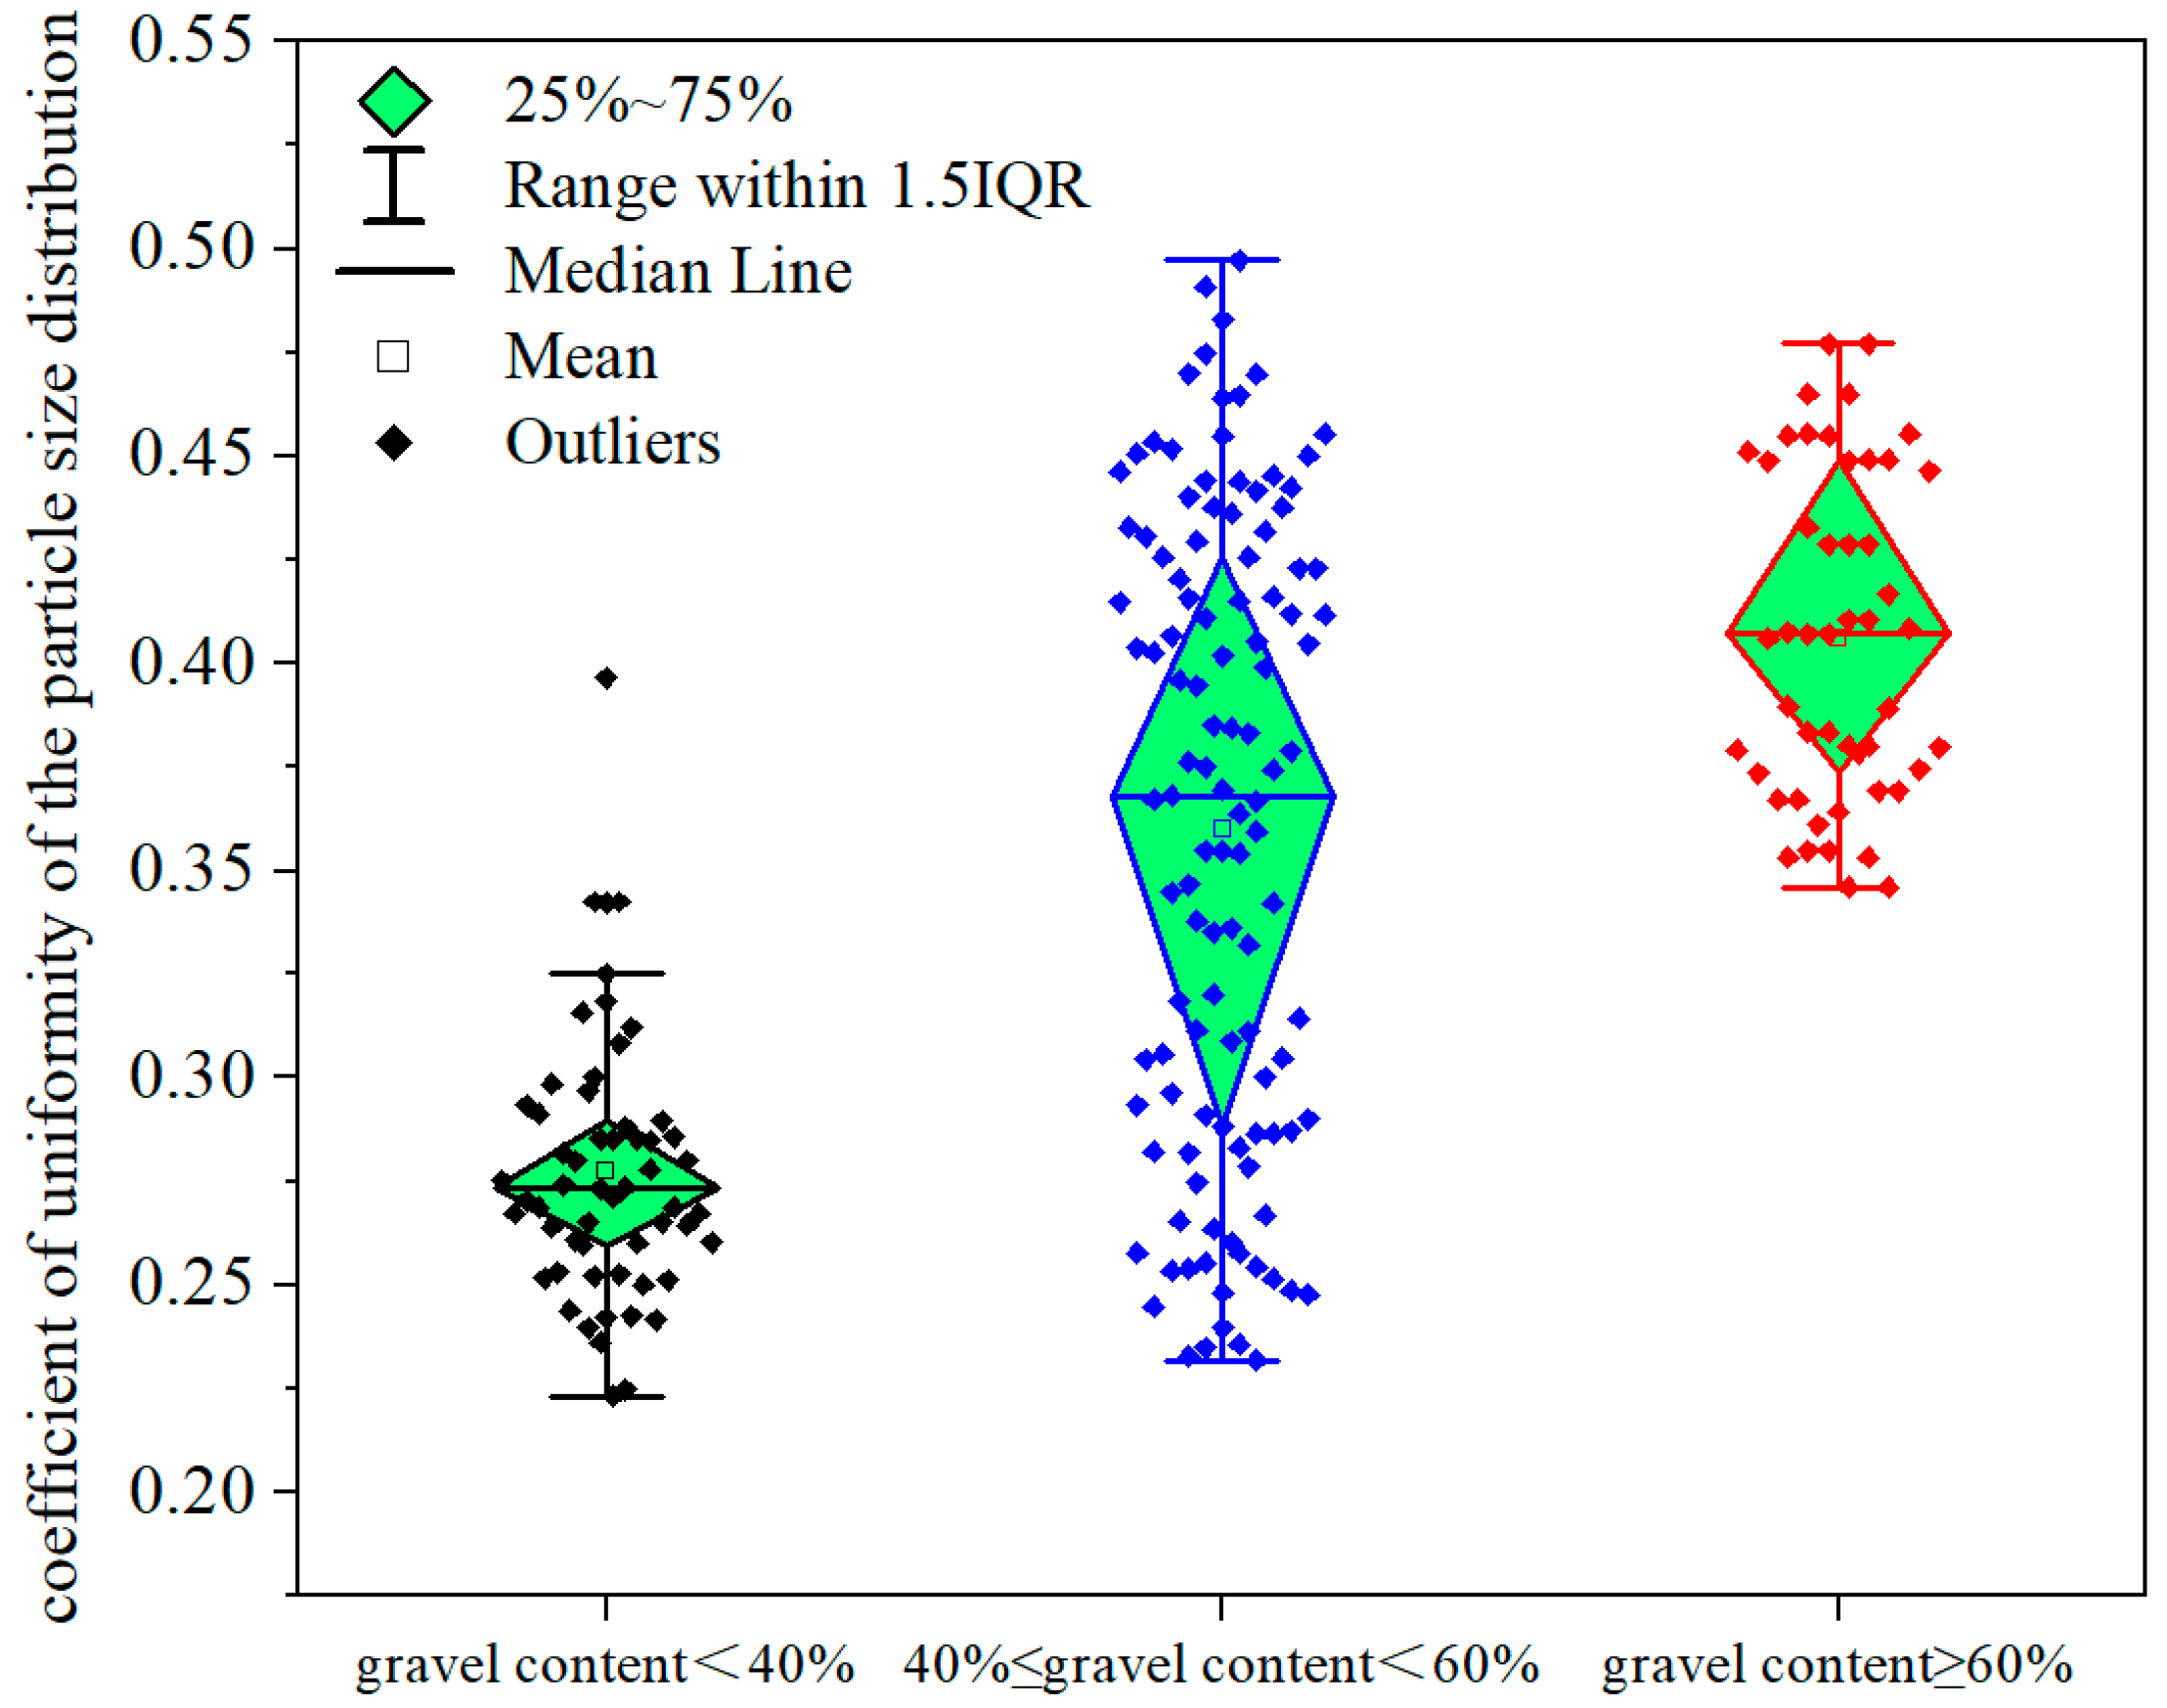
4.2. The impact of Gravel Particle Size Distribution Ratio

To investigate the impact of the gravel particle size distribution ratio on Young’s modulus of glutenite, 205 different particle size distribution ratio glutenite samples were set, with gravel content ranging from 20% to 70%, representing different types of glutenite with varying gravel content and gravel–matrix support patterns. When the gravel content in the glutenite is less than 40%, it represents a matrix-supported pattern; between 40% and 60%, it represents a matrix–gravel-supported pattern, and when the gravel content exceeds 60%, it represents a gravel-supported pattern, as shown in Figure 16. Figure 17 illustrates the relationship between gravel content and Young’s modulus under different particle size distribution ratios, demonstrating a strong exponential relationship between gravel content and Young’s modulus. When the gravel content exceeds approximately 45%, the exponential relationship between gravel content and Young’s modulus becomes more varied. Figure 18 shows the coefficient of uniformity of particle size distribution under different gravel contents in the glutenite. It can be observed that under low gravel content conditions in the simulation cases, the particle size distribution is relatively uniform, and as the content increases, the non-uniformity of particle size distribution in the gravel increases. Figure 19 presents a scatterplot of the correlation between gravel Young’s modulus and particle size uniformity. Overall, the magnitude of Young’s modulus is positively correlated with the non-uniform distribution of gravel, which also explains the increased variability in the exponential relationship between gravel content and Young’s modulus when the gravel content exceeds 45%. This variability arises from different forms of gravel distribution at the same gravel content, leading to variations in the uniformity of gravel particle size distribution.
From Figure 15; Figure 20, it can be observed that overall, as the gravel content increases, the local stress in the glutenite gradually increases. The distribution of particle sizes has a significant impact on the local stress in the glutenite during the loading process. Under the same gravel content conditions, the stress difference caused by differences in particle size distribution can reach up to 38 MPa.

5. Discussions

5.1. Comparison with the Homogenization Methods

Research on Young’s modulus of glutenite is similar to the study of the equivalent modulus of composite materials. A series of representative theoretical works are the upper and lower bound estimations of Hashin-Shtrikman [35,36]. In 1962, Hashin and Shtrikman analyzed the upper and lower bounds of the elastic modulus of two-phase and multi-phase heterogeneous materials and obtained the classical results of the equivalent modulus theory of composite materials. The theoretical results for two-phase alloys corresponded well with experimental results. In 1965, Hill proposed a self-consistent method, embedding particles into a material body with uniform properties, and derived similar theoretical results [37]. In 1973, based on the analysis of the intrinsic strains in Eshelby’s inclusion theory [38,39], Mori and Tanaka proposed the famous M-T formula by analyzing the influence of inclusions on the surrounding matrix under local strains [40]. Additionally, in 1992, Sheng [41] put forward the differential effective medium (DEM) theory. To verify the accuracy of Yang’s modulus prediction in this study, the predicted results will be compared with the homogenization methods (Eshelby’s model, M-T model, and DEM). The homogenization models can be expressed as follows:
(1) Eshelby’s model [38,39]:
K d i l hom = k 0 + r = 1 2 f r ( k r k 0 ) ( 3 k 0 + 4 μ 0 ) 3 k r + 4 μ 0
G d i l hom = μ 0 + r = 1 2 f r 5 μ 0 ( μ r μ 0 ) ( 3 k 0 + 4 μ 0 ) μ 0 ( 9 k r + 8 μ 0 ) + 6 μ r ( k r + 2 μ 0 )
(2) M-T model [40]:
K M T hom = ( r = 1 2 f r k r 3 k r + 4 μ 0 ) ( r = 1 2 f r 3 k r + 4 μ 0 ) 1
G M T hom = r = 1 2 f r k r μ 0 ( 9 k 0 + 8 μ 0 ) + 6 μ r ( k 0 + 2 μ 0 ) r = 1 2 f r μ 0 ( 9 k 0 + 8 μ 0 ) + 6 μ r ( k 0 + 2 μ 0 )
(3) DEM theory [42]:
d k D E M hom d c r + r = 1 2 ( k D E M hom k r ) ( 3 k D E M hom + 4 G D E M hom ) ( 1 f r ) ( 3 k r + 4 G D E M hom ) = 0 d G D E M hom d c r + r = 1 2 5 G D E M hom ( G D E M hom μ r ) ( 3 k D E M hom + 4 G D E M hom ) ( 1 f r ) [ 3 k D E M hom ( 3 G D E M hom + 2 μ r ) + 4 G D E M hom ( 2 G D E M hom + 3 μ r ) ] = 0 k D E M hom | f r = 0 = k r , G D E M hom | f r = 0 = μ r
where Khom and Ghom are the bulk and shear moduli of the homogenized bulk material, respectively, kr and μr the bulk and shear moduli of individual inclusion phases, and fr the volume fraction of the r-th phase; cr is the pore volume ratio. A constant Poisson’s ratio of 0.18 was assumed for all individual phases to determine the kr and μr. Then the Young’s modulus of the bulk rock was determined based on the estimated homogenized Khom and Ghom.
Figure 21 contrasts the results of numerical simulation predictions for Young’s modulus and the results of homogenization method calculations. The analysis shows a strong linear correlation between the numerical simulation predictions and the homogenization method calculations, especially with Eshelby’s model, which indirectly validates the accuracy of the numerical simulation predictions. When the numerical simulation predicts Young’s modulus greater than 30 GPa, the dispersion of the homogenization method calculations increases. From the perspective of the theoretical formula of the homogenization method, the key parameters determining the equivalent Young’s modulus of composite materials are the Young’s modulus of the inclusions and the volume fraction. Therefore, a high Young’s modulus reflects a higher content of inclusions. Under conditions of high gravel content, the M-T model, DEM method, and numerical simulation predictions deviate significantly. This is because the support pattern of the glutenite undergoes a transformation, and the homogenization method finds it difficult to consider the influence of the support pattern on the Young’s modulus of the glutenite.

5.2. Parameter Sensitivity and Correlation Analysis

To quantitatively study the influence of various parameters on Young’s modulus of glutenites, this study adopted the Sobol index method [43], which is more suitable for conducting detailed global sensitivity analysis in low-dimensional parameter spaces compared to OAT [44] and the Morris method [45]. And multiple linear regression [46], gray correlation analysis [47], Pearson correlation analysis [48], and random forest [49] were used to investigate the effects of various parameters on Young’s modulus. Specific impact results are shown in Table 1 and Figure 22 Figure 23 Figure 24 Figure 25. The results of the multiple linear regression study indicate a positive correlation between the quantity and content of gravel and Young’s modulus of sandstone, while the coefficient of uniformity exhibits a negative correlation. The results of the gray correlation, Pearson correlation, and random forest studies indicate that the gravel content is the main controlling factor affecting Young’s modulus of the glutenite. Pearson correlation analysis found a strong correlation between the quantity of gravel and the coefficient of uniformity, as shown in Figure 24. Additionally, due to the early stage of the research, as subsequent experimental samples become more abundant, the uncertainty of the data sample characteristic parameters should also be considered [50,51].

6. Conclusions

This study utilized micron indentation techniques to determine the microscopic mechanical parameters of gravel and matrix in glutenite. By employing the finite element method, an analysis was conducted to investigate the variations in Young’s modulus of glutenite with different gravel inclusions. The specific conclusions are as follows:
(1) Glutenite exhibits strong heterogeneity, with gravel having a higher Young’s modulus on average compared to that of the matrix. The range of Young’s modulus for gravel spans from 24.95 to 82.68 GPa, with an average of 47.42 GPa, while the range for the matrix Young’s modulus is relatively smaller, ranging from 10.24 to 33.73 GPa, with an average of 20.61 GPa.
(2) Gravel content is the primary controlling factor affecting the macroscopic Young’s modulus of glutenite, showing a strong positive linear relationship with Young’s modulus. Gravel particle size and distribution ratio have a relatively minor impact on the macroscopic Young’s modulus of glutenite.
(3) The inclusion of high Young’s modulus gravel results in stress concentration at the interface between the gravel and the matrix during the compression loading process of glutenite, leading to an unbalanced distribution of the entire stress field. Under a single particle size condition, larger particle sizes result in smaller local maximum stress, while higher gravel content leads to larger local maximum stress. Under different gravel particle size distribution ratios, higher non-uniformity in particle size distribution is correlated with larger local maximum stress, and there is no clear correlation between gravel content and local maximum stress.

Author Contributions

Conceptualization, methodology, and writing, F.X. and X.L.; writing—reviewing and editing, resources, X.Y. and X.M.; writing—reviewing and editing; and funding acquisition, S.Z. and C.X. All authors have read and agreed to the published version of the manuscript.

Funding

This work is supported by the Science Foundation of China University of Petroleum, Beijing (No. 2462021BJRC005) and National Natural Science Foundation of China (No. 52304055).

Data Availability Statement

Data are contained within the article.

Conflicts of Interest

Author Xiaolun Yan was employed by the company CNPC Chuanqing Drilling Engineering Co., Ltd. The remaining authors declare that the research was conducted in the absence of any commercial or financial relationships that could be construed as a potential conflict of interest.

References

  1. Li, G.; Qin, J.; Xian, C.; Fan, X.; Zhang, J.; Ding, Y. Theoretical understandings, key technologies and practices of tight conglomerate oilfield efficient development: A case study of the Mahu oilfield, Junggar Basin, NW China. Pet. Explor. Dev. 2020, 47, 1275–1290. [Google Scholar] [CrossRef]
  2. Du, J.; Zhi, D.; Li, J.; Yang, D.; Tang, Y.; Qi, X.; Xiao, L.; Wei, L. Major breakthrough of well Gaotan 1 and exploration prospects of lower assemblage in southern margin of Junggar basin, NW, China. Pet. Explor. Dev. 2019, 46, 216–227. [Google Scholar] [CrossRef]
  3. Wang, Y.; Hao, X.; Hu, Y. Orderly distribution and differential enrichment of hydrocarbon in oil-rich sags: A case study of Dongying Sag, Jiyang depression, Bohai Bay Basin, East China. Pet. Explor. Dev. 2018, 45, 840–850. [Google Scholar] [CrossRef]
  4. Li, Z.; Wang, S.; Li, L.; Zhang, J.; Li, T. Numerical simulation of brittleness effect on propagation behavior of glutenite hydraulic fractures. Ain Shams Eng. J. 2021, 12, 3419–3427. [Google Scholar] [CrossRef]
  5. Ma, X.; Zou, Y.; Li, N.; Chen, M.; Zhang, Y.; Liu, Z. Experimental study on the mechanism of hydraulic fracture growth in a glutenite reservoir. J. Struct. Geol. 2017, 97, 37–47. [Google Scholar] [CrossRef]
  6. Nie, Y.; Zhang, G.; Wen, J.; Li, S.; Zhou, D. Cyclic injection to reduce hydraulic fracture surface roughness in glutenite reservoirs. Int. J. Rock Mech. Min. Sci. 2021, 142, 104740. [Google Scholar] [CrossRef]
  7. Zhang, Z.; Zhang, S.; Zou, Y.; Ma, X.; Liu, L. Experimental investigation into simultaneous and sequential propagation of multiple closely spaced fractures in a horizontal well. J. Pet. Sci. Eng. 2021, 202, 108531. [Google Scholar] [CrossRef]
  8. Rui, Z.; Guo, T.; Feng, Q.; Qu, Z.; Qi, N.; Gong, F. Influence of gravel on the propagation pattern of hydraulic fracture in the glutenite reservoir. J. Pet. Sci. Eng. 2018, 165, 627–639. [Google Scholar] [CrossRef]
  9. Liu, J.; Ge, H.; Zhang, Z. Influence of mechanical contrast between the matrix and gravel on fracture propagation of glutenite. J. Pet. Sci. Eng. 2022, 208, 109639. [Google Scholar] [CrossRef]
  10. Liu, J.; Wang, J.; Ge, H.; Zhou, W.; Chen, B.; Li, X.; Xue, X.; Luo, S. Effect of gravel on rock failure in glutenite reservoirs under different confining pressures. Pet. Sci. 2023, 20, 3022–3036. [Google Scholar] [CrossRef]
  11. Cascante, G.; Santamarina, C.; Yassir, N. Flexural excitation in a standard torsional-resonant column. Can. Geotech. J. 1998, 35, 478–490. [Google Scholar] [CrossRef]
  12. Menq, F.Y. Dynamic Properties of Sandy and Gravelly Soils. Ph.D. Dissertation, University of Texas at Austin, Austin, TX, USA, 2003. [Google Scholar]
  13. Payan, M.; Senetakis, K.; Khoshghalb, A.; Khalili, N. Effect of gradation and particle shape on small-strain Young’s modulus and Poisson’s ratio of sands. Int. J. Geomech. 2017, 17, 04016120. [Google Scholar] [CrossRef]
  14. Payan, M.; Khoshini, M.; Jamshidi Chenari, R. Elastic dynamic Young’s modulus and Poisson’s ratio of sand–silt mixtures. J. Mater. Civ. Eng. 2020, 32, 04019314. [Google Scholar] [CrossRef]
  15. Wichtmann, T.; Triantafyllidis, T. On the influence of the grain size distribution curve on P-wave velocity, constrained elastic modulus Mmax and Poisson’s ratio of quartz sands. Soil Dyn. Earthq. Eng. 2010, 30, 757–766. [Google Scholar] [CrossRef]
  16. Shi, X.; Jiang, S.; Lu, S.; He, Z.; Li, D.; Wang, Z.; Xiao, D. Investigation of mechanical properties of bedded shale by nanoindentation tests: A case study on Lower Silurian Longmaxi Formation of Youyang area in southeast Chongqing, China. Pet. Explor. Dev. 2019, 46, 155–164. [Google Scholar] [CrossRef]
  17. Guo, W. A Study of Strength Parameter Evolution and a Statistical Damage Constitutive Model of Cemented Sand and Gravel. Materials 2023, 16, 542. [Google Scholar]
  18. Zhang, X. Numerical simulation of cracking propagation of asphalt concrete beam. J. Fail. Anal. Prev. 2018, 18, 221. [Google Scholar] [CrossRef]
  19. Liu, P.; Ju, Y.; Ranjith, P.G.; Zheng, Z.; Chen, J. Experimental investigation of the effects of heterogeneity and geostress difference on the 3D growth and distribution of hydrofracturing cracks in unconventional reservoir rocks. J. Nat. Gas Sci. Eng. 2016, 35, 541–554. [Google Scholar] [CrossRef]
  20. Ma, D.; Wu, Y.; Hu, X.; Li, D.; Geng, H.; Hao, Y. DEM simulation of injection-induced micro-cracks behaviors in the heterogeneous glutenite by fluid-solid coupling. Comput. Part. Mech. 2023. [Google Scholar] [CrossRef]
  21. Lu, Y.; Tan, Y.; Li, X.; Liu, C. Methodology for simulation of irregularly shaped gravel grains and its application to DEM modeling. J. Comput. Civ. Eng. 2017, 31, 04017023. [Google Scholar] [CrossRef]
  22. Xu, W.J.; Wang, S.; Zhang, H.Y.; Zhang, Z.L. Discrete element modelling of a soil-rock mixture used in an embankment dam. International. J. Rock Mech. Min. Sci. 2016, 86, 141–156. [Google Scholar] [CrossRef]
  23. Akram, M.S.; Sharrock, G.B.; Mitra, R. Investigating mechanics of conglomeratic rocks: Influence of clast size distribution, scale and properties of clast and interparticle cement. Bull. Eng. Geol. Environ. 2019, 78, 2769–2788. [Google Scholar] [CrossRef]
  24. Cho, N.A.; Martin, C.D.; Sego, D.C. A clumped particle model for rock. Int. J. Rock Mech. Min. Sci. 2007, 44, 997–1010. [Google Scholar] [CrossRef]
  25. Detournay, E. Propagation regimes of fluid-driven fractures in impermeable rocks. Int. J. Geomech. 2004, 4, 35–45. [Google Scholar] [CrossRef]
  26. Yoon, J.; Zang, A.; Stephansson, O. Simulating fracture and friction of Aue granite under confined asymmetric compressive test using clumped particle model. Int. J. Rock Mech. Min. Sci. 2012, 49, 68–83. [Google Scholar] [CrossRef]
  27. Jeong, S. Numerical Modeling of Soil-Cement based on Discrete Element Method. J. Korean Geosynth. Soc. 2016, 15, 33–42. [Google Scholar] [CrossRef]
  28. Zhu, W.; Hughes, J.J.; Bicanic, N.; Pearce, C.J. Nanoindentation mapping of mechanical properties of cement paste and natural rocks. Mater. Charact. 2007, 58, 1189–1198. [Google Scholar] [CrossRef]
  29. Chen, P.; Han, Q.; Ma, T.; Lin, D. The mechanical properties of shale based on micro-indentation test. Pet. Explor. Dev. 2015, 42, 723–732. [Google Scholar] [CrossRef]
  30. Graham, S.P.; Rouainia, M.; Aplin, A.C.; Cubillas, P.; Fender, T.D.; Armitage, P.J. Geomechanical characterisation of organic-rich calcareous shale using AFM and nanoindentation. Rock Mech. Rock Eng. 2020, 54, 303–320. [Google Scholar] [CrossRef]
  31. Oliver, W.C.; Pharr, G.M. An improved technique for determining hardness and elastic modulus using load and displacement sensing indentation experiments. J. Mater. Sci. 1992, 7, 1564–1583. [Google Scholar] [CrossRef]
  32. Zhang, Z.; Zhang, S.; Shi, S.; Zou, Y.; Li, J.; Ma, X.; Xiao, F. Evaluation of multi-scale mechanical properties of conglomerate based on nano-indentation experiment and homogenization method-taking the tight conglomerate reservoir on the south slope of Mahu sag as an example. Chin. J. Rock Mech. Eng. 2022, 41, 926–940. [Google Scholar]
  33. Li, H.; Ma, H.; Yang, C.; Zhao, K.; Hu, Z.; Daemen, J.J.K. Acoustic emission characteristics of rock salt under multi-stage cyclic loading. Int. J. Fatigue 2023, 176, 107911. [Google Scholar] [CrossRef]
  34. Li, S.; Yang, D.; Huang, Z.; Gu, Q.; Zhao, K. Acoustic emission characteristics and failure mode analysis of rock failure under complex stress state. Theor. Appl. Fract. Mech. 2022, 122, 103666. [Google Scholar] [CrossRef]
  35. Hashin, Z. The elastic moduli of heterogeneous materials. J. Appl. Mech. 1962, 29, 143–150. [Google Scholar] [CrossRef]
  36. Hashin, Z.; Shtrikman, S. On some variational principles in anisotropic and non—homogeneous elasticity. J. Mech. Phys. Solids 1962, 10, 335–342. [Google Scholar] [CrossRef]
  37. Hill, R. A self-consistent mechanics of composite materials. J. Mech. Phys. Solids 1965, 13, 213–222. [Google Scholar] [CrossRef]
  38. Eshelby, J. The determination of the elastic field of an ellipsoidal inclusion and related problems. Proc. R. Soc. Lond. A 1957, 241, 376–396. [Google Scholar]
  39. Eshelby, J. The force on an elastic singularity. Proc. R. Soc. Lond. A 1951, 244, 87–112. [Google Scholar]
  40. Mori, T.; Tanaka, K. Average stress in matrix and average elastic energy of materials with misfitting inclusions. Acta Metall. 1973, 21, 571–574. [Google Scholar] [CrossRef]
  41. Sheng, P. Effective-medium theory of sedimentary rocks. Phys. Rev. B 1990, 41, 4507. [Google Scholar] [CrossRef]
  42. Markov, M.; Kazatchenko, E.; Mousatov, A.; Pervago, E. Generalized differential effective medium method for simulating effective elastic properties of two dimensional percolating composites. J. Appl. Phys. 2012, 112, 026101. [Google Scholar] [CrossRef]
  43. Sobol, I.M. Global sensitivity indices for nonlinear mathematical models and their Monte Carlo estimates. Math. Comput. Simul. 2001, 55, 271–280. [Google Scholar] [CrossRef]
  44. Saltelli, A.; Aleksankina, K.; Becker, W.; Fennell, P.; Ferretti, F.; Holst, N.; Li, S.; Wu, Q. Why so many published sensitivity analyses are false: A systematic review of sensitivity analysis practices. Environ. Model. Softw. 2019, 114, 29–39. [Google Scholar] [CrossRef]
  45. Yin, Z.; Feng, T.; MacBeth, C. Fast assimilation of frequently acquired 4d seismic data for reservoir history matching. Comput. Geosci. 2019, 128, 30–40. [Google Scholar] [CrossRef]
  46. Faber, N.K.M. Uncertainty estimation for multivariate regression coefficients. Chemom. Intell. Lab. Syst. 2002, 64, 169–179. [Google Scholar] [CrossRef]
  47. Shi, Y.; Xu, F.; Li, X.; Lei, Z.; Cui, Q.; Zhang, Y. Comparison of influence factors on horizontal ground heat exchanger performance through numerical simulation and gray correlation analysis. Appl. Therm. Eng. 2022, 213, 118756. [Google Scholar] [CrossRef]
  48. Wang, G.; Xie, C.; Chen, S.; Yang, J.; Yang, M. Random matrix theory analysis of cross-correlations in the us stock market: Evidence from pearson’s correlation coefficient and detrended cross-correlation coefficient. Phys. A Stat. Mech. Its Appl. 2013, 392, 3715–3730. [Google Scholar] [CrossRef]
  49. Belgiu, M.; Drăguţ, L. Random forest in remote sensing: A review of applications and future directions. ISPRS J. Photogramm. Remote Sens. 2016, 114, 24–31. [Google Scholar] [CrossRef]
  50. Kaminski, M.; Lauke, B. Uncertainty in effective elastic properties of particle filled polymers by the monte-carlo simulation. Compos. Struct. 2015, 123, 374–382. [Google Scholar] [CrossRef]
  51. Yin, Z.; Strebelle, S.; Caers, J. Automated monte carlo-based quantification and updating of geological uncertainty with borehole data (autobel v1.0). Geosci. Model Dev. 2020, 13, 651–672. [Google Scholar] [CrossRef]
Figure 1. The MFT-4000 testing device and test specimen diagram.
Processes 12 00185 g001
Figure 2. Typical micron indentation experimental load–displacement relationship curve for glutenite.
Processes 12 00185 g002
Figure 3. Load–displacement relationship curve of gravel and matrix micron indentation experiment.
Processes 12 00185 g003
Figure 4. Variation of Young’s modulus of gravel and matrix with indentation depth.
Processes 12 00185 g004
Figure 5. Workflow of modeling 2D physical models of glutenite.
Processes 12 00185 g005
Figure 6. Schematic of physical modeling for gravel intersection determination, irregular gravel generation, and a physical model of glutenite.
Processes 12 00185 g006
Figure 7. Schematic diagram of physical modeling of glutenite with different gravel sizes.
Processes 12 00185 g007
Figure 8. Histogram of the proportional distribution of the gravel size of the glutenite samples.
Processes 12 00185 g008
Figure 9. Distribution of the number of glutenite samples with different gravel contents.
Processes 12 00185 g009
Figure 10. Uniaxial compression strain and acoustic emission response of rock core with time.
Processes 12 00185 g010
Figure 11. Uniaxial compression modeling of rock core and simulated stress field distribution. (a) Core sample (damaged); (b) equivalent physical model; (c) compressive simulation stress field.
Processes 12 00185 g011
Figure 12. Fitting curve of linear elastic phase.
Processes 12 00185 g012
Figure 13. Scatterplot of Young’s modulus for the glutenite with different gravel sizes and contents.
Processes 12 00185 g013
Figure 14. Stress field distribution of glutenite in compression.
Processes 12 00185 g014
Figure 15. Scatterplot of local maximum stresses in glutenite with different gravel sizes and contents.
Processes 12 00185 g015
Figure 16. Schematic diagram of different support patterns in glutenite. (a) Matrix-supported; (b) matrix–gravel-supported; (c) gravel-supported.
Processes 12 00185 g016
Figure 17. Scatterplot of Young’s modulus for the glutenite with different gravel particle size distribution ratios.
Processes 12 00185 g017
Figure 18. Box plots of the coefficient of uniformity of the particle size distribution for different gravel contents of glutenite.
Processes 12 00185 g018
Figure 19. Scatterplot of the relationship between Young’s modulus and the coefficient of uniformity of the particle size distribution of glutenite.
Processes 12 00185 g019
Figure 20. Scatterplot of changes in Young’s modulus and coefficient of uniformity of the particle size distribution of glutenite with increasing gravel content.
Processes 12 00185 g020
Figure 21. Scatterplot comparing numerical simulation results and homogenization method calculation results.
Processes 12 00185 g021
Figure 22. Bar diagram of S1 sensitivity index of Sobol index method.
Processes 12 00185 g022
Figure 23. Heatmap of gray correlation analysis.
Processes 12 00185 g023
Figure 24. Heatmap of Pearson correlation analysis.
Processes 12 00185 g024
Figure 25. The score of Random Forest distribution histogram.
Processes 12 00185 g025
Table 1. The results of parameter sensitivity and correlation analysis.
MethodsGravel NumberGravel ContentCoefficient of Uniformity
Sobol index method0.0530.9420.004
Multivariate Regression Coefficients0.04120.622−2.743
Gray Relational Coefficient0.6700.9000.650
Pearson Correlation Coefficient0.8300.9800.730
The score of Random Forest0.0100.9840.006
Disclaimer/Publisher’s Note: The statements, opinions and data contained in all publications are solely those of the individual author(s) and contributor(s) and not of MDPI and/or the editor(s). MDPI and/or the editor(s) disclaim responsibility for any injury to people or property resulting from any ideas, methods, instructions or products referred to in the content.

