Article

Effect of Slaked Lime on the Properties of Sodium Sulfate-Activated Alkali-Activated Slag Cement

1
College of Materials Science and Engineering, Xi’an University of Architecture and Technology, Xi’an 710055, China
2
School of Civil Engineering and Architecture, Xi’an University of Technology, Xi’an 710048, China
*
Author to whom correspondence should be addressed.
Processes 2024, 12(1), 184; https://doi.org/10.3390/pr12010184
Submission received: 13 December 2023 / Revised: 5 January 2024 / Accepted: 10 January 2024 / Published: 14 January 2024

Abstract

:
Sodium sulfate (SS) is a neutral activator. SS-activated alkali-activated slag cement (AASC) has lower shrinkage. However, it sets slowly, and the mechanical property develops slowly. Slaked lime (SL) is an alkaline substance widely used in industry that can be used as an activator in AASC. In this paper, SL was used alone, and SL and SS were mixed together to prepare AASC. The effects of SL content on the setting time, shrinkage properties and mechanical strength of AASC were investigated. Furthermore, the mechanism was explored with the analysis of microscopic tests. The results showed that SS could not be used as an activator alone, while SL could be used as an activator alone, and SS could be combined with SL to prepare AASC. The setting time of the SL system or the SS-SL mix system decreased with the increase in SL. The mechanical properties of the SL system were poor. The SS-SL system showed the highest mechanical properties when SL was 3%. With the increase in SL, the autogenous and drying shrinkage of the SL system increased, while the former of the SS-SL system increased and the latter decreased. At the same time, due to the different changes in pore structure and mesoporous volume in the two systems, the drying shrinkage showed different changes. Compared with the SL system, ettringite (AFt) with a slight expansion property and more crystal phases were formed in the SS-SL system, which reduced the drying shrinkage.

1. Introduction

As a traditional cementing material, Portland cement (PC) is widely used in engineering. However, its production requires a lot of resources and energy. Moreover, about 5% of man-made carbon dioxide emissions result from the production of PC [1,2], which is contrary to the current concept of a green and sustainable society. Alkali-activated slag cement (AASC) uses the waste slag produced by smelting pig iron as the main binding material and is activated by an alkali activator. The total CO2 emission of concrete based on industrial waste as an activator is only 35–60% of that of PC concrete, which is in compliance with the policy of low carbon [3]. Also, it shows high strength, low hydration heat, good corrosion resistance, good freezing resistance and other excellent properties. AASC has attracted wide attention for its potential to significantly reduce greenhouse gas emissions [3,4,5].
Studies showed that activator type is the main factor affecting the properties of AASC [6,7,8]. As a commonly used alkali component, sodium hydroxide (SH) and water glass (WG) are strongly alkaline and generally considered to be the most effective activators. AASC activated by WG or SH shows rapid hydration, setting and hardening, rapid strength development and high strength [9,10]. Bakharev prepared AASC with three activators, and studies showed that liquid WG provided the highest mechanical properties compared with SH and NaCO3 (SC) [11]. Fang et al. found that AASC mortar had excellent mechanical properties when WG was selected as an activator, and its compressive strength reached 94.5 MPa after 28 days under standard curing conditions [12]. However, its rapid setting, hardening and fluidity loss were not convenient for the construction of AASC concrete. The high alkalinity of SH led to excessive initial hydration, which was unfavorable to develop late-strength [9,13]. C-A-S-H gel accounted for about 70% of the hydration products, which easily produced large shrinkage deformation that was not conducive to the durability of AASC concrete [9,14]. Cengiz et al. found that AASC mortars activated with WG and SH showed six and three times the shrinkage performance of OPC mortars, respectively [15,16]. Moreover, the shrinkage of AASC concrete activated with WG was about 2–3 times that of OPC concrete [17,18].
What is more, both WG and SH are manufactured with energy-intensive manufacturing processes, especially WG [19]. Although AASC can be considered an environmentally friendly cementitious material, WG and SH are not the best choices for the preparation of AASC. As emphasized by Habert et al., the purpose of using AASC was to mitigate the adverse environmental impacts of civil engineering, which was not achievable using WG and SH as activators at that time [20]. Moreover, the high alkalinity of WG and SH is also harmful to the body of construction workers.
Therefore, other activators such as sodium sulfate (SS), SC and slaked lime (SL) are used to prepare AASC. SS is a neutral salt, and SC is a weakly alkaline salt. The hydration, setting and hardening of SS- and SC-activated AASC is low, which allows an AASC concrete mixture to maintain high workability for a long time and facilitate construction. SS- and SC-activated AASC show relatively small shrinkage. Cengiz et al. found that AASC prepared with SC as an activator had comparable shrinkage to OPC [15,16]. However, its early strength develops slowly, and its late strength is also low [21,22,23]. Tan et al. found that although GBFS were ground from 18.12 μm to 3.87 μm, AASC mortar prepared with SS and SC still presented a low early mechanical property [24]. Ma et al. also believed that the more SS in a compound activator, the lower the mechanical property of mortar, especially in the early stage [25]. However, when activated with SS and WG, AASC mortar exhibits excellent mechanical properties while significantly reducing drying shrinkage [25]. Hoang-Anh Nguyen et al. found that SS was more suitable than WG for improving the performance of AASC mixed with CaSO4∙2H2O. For example, the early strength of the AASC paste with the incorporation of SS was higher than that with the incorporation of WG [26]. These studies show that if SS is used properly, it has the potential to prepare AASC with good comprehensive properties. In addition, SS is generally cheaper and less harmful than other activators [23].
SL is a weakly alkaline substance that, when used as an alkali activator, not only provides the alkaline environment required for hydration but also increases the calcium content of the system [8,27,28]. However, the strength of using SL as the only activator is low. Compared with SL alone as an activator, higher gel diffraction peaks and higher mortar strengths were observed when the SL content was 7.5% along with 1% SS, 2% SC or 1% Ba (OH)2, respectively [27,28]. The molar ratio of SiO2 and CaO in the C-S-H gel increased when mixed with Na2SiO3 or Na2CO3, while it decreased when mixed with Ba (OH)2 [27,28]. When AASC was activated with SL alone and SL mixed with gypsum, the results showed that although the latter showed a low autogenous shrinkage and drying shrinkage, it presented a low mechanical property [8,14]. The authors attributed this to the finer pore distribution in the SL system [29]. In a preliminary test, the author of another paper mixed SL into AASC activated with WG [8]. The results indicated that the early strength development was significantly enhanced when SL was less than 5%. The introduction of SL increased the autogenous shrinkage of the composite system and at the same time reduced its drying shrinkage [8]. The former was mainly caused by the promotion of the early reaction rate with the incorporation of SL, which generated more gel, and the latter was due to the generation of more crystalline hydration products with a lower number of mesopores. Moreover, compared with the gel, the elasticity modulus of unhydrated SL was larger, which was conducive to inhibiting shrinkage [8].
It can be seen from the above that when SL is combined with other activators, different activators show different effects. In this paper, AASC was prepared using SL as an activator, and SL and SS as compound activators, respectively. The effects of SL alone and SL mixed with SS on the basic performance of AASC were explored. Meanwhile, the microstructure of AASC was studied to clarify the mechanism of SL’s effect on its properties.

2. Experiments

2.1. Materials

The binder included SL and GBFS with a specific surface area of 432 m2/kg. The main chemical components of GBFS are presented in Table 1. The activity indices of GBFS at 7 days and 28 days were 88% and 106%, respectively. The basicity coefficient was calculated with Formula (1), which was 1.09. Figure 1 is the X-ray diffraction (XRD) of GBFS, which shows that the phase composition of GBFS is dominated by the glass phase. SS and SL used in the experiment were pure reagents for chemical analysis. AASC mortar was prepared using river sand with a maximum particle size of 5 mm. The water mixture of AASC paste and mortar was tapping water. The SL was chemically analyzed with pure reagent; the content of calcium hydroxide was ≥95%, and the particle size distribution is shown in Figure 1b.
K b = CaO + MgO SiO 2 + Al 2 O 3 = 41.36 + 8.42 31.68 + 13.96 = 1.09

2.2. Experimental Works

2.2.1. Mix Proportions

The detailed mix formulations of the AASC paste and mortar are given in Table 2 and Table 3. The SL content was 0, 3%, 5%, 8%, 10% and 12%, which was the mass percentage of SL and GBFS. The content of SS was fixed at 9.16% of SL and GBFS.

2.2.2. Experimental Methods

According to GB/T 1346-2011, the AASC paste was prepared [30]. SL or SL and SS were evenly mixed with GBFS in advance. Then, the mixing water was added and then stirred to obtain a uniform paste. According to GB/T 17671-2021, the AASC mortar was prepared [31]. Similarly, SL or SL and SS were mixed well with GBFS in advance, and then, mixing water and sand were added and stirred to obtain uniform mortar.
The setting time was tested using the mix proportions of the paste. The results were determined in compliance with GB/T 1346-2011 [30]. The final result was judged by the average of the 3 specimens.
According to the Chinese national standard GB/T 17671-2021 “Test method of cement mortar strength”, specimens of 40 mm × 40 mm × 160 mm were prepared [31]. After 1 day of curing at room temperature, the specimens were demolded and then cured in a standard curing room at 20 ± 1 °C and RH ≥ 90% until the test age, at which time the flexural strength and compressive strength were tested. The final results were evaluated with three specimens.
The drying shrinkage of the AASC mortar was determined in compliance with JGJ/T 70-2009 [32]. The demolded specimen with both ends embedded in the copper nail head was immediately moved to a dry environment at 20 ± 2 °C and (60 ± 5) % RH. After 4 h, the initial length difference between the standard part and the mortar specimen was measured and calculated. The change in length difference was the change in drying shrinkage over the ages. During the experiment, specimen lengths were measured daily until 14 days, and then at 28, 56, 90, 120, 150 and 180 days. The drying shrinkage percentage was calculated according to Formula (2), and the final result was evaluated with 3 specimens.
ε = Δ L Δ L t L 0 × 100
where ε (%) is the shrinkage at t age; ΔL (mm) is the initial length difference between the specimen and standard part; ΔLt (mm) is the length difference between the age t and the standard part; and L0 is the initial length: 160 mm.
Figure 2 shows the autogenous shrinkage testing device, which was similar to that in the other two papers by the author [8,10]. It is mainly composed of a 250 mL specimen bottle, a 10 mL scale tube and a rubber plug. AASC paste was prepared, and 100 g was placed in the bag, vacuum-treated and sealed. Then, it was placed into a specimen bottle containing water. The bottle mouth was tightened with the rubber stopper containing the scale tube. The joints needed to be sealed with Vaseline. To ensure that the device did not leak, the connection needed to be sealed with Teflon tape and petroleum jelly [8,10]. A drop of water was added to the scale tube until the liquid level was stable at a certain scale. In order to prevent the water from evaporating, a drop of oil was added to the pipette. The change in the height of the liquid in the scale tube reflected its law of autogenous shrinkage (mL/100 g). The test should be performed in an environment at 20 ± 2 °C and RH ≥ 95%. The data were recorded every 3 h for the first 3 days, and every 6 h for the next 4 days.
All the microscopic tests in this experiment were carried out using AASC paste. When the AASC paste was prepared, a specimen of size 20 mm × 20 mm × 20 mm was cast and cured in a standard environment until the test age for microstructure tests. After curing to the specified age, the specimen was crushed, selected and immediately immersed in absolute ethanol for the purpose of terminating hydration. Then, it was dried under vacuum at 40 °C for 24 h. The pore size distribution was studied using nitrogen adsorption, which was carried out with an automatic surface area and porosity analyzer of ASAP 2460. The phase composition analysis of the AASC reaction products with XRD necessitates pulverizing the sample into a fine powder. The XRD characterization was tested with a Rigaku D instrument with a scanning range of 5–70° and a scanning rate of 0.02°/step. An SEM (scanning electron microscope, model: Zeiss Gemini 300) was used to test and analyze the micromorphology of the hydrated products. The specimens were required to be sprayed with gold to improve their conductivity. The product formed with AASC hydration was analyzed using TG-DTG. The analysis was conducted under N2 protection, heating to 900 °C, and a heating rate of 10 °C/min.

3. Results and Analysis

3.1. Setting Time

Table 4 depicts the setting time of AASC. As illustrated, the AASC paste did not set and harden when SS was used alone. That is, SS could not be used as an activator alone, while SL could be used as an activator alone. SS must be combined with SL to prepare AASC. When SL was mixed alone, or SL was combined with SS, the increased SL shortened the setting time of the two systems, although the reduction was small. When SL increased from 3% to 12%, the initial and final setting times of the AASC in the SL system reduced by 10.7% and 13.9%, and that of the SS-SL system reduced by 23.4% and 10.9%.
When the amount of SL was the same, the setting time of the SS-SL system was shorter compared with the SL system. This showed that SS and SL present a coupling activation effect. SS is a neutral salt, so its activation effect was weak. SL is an alkaline substance containing calcium, so its activation effect was better than SS. The small solubility of SL would increase the initial Ca2+ content and alkalinity in the AASC. A higher SL content may lead to more gel formation [33,34]. However, due to the low solubility of SL, increasing its content has no significant effect on the setting time of AASC.

3.2. Mechanical Strength

Figure 3 and Figure 4 show the mechanical properties of the AASC mortar. It can be seen that when SL alone was used as an activator, the mechanical strength of the AASC mortar continued to increase with SL increasing. When SL increased from 3% to 12%, the compressive and flexural strengths at 3 days increased by 6.5 MPa and 3.6 MPa, increasing by 110.2% and 156.5%, respectively. The compressive and flexural strength at 28 days increased by 4.6 MPa and 2.3 MPa, increasing by 35.7% and 30.7%, respectively. The enhancement effect of increasing SL on the early mechanical properties was more significant, but overall, the mechanical strength was poor.
When SL and SS were used as a compound activator, the mechanical properties of the AASC mortar were obviously different from those with SL alone. According to Section 3.1, when SL was not added, the AASC paste with SS alone could not set and harden normally, and the setting time could not be measured. In addition, the mortar with SS alone could not be molded properly. As illustrated in Figure 4, the mechanical strength of the AASC mixed with SS-SL developed well and was superior to that of the mortar mixed with SL alone. Moreover, it could be seen that the low content of SL was beneficial to high mechanical strength. The increase in SL content resulted in a shorter setting time but no increase in mechanical strength. When the content of SL was 3%, its mechanical properties were the highest.
SL had a certain solubility in water, so its alkalinity was conducive to hydration and an improvement in mechanical strength. However, due to its low solubility, the setting time and strength were not significantly affected. When SL increased gradually, the mechanical strength was slightly improved, and the setting time was slightly shortened. When excessive SL was added, the unreacted SL existed in the form of portlandite crystals [35]. Portlandite crystals are hexagonal plates with a layered cleavage surface and brittle interface and can affect the growth of mechanical strength [8,36]. Meanwhile, the workability of the mortar in the plastic state was reduced due to the higher water requirement of SL, thus reducing the compactness and also affecting the mechanical properties [37]. In the SS-SL system, when the SS content was too high, excessive SS existed in the form of hexagonal plate-like crystals without the gelling property, which were not easily dissolved in water and produced pores in the cement stone, thus reducing the strength. At the same time, the alkalinity of the system increased, and the coupling between SL and SS enhanced the hydration reaction. The increased strength of the system was attributed to the formation of ettringite, which had a denser microstructure, resulting in higher strength [27,38,39]. In conclusion, in terms of mechanical strength, a high SL content was preferred when slaked lime was added alone. When SS was mixed with SL, a low SL content was preferred.

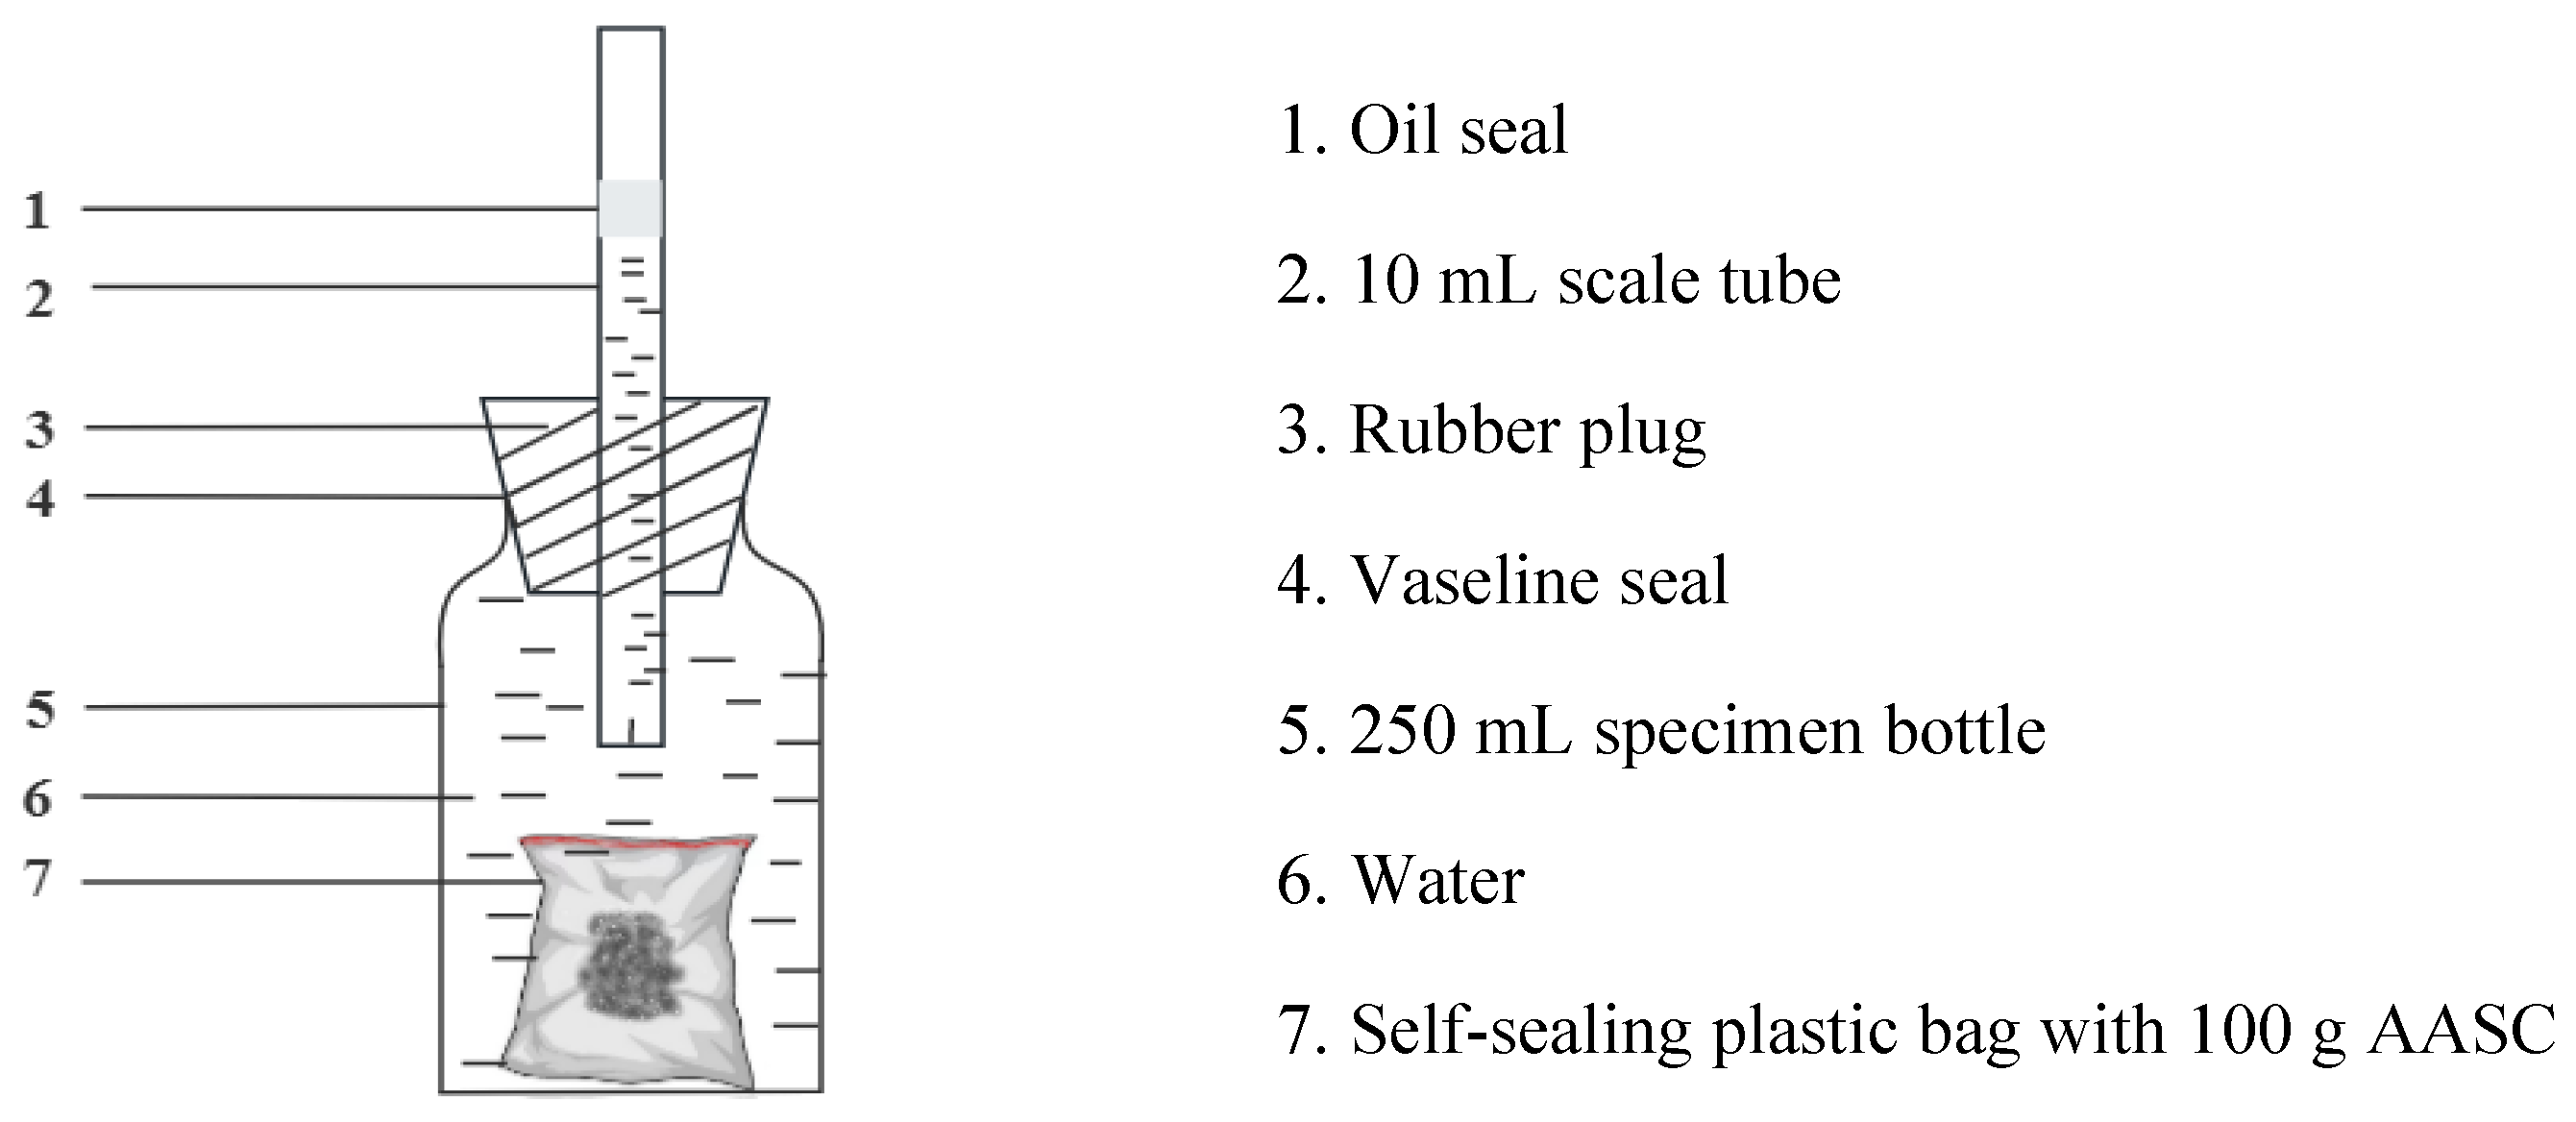
3.3. Autogenous Shrinkage

Figure 5 and Figure 6 depict the autogenous shrinkage of AASC. Compared with the SL system, obviously, the autogenous shrinkage of the SS-SL system was greater. The autogenous shrinkage of the SS-SL system grew more rapidly than that of the SL system. The autogenous shrinkage of the AASC paste prepared with a mixture of SS and SL as the base component was 2–3 times greater than that of ordinary Portland cement with the same water–binder ratio. When SL increased, the autogenous shrinkage of the two AASC systems increased. It increased rapidly within 24 h and then increased gently with the increase in age.
As shown in Figure 6a, when SL was used alone and the content increased from 3% to 12%, the autogenous shrinkage within 24 h increased by 43.0%. The autogenous shrinkage within 7 days increased by 15.4%. The autogenous shrinkage within 24 h accounted for 58.9% to 73.0% of the autogenous shrinkage within 7 days. As depicted in Figure 6b, when SS was used alone (SS-SL0), the autogenous shrinkage was only 0.63 mL/100 g within 24 h and 1.98 mL/100 g within 7 days. When SL and SS were added, the autogenous shrinkage increased significantly. When the SL content was 12%, the autogenous shrinkage increased by 346.0% and 477.8% within 24 h, and 92.9% and 123.2% within 7 days compared with 0 and 3%. When the SL content was 3% and 12%, the autogenous shrinkage within 24 h accounted for 73.6% and 82.4% of the autogenous contraction within 7 days, respectively.
Autogenous shrinkage mainly includes chemical shrinkage and self-drying shrinkage, both of which are closely related to the hydration process [29,40,41]. Self-drying shrinkage refers to the continuous consumption of water during AASC hydration, which causes a decrease in the internal humidity of the paste and the liquid level of the gel hole, forming a meniscus, and the resulting capillary stress causes a large shrinkage. The acceleration of hydration leads to a reduction in the internal humidity of cement paste, leading to capillary stress and greater self-drying shrinkage [42]. Thus, on the first day of initial hydration, autogenous shrinkage is thought to be primarily induced by chemical shrinkage [43]. During the hardening phase, the rearrangement and sequential recombination of gel structures may also result in autogenous shrinkage [43,44,45,46]. In this paper, when SL increased, the alkalinity of the AASC paste increased, and the AASC hydration accelerated, forming more gel and capillary stress [44]. So, autogenous shrinkage increased [17,47,48]. In addition, on account of the high-water demand of SL, when SL increased, the free water in the AASC paste decreased, and the internal humidity decreased more, which easily caused large capillary stress and large autogenous shrinkage. The sulfate ions in the SS-SL system would contribute to forming the sulfate-containing (N) -C-A-S-H phase. The microstructure was more compact, leading to large capillary pressure and shrinkage [44].
When SS was added alone (SS-SL0), due to the low alkalinity of the system, the setting time was not measured within 1 day, and the mortar could not be molded properly. However, a slight amount of shrinkage occurred, as depicted in Figure 5b. The authors believed that this was primarily because of the adsorption of free water by precursor powder material.

3.4. Drying Shrinkage

Figure 7 displays the drying shrinkage of the AASC mortar. It developed quickly in the early 28 days and slowly thereafter. In the SL system, the drying shrinkage gradually increased when SL increased. When SL increased from 3% to 12%, the drying shrinkage increased from 0.08% to 0.10% at 28 days and from 0.12% to 0.14% at 180 days. The percentage of drying shrinkage at 28 days was 66.7~71.4% of that at 180 days. In the SS-SL system, the drying shrinkage gradually decreased when SL increased. When SL increased from 3% to 12%, the drying shrinkage decreased from 0.13% to 0.09% at 28 days and from 0.18% to 0.16% at 180 days. The 28-day drying shrinkage accounted for 72.2–56.3% of the 180-day drying shrinkage. Additionally, when the content of SL was same, the drying shrinkage of the SS-SL system in late stage was greater than that of the SL system. This indicated that the influence of SL on drying shrinkage was different when SL was added alone and when SL was added simultaneously with SS.
The drying shrinkage of AASC is affected by the type of hydration product, pore structure and properties of the gel [17,49]. Portlandite (CH) and ettringite (AFt) in PC hydration products result in a decrease in drying shrinkage. A lot of gel is formed during AASC hydration. Under the experimental conditions, the increase in AASC mortar drying shrinkage was due to the loss of adsorbed water on the gel surface [50,51]. Collins et al. found that up to 81.3% of the pores in AASC were mesoporous (10–50 nm), and it was believed that the mesopores in the hardening stage were the main reason for drying shrinkage [52,53,54].
Figure 8 displays the pore size distribution of AASC. The cumulative pore volume of the SS-SL system was greater than that of the SL system, thus resulting in larger drying shrinkage of the SS-SL system. When the SL content changed from 5% to 10%, the cumulative pore volume of the SL system reduced, while the mesopore volume percentage increased from 57% to 60%. In the SS-SL system, the cumulative pore volume decreased, and the mesoporous volume percentage also decreased from 67% to 47%. So, when SL increased, the shrinkage of the SS-SL-activated AASC decreased, and the SL system increased. From the pore structure analysis, the percentage content of mesopores increased while the SL-SS system decreased when SL was used as an alkali component alone, which is the reason why the former drying shrinkage increased with the increase in SL content, and the latter drying shrinkage decreased with the increase in SL content. Although the number of mesopores decreased with the increase in SL in the SL system, the percentage occupied by the mesopores increased. It can be seen from Figure 9b that in the SL system, the total number of pores decreased with the increase in SL, indicating that the system structure became more compact with the increase in SL, which was also the reason for the increase in strength. Moreover, there were more large pores in SS-SL10, so its mechanical property was lower than that of SS-SL5 with less SL (see Section 3.2).
In addition, with the increase in SL, the increase in alkalinity and the introduction of more Ca2+ favored the formation of more gel, resulting in increased shrinkage. The product of crystalline phase hydrotalcite and AFt, as well as residual CH crystals, can inhibit the development of drying shrinkage. From the analysis in Section 3.5, it appeared that the increase in SL had little influence on the crystal phase products. Of course, the presence of more AFt, hydrotalcite and portlandite in SS-SL10 than in SS-SL5 helped reduce drying shrinkage.

3.5. Effect of SL on the Microstructure of AASC
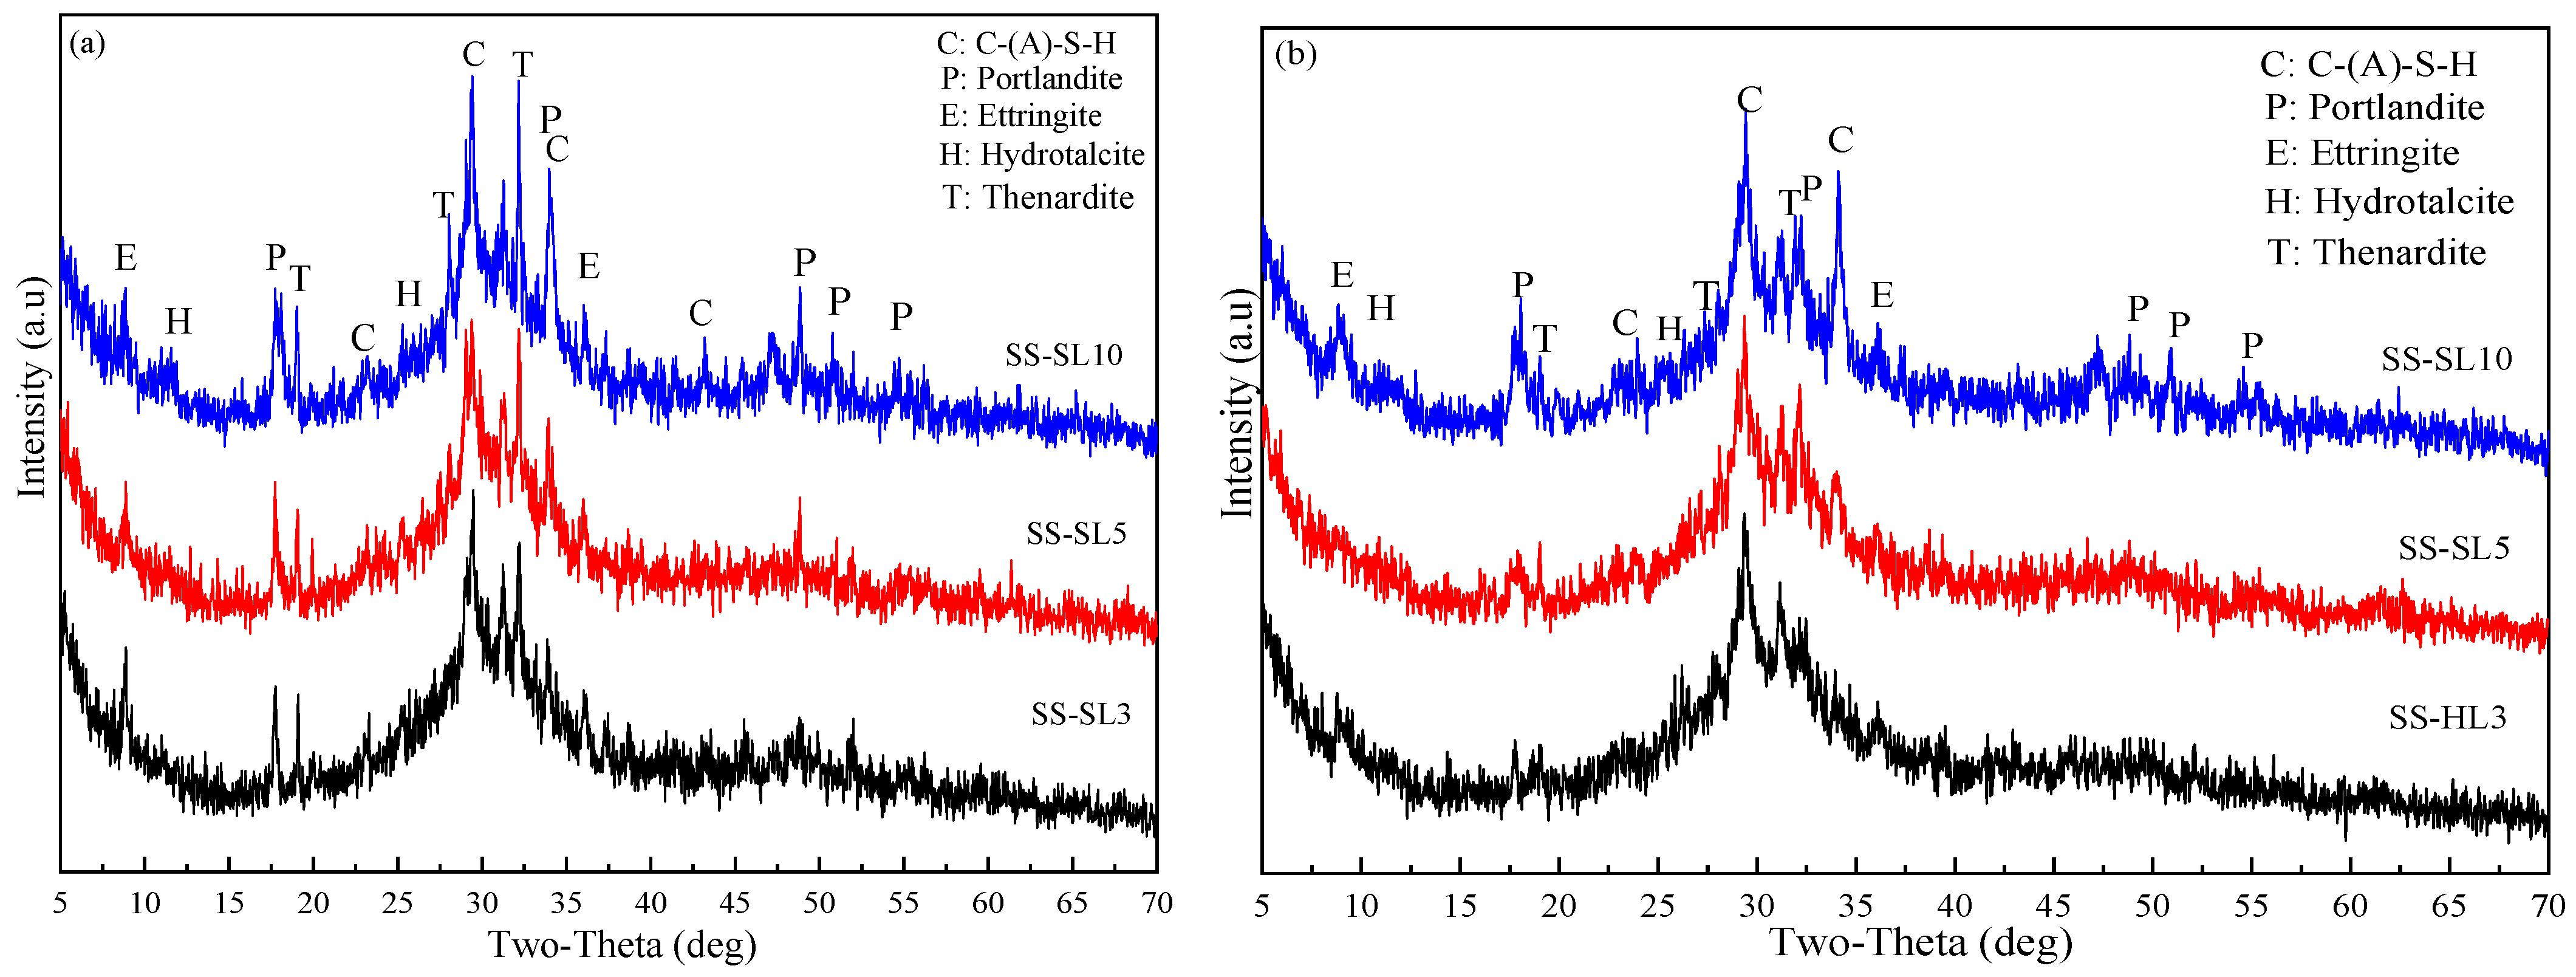
3.5.1. XRD of AASC

Figure 10 and Figure 11 show the composition of the phases of AASC obtained with XRD. As depicted in the images, the hydration products were primarily composed of hydrotalcite, portlandite, and gel, regardless of the SL content and activator type. When SL increased, the characteristic peak of hydrotalcite became sharper, and the portlandite diffraction peak appeared and was higher, which was more obvious at 28 days. This indicated that SL could promote the hydration of AASC; however, some of the SL did not participate in the reaction. In the SS-SL system, the diffraction peak of AFt appeared, and when SL increased, the diffraction peak was enhanced slightly. This indicated that SS contributed to the formation of AFt, and SL promoted this process. Compared with the SL system, the diffraction peak of hydrotalcite was relatively low. Since the SO42− introduced by SS that would first react with Ca2+ and Al3+ was consumed, AFt was preferentially formed over hydrotalcite, thus inhibiting the formation of hydrotalcite [37]. At 3 days, a strong diffraction peak of thenardite was found (Figure 11a), and at 28 days, the diffraction peak was weakened (Figure 11b), indicating that with the extension of age, more SS participated in the reaction but was not fully reacted.

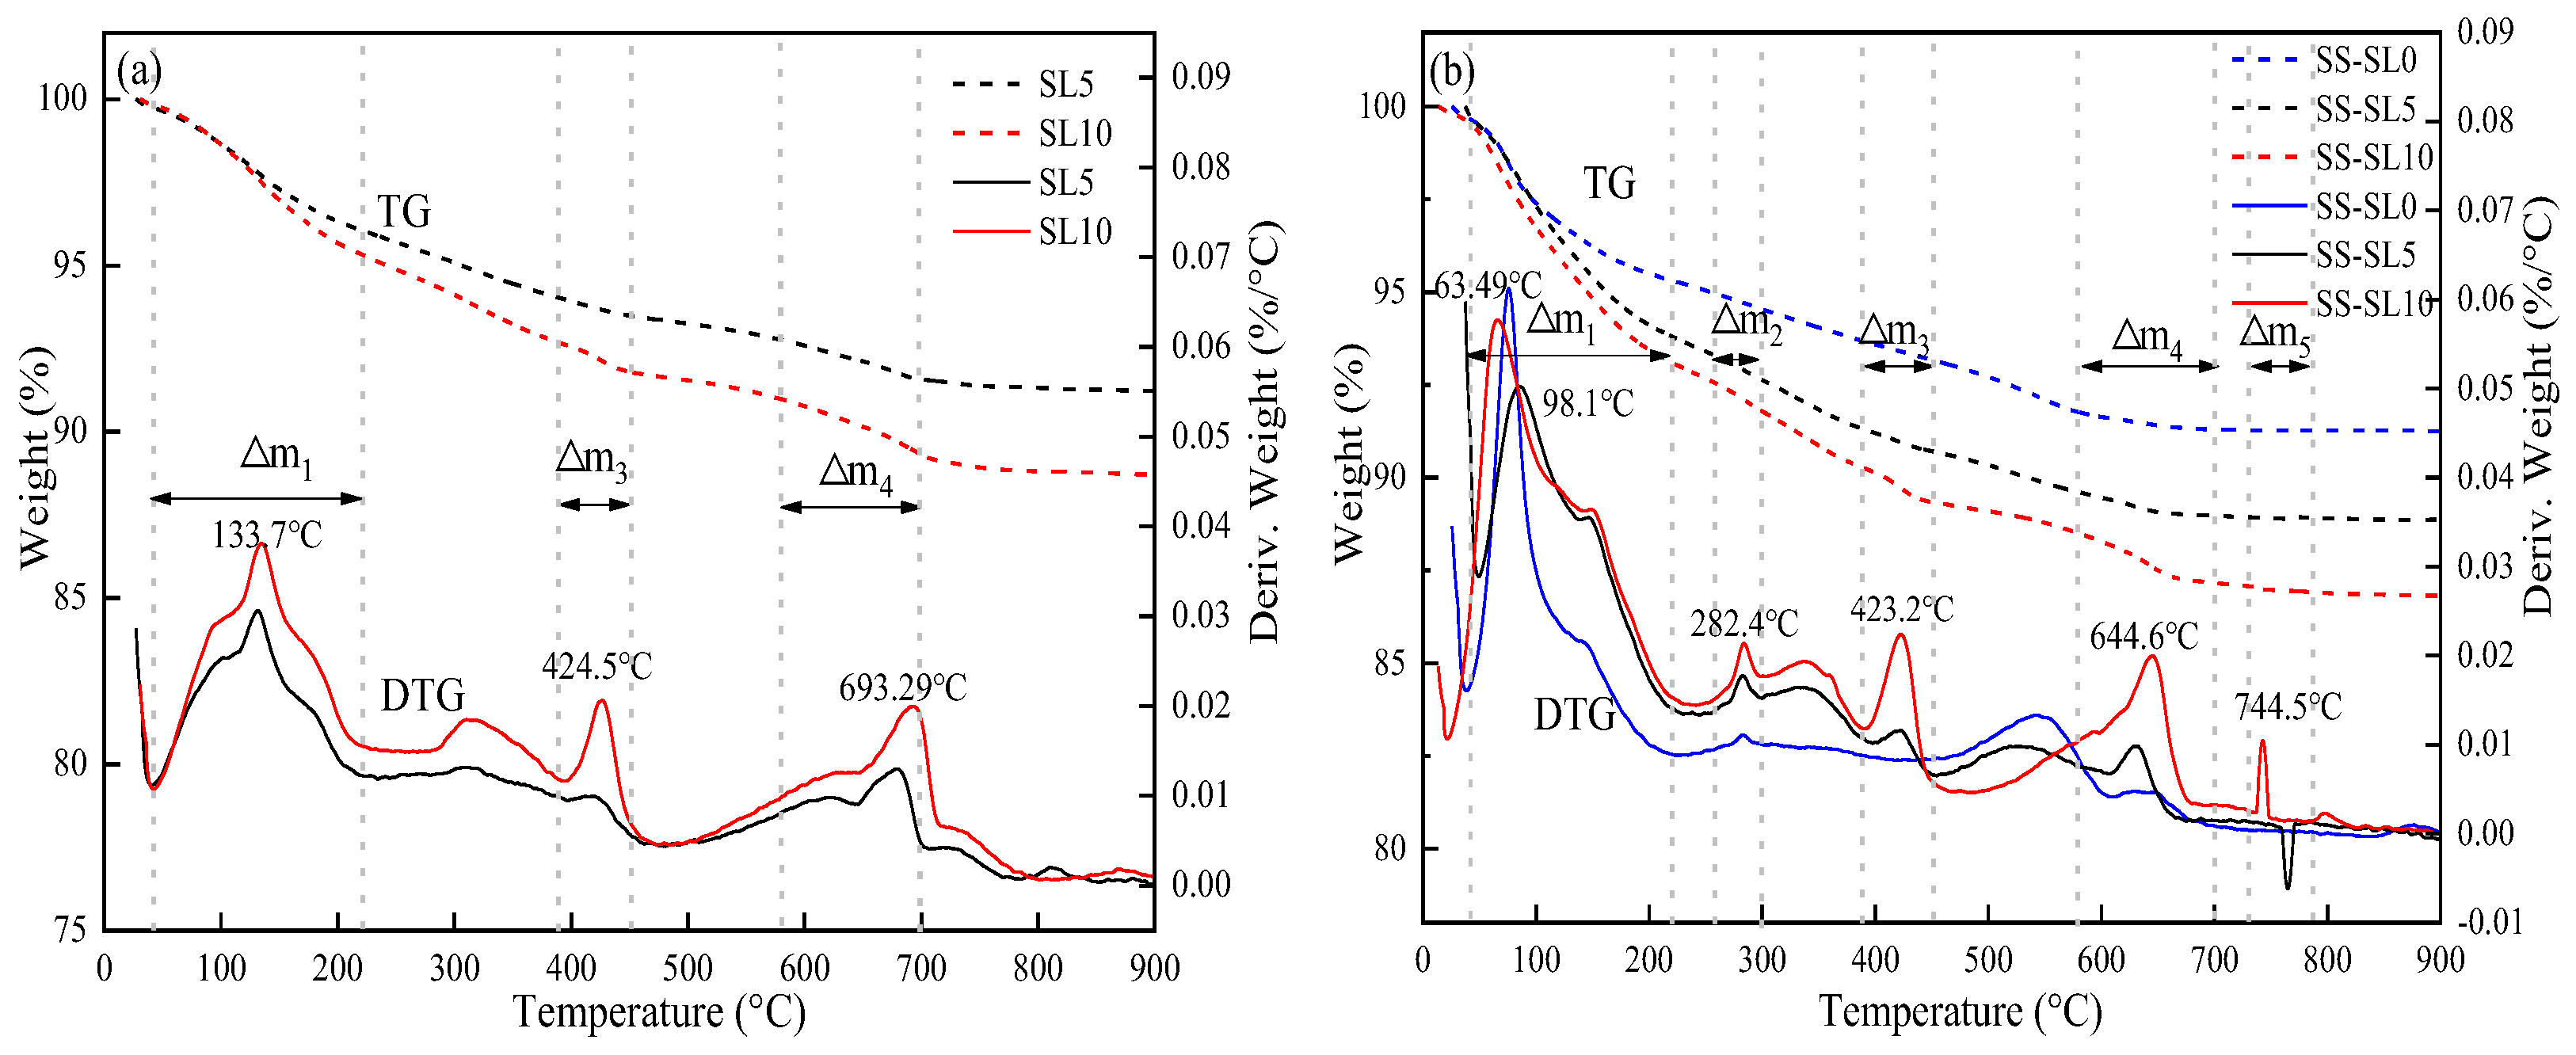
3.5.2. TG-DTG of AASC

Figure 12 and Table 5 show the TG-DTG of the AASC paste at 28 days. When the temperature was about 40–220 °C, it was accompanied by the volatilization of free water and the decomposition of gel-adsorbed water [55]. When the temperature rose to about 260–300 °C, the mass loss was AFt dehydration [55]. When the temperature rose to 390–450 °C, the mass loss was the dehydration of bound water in hydrotalcite [55,56]. When the temperature rose to about 580–700 °C, the mass loss was the dehydration of portlandite [55]. When the temperature rose to about 730–780 °C, decomposed the carbonate phase in hydrotalcite [55]. The percentage of mass loss in the above five stages was expressed by Δm1, Δm2, Δm3, Δm4 and Δm5. The experimental results show that the incorporation of SL promoted the formation of hydration products. Moreover, only Δm2 corresponding to AFt appeared in the SS-SL system, and Δm2 increased slightly with the increase in SL from 0 to 10%. This further explained that the drying shrinkage in the SS-SL system decreased with the increase in SL.

3.5.3. SEM of AASC

Figure 13 shows the SEM image and EDS of the AASC paste. Table 6 shows the phase fractions of EDS. As shown in Figure 13a, when SL was added alone, unhydrated SL crystals were interspersed in the gel. As shown in Figure 13b, when SS alone was used as an activator, the overall structure was very loose. The XRD and EDS analyses showed that there were many unhydrated GBFS particles and long strips of unreacted SS particles. When SL and SS were mixed together, it was found that there were irregular needle-like substances and flocculated substances, which were AFt and C-A-S-H gel [35,57]. The gel appeared in a cross shape or honeycomb shape on the paste surface or embedded in the paste, which improved the overall hydration degree and made the paste of the AASC denser [58,59]. As shown in Figure 13d, many hexagonal flake crystals grew from the surface of the hydration product. It could be inferred that this was portlandite combined with EDS and XRD [60,61,62,63]. This further indicated that SL was not fully involved in the reaction. The presence of Al, Si, Na et al. in EDS may be caused by secondary electrons penetrating into the surrounding gel.

4. Conclusions

(1)
When SL was mixed alone or SL was mixed with SS, when SL increased, the setting time decreased, although the decrease was small. The mechanical strength of the SL system was poor. In the SS-SL system, when SL increased, the setting time decreased, but the mechanical properties did not increase. When the content of SL was 3%, its mechanical properties were optimal.
(2)
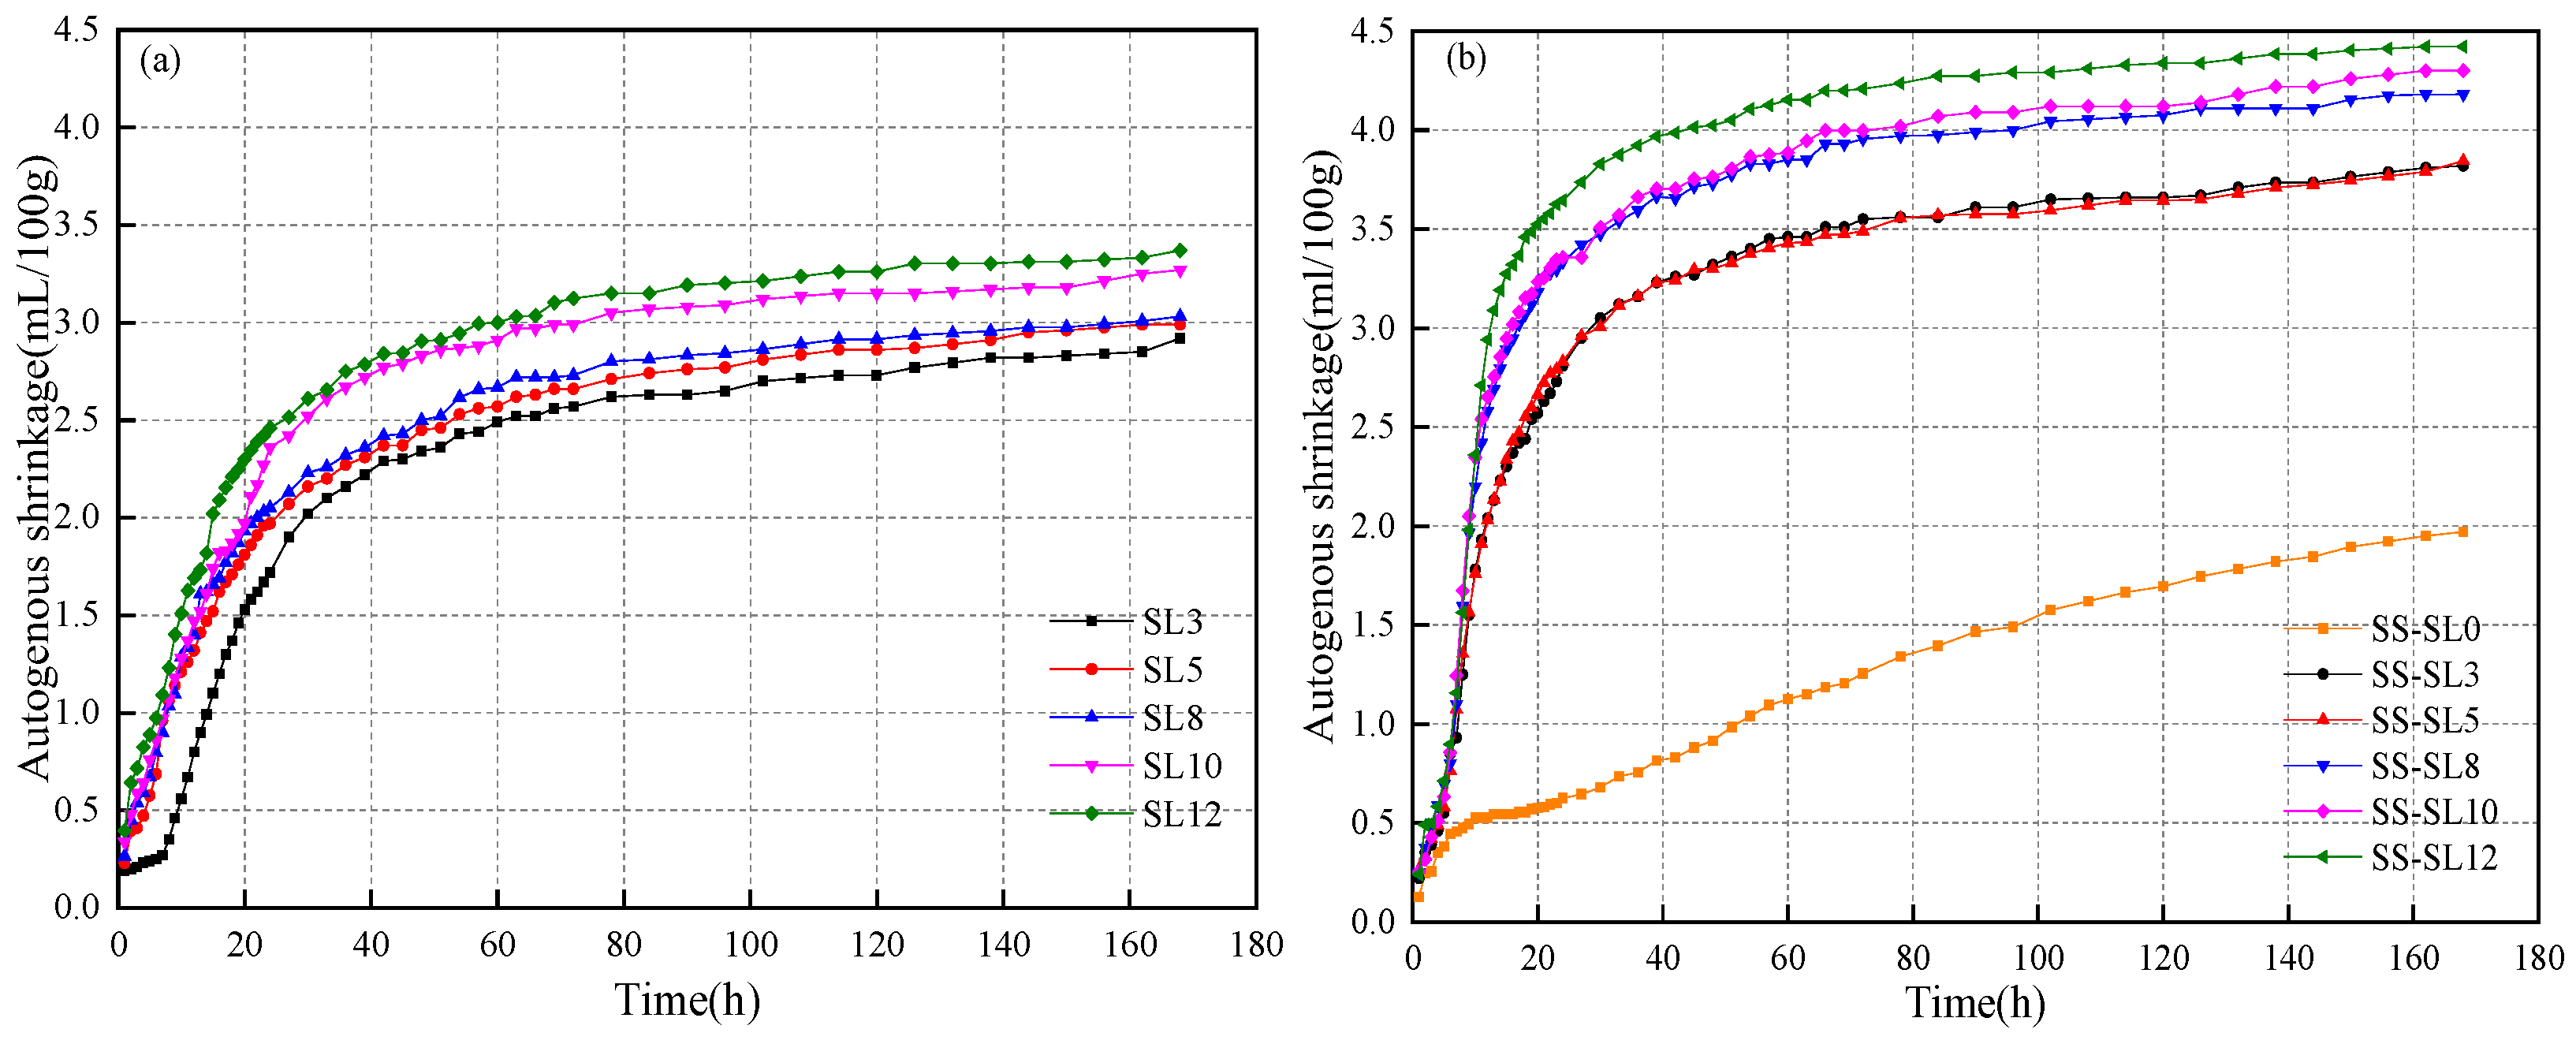
The autogenous shrinkage of the SS-SL system was obviously greater and developed more rapidly than that with SL alone. When SL increased, the autogenous shrinkage of both systems increased.
(3)
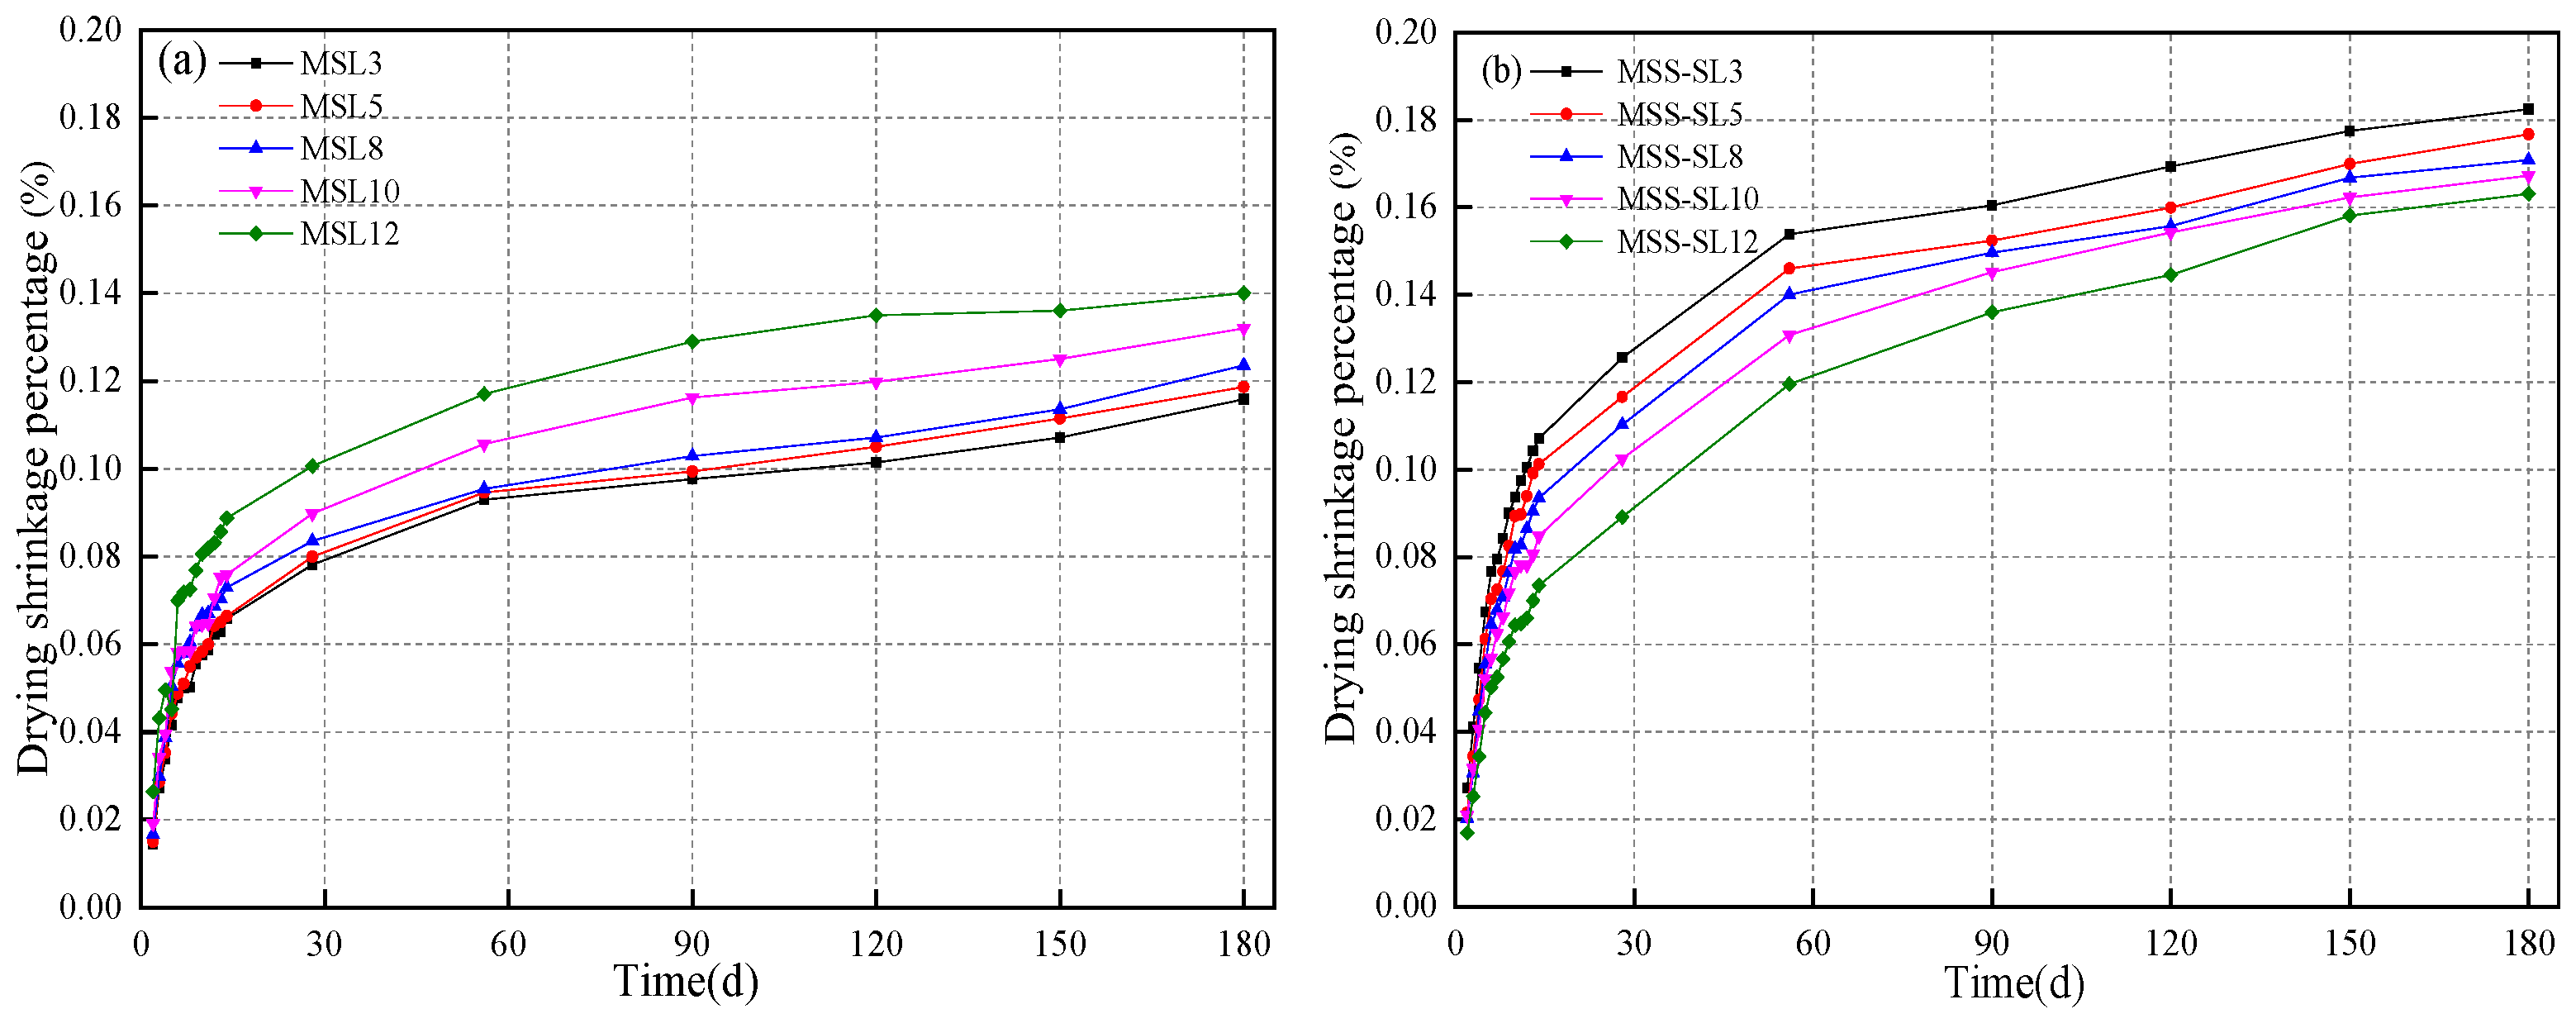
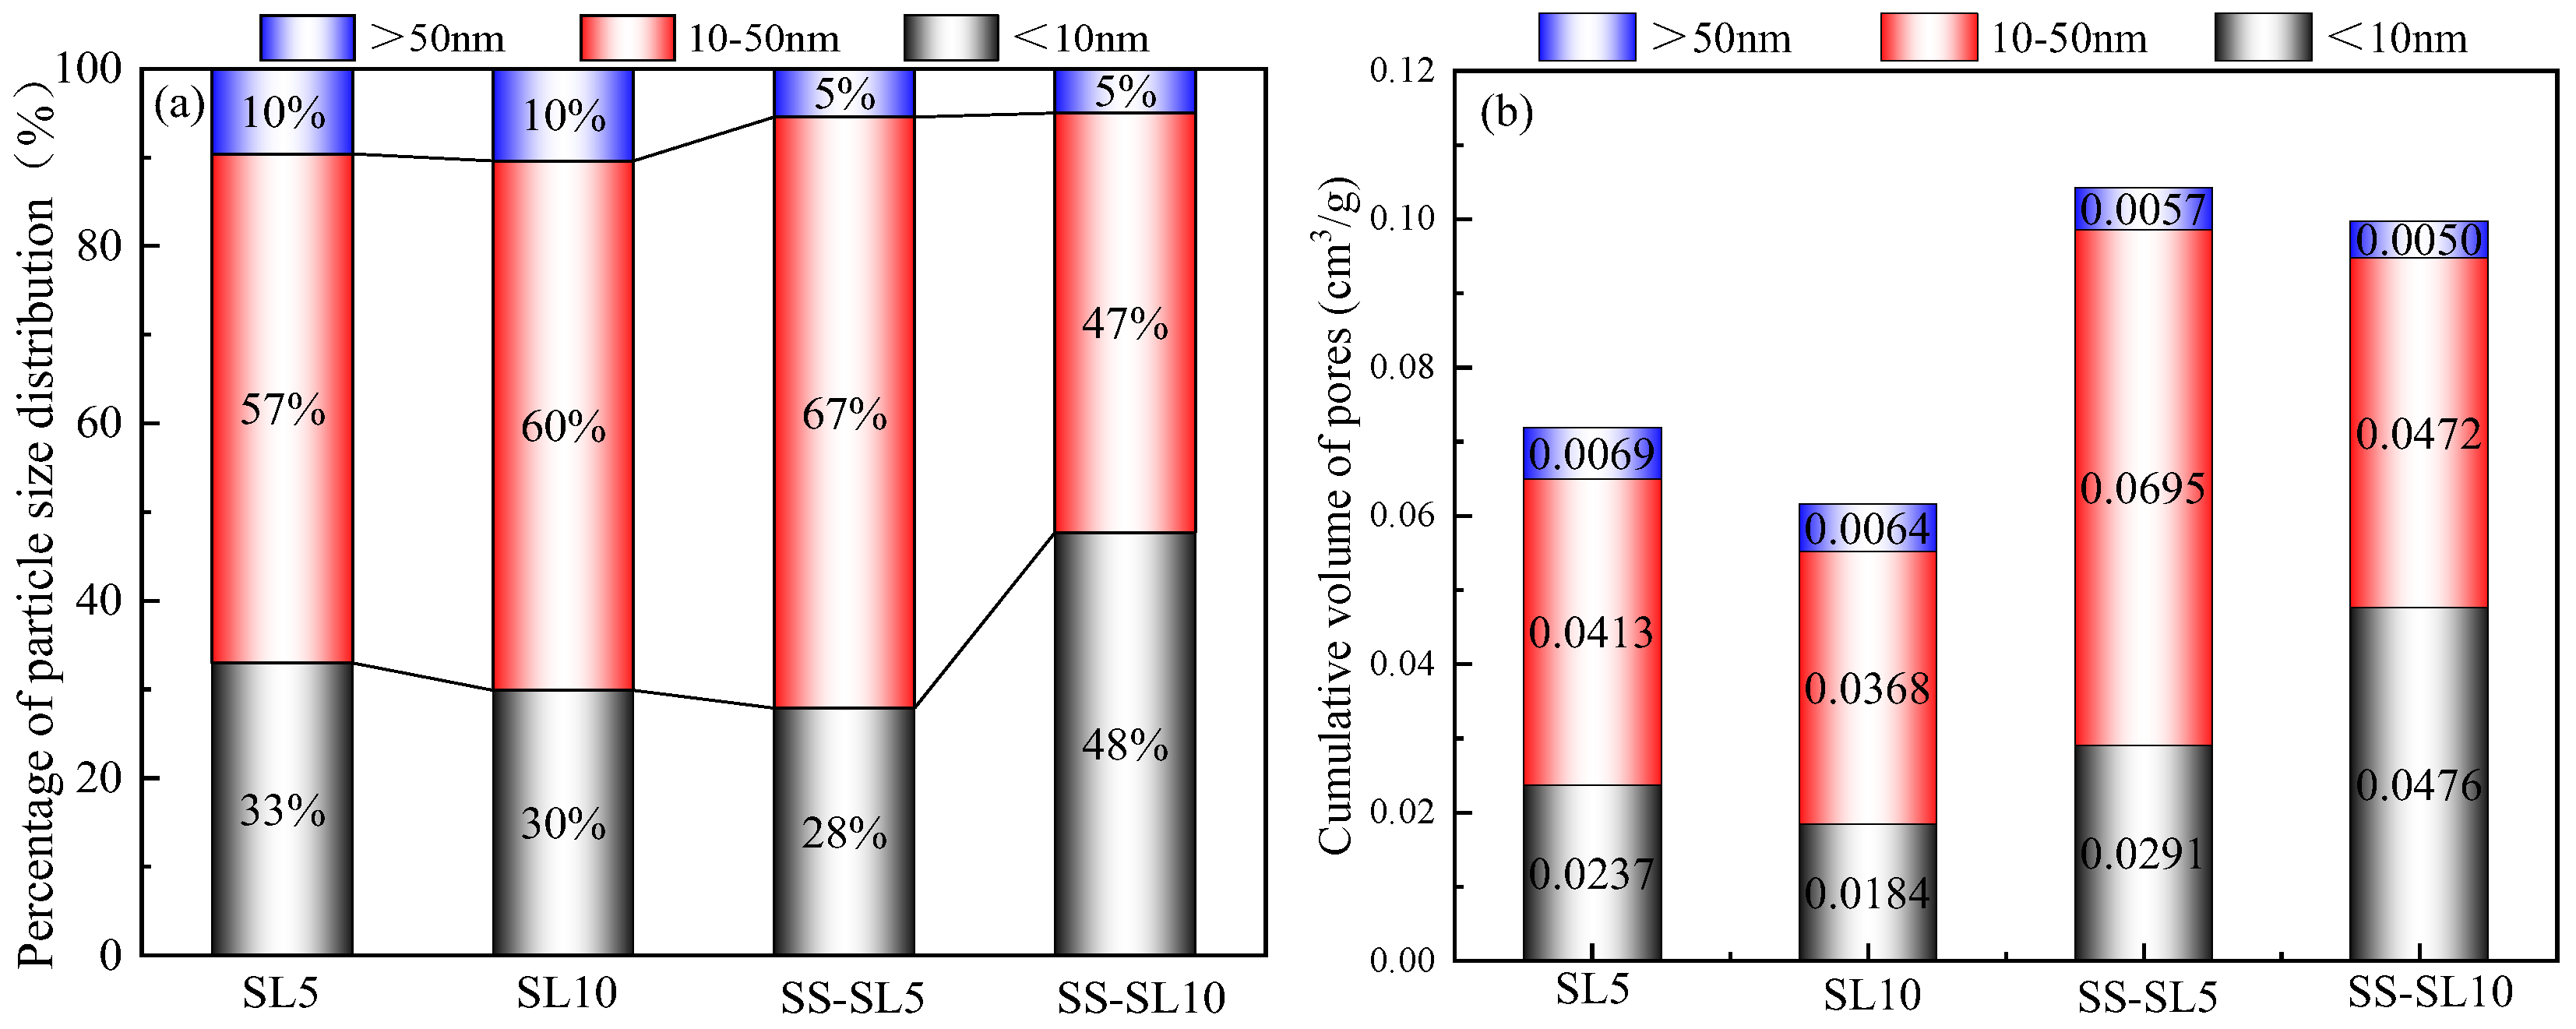
When SL was added alone, the increase in SL led to an increase in drying shrinkage. When SL and SS were mixed, the increase in SL led to a reduction in drying shrinkage. The influence of SL on the dry shrinkage in these two systems was different. From the perspective of the hydration product, when SL was used alone, the increase in SL led to an increase in alkalinity, and the introduction of Ca2+ was conducive to the formation of more gels. When SS-SL was mixed, the crystalline phase in the product was mainly hydrotalcite and AFt, which can inhibit the development of dry shrinkage. From the analysis in Section 3.5, the increase in SL had little effect on the crystalline phase product. The greater amounts of AFt, hydrotalcite and portlandite in SS-SL10 compared with SS-SL5 all contributed to reducing drying shrinkage.
(4)
SL as an activator can effectively promote the hydration of AASC. However, the addition of SS promoted the formation of AFt with micro-expansion properties, which helped to reduce drying shrinkage.
(5)
SS could not be used as an activator alone, while SL could be used as an activator alone. SS could be combined with SL to prepare AASC. Although SL could be used as an activator alone, it was detrimental to the development of mechanical strength. The AASC prepared by mixing SS and SL had better mechanical strength: when the content of SL was 3%, the highest mechanical strength was obtained, but the drying shrinkage was the largest. Therefore, when SS and SL were used as compound activators, their effects on mechanical strength and drying shrinkage should be considered comprehensively.

Author Contributions

J.H.: methodology and writing—reviewing and editing. M.L.: writing—original draft, investigation, and data curation. W.B.: formal analysis and visualization. G.S.: validation and funding acquisition. X.S.: formal analysis and validation. All authors have read and agreed to the published version of the manuscript.

Funding

The authors appreciate the assistance provided by the National Natural Science Foundation of China (NSFC, 52078420) for this project.

Data Availability Statement

The data presented in this study are available on request from the corresponding author.

Conflicts of Interest

We declare that we do not have any commercial or associative interests that represent conflicts of interest in connection with this submitted manuscript.

References

  1. Malhotra, V.M. Introduction: Sustainable Development and Concrete Technology. Concr. Int. 2002, 24, 22. [Google Scholar]
  2. Gartner, E. Industrially interesting approaches to “low-CO2” cements. Cem. Concr. Res. 2004, 34, 1489–1498. [Google Scholar] [CrossRef]
  3. Provis, J.L.; Palomo, A.; Shi, C. Advances in understanding alkali-activated materials. Cem. Concr. Res. 2015, 78, 110–125. [Google Scholar] [CrossRef]
  4. Provis, J.L. Alkali-activated materials. Cem. Concr. Res. 2018, 114, 40–48. [Google Scholar] [CrossRef]
  5. Luukkonen, T.; Abdollahnejad, Z.; Yliniemi, J.; Kinnunen, P.; Illikainen, M. One-part alkali-activated materials: A review. Cem. Concr. Res. 2018, 103, 21–34. [Google Scholar] [CrossRef]
  6. Haha, M.B.; Le Saout, G.; Winnefeld, F.; Lothenbach, B. Influence of activator type on hydration kinetics. hydrate assemblage and microstructural development of alkali activated blast-furnace slags. Cem. Concr. Res. 2011, 41, 301–310. [Google Scholar] [CrossRef]
  7. Aydın, S.; Baradan, B. Effect of activator type and content on properties of alkali-activated slag mortars. Compos. Part B—Eng. 2014, 57, 166–172. [Google Scholar] [CrossRef]
  8. He, J.; Bai, W.; Zheng, W.; He, J.; Sang, G. Influence of hydrated lime on mechanical and shrinkage properties of alkali-activated slag cement. Constr. Build. Mater. 2021, 289, 123201. [Google Scholar] [CrossRef]
  9. Yuan, B.; Yu, Q.L.; Brouwers, H.J.H. Reaction kinetics. Reaction products and compressive strength of ternary activators activated slag designed by Taguchi method. Mater. Des. 2015, 86, 878–886. [Google Scholar] [CrossRef]
  10. He, J.; Zheng, W.; Bai, W.; Hu, T.; He, J.; Song, X. Effect of reactive MgO on hydration and properties of alkali-activated slag pastes with different activators. Constr. Build. Mater. 2021, 271, 121608. [Google Scholar] [CrossRef]
  11. Bakharev, T.; Sanjayan, J.G.; Cheng, Y.-B. Alkali activation of Australian slag cements. Cem. Concr. Res. 1999, 29, 113–120. [Google Scholar] [CrossRef]
  12. Fang, S.; Lam, E.S.S.; Li, B.; Wu, B. Effect of alkali contents, moduli and curing time on engineering properties of alkali activated slag. Constr. Build. Mater. 2020, 249, 118799. [Google Scholar] [CrossRef]
  13. Song, J.-K.; Yang, K.-H.; Kim, G.-W.K.B. Properties of sodium alkali-activated ground granulated blast-furnace slag (GGBS) mortar. J. Archit. Inst. Korea 2010, 26, 61–68. [Google Scholar]
  14. Neto, A.A.M.; Cincotto, M.A.; Repette, W. Drying and autogenous shrinkage of pastes and mortars with activated slag cement. Cem. Concr. Res. 2008, 38, 565–574. [Google Scholar] [CrossRef]
  15. Chen, W.; Li, B.; Guo, M.-Z.; Wang, J.; Chen, Y.-T. Impact of heat curing regime on the compressive strength and drying shrinkage of alkali-activated slag mortar. Dev. Built. Environ. 2023, 14, 100123. [Google Scholar] [CrossRef]
  16. Atiş, C.D.; Bilim, C.; Çelik, Ö.; Karahan, O. Influence of activator on the strength and drying shrinkage of alkali-activated slag mortar. Constr. Build. Mater. 2009, 23, 548–555. [Google Scholar] [CrossRef]
  17. Collins, F.; Sanjayan, J.G. Effect of pore size distribution on drying shrinkage of alkali-activated slag concrete. Cem. Concr. Res. 2000, 30, 1401–1406. [Google Scholar] [CrossRef]
  18. Taghvayi, H.; Behfarnia, K.; Khalili, M. The Effect of Alkali Concentration and Sodium Silicate Modulus on the Properties of Alkali-Activated Slag Concrete. J. Adv. Concr. Technol. 2018, 16, 293–305. [Google Scholar] [CrossRef]
  19. Shi, C.; Roy, D.; Krivenko, P. Alkali-Activated Cements and Concretes; CRC Press: Boca Raton, FL, USA, 2003. [Google Scholar]
  20. Habert, G.; de Lacaillerie, J.B.D.; Roussel, N. An environmental evaluation of geopolymer based concrete production: Reviewing current research trends. J. Clean. Prod. 2011, 19, 1229–1238. [Google Scholar] [CrossRef]
  21. Bernal, S.A.; Nicolas, R.S.; Deventer, J.S.J.V.; Provis, J.L. Alkali-activated slag cements produced with a blended sodium carbonate/sodium silicate activator. Adv. Cem. Res. 2016, 28, 262–273. [Google Scholar] [CrossRef]
  22. Yuan, B.; Yu, Q.L.; Brouwers, H.J.H. Evaluation of slag characteristics on the reaction kinetics and mechanical properties of Na2CO3 activated slag. Constr. Build. Mater. 2017, 131, 334–346. [Google Scholar] [CrossRef]
  23. Rashad, A.M.; Bai, Y.; Basheer, P.A.M.; Milestone, N.B.; Collier, N.C. Hydration and properties of sodium sulfate activated slag. Cem. Concr. Compos. 2013, 37, 20–29. [Google Scholar] [CrossRef]
  24. Tan, H.; Deng, X.; He, X.; Zhang, J.; Zhang, X.; Su, Y.; Yang, J. Compressive strength and hydration process of wet-grinded granulated blast-furnace slag activated by sodium sulfate and sodium carbonate. Cem. Concr. Compos. 2019, 97, 387–398. [Google Scholar] [CrossRef]
  25. Ma, C.; Zhao, B.; Wang, L.; Long, G.; Xie, Y. Clean and low-alkalinity one-part geopolymeric cement: Effects of sodium sulfate on microstructure and properties. J. Clean. Prod. 2020, 252, 119279. [Google Scholar] [CrossRef]
  26. Nguyen, H.-A.; Chang, T.-P.; Thymotie, A. Enhancement of early engineering characteristics of modified slag cement paste with alkali silicate and sulfate. Constr. Build. Mater. 2020, 230, 117013. [Google Scholar] [CrossRef]
  27. Yang, K.-H.; Cho, A.-R.; Song, J.-K.; Nam, S.-H. Hydration products and strength development of calcium hydroxide-based alkali-activated slag mortars. Constr. Build. Mater. 2012, 29, 410–419. [Google Scholar] [CrossRef]
  28. Yang, K.-H.; Sim, J.-I.; Nam, S.-H. Enhancement of reactivity of calcium hydroxide-activated slag mortars by the addition of barium hydroxide. Constr. Build. Mater. 2010, 24, 241–251. [Google Scholar] [CrossRef]
  29. Neto, A.A.M.; Cincotto, M.A.; Repette, W. Mechanical properties, drying and autogenous shrinkage of blast furnace slag activated with hydrated lime and gypsum. Cem. Concr. Compos. 2010, 32, 312–318. [Google Scholar] [CrossRef]
  30. GB/T 1346-2011; Test Methods for Water Requirement of Normal Consistency, Setting Time and Soundness of the Portland Cement. China Standards Press: Beijing, China, 2011.
  31. GB/T 17671-2021; Method of Testing Cements-Determination of Strength. China Standards Press: Beijing, China, 2021.
  32. JGJ/T 70-2009; Standard for Test Method of Performance on Building Mortar. China Architecture and Building Press: Beijing, China, 2009.
  33. Lee, N.K.; Lee, H.K. Reactivity and reaction products of alkali-activated. fly ash/slag paste. Constr. Build. Mater. 2015, 81, 303–312. [Google Scholar] [CrossRef]
  34. Puligilla, S.; Monda, P. Role of slag in microstructural development and hardening of fly ash-slag geopolymer. Cem. Concr. Res. 2013, 43, 70–80. [Google Scholar] [CrossRef]
  35. Harutyunyan, V.S.; Kirchheim, A.P.; Monteiro, P.J.M.; Aivazyan, A.P.; Fischer, P. Investigation of early growth of calcium hydroxide crystals in cement solution by soft X-ray transmission microscopy. J. Mater. Sci. 2009, 44, 962–969. [Google Scholar] [CrossRef]
  36. Shen, Y.; Tang, M.; Shen, X. Growth Habit of Portlandite Crystal in Cement Paste. J. Chin. Ceram. Soc. 2016, 44, 232–238. [Google Scholar] [CrossRef]
  37. Zhu, X.-H.; Tang, D.-S.; Yang, K.; Zhang, Z.-L.; Li, Q.; Pan, Q.; Yang, C.-H. Effect of Ca(OH)2 on shrinkage characteristics and microstructures of alkali-activated slag concrete. Constr. Build. Mater. 2018, 175, 467–482. [Google Scholar] [CrossRef]
  38. Yang, K.-H.; Cho, A.-R.; Song, J.-K. Effect of water–binder ratio on the mechanical properties of calcium hydroxide-based alkali-activated slag concrete. Constr. Build. Mater. 2012, 29, 504–511. [Google Scholar] [CrossRef]
  39. Bernal, S.A.; Krivenko, P.V.; Provis, J.L.; Puertas, F.; Rickard, W.D.A.; Shi, C.; van Riessen, A. Other Potential Applications for Alkali-Activated Materials. In Alkali Activated Materials: State-of-the-Art Report, RILEM TC 224-AAM; Provis, J.L., van Deventer, J.S.J., Eds.; Springer: Dordrecht, The Netherlands, 2014; pp. 339–379. [Google Scholar]
  40. Li, Z.; Lu, T.; Liang, X.; Dong, H.; Ye, G. Mechanisms of autogenous shrinkage of alkali-activated slag and fly ash pastes. Cem. Concr. Res. 2020, 135, 10610. [Google Scholar] [CrossRef]
  41. Li, Z.; Liang, X.; Chen, Y.; Ye, G. Effect of metakaolin on the autogenous shrinkage of alkali-activated slag-fly ash paste. Constr. Build. Mater. 2021, 278, 122397. [Google Scholar] [CrossRef]
  42. Liao, Y.; Gui, Y.; Ke, F.; Liao, G. Effect of Temperature on Compressive Strength, Electrical Resistivity and Chemical Shrinkage of Calcium Sulphoaluminate. Cem. J. Build. Mater. 2018, 21, 478–489. [Google Scholar]
  43. Fang, G.; Bahrami, H.; Zhang, M. Mechanisms of autogenous shrinkage of alkali-activated fly ash-slag pastes cured at ambient temperature within 24 h. Constr. Build. Mater. 2018, 171, 377–387. [Google Scholar] [CrossRef]
  44. Ye, H.; Radlińska, A. Shrinkage mitigation strategies in alkali-activated slag. Cem. Concr. Res. 2017, 101, 131–143. [Google Scholar] [CrossRef]
  45. Ye, H.; Radlińska, A. Shrinkage mechanisms of alkali-activated slag. Cem. Concr. Res. 2016, 88, 126–135. [Google Scholar] [CrossRef]
  46. Hojati, M.; Radlińska, A. Shrinkage and strength development of alkali-activated fly ash-slag binary cements. Constr. Build. Mater. 2017, 150, 808–816. [Google Scholar] [CrossRef]
  47. Lee, N.K.; Jang, J.G.; Lee, H.K. Shrinkage characteristics of alkali-activated fly ash/slag paste and mortar at early ages. Cem. Concr. Compos. 2014, 53, 239–248. [Google Scholar] [CrossRef]
  48. Kumarappa, D.B.; Peethamparan, S.; Ngami, M. Autogenous shrinkage of alkali activated slag mortars: Basic mechanisms and mitigation methods. Cem. Concr. Res. 2018, 109, 1–9. [Google Scholar] [CrossRef]
  49. Aydın, S.; Baradan, B. Mechanical and microstructural properties of heat cured alkali-activated slag mortars. Mater. Des. 2012, 35, 374–383. [Google Scholar] [CrossRef]
  50. Shi, C.; He, F.; Fernández-Jiménez, A.; Krivenko, V.P.; Palomo, A. Classification and Characteristics of Alkali-Activated Cements. J. Chin. Ceram. Soc. 2012, 40, 69–75. [Google Scholar] [CrossRef]
  51. Alcamand, H.A.; Borges, P.H.R.; Silva, F.A.; Trindade, A.C.C. The effect of matrix composition and calcium content on the sulfate durability of metakaolin and metakaolin/slag alkali-activated mortars. Ceram. Int. 2018, 44, 5037–5044. [Google Scholar] [CrossRef]
  52. Collins, F.; Sanjayan, J. Workability and mechanical properties of alkali activated slag concrete. Cem. Concr. Res. 1999, 29, 455–458. [Google Scholar] [CrossRef]
  53. Jambunathan, N.; Sanjayan, J.G.; Pan, Z.; Li, G.; Liu, Y.; Korayem, A.H.; Duan, W.H.; Collins, F. The role of alumina on performance of alkali-activated slag paste exposed to 50 °C. Cem. Concr. Res. 2013, 54, 143–150. [Google Scholar] [CrossRef]
  54. Collins, F.; Sanjayan, J.G. Strength and shrinkage properties of alkali-activated slag concrete containing porous coarse aggregate. Cem. Concr. Res. 1999, 29, 607–610. [Google Scholar] [CrossRef]
  55. Jin, F.; Al-Tabbaa, A. Strength and drying shrinkage of slag paste activated by sodium carbonate and reactive MgO. Constr. Build. Mater. 2015, 81, 58–65. [Google Scholar] [CrossRef]
  56. Frost, R.L.; Martens, W.; Ding, Z.; Kloprogge, J.T. DSC and high-resolution TG of synthesized hydrotalcites of Mg and Zn. J. Therm. Anal. Calorim. 2003, 71, 429–438. [Google Scholar] [CrossRef]
  57. Lachowski, E.E.; Diamond, S. Investigation of Composition and Morphology of Individual Particles of Portland Cement Pastes: 1, C-S-H Gel and Ca (OH)2 Particles. Cem. Concr. Res. 1983, 13, 177–185. [Google Scholar] [CrossRef]
  58. Qaidi, S.; Najm, H.M.; Abed, S.M.; Ahmed, H.U.; Al Dughaishi, H.; Al Lawati, J.; Sabri, M.M.; Alkhatib, F.; Milad, A. Fly Ash-Based Geopolymer Composites: A Review of the Compressive Strength and Microstructure Analysis. Materials 2022, 15, 7098. [Google Scholar] [CrossRef] [PubMed]
  59. Ahmed, H.U.M.; Mohammed, A.S.; Qaidi, S.M.A.; Faraj, R.H.; Sor, N.H.; Mohammed, A.A. Compressive strength of geopolymer concrete composites: A systematic comprehensive review, analysis and modeling. Eur. J. Environ. Civ. Eng. 2022, 27, 1383–1428. [Google Scholar] [CrossRef]
  60. Wang, S.-D.; Pu, X.-C.; Scrivener, K.L.; Pratt, P.L. Alkali-activated slag cement and concrete: A review of properties and problems. Adv. Cem. Res. 1995, 7, 93–102. [Google Scholar] [CrossRef]
  61. Song, S.; Sohn, D.; Jennings, H.M.; Mason, T.O. Hydration of alkali-activated ground granulated blast furnace slag. J. Mater. Sci. 2000, 35, 249–257. [Google Scholar] [CrossRef]
  62. Puertas, F.; Martnez-Ramrez, S.; Alonso, S.; Vázquez, T. Alkali-activated fly ash/slag cements: Strength behaviour and hydration products. Cem. Concr. Res. 2000, 30, 1625–1632. [Google Scholar] [CrossRef]
  63. Wang, S.D.; Scrivener, K.L. Hydration products of alkali activated slag cement. Cem. Concr. Res. 1995, 25, 561–571. [Google Scholar] [CrossRef]
Figure 1. The XRD pattern of GBFS and particle size distribution of SL: (a) XRD pattern of GBFS and (b) particle size distribution of SL.
Processes 12 00184 g001
Figure 2. Apparatus for measuring autogenous shrinkage.
Processes 12 00184 g002
Figure 3. Mechanical strength of the SL system: (a) flexural strength (b) compressive strength.
Processes 12 00184 g003
Figure 4. Mechanical properties of the SS-SL system: (a) flexural strength (b) compressive strength.
Processes 12 00184 g004
Figure 5. Autogenous shrinkage of AASC (a) SL system (b) SS-SL system.
Processes 12 00184 g005
Figure 6. Autogenous shrinkage of AASC within 1 day and 7 days (a) SL system (b) SS-SL system.
Processes 12 00184 g006
Figure 7. Drying shrinkage of AASC (a) SL system (b) SS-SL system.
Processes 12 00184 g007
Figure 8. Pore size distribution of AASC at 28 days.
Processes 12 00184 g008
Figure 9. Pore distribution of AASC at 28 days. (a) Cumulative pore volume percentage, (b) Cumulative pore volume.
Processes 12 00184 g009
Figure 10. XRD of the SL system at (a) 3 days (b) 28 days.
Processes 12 00184 g010
Figure 11. XRD of the SS-SL system at (a) 3 days (b) 28 days.
Processes 12 00184 g011
Figure 12. TG-DTG of AASC (a) SL system (b) SS-SL system.
Processes 12 00184 g012
Figure 13. SEM and EDS of the AASC paste at 28 days.
Processes 12 00184 g013
Table 1. Chemical components of GBFS (%).
SiO2 (%)Al2O3 (%)CaO (%)Fe2O3 (%)MgO (%)SO3(%)K2O (%)Na2O (%)Ignition Loss (%)
31.6813.9641.360.668.421.270.470.501.01
Table 2. Mix proportion designs of the AASC pastes.
NumberGBFSSLSSWater
SL3973--35
SL5955--35
SL8928--35
SL109010--35
SL128812--35
SS-SL010009.1635
SS-SL39739.1635
SS-SL59559.1635
SS-SL89289.1635
SS-SL1090109.1635
SS-SL1288129.1635
Note: Mass ratios are relative to 100 g binder.
Table 3. Mix proportions of the AASC mortars.
NumberGBFSSLSSWaterSand
MSL3973--40200
MSL5955--40200
MSL8928--40200
MSL109010--40200
MSL128812--40200
MSS-SL010009.1640200
MSS-SL39739.1640200
MSS-SL59559.1640200
MSS-SL89289.1640200
MSS-SL1090109.1640200
MSS-SL1288129.1640200
Note: Mass ratios are relative to 100 g binder.
Table 4. Setting time of the AASC pastes.
NumberInitial Setting Time (h:min)Final Setting Time (h:min)
SL34:496:08
SL54:425:53
SL84:385:41
SL104:285:27
SL124:185:17
SS-SL0----
SS-SL34:425:12
SS-SL54:235:02
SS-SL84:124:57
SS-SL104:034:43
SS-SL123:484:38
Table 5. Mass loss of the AASC paste at different temperatures (wt. %).
SpecimenTemperature (°C)
40–220 °C260–300 °C390–450 °C580–700 °C730–780 °C
Δm1Δm2Δm3Δm4Δm5
SL53.69-0.541.190.11
SL104.51-0.861.670.21
SS-SL04.370.410.500.460.01
SS-SL55.990.630.600.630.01
SS-SL106.830.730.911.420.15
Table 6. The phase fractions of EDS (wt. %).
Serial NumberCONaMgAlSiSKCaFe
11.1645.1932.58------20.01--0.560.14
28.2053.661.550.485.312.557.980.1220.14--
34.7840.914.97--4.863.512.850.2337.89--
Disclaimer/Publisher’s Note: The statements, opinions and data contained in all publications are solely those of the individual author(s) and contributor(s) and not of MDPI and/or the editor(s). MDPI and/or the editor(s) disclaim responsibility for any injury to people or property resulting from any ideas, methods, instructions or products referred to in the content.

