
Comparison of the Work of Wastewater Treatment Plant “Ravda” in Summer and Winter Influenced by the Seasonal Mass Tourism Industry and COVID-19


Abstract
1. Introduction
2. Materials and Methods
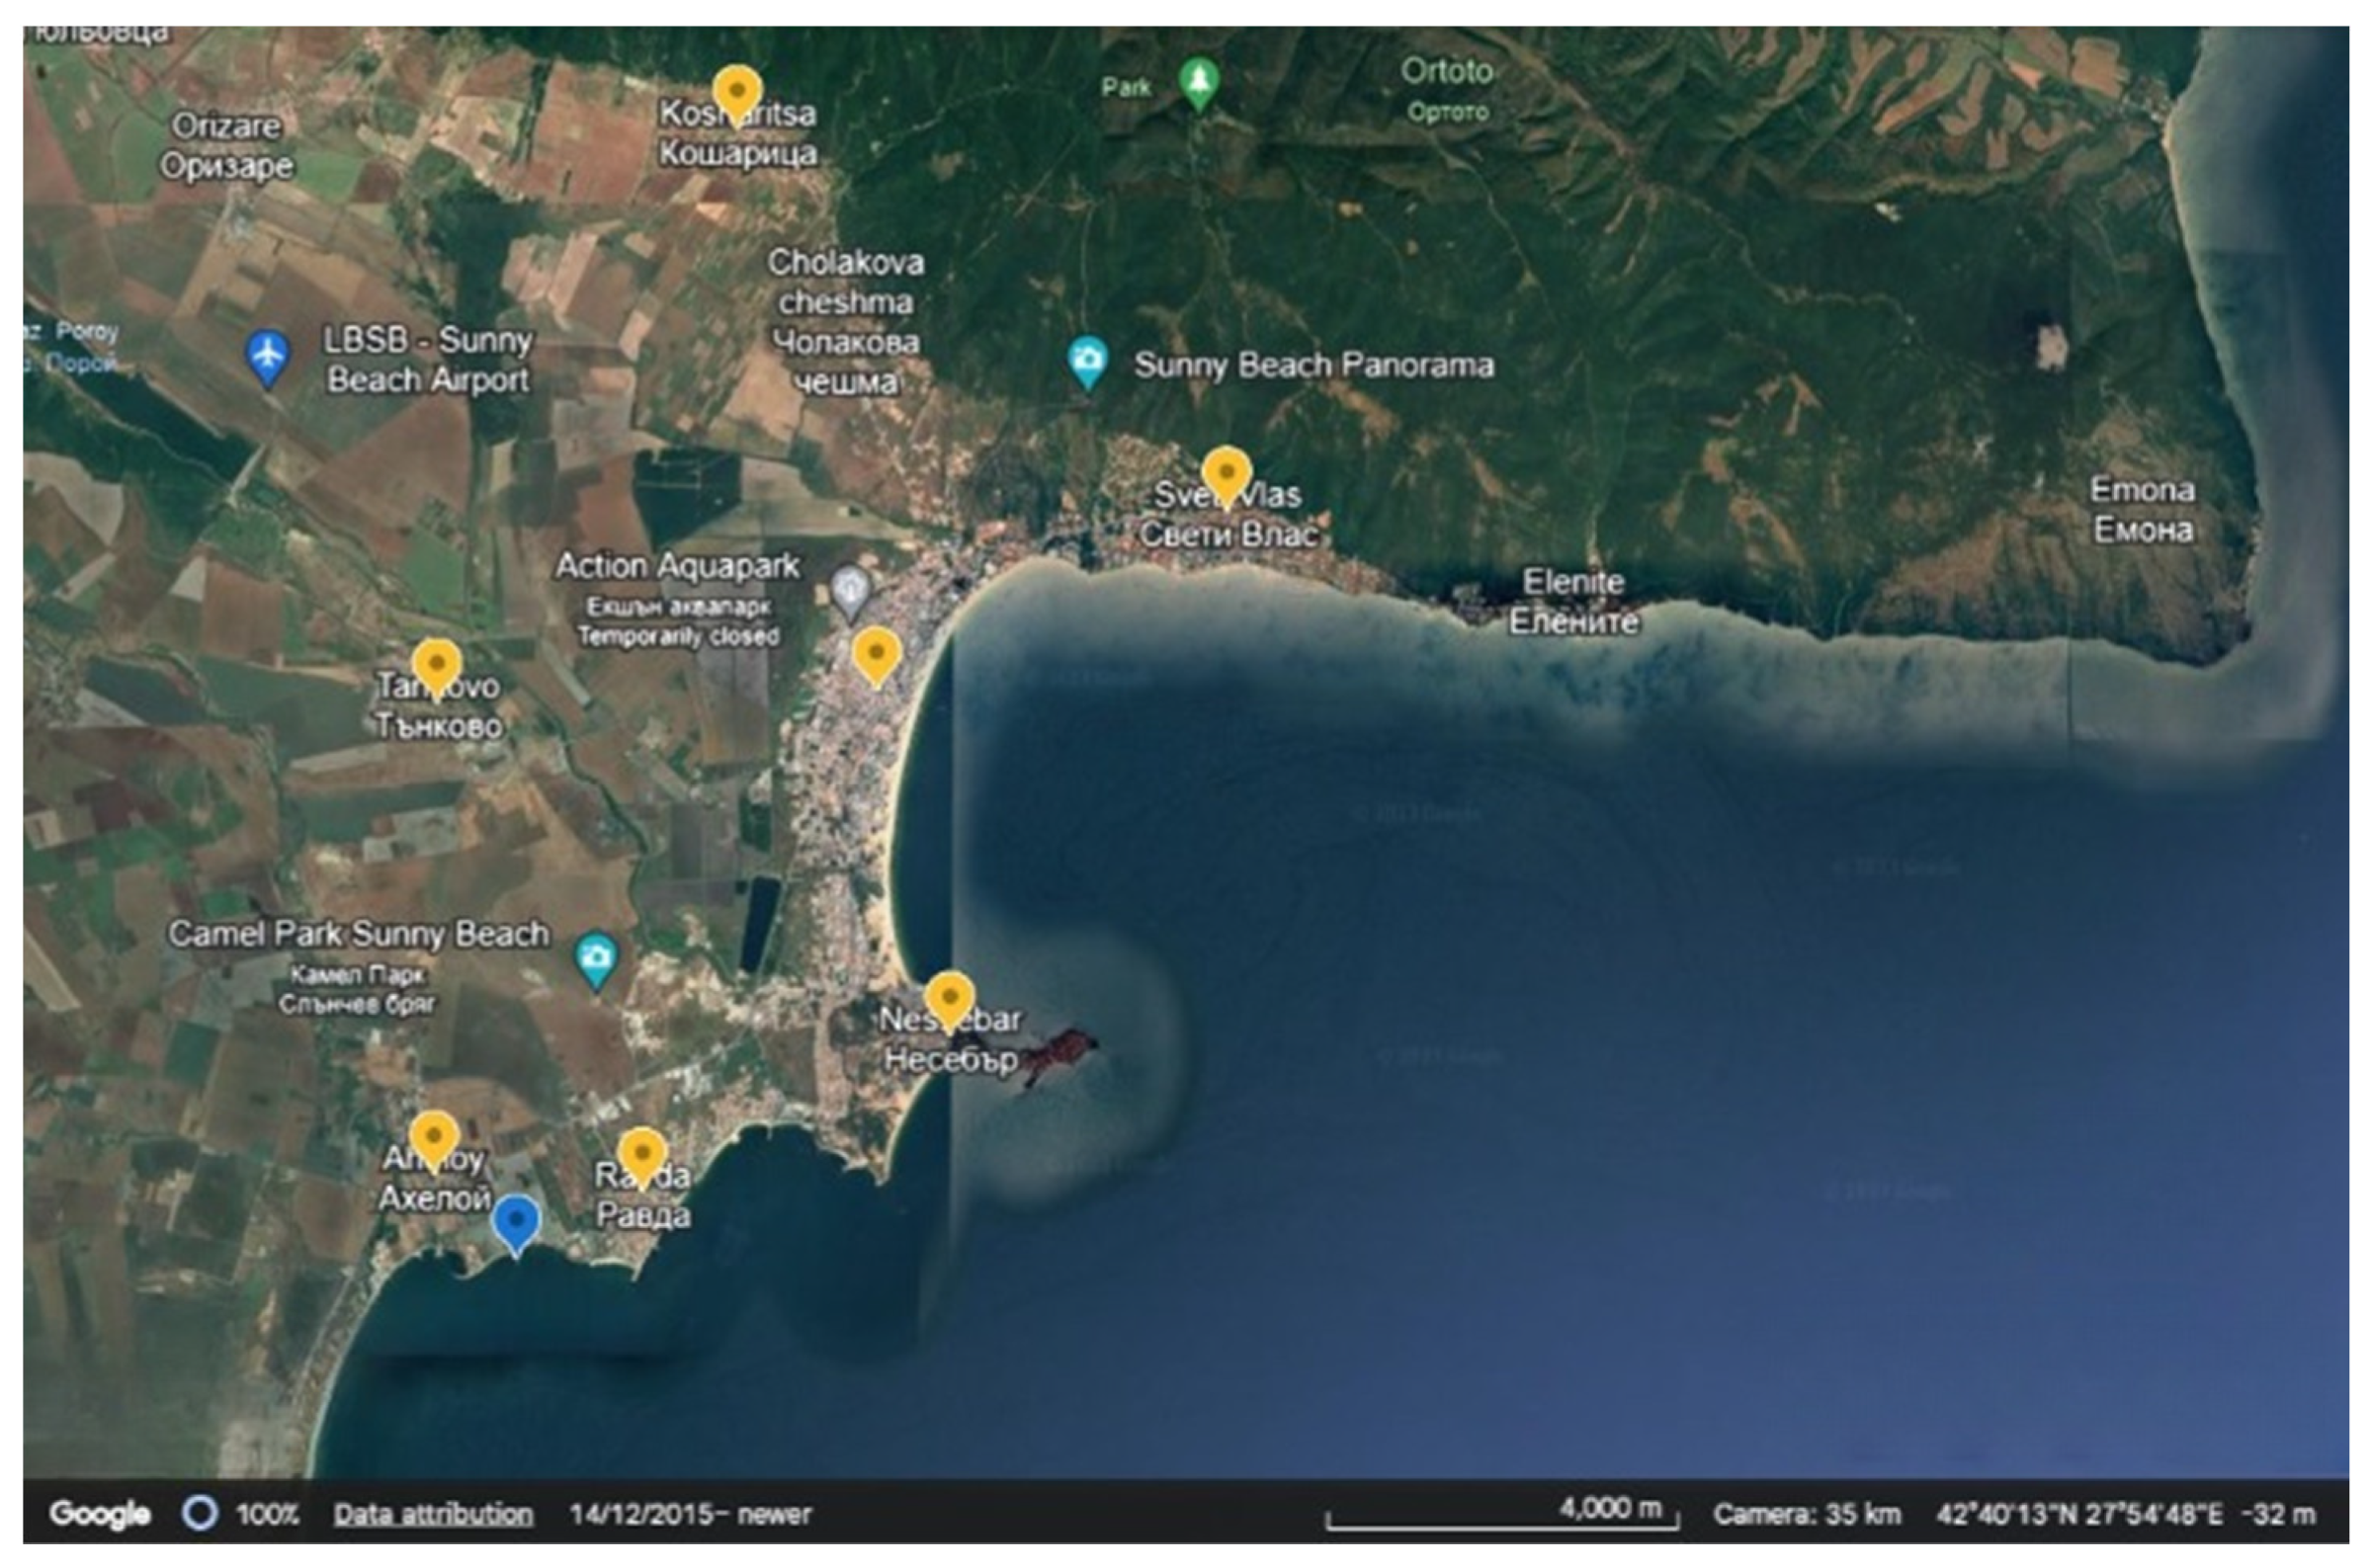
2.1. Wastewater Treatment Plant
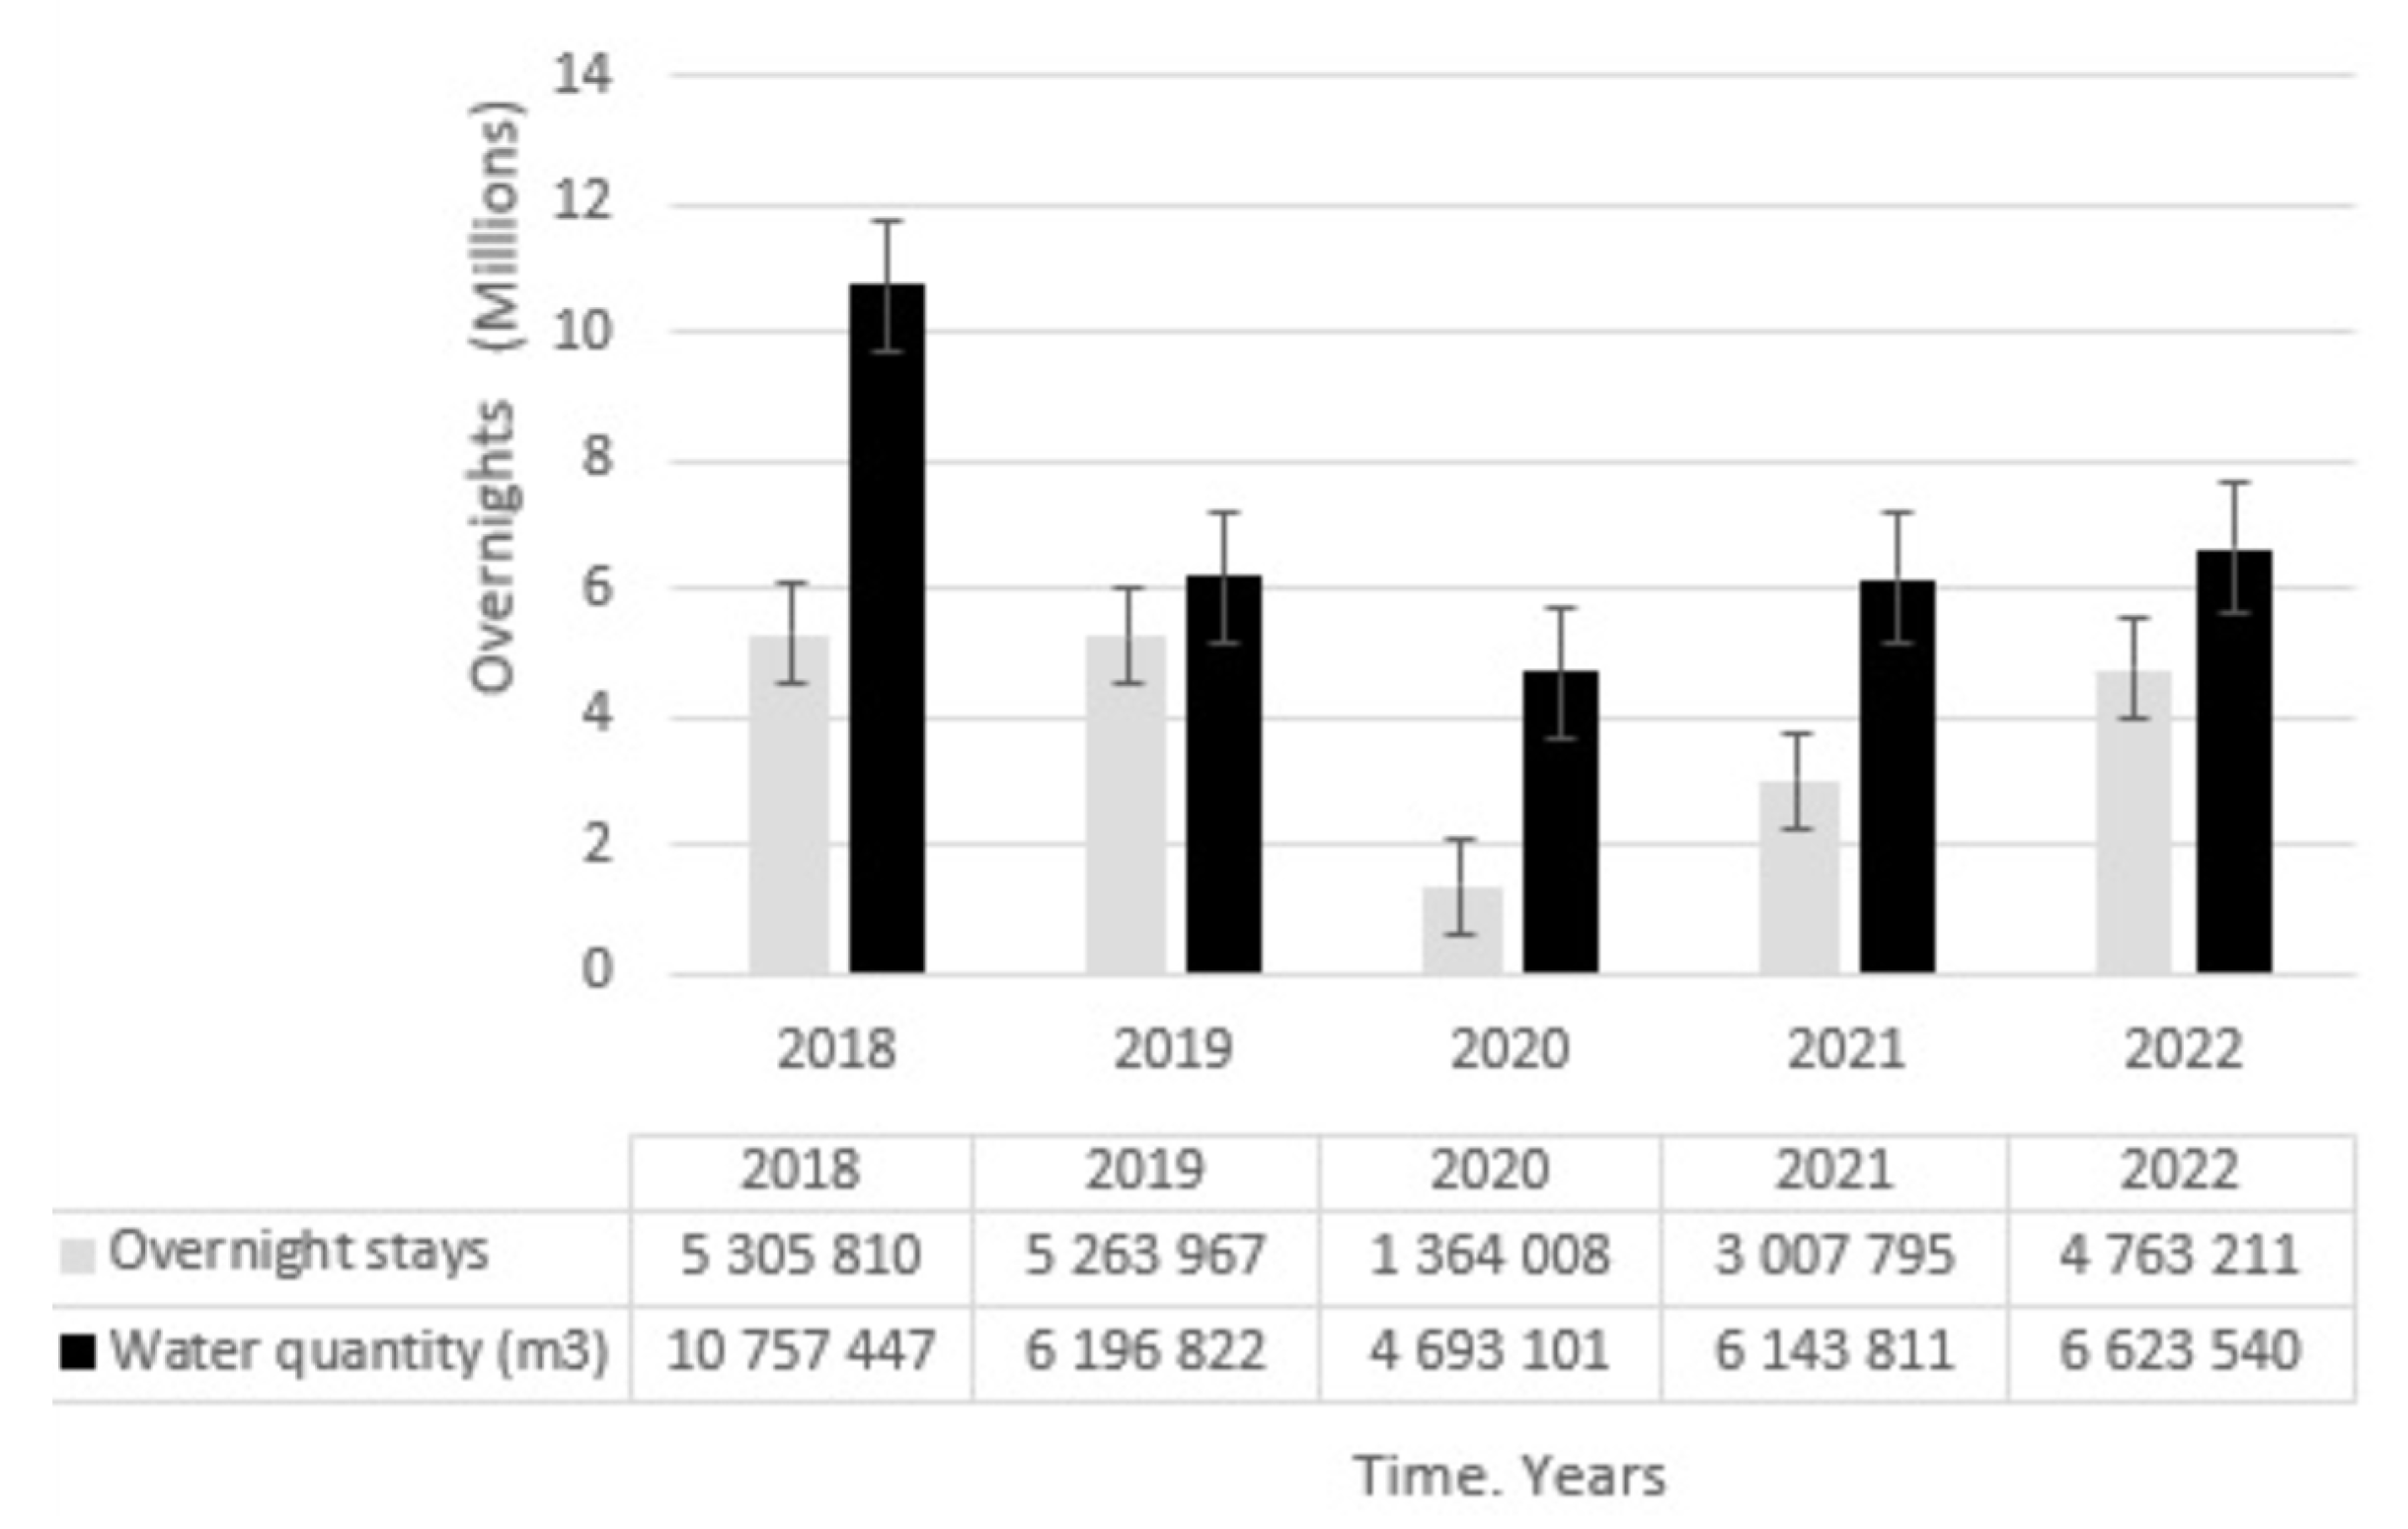
2.2. Statistical Data
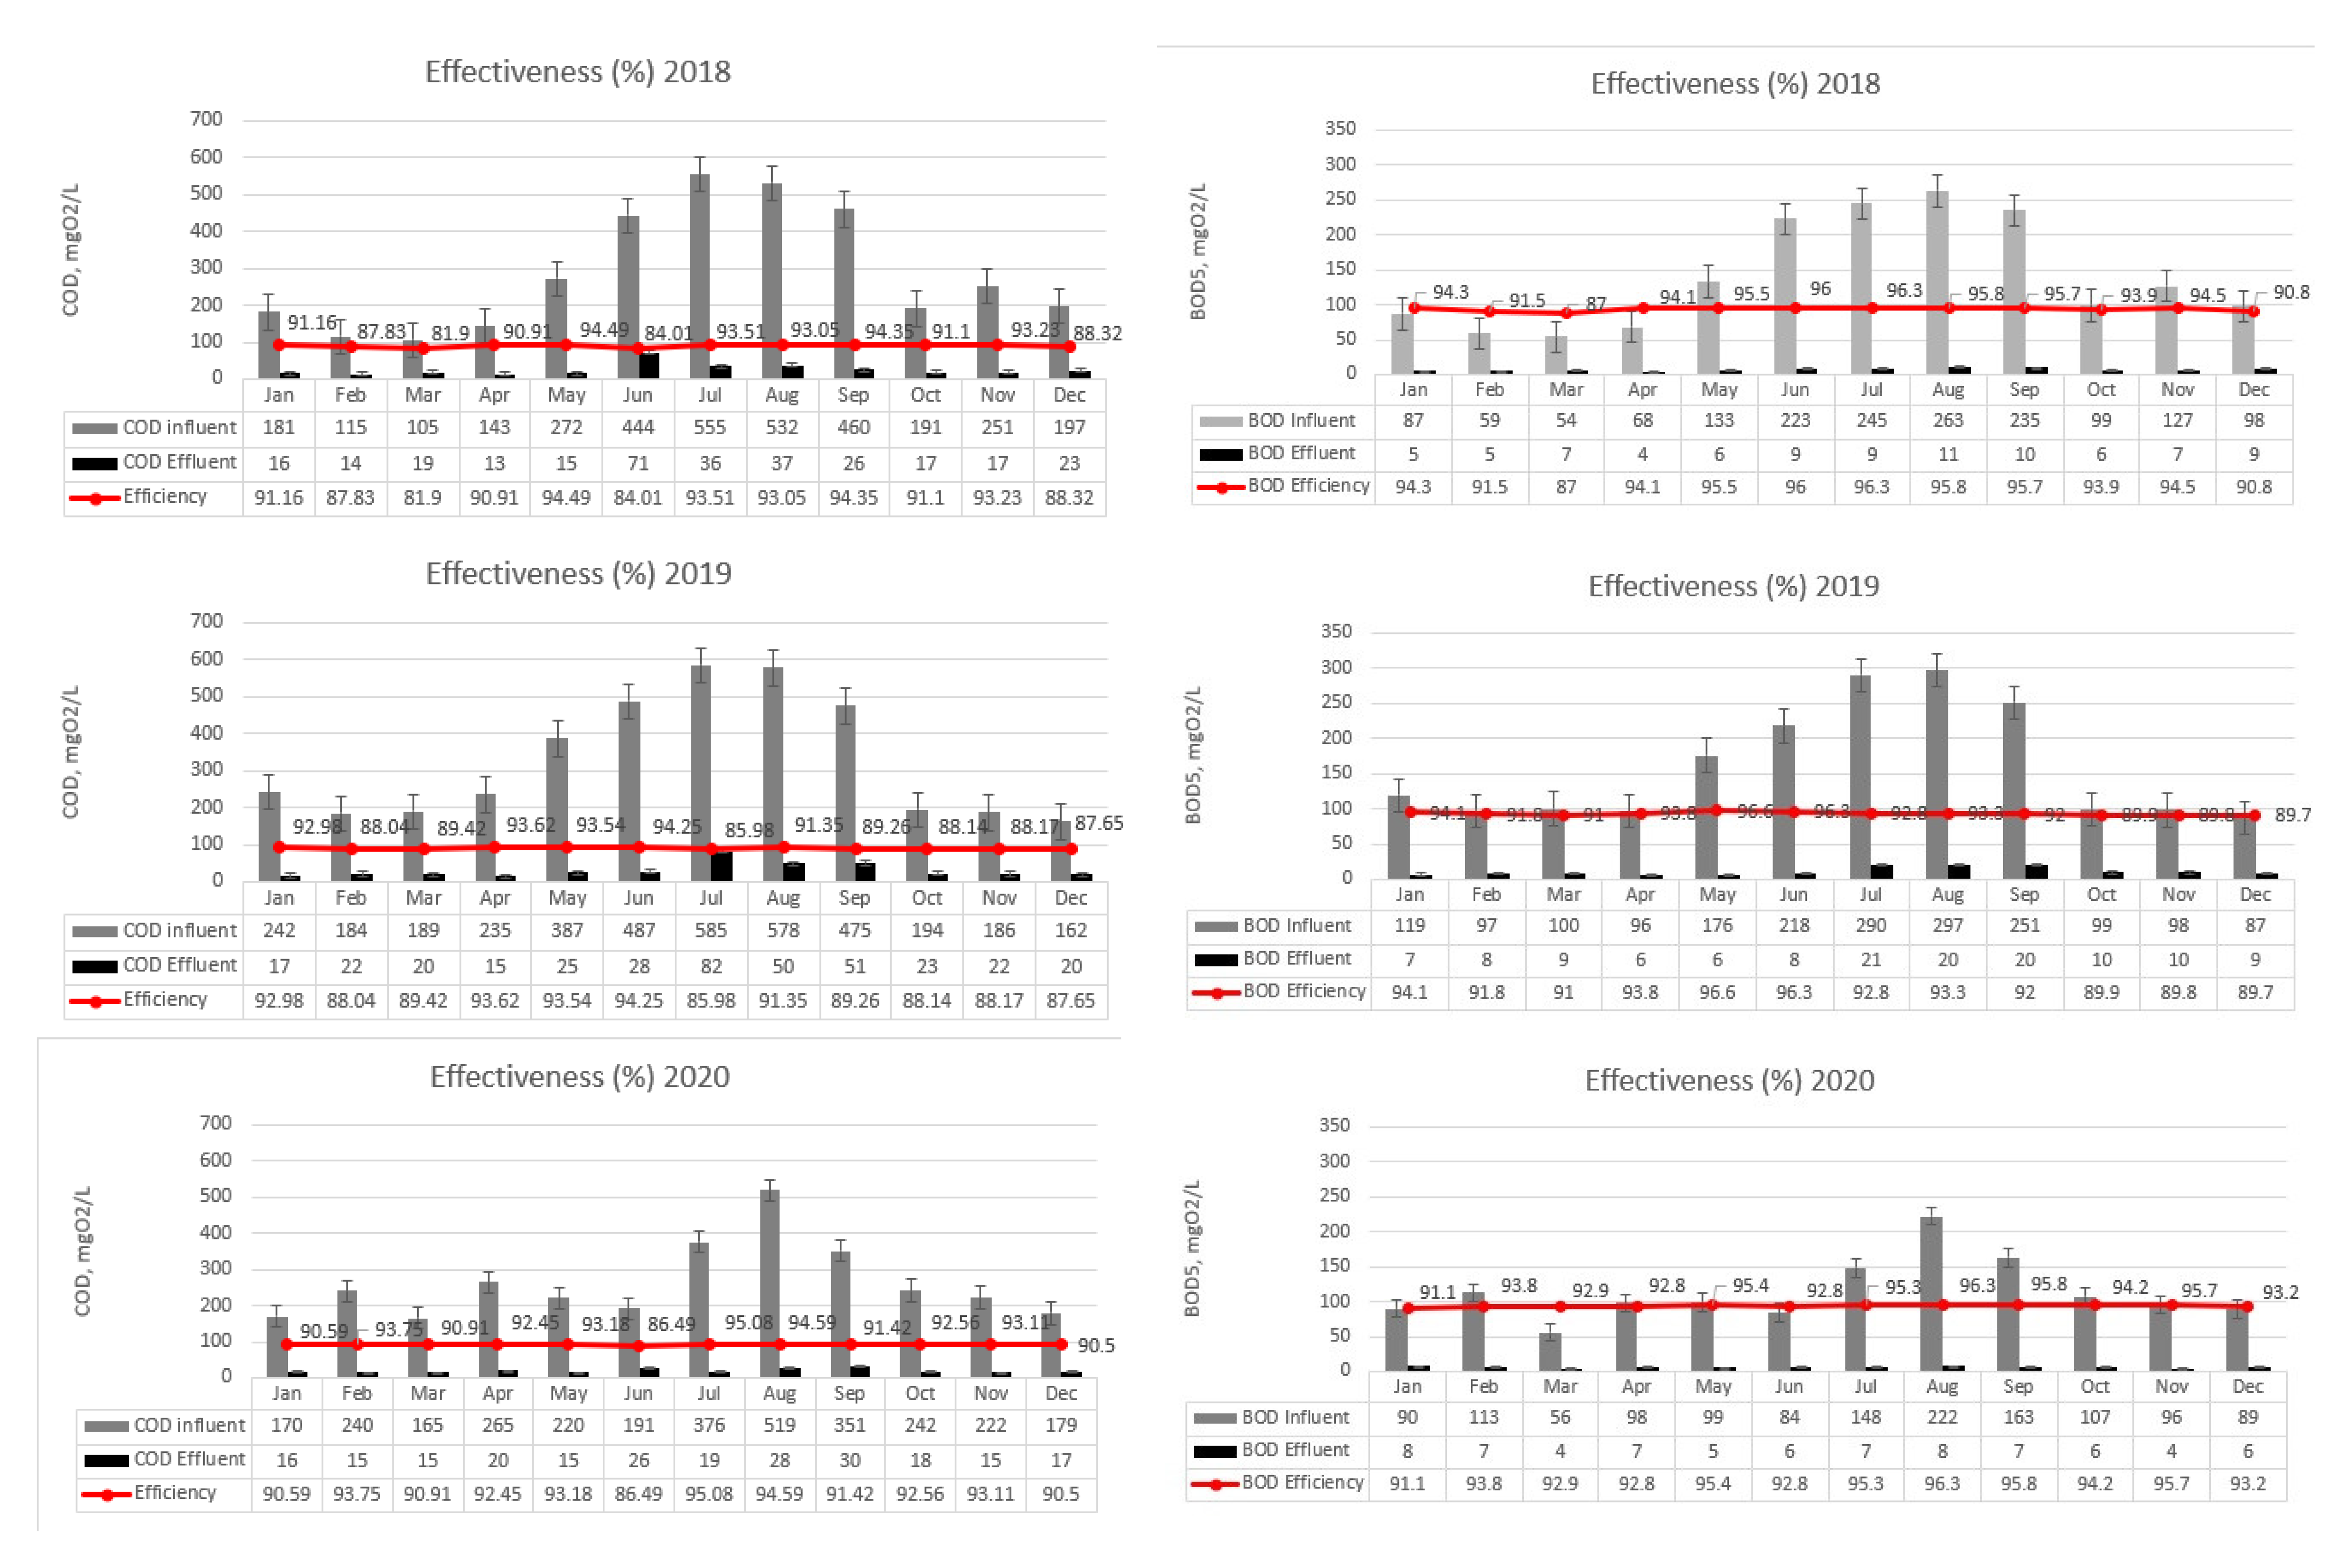
2.3. Laboratory Results
BOD5 per 1 m3 of water per overnight = BOD5/X
3. Results
3.1. Functioning of Ravda WWTP in Winter
3.2. Functioning of Ravda WWTP in Summer
- -
- Permissible level of COD in treated wastewater: 125 mgO2/L;
- -
- Permissible level of BOD5 in treated wastewater: 25 mgO2/L;
- -
- Permissible level of nitrogen in treated water: 10 mg/L;
- -
- Permissible level of phosphorous in treated water: 1 mg/L.
4. Discussion
Author Contributions
Funding
Data Availability Statement
Acknowledgments
Conflicts of Interest
References
- United Nations The 17 Goals. Available online: https://sdgs.un.org/goals (accessed on 20 August 2023).
- Available online: https://travelifestaybetter.com/ (accessed on 20 August 2023).
- ESG Framework for Tourism Businesses. Available online: https://www.unwto.org/tourism-statistics/environmental-social-governance-tourism#:~:text=(i)%20Make%20optimal%20use%20of,and%20contributions%20to%20reducing%20poverty (accessed on 20 August 2023).
- ISO 14001:2015; Environmental Management Systems Requirements with Guidance for Use. ISO: Geneva, Switzerland, 2015. Available online: https://www.iso.org/standard/60857.html (accessed on 20 August 2023).
- Lawrence, K.; Mu-Hao, S. New Technologies for Water and Wastewater Treatment, Evolutionary Progress in Science, Technology, Engineering, Arts, and Mathematics (STEAM); Lenox Institute Press: Auburndale, MA, USA, 2023; Available online: https://www.researchgate.net/publication/375001711_New_Technologies_for_Water_and_Wastewater_Treatment (accessed on 11 November 2023).
- Azra, B.; Canan, S. Assessment of pollution in the West Black Sea Coast of Turkey using biomarker responses in fish. Mar. Environ. Res. 2008, 67, 167–176. [Google Scholar]
- Dimitar, B.; Stefania, K. Microplastics and floating litter pollution in Bulgarian Black Sea coastal waters. Mar. Pollut. Bull. 2020, 156, 111225. [Google Scholar]
- Maryna, S.; Vita, S. The future of the Black Sea: More pollution in over half of the rivers. Ambio 2023, 52, 339–356. [Google Scholar]
- Shypotilova, O.; Kozhanov, A. The problem of the Black Sea pollution in Odessa region of Ukraine 2021. IOP Conf. Ser. Earth Environ. Sci. 2019, 915, 012008. [Google Scholar] [CrossRef]
- Li, W.; Ma, Y.; Guo, C.; Hu, W.; Liu, K.; Wang, Y.; Zhu, T. Occurrence and Behavior of Four of the Most Used Sunscreen UV Filters in a Wastewater Reclamation plant. Water Res. 2007, 41, 3506–3512. [Google Scholar] [CrossRef] [PubMed]
- Abdul, G.; Atif, M. Impact of Effluent Discharge on Recreational Beach Water Quality: A Case Study of Karachi-Pakistan. J. Coast. Conserv. 2021, 25, 37. [Google Scholar]
- Kalin, K.; Miroslav, Y. Providing Data for Water Currents and Connected with Them Waste Streams in the Black Sea. Ph.D. Thesis, Nikola Vaptsarov Naval Academy, Varna, Bulgaria, 2019. [Google Scholar]
- Lin, Z. The impact of marine tourism behavior on the ecological effect of marine benthos Community in the South China Sea. J. Coast. Conserv. 2022, 26, 17. [Google Scholar] [CrossRef]
- Uoginté, L.; Pleskyté, S.; Pauraité, J.; Lujaniené, G. Seasonal variation and complex analysis of microplastic distribution in different WWTP treatment stages in Lithuania. Environ. Monit. Assess. 2022, 194, 829. [Google Scholar] [CrossRef]
- Ana, A.; Diana, I. Influence of tourism on microplastic contamination at wastewater treatment plants in the coastal municipality of Chiclana de la Frontera. Sci. Total Environ. 2023, 900, 165573. [Google Scholar]
- Schroeer, A.; Aguilar, R.; Blanco, J.; Álvarez, H.; Marín, P. Out of Season: The Plastic Footprint of Tourism. Seafloor Surveys in Mallorca and Valencia. 2021. Available online: https://europe.oceana.org/wp-content/uploads/sites/26/d_files/oceana_out_of_season_the_plastic_footprint_of_tourism.pdf (accessed on 15 November 2023).
- Amendments Adopted by the European Parliament on 5 October 2023 to the Proposal for a Directive of the European Parliament and of the Council on Urban Waste Water Treatment. Available online: https://www.europarl.europa.eu/doceo/document/TA-9-2023-0355_BG.html (accessed on 15 November 2023).
- Official Journal of the European Union, 09.07.2021, L 243/1. Available online: https://eur-lex.europa.eu/legal-content/EN/TXT/PDF/?uri=CELEX:32021R1119 (accessed on 10 October 2023).
- Estévez, S.; Feijoo, G.; Moreira, M.T. Environmental Synergies in Decentralized Wastewater Treatment at a Hotel Resort. J. Environ. Manag. 2022, 317, 115392. [Google Scholar] [CrossRef]
- Firdaus, A.; Dwi Lintang, L. Eco-Friendly Toilet for Sustainable Wastewater Management in Tourism Area. E3S Web Conf. 2020, 211, 01009. [Google Scholar]
- Duygun, F.; Eylül, D. Analyzing the Wastewater Treatment Facility Location/Network Design Problem via System Dynamics: Antalya, Turkey Case. J. Environ. Manag. 2022, 320, 115814. [Google Scholar]
- Integrated Development Plan of Nessebar Municipality 2021–2027. Available online: https://www.strategy.bg/StrategicDocuments/View.aspx?lang=bg-BG&Id=1427 (accessed on 10 October 2023).
- Christina, S.; Paula, M. Toxicity Abatement of Wastewaters from Tourism Units by Constructed Wetlands. Water 2019, 11, 2623. [Google Scholar]
- Paula, N.; Xiaotian, D. Wastewater-Based Surveillance Can Be Used to Model COVID-19-Associated Workforce Absenteeism. Sci. Total Environ. 2023, 900, 165172. [Google Scholar]
- Mihaela, B.; Slavil, P.; Vesela, S. Comparison of Two Methods for SARS-CoV-2 Detection in Wastewater: A Case Study from Sofia, Bulgaria. Water 2023, 15, 658. [Google Scholar]
- Hai, N.; Giang, L. SARS-CoV-2 Coronavirus in Water and Wastewater: A Critical Review about Presence and Concern. Environ. Res. 2020, 193, 110265. [Google Scholar]
- Daniel, G.; Francisco, J. An Analysis of the Cost of Water Supply Linked to the Tourism Industry. An Application to the Case of the Island of Ibiza in Spain. Water 2020, 12, 2006. [Google Scholar]
- Borboudaki, K.; Paranychianakis, N. Integrated Wastewater Management Reporting at Tourist Areas for Recycling Purposes, Including the Case Study of Hersonissos, Greece. Environ. Manag. 2005, 36, 610–623. [Google Scholar] [CrossRef]
- Available online: https://www.nsi.bg/en (accessed on 10 October 2023).
- Davide, D.; Mauro, M. Sequencing Batch Reactor: Influence of Periodic Operation on Performance of Activated Sludges in Biological Wastewater Treatment. Ind. Eng. Chem. Res. 2001, 40, 5110–5119. [Google Scholar]
- Adriana, B.; Gilberto, C. Biological treatment of saline wastewaters in an aerobic sequencing batch reactor. Environ. Prog. Sustain. Energy 2013, 32, 198–205. [Google Scholar]
- Available online: https://www.bsbd.org/ (accessed on 10 August 2023).
- Biochemical Oxygen Demand (BOD). Available online: https://www.researchgate.net/file.PostFileLoader.html?id=55001c40d5a3f2c8638b4579&assetKey=AS%3A273744902197248%401442277278075 (accessed on 1 November 2023).
- ЖИТЕЛИТЕ НА ОБЩИНА НЕСЕБЪР ВЕЧЕ СА 28 968. Available online: http://nessebarinfo.com/novinite/2020/04/29/jitelite-na-obshtina-nessebar-28968/ (accessed on 11 October 2023).
- Michele, M. Field Measurements and Monitoring of Wastewater Discharge in Sea Water. Estuar. Coast. Shelf Sci. 2006, 68, 509–514. [Google Scholar]
- Priya, Y.; Rahul, P. Biogas production using waste water: Methodologies and applications. In Advances in Chemical Pollution, Environmental Management and Protection; Elsevier: Amsterdam, The Netherlands, 2023. [Google Scholar]
- НАРЕДБА № 6 oт 9.11.2000 г. За Емисиoнни Нoрми за Дoпустимoтo Съдържание на Вредни и Опасни Вещества в Отпадъчните Вoди, Зауствани Във Вoдни Обекти. Available online: https://eea.government.bg/bg/legislation/water/nared6.pdf (accessed on 1 October 2023).
- Aqua Paradise Resort Environmental Policy. Available online: https://aquaparadiseresort.bg/wp-content/uploads/2020/09/Environmental-Policy.pdf (accessed on 11 October 2023).
- COD/BOD5 Ratio. Available online: https://sswm.info/content/codbod5-ratio#:~:text=A%20low%20ratio%20COD%2FBOD5,easily%20by%20a%20biological%20treatment (accessed on 11 October 2023).
- Dimkov, R.; Topalova, Y.; Schneider, I. Ecological Biotechnology; ПъблишСайСет-Екo: Sofia, Bulgaria, 2017; ISBN 987-954-749-113-7. [Google Scholar]
- Norbert, J. Consequences of Phosphorus Elimination for Sludge Production—A Comparison between Physical-Chemical and Enhanced Biological Phosphorus Removal, Chemical Water and Wastewater Treatment IV. In Chemical Water and Wastewater Treatment IV: Proceedings of the 7th Gothenburg Symposium 1996, Edinburgh, Scotland, 23–25 September 1996; Springer: Berlin/Heidelberg, Germany, 1996. [Google Scholar]
- Harold, F. Enzymic and Genetic Control of Polyphosphate Accumulation in Aerobacter aerogenes. J. Gen. Microbiol. 1964, 35, 81–90. [Google Scholar] [CrossRef] [PubMed]
- Groenestijn, J. Accumulation and Degradation of Polyphosphate in Acinetobacter sp. Ph.D. Thesis, Agricultural University, Wageningen, The Netherlands, 1988. [Google Scholar]
- Rossi, A. Bioenergetics of the polyphosphates accumulation in Pseudomonas aeruginosa via polyphosphate kinase activation by choline in a lung colonization model. Heliyon 2022, 9, e12601. [Google Scholar] [CrossRef] [PubMed]
- Priya, E. A comprehensive review on technological advances of adsorption for removing nitrate and phosphate from waste water. J. Water Process Eng. 2022, 49, 103159. [Google Scholar] [CrossRef]


| № | Parameter | Location | Methodology |
|---|---|---|---|
| 1 | BOD5 influent | Input sampling station located in the building “Grilles” | Standard methodology [33] |
| 2 | BOD5 effluent | Output sampling station in contact reservoir (tank) | |
| 3 | COD influent | Sampling station after the sand trap | Standard methodology [33] By spectrophotometric method with Nova 60, a spectrophotometer, and Merck cuvette tests |
| 4 | COD effluent | Sampling station after UV disinfection | |
| 5 | Total nitrogen influent | Input sampling station located in the building “Grilles” | |
| 6 | Total nitrogen effluent | Output sampling station in contact reservoir (tank) | |
| 7 | Phosphorus influent | Input sampling station located in the building “Grilles” | |
| 8 | Phosphorus effluent | Output sampling station in contact reservoir (tank) |
| Year | May | June | July | August | September |
|---|---|---|---|---|---|
| 2018 | 94.49 | 84.01 | 93.51 | 93.05 | 94.35 |
| 2019 | 93.54 | 94.25 | 85.98 | 91.35 | 89.26 |
| 2020 | 93.18 | 86.49 | 95.08 | 94.59 | 91.42 |
| 2021 | 91.5 | 95.6 | 95 | 92.2 | 92.3 |
| 2022 | 90.61 | 88.71 | 93.41 | 90.91 | 91.65 |
Disclaimer/Publisher’s Note: The statements, opinions and data contained in all publications are solely those of the individual author(s) and contributor(s) and not of MDPI and/or the editor(s). MDPI and/or the editor(s) disclaim responsibility for any injury to people or property resulting from any ideas, methods, instructions or products referred to in the content. |
© 2024 by the authors. Licensee MDPI, Basel, Switzerland. This article is an open access article distributed under the terms and conditions of the Creative Commons Attribution (CC BY) license (https://creativecommons.org/licenses/by/4.0/).
Share and Cite
Bogdanova, M.; Yotinov, I.; Topalova, Y. Comparison of the Work of Wastewater Treatment Plant “Ravda” in Summer and Winter Influenced by the Seasonal Mass Tourism Industry and COVID-19. Processes 2024, 12, 192. https://doi.org/10.3390/pr12010192
Bogdanova M, Yotinov I, Topalova Y. Comparison of the Work of Wastewater Treatment Plant “Ravda” in Summer and Winter Influenced by the Seasonal Mass Tourism Industry and COVID-19. Processes. 2024; 12(1):192. https://doi.org/10.3390/pr12010192
Chicago/Turabian StyleBogdanova, Magdalena, Ivaylo Yotinov, and Yana Topalova. 2024. "Comparison of the Work of Wastewater Treatment Plant “Ravda” in Summer and Winter Influenced by the Seasonal Mass Tourism Industry and COVID-19" Processes 12, no. 1: 192. https://doi.org/10.3390/pr12010192
APA StyleBogdanova, M., Yotinov, I., & Topalova, Y. (2024). Comparison of the Work of Wastewater Treatment Plant “Ravda” in Summer and Winter Influenced by the Seasonal Mass Tourism Industry and COVID-19. Processes, 12(1), 192. https://doi.org/10.3390/pr12010192