Abstract
Four types of non-dairy (plant) drinks—almond, oat, rice, and soy—as well as cow milk with varying fat contents (1.5%, 2.0%, and 3.2%), were examined and compared in terms of the total concentrations of Al, As, B, Ba, Ca, Cd, Cr, Cu, Fe, K, Mg, Na, Mn, Ni, P, Pb, Sb, Se, Sr, and Zn using inductively coupled optical emission spectrometry (ICP OES). Additionally, in vitro gastrointestinal digestion was used to determine the bio-accessible fraction of selected elements, evaluating the nutritional value and risk assessment involved with the consumption of these beverages. A significant difference in the mineral profile was observed depending on the type of plant drink, with the highest content of elements noted in the soy drink and the lowest in the rice drink. Except for Ca and P, the soy drink appears to be a much better source of essential nutrients, including Cu, Fe, and Mn, than cow’s milk. A similar Ca content in plant beverages can be obtained only by adding calcium salt at the stage of its production. Interestingly, by using the multivariate data analysis, the average content of the selected elements (Cu, K, Na, P, and Zn) can be used both to differentiate dairy and non-dairy milk samples according to their type and to distinguish plant drinks from milk of animal origin. The bio-accessibility of essential elements (Ca, Cu, Fe, Mg, Mn, P, Zn) in cow milk was within 8.37–98.2% and increased with an increase in its fat content. Accordingly, by drinking 1 L of this milk daily, it is possible to contribute to the recommended dietary intakes of Ca, P, Cu, Mg, and Zn between 5.6–68%. Although the bio-accessibility of elements in the rice drink was the highest (9.0–90.8%), the soy drink seems to be the best source of nutrients in bioavailable forms; its consumption (1 L/day) covers the requirements of Cu, Mn, Mg, Ca, P, and Zn in 7.0–67%. Unfortunately, both groups of beverages are not important sources of Fe (plant drink) and Mn or Fe (cow milk) in the human diet. On the other hand, potentially toxic elements (Al, B, Ba) were found in them in a relatively inert form.
1. Introduction
Bovine milk, i.e., liquid food excreted by the mammary glands in mammals, has long been considered a staple food source, playing a vital role in human nutrition [1,2]. In most dietary guidelines around the world, the regular consumption of milk and milk products is highly recommended as a part of a healthy diet due to their significant content of essential nutritious compounds such as lipids, carbohydrates, proteins, amino acids, vitamins, antioxidants, and many biologically essential minerals, including Ca (mainly), Mg, P, Se, or Zn [1,2,3,4]. The balanced content of nutrients makes cow milk (CM) a complete food for many age groups, including infants, for whom consuming raw CM significantly reduces the risk of several diseases like fever or respiratory infections [1,2,5]. Truly, milk is the only food that has adapted to the nutritional needs of newborn mammals, thus, supporting their growth and development [2]. The regular consumption of milk and dairy products plays a role in bone health and reduces the risk of cardiovascular disease, hypertension, some forms of cancer, and type 2 diabetes [6]. The composition of milk has several properties such as the improvement of the absorption and bioavailability of the nutrients it provides [2]. Examples include lactose, which has been shown to increase the bioavailability of Ca, Mg, and P, and casein proteins, which, by stabilizing Ca-phosphate, maximize the bioavailability of this element [2]. Moreover, casein micelles coagulate and gel in the acidic environment of the stomach, slowing down digestion, providing a feeling of satiety and giving more time to effectively digest the nutrients contained in milk [2]. Some specific milk proteins are also involved in the development of the immune response, while others are involved in non-immune defense [4,5].
Despite the above-mentioned nutritional values, in recent years, there has been a decline in the consumption of animal milk with a simultaneous significant increase in the search for non-dairy alternatives [2,5,7,8,9]. The decrease can be mainly attributed to various factors such as lactose intolerance; allergic reactions to milk components like proteins; cultural and ethical reasons like an animal welfare state and environmental preservation; changes in lifestyle; the adoption of specific diets such as vegetarian, vegan, flexitarian, or Paleo; or simply a curiosity [2,5,7,8,9]. The answer to these inconveniences associated with animal milk is plant drink (PD), introduced to the market as an alternative to bovine milk, i.e., non-dairy milk originating from plant-based sources, including soy, oat, hemp, coconut, rice, almonds, and nuts, the interest in which has increased significantly in recent years [2,5,7,8,9]. The global marketplace of PD was estimated to be approximately $6 billion in total US retail market sales in 2016 [2]. In 2018, the market grew by 51.5% due to the high share of rice, oat, coconut, and almond drinks [9]. Although soybean-based beverages are the major product (~90% of the market in 2018), PDs produced from other plant sources (rice, almonds, grains, and seeds) are expected to increase in the following years [9]. Truly, values above US$12.1 billion by 2024 (with an increase of 4.91% per year) are expected to be reached [9]. According to the Good Food Institute Europe (GFI Europe), the retail sales data from NielsenIQ covering 13 European countries (Austria, Belgium, Denmark, France, Germany, Italy, Netherlands, Poland, Portugal, Romania, Spain, Sweden, and the UK) showed that sales of plant-based foods have grown 21% since 2020 to reach €5.8 billion in 2022 [10]. Among them, PD is the most developed category, marketing 11% of the overall milk market, reaching €2.21 billion last year [10]. Although the Polish market of plant-based alternatives is one of the smallest ones in Europe, their sales grew by 109% between 2020–2022 to PLN729 m. Among them, PD is the most developed product, sales of which totaled PLN387 m in 2022, while its share in the total milk category reached 10% [11]. Plant drinks are characterized by various health properties related to the presence of valuable ingredients combined with a good taste and a relatively low caloric value [5,8,9]. In this regard, plant composition is a crucial parameter for plant-based beverage manufacture, influencing the release of proteins, carbohydrates, minerals, and bioactive components (e.g., vitamins, phenolic compounds, tannins) with health-promoting properties into the aqueous media during common procedures of their production [8,9]. It is worth mentioning that these “vegetable milks” are used not only as “milk” but also can be utilized in recipes as ingredients [8]. Unfortunately, the chemical composition of both products is different, which raises some questions about whether it is reasonable to replace CM with PD without other changes in the diet [2,5,8]. This tendency is because the word “milk” is used for milk substitutes, which is interpreted as the name of a product that is a suitable nutritional substitute for bovine milk [2,5,8]. In fact, most plant beverages lack the nutritional balance compared to CM, which is reflected in a difference in the level of proteins, vitamins, and minerals (including their absorption in the body), especially Ca and certain vitamins (i.e., vitamin D) [2,5,8]. It must be commented that a similar Ca content in PD can be obtained only by adding calcium salts at the stage of its production [8,12,13]. Moreover, recipes of plant beverages vary between brands, resulting in differences in the nutrient composition even between drinks made from the same plant base [2]. Furthermore, the physicochemical and nutritional properties, as well as the quality of PDs, may depend on the technologies applied during their processing and storage [8,9]. Typically, they are subjected to ultra-high-temperature (UHT) treatment before packaging to ensure safety during storage [8]. However, thermal processing can promote the degradation of thermolabile compounds and harmful reactions, lowering their quality [8]. Therefore, to overcome these drawbacks, new, alternative technologies have been proposed to preserve all “goods” of the final products [8,9].
Therefore, it seems to be important to determine the mineral profile of non-dairy milk (in terms of the total concentration of selected elements) that could help people balance the health benefits/risks of drinking traditional milk with its plant-based alternatives [7,12,14]. For the exact evaluation of benefits or risks resulting from drinking such beverages, the total concentrations of elements are usually compared with their nutritional standards specified, e.g., by the World Health Organization (WHO) and Food and Nutrition Board (FN) [12,15,16]. However, this may be incorrect because it is assumed that the elements are 100% available and absorbed by the body during intraoral digestion [13]. This can only be assessed by the evaluation of their bio-accessibility and/or bioavailability using an in vitro digestibility model with artificial enzymes [13]. Only the results of such experiments can be used to compare the digestibility and absorption of the same nutrient in different matrices and, thus, assess the actual impact of a given product on human health [13]. To our best knowledge, the bio-accessibility of elements from milk of animal and plant origin is little described in the literature and focuses only on six elements (Ca, K, Mg, Na, P, and Zn) present in bovine milk and soy-based milk [13]. So far, information about the mineral composition of both milk groups is limited to the analysis of bovine milk [12,14,16,17,18] and/or its plant alternatives from soy [12,14,15], rice [12,14], oat [12,14], almonds [7,12,14,15], nuts [7,12,15], hemp [12], or quinoa [12]) on the total content of a wide range of essential and toxic elements (Ag [7], Al [7,12,15], As [12,15,16,18], B [12], Ba [7,12,15,16], Be [16], Bi [12,15,16], Ca [7,12,15,16], Cd [7,12,15,16,17,18], Co [7,12,14,15,16], Cr [7,12,15,16,17,18], Cs [12,16], Cu [7,12,15,16,17], Fe [7,12,15], Ga [12,16], Hg [12,14,15], In [7,16], K [12,14,15], La [12], Li [12,16], Mg [7,12,14,15], Mn [7,12,14,15], Mo [12,15], Na [12,14,15], Ni [7,12,14,15,16], Nb [12], Ni [12], P [12,14,15], Pb [7,12,14,15,16,17,18], Pt [15], Rb [12,16], S [15], Sb [12,15], Se [12,15,16,17], Si [12], Sn [12,15], Sr [12,16], Te [12], Ti [12,15], Tl [12,16], U [12,14,16], V [12,14,16], W [12,15], Zn [7,12,15,16], Zr [12]) by various spectrometric methods, including flame or graphite furnace atomic absorption spectrometry (F-AAS or GF-AAS) [17], inductively coupled plasma optical emission spectrometry (ICP OES) [14,15], or inductively coupled plasma mass spectrometry (ICP-MS) [12,14,16,18], combined with a previous sample of wet digestion [7,12,14,15,16,17,18]. It should be noted that only a few of these studies compared the elemental composition of different types of PD with that of animal milk [12,14].
In view of this, the present work aims to update the information about the mineral content of dairy and non-dairy milk samples based on the determination and comparison of the total concentration of 20 elements (Al, As, B, Ba, Ca, Cd, Cr, Cu, Fe, K, Mg, Na, Mn, Ni, P, Pb, Sb, Se, Sr, and Zn) and bio-accessible fractions of B, Ba, Ca, Cr, Cu, Fe, Mg, Mn, P, Sr, and Zn in commercially available CMs (1.5, 2.0, 3.2% fat) and plant-based (almonds, oat, rice, soy) beverages of various brands. The results of the multi-element analysis were compared with nutritional standards for dietary intakes of essential elements and the upper tolerance intake of toxic elements for adults to reliably assess the benefits/potential harm to human health associated with the consumption of these products, as well as to judge if the non-dairy drink of plant origin could be a suitable alternative to the milk of animal origin.
2. Materials and Methods
2.1. Samples
Four types of UHT PD—almond (A), oat (O), rice (R), and soy (S)—from three different brands, as well as UHT CM with varying fat content (1.5%, 2.0%, and 3.2%) of the same brand, were analyzed. Importantly, brand 2 PDs were enriched with CaCO3 at the stage of their production, possibly to mimic the Ca levels of CMs. All products are widely available on the Polish market. All 14 analyzed samples were purchased from a local store in Wroclaw and labeled as follows: PDA1-PDA3, PDO1-PDO3, PDR1-PDR3, and PDS1-PDS2 for almond, oat, rice, and soy drinks, respectively, and CM1-CM3 for 1.5%, 2.0%, and 3.2% fat CM, respectively. The details of the products analyzed are provided in Table 1. All of them were stored in their original packings (1 L carton) at ambient temperature. They were mixed before the analysis to ensure sample homogeneity, and once opened, they were stored in a refrigerator. To verify the trueness of the results of the multi-element analysis (determination of the total contents of the element), two certified reference materials (CRMs) were used, i.e., SRM 1549 (non-fat milk powder) and ERM-BD151 (skimmed milk powder).

Table 1.
The characteristics of the analyzed products.
2.2. Reagents and Solutions
All the chemicals were of at least analytical grade purity. For the wet digestion of the analyzed samples, a 65% (m/v) HNO3 solution from Merck (Merck, KGaA, Darmstadt, Germany) was used. Commercially available ICP standards, i.e., a Merck Certipur® multi-element stock (10 mg L−1) solution No. 1 and single-element stock solutions of As, Sb, and Se (1000 μg mL−1), were used for preparing matrix-matching standard solutions for the calibration of ICP OES before the determination of Al, B, Ba, Ca, Cd, Cr, Cu, Fe, K, Mg, Mn, Na, Ni, P, Pb, Sr, and Zn by pneumatic nebulization (PN) and As, Sb, and Se by hydride generation (HG) sample introduction techniques. A 37% (m/v) HCl solution (Sigma-Aldrich, St. Louis, MO, USA) was used to acidify the sample and standard solutions (to 3 or 6 mol L−1) at the step of the pre-reduction and for the HG reaction. A mixture of 2.5% (m/v) thiourea (TU, Sigma-Aldrich) and 10% (m/v) L(+)-ascorbic acid (AA, Avantor Performance Reagents, Gliwice, Poland) served as the pre-reducing agent for As(V) and Sb(V). This pre-reducing mixture was prepared by dissolving the respective solid reagents in water. To reduce Se(VI) to Se(IV), 6 mol L−1 HCl was applied. To neutralize residual HNO3 after the wet digestion, hydroxylamine hydrochloride (HH) was employed and added to the sample solutions before the As(V), Sb(V), and Se(VI) pre-reduction. A 40% (m/v) aqueous solution of HH was made from its solid reagent (Avantor Performance Reagents). To generate As, Sb, and Se hydrides, a 1.0% (m/v) NaBH4 (stabilized with 0.10% (m/v) NaOH) reductant solution was used. The reductant solution was prepared daily by dissolving an appropriate amount of powdered NaBH4 (Sigma-Aldrich) in a NaOH solution (Sigma-Aldrich) and filtered through a hard filter paper before measurements. The simulated gastric (SGJ) and intestinal (SIJ) juices were used for the in vitro 2-step gastrointestinal digestion (GID) procedure (bio-accessibility study). These specific solutions were freshly prepared and were composed of 0.32% (m/v) pepsin with 0.20% (m/v) NaCl in 0.08 mol L−1 HCl (SGJ) and 0.40% (m/v) pancreatin with 2.5% (m/v) bile salts in 0.10 mol L−1 NaHCO3 (SIJ). All the solid reagents essential for the GID procedure, i.e., pepsin from porcine gastric mucosa (800–2500 units/mg of protein), pancreatin from porcine pancrease, bile salts, PIPES (piperazine-NN-bis(2-ethane-sulfonic acid) disodium salt), NaCl, and NaHCO3 were purchased from Merck [19]. High-retention cellulose dialysis bags of 12.4 kDa MWCO (Sigma-Aldrich) were used to separate the bio-accessible fraction of the studied elements from the incubates of the analyzed samples [19]. De-ionized water (18.3 MΩ cm−1) from a BarnsteadTM (Barnstead, NH, USA) EASYpure RF purification system (model D7033) was used throughout all the experiments.
2.3. Instrumentation
The measurements of the total concentrations of studied elements (Al, As, B, Ba, Ca, Cd, Cr, Cu, Fe, K, Mg, Mn, Na, Ni, P, Pb, Sb, Se, Sr, and Zn) were performed using an Agilent benchtop simultaneous optical emission spectrometer (model 720) with an axially viewed Ar-ICP (Agilent Technologies Inc., Santa Clara, CA, USA). The instrument was equipped with a standard, one-piece quartz torch with an injector tube of 2.4 mm ID, a high-resolution Echelle-type polychromator with a temperature-controlled optic system, a VistaChip II CCD detector, and a 4-channel peristaltic pump. The sample and standard solutions were pneumatically introduced using an Agilent OneNeb® concentric nebulizer and a single-pass glass cyclonic spray chamber (Agilent). To determine As, Sb, and Se by HG-ICP OES, a continuous flow HG system with the gas–liquid phase separation was applied. This system consisted of a modified cyclonic spray chamber, a OneNeb® nebulizer (Agilent), a Y-shaped PP connector (to mix the sample/standard solution with the NaBH4 solution), appropriate tubings (PVC delivery pump tubings as well as a knotted reaction coil, made of a PTFE capillary tubing), and an additional peristaltic pump to drain the resulting post-reaction solution. The operating parameters set to the ICP OES spectrometer and the HG reaction system are summarized in Table S1. A fitted background mode with 7 points per line profile was applied for the background correction. The background corrected net intensities of the analytical lines of studied elements (means of n = 3 repeated measurements) were taken for the studies.
All the analyzed samples were wet digested using a Multiwave PRO microwave reaction system (Anton Paar GmbH, Graz, Austria), equipped with a 24HVT50 rotor and 50 mL PTFE-TFM pressure activated-venting vessels. The enzymatic digestion (GID procedure) was performed in a temperature-controlled shaking water bath (Elpin, Masovian Minsk, Poland, model 357). A JP Selecta (Abrera, Spain) ultrasonic bath (UltrasonsH) with heating was applied at the pre-reduction step before the Se determination by HG-ICP OES.
2.4. Sample Preparation Procedures
2.4.1. Microwave-Assisted Closed-Vessel Wet Digestion—Determination of Total Content of Elements
Appropriate portions of samples, i.e., 8.0 g (PDs and CMs) and 0.50 g (CRMs) were decomposed in the presence of 7.0 mL of concentrated HNO3, employing a 6-step temperature-controlled program, i.e., 90 °C, 5 min, ramp (step 1); 90 °C, 15 min, hold (step 2); 130 °C, 5 min, ramp (step 3); 130 °C, 15 min, hold (step 4); 190 °C, 5 min, ramp (step 5); 190 °C, 15 min, hold (step 6). After cooling, the vessels were opened, and the resulting sample digests were quantitatively transferred to 30 mL polypropylene (PP) containers with screw caps (Equimed, Kraków, Poland) using small portions of deionized water and, finally, diluted to 20.0 g. They were kept at 4 °C before and kept at 4 °C until the HG/PN-ICP OES analyses.
2.4.2. In Vitro 2-Step GID Procedure—Determination of the Bio-Accessible Fraction of Elements [19]
To determine the bio-accessibility of elements in the PDs and CMs, a 2-step in vitro GID procedure with artificial enzymes (SGJ and SIJ solutions) was used. In the procedure, 20.0 g portions of PDs and CMs were weighed into 50 mL PP screw-capped containers (Equimed). Then, a 2 mol L−1 HCl solution was added dropwise to them until pH 2.0 was obtained. Afterward, 3.0 mL of the SGJ solution was added to each sample to simulate, at first, the gastric digestion. This proceeded in a shaking water bath with agitation (150 rpm) at 37 °C for 2 h. After this time, the containers were put in an ice bath for 10 min to stop the enzymatic reaction. Next, 3.0 mL of the SIJ solution was added to the resulting samples to simulate, in the second step, intestinal digestion. At the same time, the dialysis membrane bags were filled with 10 mL of a 0.15 mol L−1 PIPES solution and placed in each container. As before, the incubation was carried out and the resulting samples were cooled to stop the enzymatic reaction. Finally, the contents of the dialysis membrane bags (the dialyzable/bio-accessible fraction) and the residual solutions (the nondialyzable fraction) were transferred to 30 mL PP containers with screw caps and refrigerated before the spectrometric measurements by PN-ICP OES. The percentage contribution of the bio-accessible fraction of the elements (%B) contained in PDs and CMs was calculated as follows: (CD/Ct) × 100, where CD corresponded to the mean concentration of the elements determined in the dialyzable fraction of PDs or CMs, and Ct referred to the total mean concentration of these elements.
Each sample of PDs and CMs was prepared and analyzed in triplicate (n = 3), i.e., three parallel samples were simultaneously prepared. For both certified reference materials, the analysis was performed in five (n = 5) parallel samples. Independently of the procedure used (wet digestion, in vitro GID), with each set of samples, the appropriate procedural blanks were simultaneously run (using deionized water instead of milk) and considered in the final results. The obtained sample solutions were subjected to the multi-element analysis by PN-ICP OES against the external calibration with the matrix-matched standard solutions (prepared based on the respective procedural blanks) at concentrations up to 5 mg kg−1. In the case of the As, Sb, and Se quantification (HG-ICP OES), the calibration standards covered the range of 0–20 ng g−1. The concentrations of most elements were determined in undiluted sample solutions. Only in the case of Ca, Mg, K, Na, and P did they need to be appropriately diluted, i.e., 10–200-fold.
2.5. Pre-Reduction of As, Sb, and Se and Generation of AsH3 SbH3, and H2Se [20,21]
The total As, Sb, and Se content was determined in all analyzed samples as As(III), Sb(III), and Se(IV) after the previous pre-reduction of As(V) and Sb(V) using a 0.50% TU–2.0% AA mixture in an acidic medium (3 mol L−1 HCl), and Se(VI) by heating in the presence of 6 mol L−1. Before this step, the respective solutions of the digested PDs and CMs were initially neutralized with a concentrated HH solution to prevent a negative effect of residual HNO3 originating from the sample digestion (~2.5 mol L−1 after the pre-reduction) in the presence of 3 or 6 mol L−1 HCl. The final concentration of HH in the resulting solutions was 2.0%. For the pre-reduction of As and Sb, appropriate aliquots of the sample solutions (2.0 g) were transferred into 12-mL screw-capped PP tubes (Equimed), treated with 0.2 g of the 40% HH solution, then mixed with a 0.8 g portion of the pre-reducing mixture 2.5% TU–10% AA, and finally, completed to the final mass of 4.0 g with concentrated HCl. Afterward, tubes were capped, mixed, and left to react at room temperature for 30 min before the measurements. In the case of Se, in the 2.0 g sample portions, 0.2 g of the 40% HH solution was added first and then completed to the final mass of 4.0 g with contracted HCl. The pre-reduction was carried out at an elevated temperature using an ultrasonic bath. In the procedure, the samples were heated at 80 °C for 30 min. The respective blanks and the standard solutions were pre-reduced analogously as the samples of PDs and CMs.
The gaseous As, Sb, and Se hydrides were formed by mixing the solutions of the acidified samples and NaBH4. For this purpose, the reagents, i.e., standard/sample and reductant solutions, were simultaneously delivered to the system in separate streams by the peristaltic pump of the ICP OES spectrometer and mixed in the Y-connector. The resulting reaction mixture immediately passed through the reaction coil and was introduced at the bottom part of the modified spray chamber to separate the gaseous products from the liquid phase (the post-reaction solution). Next, these gaseous HG reaction products were swept by a carrier Ar stream (introduced through the nebulizer gas inlet) and transported to the ICP torch. The additional peristaltic pump removed the resulting post-reaction solution from the chamber.
2.6. Statistical Data Evaluation
The two-side one-way analysis of variance (ANOVA) for independent groups was applied to establish the statistically significant differences (at α = 0.05) between 5 groups of analyzed products, i.e., CMs, PDAs, PDOs, PDRs, and PDSs, owing to the mean concentrations of determined elements. Due to the heteroscedasticity of these variables between the abovementioned groups of samples, Welch’s ANOVA was used. Next, Fisher’s least significant difference (LSD) test at α = 0.05 was used to particularly find the differences between the compared groups of beverages in these post hoc multiple comparisons, i.e., considering for each element the following 10 pairs of differences: CM-PDA, CM-PDO, CM-PDR, CM-PDS, PDA-PDO, PDA-PDR, PDA-PDS, PDO-PDR, PDO-PDS, and PDR-PDS. Since 14 (out of all 20) elements, for which the mean concentrations determined in all samples of PDs and CMs were higher than the respective method limit of detection values (MLODs) of these elements, were considered for the abovementioned multiple comparisons, i.e., Al, B, Ba, Ca, Cr, Cu, Fe, K, Mg, Mn, Na, P, Sr, and Zn, 56 such possible differences were possible to be found for each group of kinds of beverage. Differences in the mean concentrations of determined elements for possible pairs of the compared groups of PDs and CMs for which the p-values were lower than α were statistically significant. Additionally, based on the average concentrations of the determined elements, the same analysis was carried out between 2 groups of analyzed products, i.e., CMs and all PDs, to check the significance of the statistical differences (at α = 0.05) between milk of animal origin and PDs.
In addition, the principal component analysis (PCA) was applied to reduce the dimensionality of the collected data set to 2 dimensions, i.e., 2 principal components (PC1 and PC2), and to visually identify the clusters of closely related samples that belong to the same group. The mean concentrations of 17 determined elements were included at the beginning as variables; 14 elements, which were determined in all samples, and 3 elements (As, Ni, Se) were determined in some samples below their MLODs. In the latter case, these MLODs were used in the data matrix. Next, considering the outcomes of Welch’s ANOVA and Fisher’s LSD test, only the means concentrations of elements that provided the highest number of differences between the compared groups of beverages were used as variables.
2.7. Verification of the Trueness of the Results
The trueness of the results of the multi-element analysis of PDs and CMs (the determination of the total content of elements) by PN/HG-ICP OES was verified by the analysis of two CRMs, i.e., SRM 1549 (non-fat milk powder) and ERM-BD151 (skimmed milk powder). The determined mean concentrations of elements were statistically compared (at α = 0.05) with the certified ones given in the respective certificates. A proper statistical test, i.e., the Student t-test with a critical value (tcritical) equal to 2.776, was used for this purpose [22]. Additionally, the recoveries (in %) obtained for all elements were calculated. To ensure the accuracy of the results of the bio-accessibility study, a mass balance was carried out for the chosen cow milk and plant drink samples (PDA1, PDO1, PDR1, PDS1, and CM1). This was carried out by comparing the total mean contents of elements determined after microwave-assisted wet digestion with the sums of their mean concentrations determined in both the dialyzed and the non-dialyzed fractions by PN-ICP OES and expressed as recovery (in %).
2.8. Nutritional Value of Plant Drinks and Cow Milks Evaluation
The nutritional value of the analyzed PDs and CMs was evaluated based on the bio-accessibility of the studied elements. Accordingly, the degree of coverage of the daily requirements for the essential elements (Ca, Cu, Fe, Mg, Mn, P, and Zn) involved with the drinking of 1 L of these products was estimated. For this purpose, their concentrations were compared with the recommended dietary allowances (RDAs: in mg day−1) for healthy adults (male (M) and female (F), aged 31–50): 1000 (M, F) for Ca, 0.9 (M, F) for Cu, 8 (M) and 18 (F) for Fe, 420 (M) and 320 (F) for Mg, 2.3 (M) and 1.8 (F) for Mn, 700 (M, F) for P, and 11 (M) and 8 (F) for Zn [23]. The same was performed considering the non-essential/toxic elements (Al, B, and Ba). In this case, the intake of the aforementioned elements involved with the drinking of 1 L of CMs and PDs was also evaluated by comparison of their concentrations with tolerance’s upper intake levels (TUIs, in mg per day), i.e., 65 (Al) [24], 20 (B) [23], and 1.3 (Ba) [25].
3. Results and Discussion
3.1. Trueness of the Results—CRM Analysis
The results (the mean concentrations, n = 5) along with their standard deviations (SDs) of the analysis of ERM BD151 and NITS SRM 1549 are presented in Table 2. Additionally, the calculated values of the t-test (tcalculated) are included in this table.
Table 2.
The results of the analysis of ERM BD151 (Skimmed Milk Powder) and NIST SRM 1549 (Non-Fat Milk Powder) by PN/HG-ICP OES.
The determined mean concentrations of elements in both CRMs were found to be consistent with the certified values. In general, the quantitative recoveries were obtained, ranging from 97.1% to 118%. Importantly, based on the t-test, the differences between the results were not statistically significant (tcalculated < tcritical). However, there were a few exceptions, i.e., Cd, Cr, and Pb were not determined in the NIST SRM 1549 due to their very low content (0.0005–0.019 mg kg−1). Nevertheless, these elements were successfully determined in the second CRM (ERM-BD151). These findings demonstrated that the results obtained in this work are accurate (true and precise).
3.2. Multi-Element Analysis of Non-Dairy (Plant) Drinks and Animal-Derived Milks
The total concentrations of 20 elements determined in samples of PDs and CMs by PN/HG-ICP OES are presented in Table 3. The results are mean values (n = 3) along with their SDs.
Table 3.
The total element content (mean ± SD, n = 3, in mg kg−1) in the studied plant (PD) drink and cow (CM) milk samples determined using PN/HG-ICP OES.
As shown in Table 3, the contents of Cd, Pb, and Sb were lower than their MLOD values in all analyzed products. Similarly, several other elements such as As, Ni, and Se were only present in selected PDs and CMs, namely, As only in PDRs, Ni only in PDAs, PDOs, and PDSs, and Se only in CMs. For the remaining milk and plant drink samples, the concentrations of these elements were below the respective MLODs. The precision of the measurements was good and ranged between 0.26–4.9%. Higher RSD values (5.3–8.1%) were observed for those elements that were determined in very low concentrations in the samples.
3.2.1. Total Content of Element versus the Type of Plant Drink
Regardless of the type of PD, the highest values were obtained for Ca, K, Mg, P, and Na (ranged from 9.09 to 1839 mg kg−1), i.e., macro elements, while the remaining elements, i.e., Al, As, B, Ba, Cr, Cu, Fe, Mn, Ni, Se, Sr, and Zn, were determined in lower concentrations (by 1–5 orders of magnitude lower, i.e., ranged from 0.0031 to 5.48 mg kg−1) and considered minor and trace elements. It is important to note that when comparing PD made from the same plant material, the products of brand No. 2 contained significantly higher levels of Ca (1433–1581 mg kg−1) compared to brands 1 and 3 (9.09–329 mg kg−1). However, the high levels of Ca in these samples were expected, as they were enriched with CaCO3 at the stage of their production (see Table 1). Hence, the outcomes for Ca in PDA2, PDO2, PDR2, and PDS2 were excluded from the comparison. It must be mentioned that the determined Ca contents (143–158 mg/100 mL) were 19–30% higher in them than the declared values (120 mg/100 mL) (see Table 1). However, the Ca content in these PDs given by the producer applies only to its addition in the form of salt, without considering Ca coming from plant material.
The mean concentrations of macro elements spanned the following ranges: 100–377 mg kg−1 (PDAs), 11.1–437 mg kg−1 (PDOs), 38.1–252 mg kg−1 (PDRs), and 10.9–1818 mg kg−1 (PDSs). They changed in the following order: K > Na > Ca > P > Mg, K > Na > P >> Mg > Ca, Na > K >> P > Ca > Mg, and K >> P > Mg > Ca >> Na for PMAs, PMOs, PMRs, and PMSs, respectively. The levels of these elements differed and were characteristic of each type of drink. Except for PDSs, the mean concentrations of Na and K (197–437 mg kg−1) were higher than those of other macro elements (11.1–219 mg kg−1). Interestingly, PDSs had the highest mean K content (1817 mg kg−1) among all analyzed PDs. In contrast, the mean Na content in PDSs was the lowest (10.9 mg kg−1). Similarly, for PDOs and PDRs, the mean concentrations of Mg and Ca (11.1–38.1 mg kg−1) were much lower than the mean concentrations of K, Na, and P (77.4–437 mg kg−1), as well as the mean concentrations of Ca and Mg determined in PDAs and PDSs (100–219 mg kg−1). Considering the essential micro elements, i.e., Cu, Fe, Mn, and Zn, their mean concentration varied from 0.066 to 4.83 mg kg−1. The relations between them were as follows: Fe > Zn > Mn > Cu (PDAs, PDSs), Fe ≥ Mn > Zn > Cu (PDOs), or Zn > Fe > Mn >> Cu (PDRs). It is interesting to note that for PDRs, the mean content of Zn, Fe, and Mn, i.e., 0.651 mg kg−1 (Zn), 0.299 mg kg−1 (Fe), and 0.279 mg kg−1 (Mn), was 4.2–9.9 times higher compared to that of Cu, which was 0.066 mg kg−1. On the other hand, for other PDs, the differences between the mean concentrations of Fe (0.617–4.83 mg kg−1), Zn (0.578–3.51 mg kg−1), or Mn and Cu (0.263–1.51 mg kg−1) were lower (1.3–2.8 times). It could also be observed that the mean concentrations of Zn, Fe, Mn, and Zn determined in PDSs, i.e., 1.51–4.83 mg kg−1, were significantly higher compared to the results achieved for PDAs (0.414–1.17 mg kg−1), PDOs (0.263–0.617 mg kg−1), and PDRs (0.066–0.651 mg kg−1). The mean concentrations of the rest minor/trace elements (Al, B, Ba, Cr, Ni, and Sr) were low (<1.0 mg kg−1) and varied between 0.016–0.630 mg kg−1 for PDAs, 0.0097–0.304 mg kg−1 for PDOs, 0.0089–0.398 mg kg−1 for PDRs, and 0.025–0.772 mg kg−1 for PDSs. The highest mean contents of these elements were determined, again, in PDSs. They fulfilled the following orders: Sr > B > Al > Ba >> Ni > Cr (PDAs), Al ≥ Sr > Ni > B > Ba >> Cr (PDOs), Sr > Al > B >> Ba > Cr (PDRs), and B > Al > Ni > Sr > Ba >> Cr (PDSs). In contrast, depending on the type of PD, the lowest contents (<0.050 mg kg−1) were noticed for Cr (all PDs), Ni (PDAs), B (PDOs), and Ba (PDOs, PDRs). The mean concentrations of the remaining elements were close to those of Cu, Fe, Mn, or Zn. Finally, it must be commented that only PDRs contained traces of toxic As (9.47 ng g−1 on average). However, this was not surprising because, compared to other plants, rice can easily accumulate this element in its grains [26,27].
Considering the mineral composition, the analyzed PDs can be ranked as follows (in descending order): PDS > PDA > PDO~PDR. It appeared that PDSs can be considered the best source of the studied elements. Indeed, the average concentrations of most of them, i.e., Al, B, Ba, Cr, Cu, Fe, K, Mg, Mn, Ni, P, and Zn, were much higher in this PD type than determined in PDAs, PDOs, and PDRs, i.e., by 1.1–15 times (PDAs), 2.5–20 times (PDOs), and 2.1–23 times (PDRs). The exceptions were Ca, Na, and Sr; the highest mean contents of these elements were found in PDAs.
The results obtained in this work for PDAs, PDOs, and PDRs are within the ranges reported by others (Table 3). However, depending on the brand of the milk, the contents of some elements, e.g., B, Ba, Cu, K, Mg, Sr, and Zn (PDA1); Al, Fe, Mn, and Zn (PDO2); or Al, Cr, Fe, Mg, Mn, Sr, and Zn (PDR2), were higher than those published. Few exceptions were noted. Accordingly, in the case of Ca and Cu determined in PDOs, our results were much lower (one order of magnitude) and higher (up to 3 times), respectively, in comparison to the literature data. Interestingly, we determined both B and Cr in all three PDO samples (not determined by others). Conversely, the herein analyzed PDOs did not contain As and Cd. The same tendency could be observed for B and Cd (PDRs). Except for Na, the contents of the majority of elements determined in PDSs were slightly higher than those reported in the literature. The concentration of Na was much lower (1–2 orders of magnitude) compared to the literature data. Finally, it is worth mentioning that we did not determine Sb in any of the analyzed PDs, which is different compared to the literature reports.
3.2.2. Total Content of Element versus the Brand of Plant Drink
The concentrations of individual elements in PDs varied depending on the brand, as shown in Table 3. In general, products from the second supplier (brand 2) had a higher content of most elements. Such a relation could be observed for PDOs, PDRs, and PDS. In contrast, the results for PDOs and PDRs coming from other suppliers were quite similar or less differentiated. Moreover, the differences do not seem to depend on the amount of plant material used to produce PDs. Regarding PDAs, the contents of elements could be arranged as brand 1 > brand 2 > brand 3. However, the first brand had three times more almonds in its milk than the other two, which may explain the higher element content.
3.2.3. Total Content of Elements in Plant Drinks versus Cow Milks
Next, a comparison of the mineral content between PDs and similarly fat-containing CMs was made. The mean concentration of macro elements (121–1768 mg kg−1) in CMs changed as follows: K > Ca > P>Na > Mg, while minor/trace elements (0.012–3.24 mg kg−1) could be arranged as Zn > Sr > Fe > B>Al >> Ba > Cu > Mn~Cr > Se. These relationships differed from those found for PDs (see Section 3.2.1). Furthermore, the mean concentrations of elements in CMs and PDs varied depending on the milk fat content. This led to the conclusion that the mineral content of PDs seems to be more dependent on the raw material used to produce them than their fat content. Such a relationship was not found in the case of CMs. Two exceptions were noted. Accordingly, as the fat percentage increased, there was a slight reduction (by 27%) in the level of Al. By contrast, the Se level increased with an increase in the fat content by approximately 18%. Satisfactorily, the mean concentrations of the studied elements were close to those reported for CMs (see Table 3). Considering the individual elements, it was found that CMs are the best source of Ca and P. The differences between the mean concentrations of Ca were from 5.1–31-fold (PDAs, PDRs, PDSs) to even 2 orders of magnitude (PDOs). Plant beverages require the addition of CaCO3 at the stage of their production to achieve a similar Ca content as in CMs, as demonstrated by the analysis of the samples of brand 2. It agrees with the already published results [12]. It should be noted that the Ca values determined in the CMs (115–119 mg/100 mL) were similar to those declared by the producer (105 mg/mL). For P, the differences were smaller, i.e., 1.5–12-fold. Moreover, CMs are the only type of milk containing an essential trace element such as Se (11.8 ng g−1 on average). Conversely to these 3 elements (Ca, P, and Se), the mean content of Mn (0.022 mg kg−1) was significantly lower than in PDs (0.279–2.20 mg kg−1). For the rest of the elements, the composition closeness of CMs with PDRs (B, Ba, Cu, Fe), PDAs (Al, Mg, Na), PDSs (Cr, K, Zn), and PDOs (Sr) was observed. To conclude, except for Ca, Na, and P, PMSs have an advantage over CMs. Additionally, having similar mean contents of Cr, K, and Zn, the average concentrations of Al, B, Ba, Cu, Fe, Mg, and Mn were 6.3 (Al), 13 (B), 3.8 (Ba), 29 (Cu), 25 (Fe), 1.7 (Mg) 98 (Mn), and 1.8 (Sr) times higher in PDSs as compared to the respective average concentrations in CMs. After comparing these findings with the previous ones (as discussed in Section 3.2.1), it can be concluded that PDSs stand out from other milk groups since they have higher levels of Al, B, Ba, Cu, Fe, Mg, and Mn but lower levels of Na. Hence, the mean concentrations of the latter elements could be particularly useful to classify and/or discriminate milks of various origins, in this case, animal-derived milks represented by CMs and plant-derived non-dairy drinks represented by PDAs, PDOs, PDRs, and PDSs.
3.2.4. The ANOVA and the PCA Evaluation of Animal-Derived Milk and Non-Dairy Plant-Derived Drinks
All of the above-mentioned differences were checked by the statistical analysis. The Welch’s ANOVA results, providing the mean concentrations of the determined elements in samples forming given groups of the analyzed products, i.e., CMs, PDAs, PDOs, PDRs, and PDSs, along with the SDs of these concentrations, are given in Table 4. In addition, the p and F values of the Welch test, indicating statistically significant differences between the compared groups of dairy and non-dairy products are included. The pairs of the compared groups of beverages that differ from each other, along with the p values of Fisher’s LSD test, are given as well.
Table 4.
The two-sided one-way Welch’s analysis of variance (ANOVA) along with the post hoc Fisher’s least significant difference (LSD) test for the compared groups of cow milk/plant drink samples: cow (CMs), almond (PDAs), oat (PDOs), rice (PDRs), and soy (PDSs).
As can be seen, the mean concentrations of 11 (B, Ba, Cu, Fe, K, Mg, Mn, Na, P, Sr, and Zn) out of 14 elements listed in Table 4 enabled us to differentiate the examined groups of beverages due to their type to a varying extent. Conversely, this was not noticed for the elements such as Al, Ca, and Cr. On the other hand, such elements as Mg (8 pairs of differences out of 10 possible), B and P (7), as well as Cu, K, Na, and Zn (6), provided the highest number of pairs of differences in the mean concentrations of these elements determined in the compared groups of PDs and CMs. Considering all 14 elements (Table 4), for each group of analyzed products, up to 56 pairs of differences in the mean concentrations of these elements could be found. Having this in mind, 34 such pairs of differences were established for PDSs, followed by PDAs (25), CMs (22), PDRs (20), and PDOs (17).
Additionally, it was also observed that among the elements mentioned above, allowing for the differentiation of beverage according to its type (A, R, O, S, and C), some of them could be especially useful for distinguishing PDs from milk of animal origin (CMs). As shown in Table 5, such statistical differences (p < α = 0.05) were established in the cases of Cu, K, Na, P, and Zn. It is worth mentioning that to differentiate only PDs from CMs, the mean concentrations of Ca, Cr, and Fe could be adequate as well. Accordingly, the differences in their contents (Table 5) were found to be statistically significant (p < α = 0.05).
Table 5.
The two-sided one-way Welch’s analysis of variance (ANOVA), along with the post hoc Fisher’s least significant difference (LSD) test at α = 0.05 for the compared groups of CMs and PDs (including almond (PDAs), oat (PDOs), rice (PDRs), and soy (PDSs)). In the case of the significant differences, the p values are underlined.
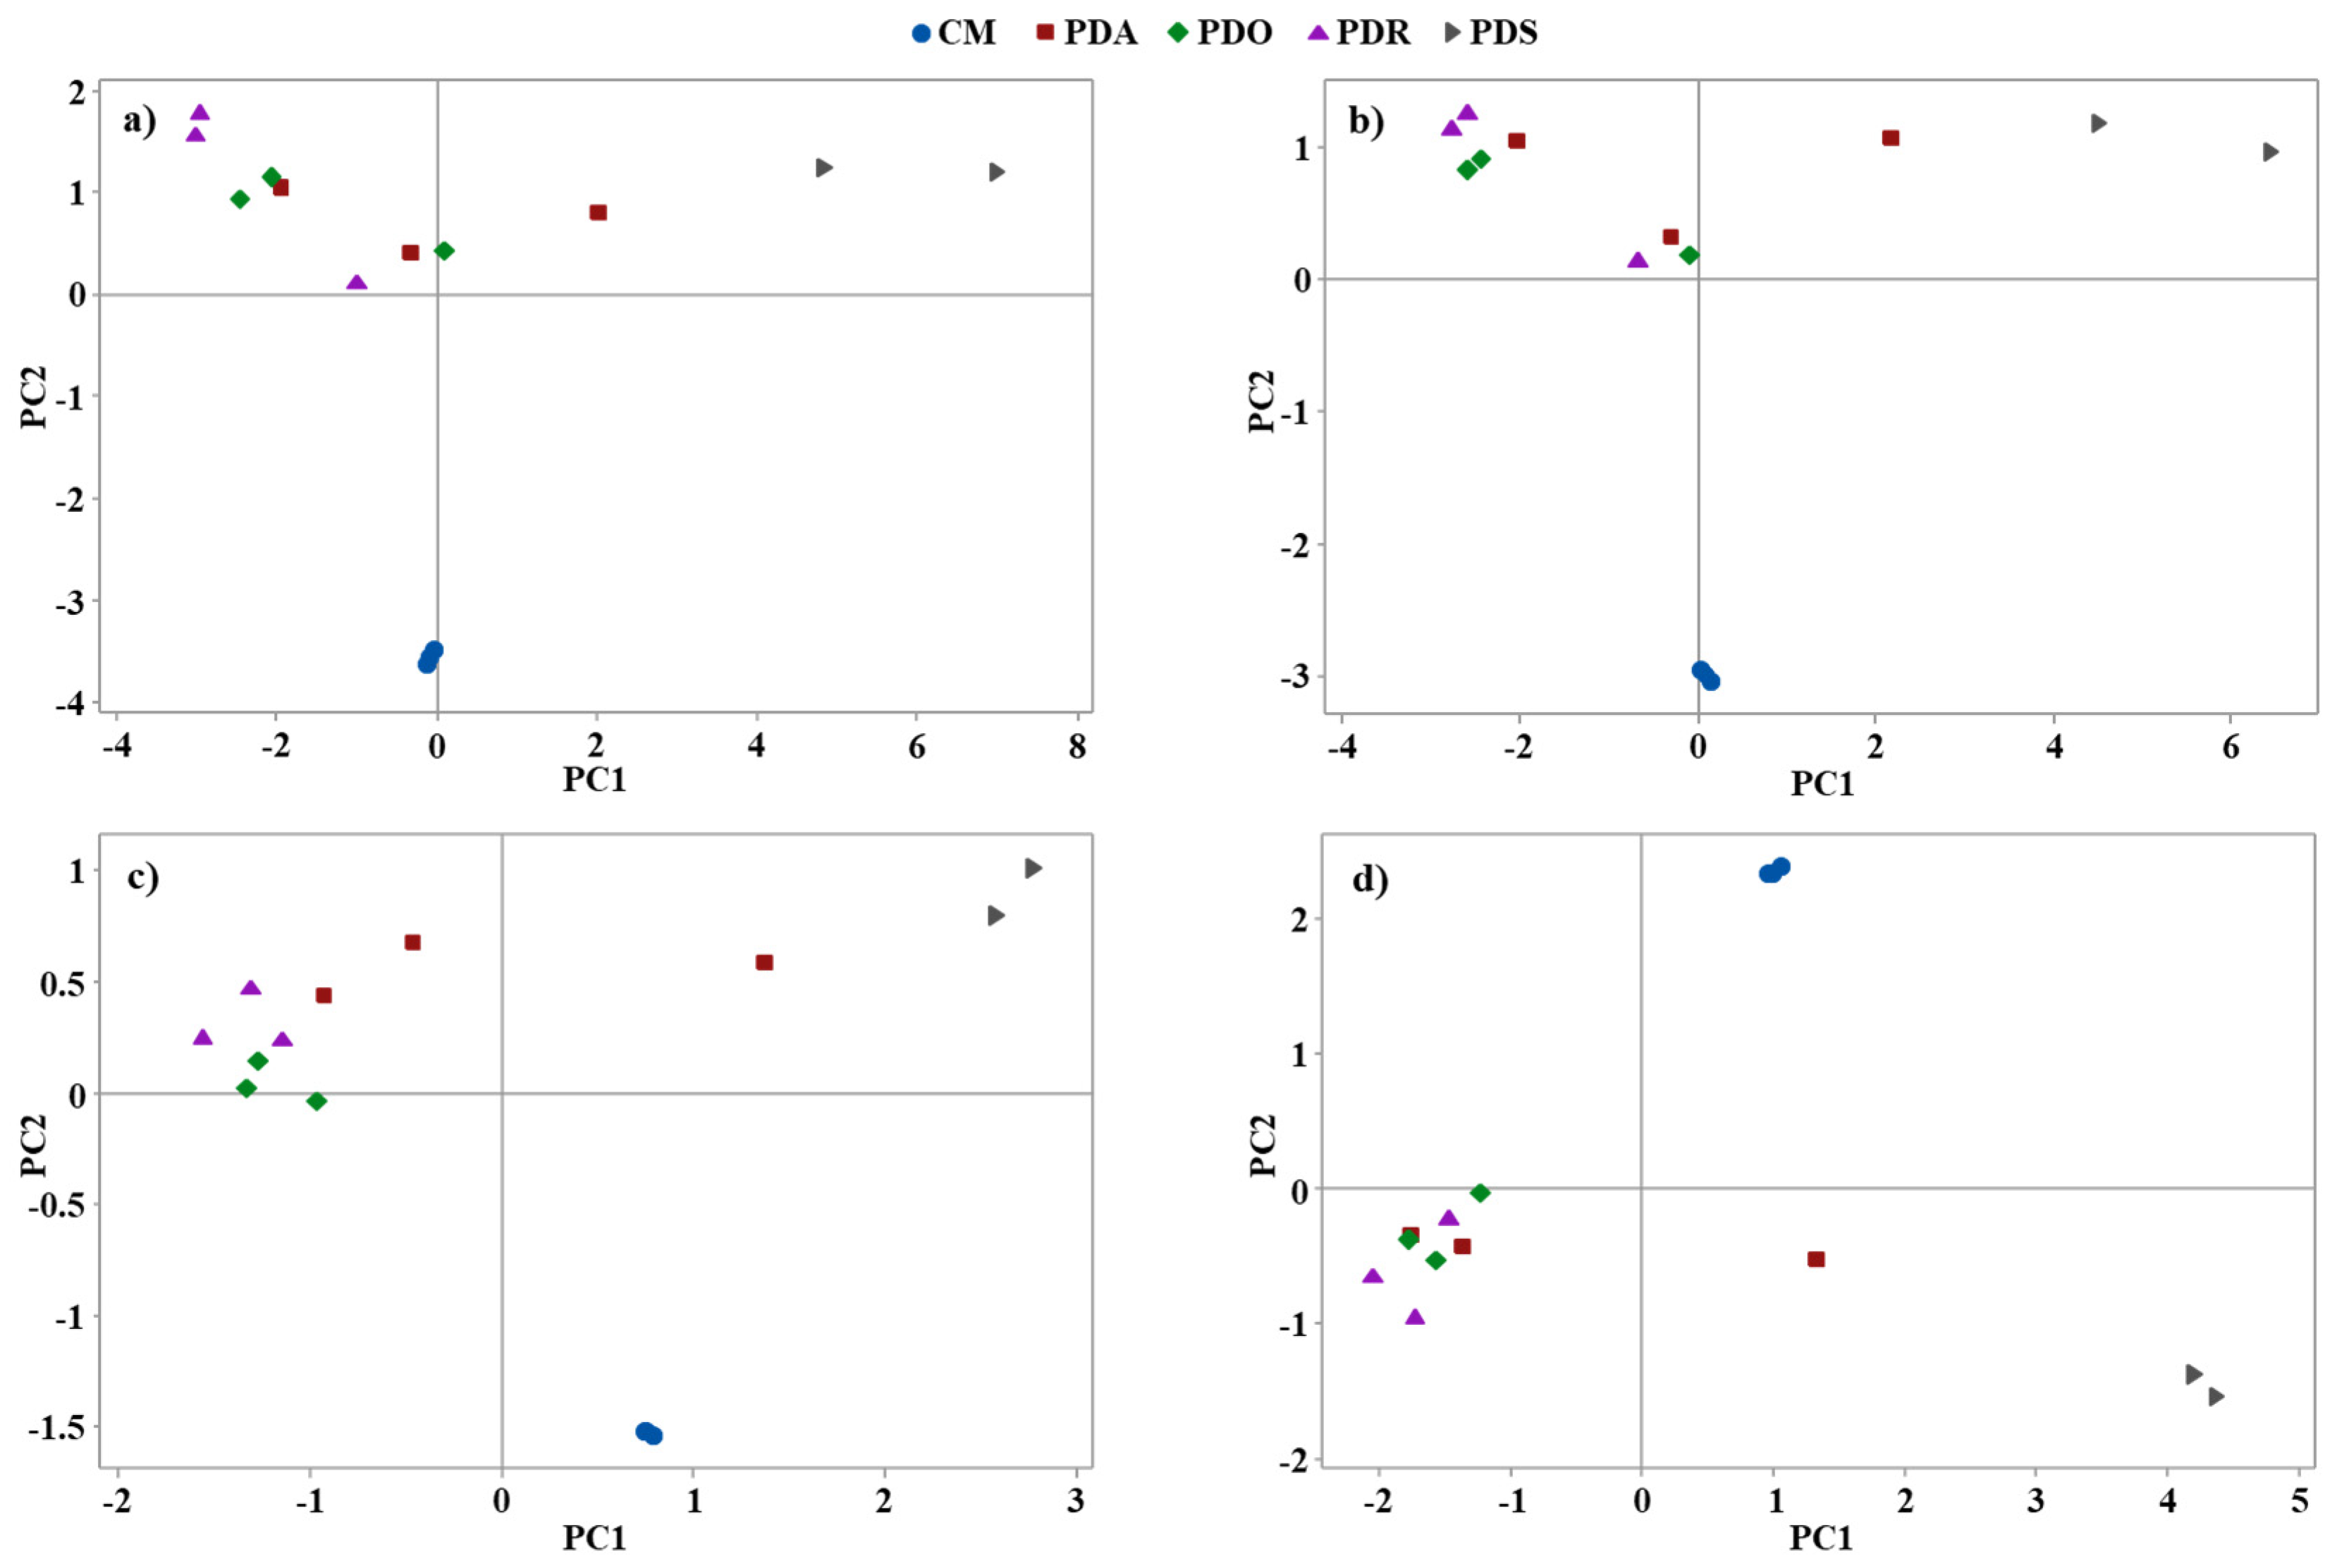
To show a practical application of the mean concentrations of elements measured in the examined samples of CMs and PDs for their visualization and grouping, PCA based on the correlation matrix was used. The eigenvalues and explained variances by PC1 and PC2 are given in Table 6 for different numbers of variables used, i.e., 17, 14, 7, and 3. In addition, biplots for PC1 and PC2 with the examined samples belonging to the analyzed 5 different groups of beverages are given (Figure 1), where PCs were the combinations of different numbers of variables (the same as given in Table 6).
Table 6.
The principal component analysis (PCA) giving eigenvalues and explaining variances for the two first principal components (PC1 and PC2).
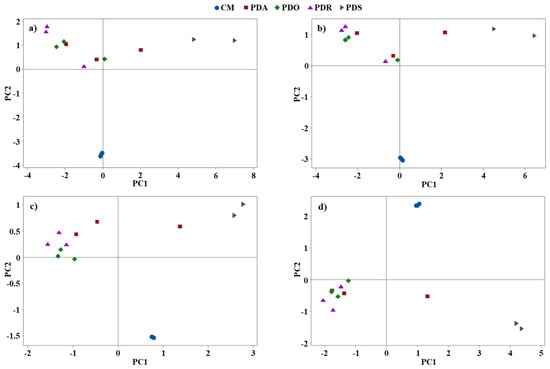
Figure 1.
Biplots for the two first principal components (PC1 and PC2) showing beverage samples grouped into cow milk (CM) and almond (PDA), oat (PDO), rice (PDR), and soy (PDS) plant-type drinks. A different number of variables was used to establish the PC1 and the PC2: (a) 17 (mean concentrations of Al, As, B, Ba, Ca, Cr, Cu, Fe, K, Mg, Mn, Na, Ni, P, Se, Sr, and Zn), (b) 14 (mean concentrations of Al, B, Ba, Ca, Cr, Cu, Fe, K, Mg, Mn, Na, P, Sr, and Zn), (c) 7 (mean concentrations of B, Cu, K, Mg, Na, P, and Zn), and (d) 3 (mean concentrations of B, Mg, and P).
It was established that using only the mean concentrations of those elements that were responsible (according to Welch’s ANOVA and Fisher’s LSD test) for the largest number of pairs of differences between the compared groups of dairy and non-dairy beverages resulted in increasing the variance of data that was explained by the PCA carried out. Irrespective of the number of variables applied, CMs formed a coherent cluster that considering the PC1 and PC2 scores, was standing out from the other samples of beverages. In the case of PDSs, although this group of drinks was represented only by 2 samples, it was also evident that it differed from the other analyzed products, forming a cluster that was becoming more consistent when only 7 (B, Cu, K, Mg, Na, P. and Zn) and 3 (B, Mg, and P) variables were left. According to Welch’s ANOVA and Fisher’s LSD test, these variables provided the highest number of pairs of differences between the examined groups of beverages.
In conclusion, although the overall number of analyzed samples was small, the ANOVA and the PCA indicated that it is possible to differentiate CMs and PDs (more and more popular) by using the multivariate data analysis and the mean concentrations of the selected elements as variables.
3.3. Bio-Accessibility of Elements from Plant Drinks and Cow Milks
In the next step, the bio-accessibility of elements from the examined CMs and PDs was evaluated by the in vitro GID procedure. Considering the Ct values (Table 3, Section 3.2), the bio-accessibility study was limited to 12 elements (Al, B, Ba, Ca, Cr, Cu, Fe, Mg, Mn, P, Sr, and Zn), i.e., those that could be determined in all analyzed products. Since Na and K are vastly present in the reagents used in the in vitro GID procedure, these elements were also not considered in the study. The obtained results (CD as mean values (n = 3) ± SDs and %B in the brackets) are collected in Table 7.
Table 7.
Total elements contents in a dialyzable fraction of analyzed cow milk and plant drink samples (mean values (n = 3), along with their SDs) and percentage contributions of the bio-accessible fraction of the elements in the brackets.
To confirm the accuracy (precision and trueness) of the results, a mass balance was carried out for the chosen cow milk and plant drink samples (detailed in Section 2.7). Satisfactorily, the quantitative recoveries were obtained, i.e., at the levels of 93.8–118%. The precision of measurements was satisfactory too; the %RSD values varied from 0.10% to 4.9%. Only for Al (PDO1, PDR1, PDR3) and Ba (PDO1, PDR2, CM1), the precision was worse (8.3–16%) due to the very low concentrations of these elements in the dialyzable fraction. All this showed the reliability of the in vitro GID procedure combined with the ICP OES analysis of the resulting sample solutions.
The %B of the studied elements in CMs was between 8.37–98.2%. The highest bio-accessibility (97.5% on average) was obtained for Cu. The lower bio-accessibility, varying between 35.7% and 77.6%, was established for B, Ba, Ca, Cr, Mg, Mn, P, and Sr. Their mean %B were 60.8% (B), 64.9% (Ba), 58.6% (Ca), 53.8% (Cr), 49.4% (Mg), 65.8% (Mn), 38.7% (P), and 51.5% (Sr). Conversely, Al, Fe, and Zn were in the group of elements characterized by the lowest bio-accessibility (19.0–38.7%); their %B was between 16.8–33.3% (Al), 23.6–29.9% (Fe), and 8.37–29.2% (Zn). Interestingly, in contrast to the Ct, the bio-accessibility of all elements in CMs increased with the increasing milk fat content. This was particularly evident for Al, Ba, Mn, and Zn. Accordingly, their bio-accessibility increased 1.4–3.5 times. For the remaining elements, the changes were relatively lower, i.e., an increase within 10–30% was observed. The lower bio-accessibility of Zn, as compared to those of Ca, Mg, and P, was also observed by Sanches et al. [13]. In contrast, except for Zn, the results obtained in the cited work were higher than those obtained in this study.
In the case of PMs, the %B of elements spanned the ranges of 0.89–82.3% (with an average of 2.15–69.2%) for PDAs, 1.06–90.0% (with an average of 15.0–70.9%) for PDOs, 1.91–98.7% (with an average of 9.0–90.8%) for PDRs, and 1.26–72.3% (with an average of 2.79–49.4%) for PDSs. The group of elements with the highest bio-accessibility included B, Ba, Ca, Cu, Mg, and Sr (PDAs); B, Ba, Ca, Cr, Cu, Mg, Mn, and Sr (PMOs); B, Ba, Ca, Cr, Cu, Mg, Mn, and Sr (PDRs); and B, Ba, Ca, Cu, and Mg (PDSs); the mean %B was between 45.4–69.2% (PDAs), 50.2–70.9% (PDOs), 44.2–90.8% (PDRs), and 39.8–57.4% (PDSs). In the group with the lower bio-accessibility were Al, Cr, Mn, P, and Zn (14.1–29.0% on average); Al, Fe, P, and Zn (15.0–31.4% on average); Fe, P, and Zn (19.8–25.6% on average); and Cr, Mn, and Zn (17.2–31.4% on average) in PDAs, PDOs, and PDSs, respectively. Finally, Fe (PDAs, PDSs), Al (PDAs, PDRs, PDSs), and P (PDSs) were characterized by the lowest bio-accessibility (<10%), i.e., 2.15–9.34% on average. Considering the mean %B of the elements, PDs can be ranked in the following order: PDR ≥ PDO > PDA > PDS. Surprisingly, this relation is opposite to those found previously for the Ct. This indicated that despite the higher content of the investigated elements in PDSs (see Section 3.2.1), they were less bio-accessible compared to the bio-accessibility of elements from PDRs or PDOs. The differences were the most significant (1.5–9.2 times) in the case of Cr, Cu, Fe, Mg, Mn, and P. Few exceptions were noted, i.e., for B, Ba, Ca, Sr, and Zn. The bio-accessibility of these elements was quite similar between different PD types; the differences did not exceed 20%. The bio-accessibility of Ca, Mg, P, and Zn from PDSs was already investigated by Sanches et al. [13] and the %B of these elements varied between 67–75%, 75–79%, 22–26%, and 18–24% for these elements, respectively, being higher than the results obtained in this study.
Contrary to CMs, the bio-accessibility of several elements in PDAs and PDOs decreased as the fat content of the drink increased. Such a relation was characteristic for Ba, Ca, Cr, Cu, Fe, Mg, Mn, and Sr (PDAs), as well as Ba, Ca, Cr, Cu, Fe, Mg, P, Sr, Sr, and Zn (PDOs). In the case of B (PDAs), B and Mn (PDOs), or Al, B, Ba, Ca, and Mg (PDRs), the same relation as CMs could be noticed. Finally, there was no correlation found between the bio-accessibility of elements and the PD fat content for Al, P, and Zn (PDAs), Al (PDOs), as well as Cr, Cu, Fe, Mn, P, Sr, and Zn (PDRs). Interestingly, in the case of PDSs (both with the same fat content), the results varied. The higher bio-accessibility of elements in PDS1 may be due to the use of organic soy in its production.
Comparing the bio-accessibility of elements depending on the beverage origin, the results for B, Ba, Ca, Sr, and Zn from PDs were comparable to those from CMs. For the rest of the elements, similarities between CMs and PDs were noted for Al (PDAs, PDOs), Cr (PDOs, PDRs), Cu (PDRs), Fe (PDRs), Mg (PDSs), Mn (PDOs), and P (PDOs, PDRs).
3.4. The Nutritional Value of Plant Drinks versus Cow Milks
Based on the bio-accessibility of the studied elements, the nutritional value of the analyzed PDs and CMs involved with the drinking of 1 L of these products was estimated (as detailed in Section 2.8). The results are collected in Table 8.
Table 8.
Coverage of recommended dietary allowances (%RDAs) for essential elements involved with the drinking of 1 L of the analyzed dairy (CMs) and non-dairy (PDs) beverages per day.
As shown in this table, 1 L of different PDs can cover the daily requirements for Ca, Cu, Fe, Mg, Mn, P, and Zn in 0.10–29% for PDAs, 0.31–20% for PDOs, 0.14–6.3% for PDRs, and 0.69–67% for PDSs on average. The contribution of each PD to the realization of their RDIs can be arranged as Cu > Mn > Mg > P > Ca > Zn > Fe. Based on these results, PDs can be ranked in descending order as follows: PDS > PDA > PDO > PDR. This means that PDSs are the best source of the aforementioned elements in their bio-accessible form. However, it is not surprising, considering the Ct, which was the highest in this type of PD. Given this, the consumption of 1 L of PDSs per day can affect the daily realization of Cu, Mn, and Mg at 23–67% (M) and 30–67% (F). The realization of the RDAs of the rest elements (Ca, P, and Zn) was lower, i.e., at 7.0–9.2% (M) and 7.0–13% (F). The poorest realization of the RDAs was established for Fe, i.e., just at 0.69% (M) and 1.6% (F). Unfortunately, apart from Cu, the rest of the examined PDs are rather poor sources of the essential elements.
In the case of CMs, the %RDAs of Ca, Cu, Fe, Mg, Mn, P, and Zn ranged between 0.28 and 68% on average and changed as follows: Ca > P > Mg > Zn > Cu > Mn > Fe. As can be seen, this relation was quite different from that found previously for PMs. Drinking 1 L of CMs seems to affect the contribution to the RDAs of Ca and P, i.e., at 51–68% (M, F). For Cu, Mg, and Zn, their RDAs were covered to a lesser extent, i.e., in 5.7–19% (M) and 5.6–15% (F). The lowest %RDAs, i.e., below 1%, were established for Fe and Mn. It can be said that CMs are a much better source of Ca and P in their bio-accessible form than PMs. The differences between the %RDAs of Ca and P were from 6.2-fold to even 2 orders of magnitude. It should be noted that PDs can cover the RDA of Ca similarly to this by CMs if they are artificially supplemented with CaCO3 (see results for PDs of the brand 2). Oppositely, CMs are a much poorer source of Cu and Mn in their bio-accessible form compared to PDs. The differences varied from 3.5 to 48 times. Interestingly and importantly, except for Ca and P, PDSs are a better source of other essential elements than CMs. Accordingly, the %RDAs of Cu, Fe, Mg, Mn, and Zn for these PMs were 12 (Cu), 2.5 (Fe), 48 (Cu), 1.5 (Mg), 48 (Mn), and 1.6 (Zn) times higher than those established for CMs. It can be concluded that PMSs can undoubtedly be considered a valuable food product for supplementing the diet with these elements.
Finally, considering the intake of non-essential/toxic elements (Al, B, Ba) involved with the drinking of 1 L of analyzed products, their contributions for PDs were 0.010–0.25% (Al), 0.19–5.5% (B), and 0.92–8.2% (Ba). For CMs, these contributions were even lower and ranged between 0.092–0.16% (Al), 0.41–0.42% (B), and 2.2–3.5% (Ba). Hence, the intake of these elements via the consumption of 1 L of PDs or CMs does not show any health risks as they do not seem to contribute significantly to the respective TUIs.
4. Conclusions
This study presents the results of the multi-element analysis of plant (almond, oat, rice, soy) drinks and animal (cow) milks that assess both the total content of elements and their bio-accessible form to reliably judge the nutritious value and potential harm to human health associated with the consumption of such beverages.
Satisfactorily, all cow milk/plant drink samples examined here were free from toxic elements such as Cd, Pb, and Sb. It was observed that the mineral composition of plant products varies depending on their type and brand (even if they were prepared on the same plant base). Based on the mean concentrations of the studied elements, it can be concluded that PDSs have significantly higher levels of most of them compared to other plant-based beverages. The exceptions were Ca, Na, and Sr, which were the highest in the almond drink. Out of all PDs analyzed, PDOs and PDRs contained the least amount of nutrients. Moreover, PDRs were the only ones that contained toxic As. Without a doubt, CMs appeared to be the best source of macro elements such as Ca, P, and Se. Unfortunately, to obtain a similar Ca content in PDs, it is necessary to add CaCO3 at the stage of their production. In contrast, the comparison of CMs with PDs shows that PDSs stand out from CMs with significantly higher (25–98 times) concentrations of several important micro elements, including Cu, Fe, and Mn. Additionally, some elements (Cu, K, Na, P, and Zn) make it possible to differentiate dairy and non-dairy products according to their type, as well as to distinguish PDs from CMs, as shown here by using multivariate data analysis and the mean contents of elements as variables.
Regarding the bio-accessibility study, 1 L of CM per day contributes highly to the RDAs of Ca and P (51–68% on average) and moderately to the RDAs of Cu, Mg, and Zn (5.6–17% on average). Its consumption covers a small percentage (<1%) of Mn and Fe. Interestingly, the bio-accessibility of elements increased with the increasing milk fat content. Therefore, when selecting CMs, it is recommended to opt for whole-fat milk. In the case of plant drinks, although PDRs and PDOs are characterized by the greater bio-accessibility of elements, PDSs can supply human organisms with higher amounts of the elements in their bio-accessible form. It contributes highly to the RDAs of Cu, Mn, and Mg (26–67% on average) and, to some extent, to the RDAs of Ca, P, and Zn (7.0–12% on average). Accordingly, despite several nutritional limitations in PD alternatives (in the case of Ca), PDSs may be a very good alternative to CMs to supplement the human diet with Mg, Cu, Mn, or Zn. Similarly to CMs, this milk is also not an important source of Fe (RDAFe~1.1%). Finally, taking into account the potentially toxic elements, all the examined products are safe; their consumption covers a small percentage (0.010–8.2%) of bio-accessible forms of Al, B, and Ba.
Supplementary Materials
The following supporting information can be downloaded at: https://www.mdpi.com/article/10.3390/pr12010231/s1, Table S1: Operating conditions for the ICP OES determination of studied elements by using the PN (Al, B, Ba, Ca, Cd, Cr, Cu, Fe, Mg, Mn, Ni, P, Pb, and Zn) and HG (As, Sb, and Se) systems.
Author Contributions
Conceptualization, M.W. and A.S.-M.; methodology, M.W., A.S.-M. and A.L.; investigation, M.W., A.S.-M. and A.L.; statistical analysis, P.P.; writing—original draft preparation, M.W.; writing—review and editing, P.P.; supervision, P.P.; funding acquisition, M.W. All authors have read and agreed to the published version of the manuscript.
Funding
This work was financed by a statutory activity subsidy obtained by the Faculty of Chemistry, Wroclaw University of Technology from the Polish Ministry of Science and Higher Education.
Data Availability Statement
All the results are included and presented in the work.
Conflicts of Interest
The authors declare no conflict of interest.
References
- Sarode, A.R.; Kalyankar, S.D.; Deosarkar, S.S.; Khedkar, C.D.; Pawshe, R.D. Milk: Role in the Diet. Reference Module in Food Science. In Encyclopedia of Food and Health; Caballero, B., Finglas, P.M., Toldrá, F., Eds.; Academic Press: Oxford, UK, 2016; pp. 736–740. [Google Scholar]
- Chalupa-Krebzdak, S.; Long, C.h.J.; Bohrer, B.M. Nutrient density and nutritional value of milk and plant-based milk alternatives. Int. Dairy J. 2018, 87, 84–92. [Google Scholar] [CrossRef]
- Greenwood, S.L.; Honan, M.C. Symposium review: Characterization of the bovine milk protein using proteomic techniques. J. Dairy Sci. 2019, 102, 2796–2806. [Google Scholar] [CrossRef] [PubMed]
- Haug, A.; Hřstmark, A.T.; Harstad, O.M. Bovine milk in human nutrition a review. Lipids Health Dis. 2007, 6, 25. [Google Scholar] [CrossRef] [PubMed]
- Vanga, S.K.; Raghavan, V. How well do plant based alternatives fare nutritionally compared to cow’s milk? J. Food Sci. Technol. 2018, 55, 10–20. [Google Scholar] [CrossRef] [PubMed]
- Pereira, P.C. Milk nutritional composition and its role in human health. Nutrition 2014, 30, 619–627. [Google Scholar] [CrossRef] [PubMed]
- Manousi, N.; Zachariadis, G.A. A simple and rapid analytical method for the determination of nutrient and toxic elements in nut-based milk alternative beverages by ICP-OES. Food Anal. Meth. 2021, 14, 1315–1321. [Google Scholar] [CrossRef]
- Munkekata, P.E.S.; Dominguez, R.; Budaraju, S.; Rosello-Soto, E.; Barba, F.J.; Mallikarjunan, K.; Roohinejad, S.; Lorenzo, J.M. Effect of innovative food processing technologies on the physicochemical and nutritional properties and quality of non-dairy plant-based beverages. Foods 2020, 9, 258. [Google Scholar] [CrossRef]
- Penha, C.B.; De Paola Santos, V.; Speranza, P.; Kurozawa, L.E. Plant-based beverages: Ecofriendly technologies in the production process. Innov. Food Sci. Emerg. Technol. 2021, 72, 102760. [Google Scholar] [CrossRef]
- Market Insights on European Plant-Based Sales 2020–2022. Good Food Institute Europe. Copyright© 2024, Nielsen Consumer, LLC. Available online: https://gfieurope.org/market-insights-on-european-plant-based-sales-2020-2022/#About-the-data (accessed on 8 January 2024).
- Poland Plant-Based Food Retail Market Insights. Good Food Institute Europe. Copyright© 2024, Nielsen Consumer, LLC. Available online: https://gfieurope.org/wp-content/uploads/2023/04/2020-2022-Poland-retail-market-insights_updated.pdf (accessed on 8 January 2024).
- Astolfi, M.L.; Marconi, E.; Protano, C.; Canepari, S. Comparative elemental analysis of dairy milk and plant-based milk alternatives. Food Control 2020, 116, 107327. [Google Scholar] [CrossRef]
- Sanches, V.L.; Peixoto, R.R.A.; Cadore, S. Phosphorus and zinc are less bioaccessible in soy-based beverages in comparison to bovine milk. J. Funct. Foods 2020, 65, 103728. [Google Scholar] [CrossRef]
- Marques, M.; Correig, E.; Capdevila, E.; Gargallo, E.; Gonzales, N.; Nadal, M.; Domingo, J.L. Essential and Non-essential Trace Elements in Milks and Plant-Based Drinks. Biol. Trace Elem. Res. 2022, 200, 4524–4533. [Google Scholar] [CrossRef] [PubMed]
- Karasakal, A. Determination of trace and major elements in vegan milk and oils by ICP-OES after microwave digestion. Biol. Trace Elem. Res. 2020, 197, 683–693. [Google Scholar] [CrossRef] [PubMed]
- Khan, N.; Jeong, I.S.; Hwang, I.M.; Kim, J.S.; Choi, S.H.; Nho, E.Y.; Choi, J.Y.; Park, K.S.; Kim, K.S. Analysis of minor and trace elements in milk and yogurts by inductively coupled plasma-mass spectrometry (ICP-MS). Food Chem. 2014, 147, 220–224. [Google Scholar] [CrossRef]
- Licata, P.; Trombetta, D.; Cristani, M.; Giofre, F.; Martino, D.; Calo, M.; Naccari, F. Levels of “toxic” and “essential” metals in samples of bovine milk from various dairy farms in Calabria, Italy. Environ. Int. 2004, 30, 1–6. [Google Scholar] [CrossRef] [PubMed]
- D’llio, S.; Petrucci, F.; D’Amato, M.; Di Gregorio, M.; Senofonte, O.; Violante, N. Method validation for determination of arsenic, cadmium, chromium and lead in milk by means of dynamic reaction cell inductively coupled plasma mass spectrometry. Anal. Chim. Acta 2008, 624, 59–67. [Google Scholar] [CrossRef] [PubMed]
- Szymczycha-Madeja, A.; Welna, M.; Pohl, P. Method validation for multi-elemental analysis of dialyzable and non-dialyzable fraction of coffee brews by F AAS and ICP OES: A bioaccessibility study. Food Anal. Meth. 2019, 12, 198–216. [Google Scholar] [CrossRef]
- Wełna, M.; Lasowska, J.; Żyrnicki, W. Determination of some inorganic species of Fe, Mn and Cr by chemical vapor generation hyphenated with inductively coupled plasma atomic emission spectrometry. J. Braz. Chem. Soc. 2011, 22, 1164–1169. [Google Scholar] [CrossRef]
- Wełna, M.; Szymczycha-Madeja, A.; Pohl, P. Critical evaluation of strategies for single and simultaneous determinations of As, Bi, Sb and Se by hydride generation inductively coupled plasma optical emission spectrometry. Talanta 2017, 167, 217–226. [Google Scholar] [CrossRef] [PubMed]
- Konieczka, P.; Namieśnik, J. Quality Assurance and Quality Control in the Analytical Chemical Laboratory: A Practical Approach, 1st ed.; CRC Press/Taylor & Francis Group: Boca Raton, FL, USA, 2009; pp. 16–22. [Google Scholar]
- Otten, J.J.; Hellwig, J.P.; Meyers, L.D. Dietary Reference Intakes: The Essential Guide to Nutrient Requirements; The National Academies Press: Washington, DC, USA, 2006. [Google Scholar]
- WHO. World Health Organization. Trace Elements in Human Nutrition and Health; WHO Library: Geneva, Switzerland, 1996. [Google Scholar]
- SCHER—Scientific Committee on Health and Environmental Risks. Assessment of the Tolerable Daily Intake of Barium; SCHER: Brussels, Belgium, 2012. [Google Scholar]
- Sun, G.-X.; Williams, P.N.; Carey, A.-M.; Zhu, Y.-G.; Deacon, C.; Raab, A.; Meharg, A.A.; Williams, P.N. Inorganic arsenic in rice bran and its products are an order of magnitude higher than in bulk grain. Environ. Sci. Technol. 2008, 42, 7542–7546. [Google Scholar] [CrossRef] [PubMed]
- Liang, F.; Zhang, G.; Tan, M.; Lin, J.; Liu, W.; Lia, Y.; Lu, W. Total and speciated arsenic levels in rice from China. Food Addit. Contam. Part A 2010, 27, 810–816. [Google Scholar] [CrossRef]
Disclaimer/Publisher’s Note: The statements, opinions and data contained in all publications are solely those of the individual author(s) and contributor(s) and not of MDPI and/or the editor(s). MDPI and/or the editor(s) disclaim responsibility for any injury to people or property resulting from any ideas, methods, instructions or products referred to in the content. |
© 2024 by the authors. Licensee MDPI, Basel, Switzerland. This article is an open access article distributed under the terms and conditions of the Creative Commons Attribution (CC BY) license (https://creativecommons.org/licenses/by/4.0/).