Article

Multi-Objective Optimization of Injection Molding Process Parameters for Moderately Thick Plane Lens Based on PSO-BPNN, OMOPSO, and TOPSIS

1
College of Mechanical and Automotive Engineering, Zhejiang University of Water Resources and Electric Power, Hangzhou 310018, China
2
State Key Laboratory of Materials Processing and Die & Mould Technology, Huazhong University of Science and Technology, Wuhan 430074, China
3
College of Mechanical and Electrical Engineering, China Jiliang University, Hangzhou 310018, China
*
Author to whom correspondence should be addressed.
Processes 2024, 12(1), 36; https://doi.org/10.3390/pr12010036
Submission received: 17 November 2023 / Revised: 18 December 2023 / Accepted: 20 December 2023 / Published: 22 December 2023
(This article belongs to the Section Materials Processes)

Abstract

:
Injection molding (IM) is an ideal technique for the low-cost mass production of moderately thick plane lenses (MTPLs). However, the optical performance of injection molded MTPL is seriously degraded by the warpage and sink marks induced during the molding process with complex historical thermal field changes. Thus, it is essential that the processing parameters utilized in the molding process are properly assigned. And the challenges are further compounded when considering the MTPL molding energy consumption. This paper presents a set of procedures for the optimization of injection molding process parameters, with warpage, sink marks reflecting the optical performance, and clamping force reflecting the molding energy consumption as the optimization objectives. First, the orthogonal experiment was carried out with the Taguchi method, and the S/N response shows that these three objectives cannot reach the optimal values simultaneously. Second, considering the experimental data scale, the back propagation neural network updated by the particle swarm optimization method (PSO-BPNN) was applied to establish the complex nonlinear mapping relationship between the process parameters and these three trade-off objectives respectively. Then, the Pareto optimal frontier of the multi-objective optimization problem was attained by multi-objective particle swarm optimization using a mutation operator and dominance coefficient algorithm (OMOPSO). And the competitive relationship between these objectives was further confirmed by the corresponding pairwise Pareto frontiers. Additionally, the TOPSIS method with equal weights was employed to achieve the best optimal solution from the Pareto optimal frontier. The simulation results yielded that the maximum values of warpage, sink marks, and clamping force could be reduced by 7.44%, 40.56%, and 5.56%, respectively, after optimization. Finally, MTPL products were successfully fabricated.

1. Introduction

Polymer optical lenses are characterized by low specific gravity, low material cost, high design freedom, high functional integration, and high molding efficiency compared to traditional glass lenses [1]. Injection molding (IM) is an efficient, low-cost, automated method of molding complex polymer products, and it is widely used in the molding of polymer lenses [2]. However, during the IM process, a premature solidification condensation layer tends to form [3], which leads to an increase in melt flow resistance, which in turn causes an uneven distribution of pressure, temperature gradient, and velocity field on the melt cross-section, inducing uneven thermal stress and molecular orientation stress inside the melt, affecting the uniformity of shrinkage of the product and the precision of forming dimensions, thus causing optical performance defects such as birefringence and optical distortion [1]. Therefore, researchers have attempted to improve the molding geometric dimensional precision and optical performance of polymer optical lenses from the aspects of material selection, mold structure design, and quality inspection techniques. This can be conducted, for example, with the use of optical resin materials with low stress, low water absorption, and good weathering properties [1,4]; the use of conformal cooling technology to design mold structures with higher cooling efficiency [5]; and the study of more effective lens quality inspection methods [6]. Moreover, researchers have paid considerable attention to more efficient but more complex and costly hybrid manufacturing processes based on IM, such as injection compression molding (ICM) [7], multi-layer injection molding [8], rapid heating cycle molding (RHCM) [9], ICM combined with RHCM molding [10], multi-layer counter-pressure injection molding [7], gas assisted injection molding (GAS IM) [11], etc.
However, a few researchers have still pointed out that, under the conditions of raw materials, for a specified product structure and injection molding tooling structure, the molding quality of the polymer optical lenses is mainly determined by the injection molding process parameters [3,12,13], i.e., through setting reasonable injection molding process parameters, the IM process can still obtain high-quality, high-precision optical lenses. In addition, considering that IM requires less equipment investment than other complex hybrid manufacturing processes for lenses, IM is still a highly competitive molding process for polymer optical lens production. Furthermore, due to the increase in the performance requirements of optical lenses, optical lenses are mostly made of high-performance polymers with high melting temperature and high viscosity properties, and at the same time, as the polymer undergoes a complex thermomechanical history (rapid changes in temperature, velocity, pressure, and other conditions) during the IM forming process, this inevitably makes it very difficult to optimize the setting of the multivariable, nonlinearly related molding process parameters embodied in injection molding [14,15], which ultimately leads to a very complex realization of the polymer optical lenses with high molding quality.
Optical lenses require precise control of their molding accuracy to ensure their optical properties. The molding dimensional accuracy and surface quality of the polymer optical lenses are key research issues in the field of polymer lens injection molding. Bensingh et al. [16] considered the surface radius curvature, the surface profile undulation, and the surface roughness of the spherical lens as optimization objectives, based on Taguchi CAE mold flow experiments, and used artificial neural network (ANN) and particle swarm optimization (PSO) techniques to obtain optimal injection molding process parameters for double spherical lenses. They [17] also used the DOE procedure and FEM analysis to optimize the volume shrinkage of a large-diameter aspheric lens to overcome the internal voids or local surface depression defects that the convex structural characteristics of the bi-spherical lenses tend to cause by high shrinkage after injection molding. Liu et al. [18] selected the lens haze ratio and the surface ripple peak-to-valley ratio as optimization objectives and established the nonlinear mapping between the key process parameters and the objectives by using the back propagation neural network method (BPNN) and the multi-output support vector machine for regression algorithms (M-SVR). Subsequently, they adopted the non-dominated ranking genetic algorithm (NSGA-II) method to obtain the Pareto frontier of objectives, and the reliability of the proposed optimization method was experimentally verified. Yin et al. [19] considered birefringence and warpage as optimization objectives, investigated the key factors and the formation mechanisms of the birefringence and warpage phenomena, and obtained the ideal combination of process parameters for the microinjection molding of lenses using a desirability functions approach. Tsai et al. [20] selected the lens shape accuracy as the optimization objective and used the Taguchi experiment and ANOVA analysis to obtain the significant factors. They obtained the optimal molding process parameters through further optimization by ANN combined with the genetic algorithm (GA), and finally the reliability of the proposed strategy was experimentally verified. Chao et al. [21] showed that lens optical quality depends largely on the processing parameters used in the injection molding process. They took the warpage and birefringence of symmetric biconvex Fresnel lenses as the optimization objectives, and based on the Taguchi method, they established the gray correlation for each experiment using the gray correlation analysis technique to figure out the optimal molding process parameters to achieve the two trade-off objectives. Wang et al. [22] took the dimension of the backlight panel axis as the optimization target to solve the difficult injection molding problem of the ultrathin backlight panel of LCD modules. They applied the gray relational sorting method to obtain the main control process parameters, and then a fuzzy neural network approximation model between process parameters and objectives was established based on orthogonal experiments. Finally, the optimal molding process parameters were determined using a multi-objective genetic algorithm. Kuo et al. [23] took the molded V-shape microstructure depth and angle on the light guide plate and the residual stress of the light guide plate as the optimization objectives; they identified the important parameters with far-reaching effects on the objectives with the Taguchi experiment, ANOVA, and main effects analysis; and then they obtained the optimal molding process parameters by using the inter-comparison technique in data envelopment analysis. Spina et al. [24] acquired the injection molding parameters’ optimization with the Taguchi method and gray correlation analysis based on the accurate simulation of lens filling and shrinkage behavior, and the needed geometric profile precision of the biconvex spherical lens was realized. Lan et al. [25] indicated that the shape accuracy of the aspheric plastic lens was affected by both the parameters of the injection molding process and the dimensions of the mold core. They proposed a stepwise optimization method to optimize the parameters of the injection molding process, and lens shape accuracy errors caused by material shrinkage and processing errors were reduced by establishing a processing compensation model for the mold core axial deformation.
Moderately thick plane lenses are widely used as an important optical component in high-precision coordinate measuring systems, traffic lighting systems, safety protection systems, and various other optical systems. They are increasingly popular because they overcome the defects of traditional glass lenses with a heavy weight and low safety, showing good potential for development. Nevertheless, the injection molding of thick-walled parts is prone to quality defects such as warpage and sink marks [17,26]. From the previous literature analysis, it is known that the surface shape accuracy of optical lenses is an important indicator to measure whether they can be used for imaging optics. So far, there are relatively few studies related to achieving MTPL molding accuracy easily and quickly by optimizing the parameters of the nonlinearly coupled injection molding process.
In addition, the setting of the clamping force plays an important role in the quality and productivity of injection-molded products [27]. Insufficient clamping force cannot guarantee the molding quality of the products, and the products produced have defects such as short shot, sink marks, etc., but a small clamping force can save energy consumption and have higher productivity. At the same time, a too high clamping force will not only lead to flying edges, product burn, poor exhaust, product weight, and other molding defects, but also long-term excessive clamping force will lead to unpredictable permanent damage to the mold and injection equipment [28]. Therefore, determining the proper clamping force for injection molding is also a critical issue. However, few studies have been reported in the lens injection molding process that consider the effect of clamping force on the lens quality and the production energy consumption.
To meet the image quality of MTPL with guaranteed energy consumption, this paper selects the warpage, sink marks of MTPL, and the clamping force used in molding as the optimization objectives, and it takes the injection molding process parameters of mold temperature, melt temperature, injection time, holding pressure, and holding time as the design variables. The multi-objective problem is solved by using an optimization method integrated with the Taguchi orthogonal experiment, the back propagation neural network improved by particle swarm optimization (PSO-BPNN), the multi-objective particle swarm optimization using a mutation operator and dominance coefficient method (OMOPSO), and the TOPSIS method. Finally, the rationality of the optimization results is verified through experiments. This paper provides a theoretical basis for obtaining high-quality polymer lenses.

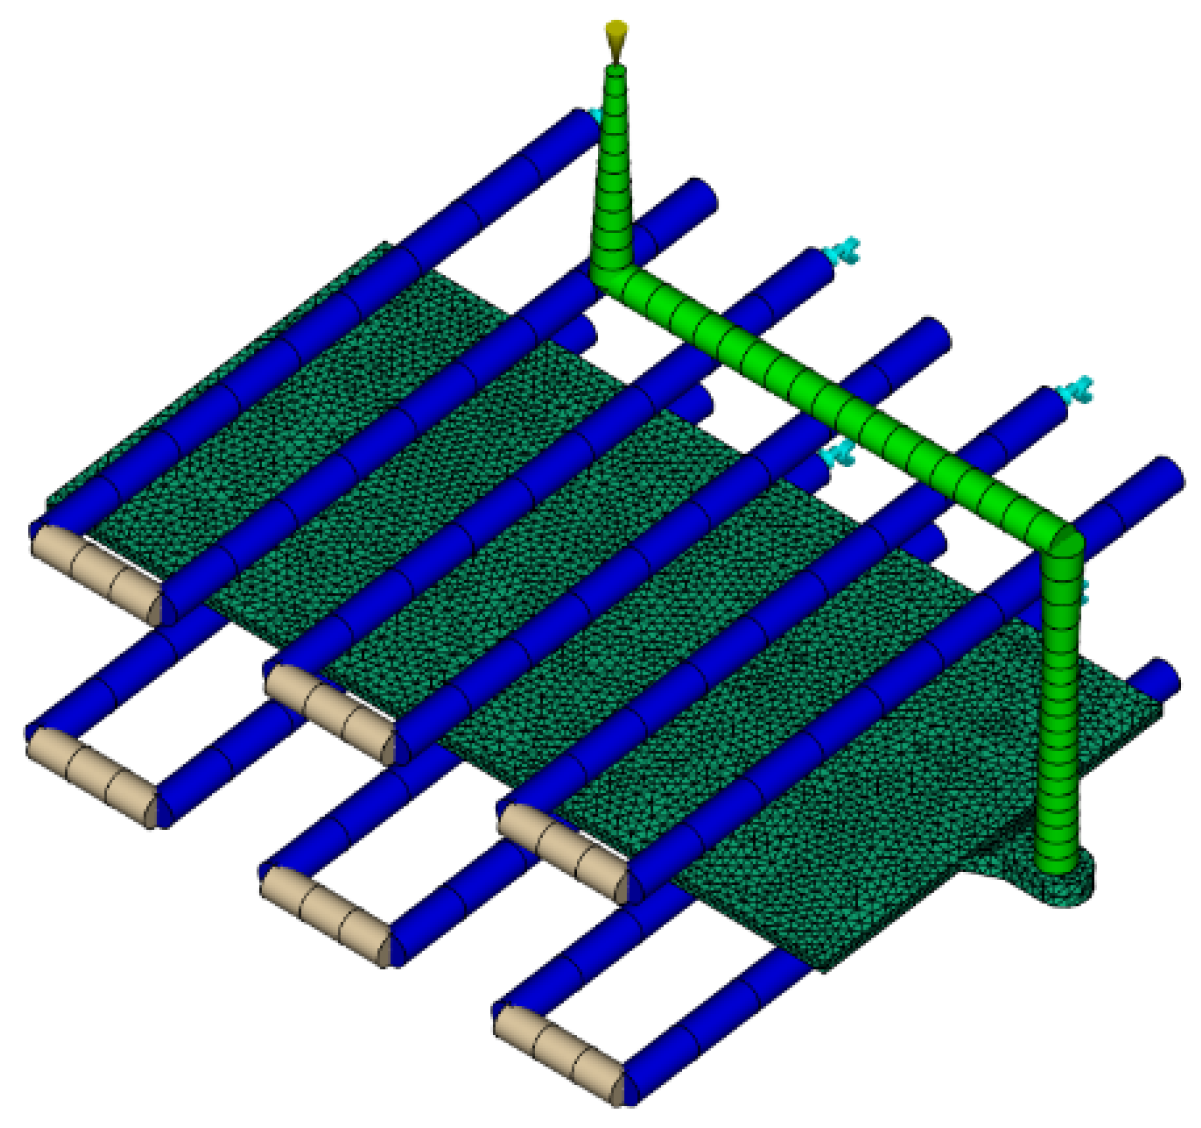
2. MTPL and Molding Mold Structure

The three dimensions of MTPL used for injection molding in this study are 200 mm × 100 mm × 3.5 mm with a plane style. An optical-grade amorphous PC (Makrolon LQ2647, Leverkusen, Germany) is selected as the MTPL material for this study. This PC has a transparency of 89% and a refractive index of 1.586. The polymer pellets are baked in an oven for 4 h prior to injection molding to remove moisture in the material. The structure of the MTPL molding mold is shown in Figure 1, and the fan gate and ejector block were used to reduce the deformation of the molded MTPL. A Haitian 1600 injection molding machine (Ningbo, China) is utilized.

3. Multi-Objective Optimization Methodology of TPM Injection Molding Parameters

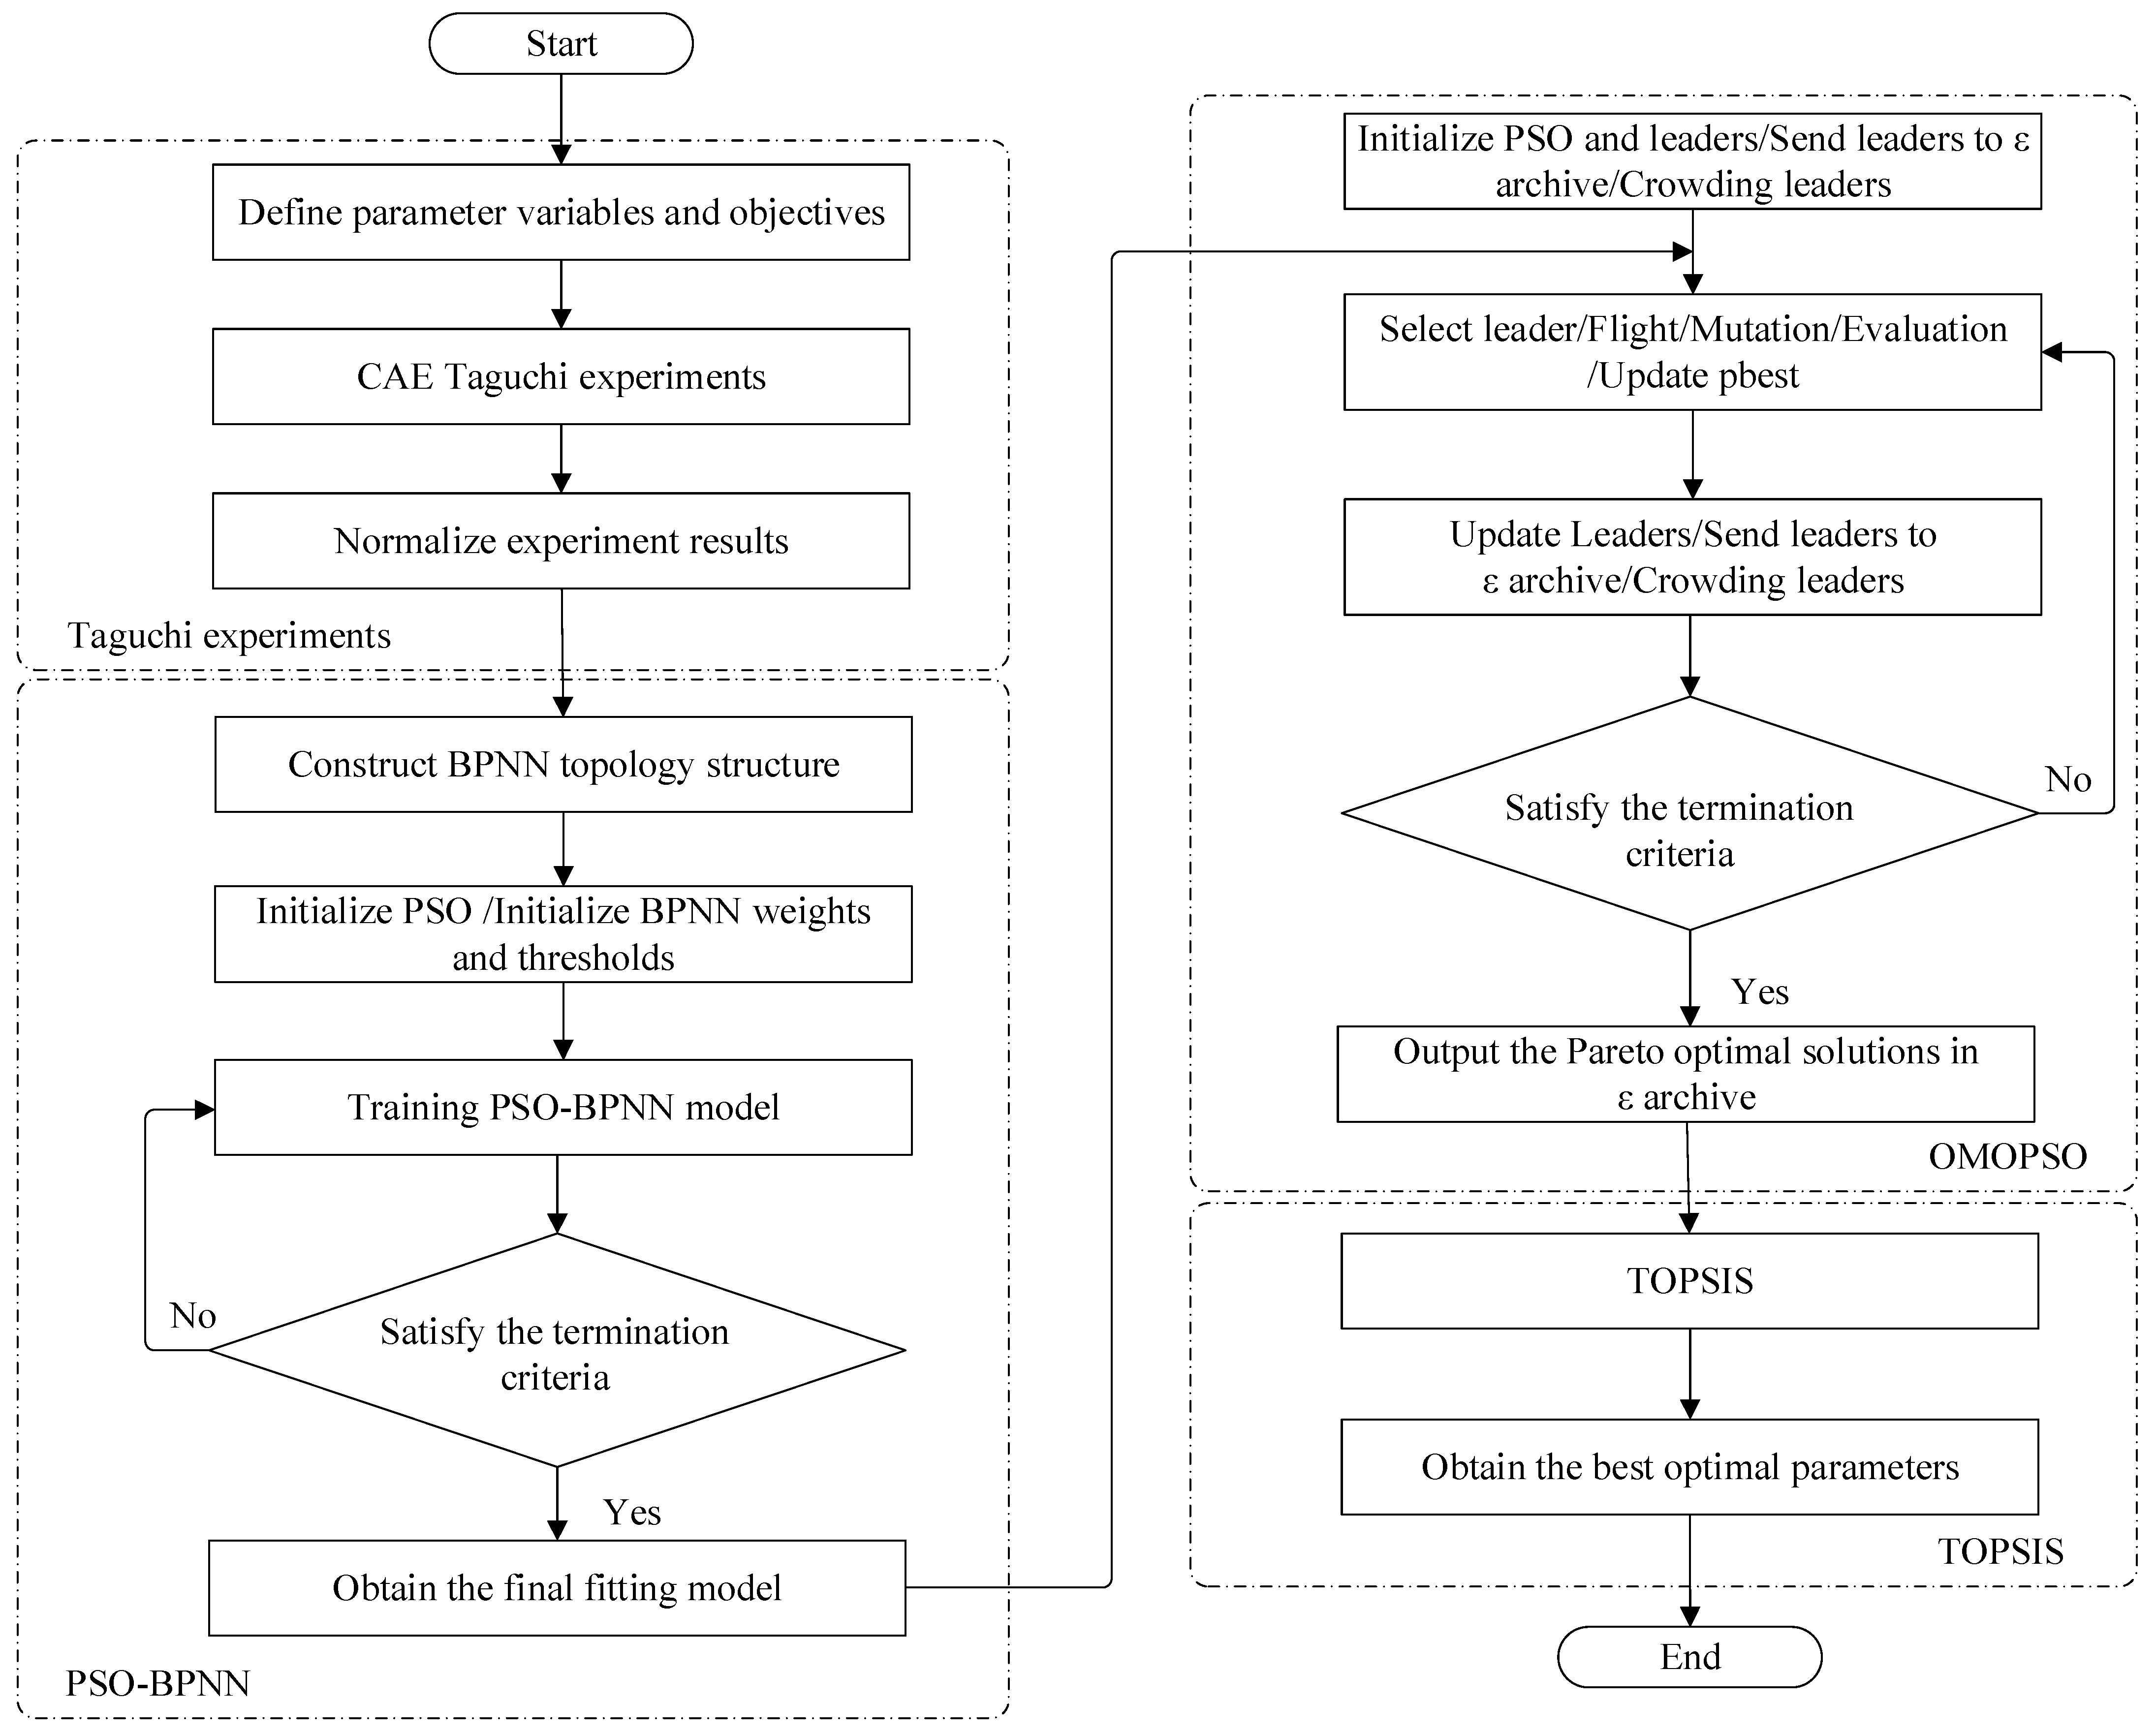
3.1. Flowchart of the Optimization Process

This study aims to optimize the injection molding process parameters of MTPL. All algorithms were implemented using Python 3.11 software. Figure 2 presents the flowchart of the proposed optimization method, and the optimization method is schematically described below:
Step I: Taguchi CAE mold flow analysis experiments are tested and normalized for the selected objectives to generate the initial sample points.
Step II: Construct the complex nonlinear PSO-BPNN prediction models from the initial sample points for the selected objectives.
Step III: Output Pareto optimal frontier solution set with the OMOPSO method using a mutation operator and ϵ-dominance coefficient based on the constructed PSO-BPNN prediction models.
Step IV: Obtain the best optimal injection molding process parameters of MTPL by the multi-attribute decision making method (TOPSIS).

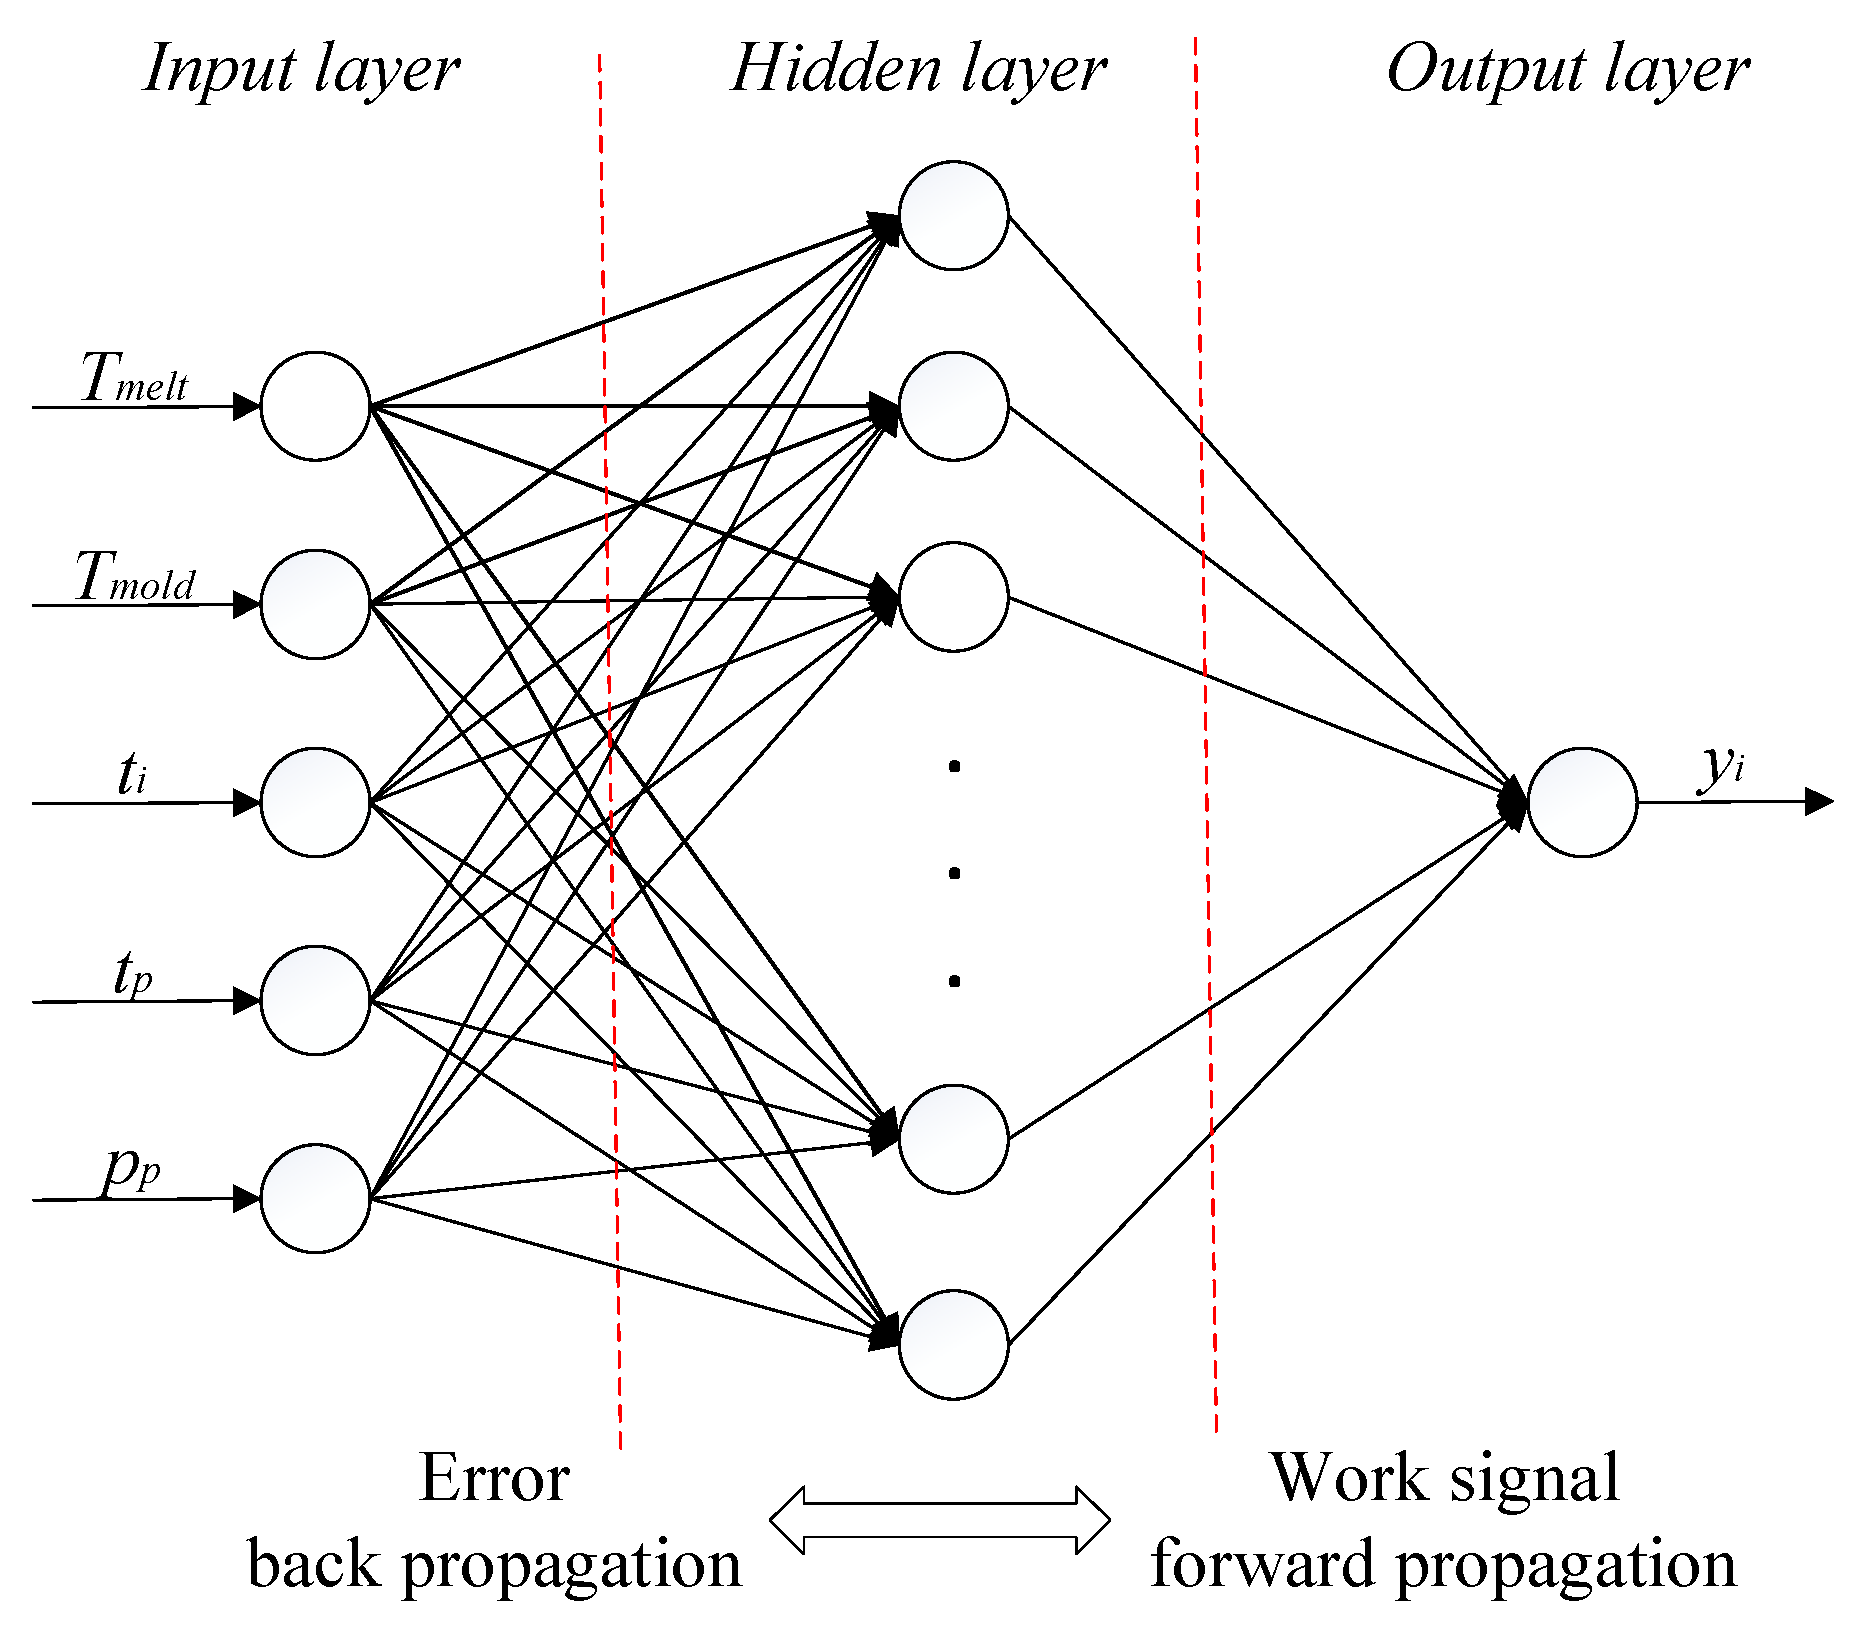
3.2. Building the Prediction Model with PSO-BPNN

BPNN is a kind of multilayer feedforward neural network, which can approach the desired output gradually by realizing signal forward propagation and error back propagation and adjusting network weights and thresholds continuously. However, due to the randomness of initial weights and thresholds, BPNN is prone to slow convergence speeds and easily falls into the local minimum with poor prediction stability [29]. A good weight and threshold initialization setting can make the gradient descent algorithm work better, greatly improving the convergence speed and prediction accuracy of the BPNN model [30]. The PSO-BPNN method is adopted as an objective prediction model, as it has outstanding advantages to characterize the nonlinear relationship [31], and the PSO algorithm is utilized to optimize the initial weights and thresholds of the neural network quickly and accurately.
The accuracy of the PSO-BPNN prediction model determines the correctness of the subsequent optimization results. The prediction accuracy of the constructed prediction model is monitored by the loss variation between the experimental simulation values and the predicted values through evaluating the root mean squared error (RMSE), the coefficient of determination ( R 2 ), and the mean absolute percentage error (MPAE). These evaluation criteria can be formulated as follows:
RMSE j = 1 n i = 1 n y ^ i j y i j 2 j = 1 , 2 , m  
R j 2 = 1 i n y ^ i j y i j i n y i j y ¯ i j j = 1 , 2 , m  
MAPE j = 1 n i n y ^ i j y i j y ^ i j j = 1 , 2 , m  
where RMSE j , R j 2 , and MAPE j   represent the RMSE, R 2 , and MAPE of the j-th objective, respectively; m denotes the number of the objectives; n denotes the number of the samples for verification; y i j and y ^ i j denote the j-th objective response result of the i-th sample predicted by the prediction model and calculated by the simulation experiment, respectively; and y ¯ i j denotes the average simulated value of j-th samples.

3.3. Locating Multi-Objective Pareto-Optimal Solutions with OMOSPSO

The OMOPSO algorithm, which is an improved MOPSO algorithm, will be used in this paper to solve the multi-objective optimization problem. The MOPSO algorithm is a heuristic optimization algorithm proposed by Carlos A. Coello et al. in 2004 [32]. It is a multi-objective optimization algorithm improved by introducing the Pareto ranking scheme on the basis of the particle swarm optimization algorithm (PSO). Compared to MOPSO, the OMOPSO algorithm allows the algorithm to fully explore the decision space and adjust the size of the final Pareto frontier by introducing mutation operators and ϵ- dominance coefficient. The OMOPSO algorithm has better performance than the MOPSO algorithm [33].

3.4. Decision Making with the TOPSIS Method

TOPSIS is a multi-attribute decision-making method that calculates the comprehensive evaluation score of each solution by weighting the relative distance between the positive and negative ideal solutions of each objective performance. The advantage of TOPSIS is that it can consider positive and negative ideal solutions situations simultaneously, and it will not cause the evaluation bias which is easily caused by only considering positive or negative ideal solutions. TOPSIS is suitable for performing multi-objective simultaneous optimization of MTPL molding. The analysis steps are shown as follows:
Step I: Based on the objective and the criteria, a problem matrix is formed and expressed in the form of a matrix format as shown below:
x 11 x 12 x 13 x 1 n S 1 x 21 x 22 x 23 x 2 n S 2 x 31 x 32 x 33 x 3 n S 3 x m 1 x m 2 x m 3 x m n S m
where S 1 , S 2 , S 3     S m are the possible alternatives among which decision makers have to choose the best one.
Step II: Determine a normalized matrix and the following equation is used to normalize the output values:
T i j = x i j i = 1 m x i j 2 1     i     m ,   1     j     n
where x i j represents the actual value of the i-th FEM experimental result for the j-th process response, and T i j represents the corresponding normalized value.
Step III: The weight ω j of the j-th response is decided.
Step IV: The weighted normalized decision matrix is calculated by multiplying the normalized matrix by its related weights through the following equation:
r i j = ω j × T i j 1     i   m ,   1     j     n
Step V: The positive ideal solution ( Q + ) is the best possible value and the negative ideal solution ( Q ) is the worst possible value of every attribute from the weighted decision matrix and are determined as follows:
Q + = r 1 + ,   r 2 + ,   r 3 +       r n +
Q = r 1 ,   r 2 ,   r 3       r n
Step VI: The distance of each solution from the positive ideal solution ( S i + ) and the negative ideal solution ( S i ) is calculated by the following equations:
S i + = j = 1 n r i j r j + 2 1     i     m ,   1     j     n
S i = j = 1 n r i j r j 2 1     i     m ,   1     j     n
Step VII: The co-efficient of closeness ( C i + ) of various solutions to the ideal solution is calculated by the following equation:
C i + = S i S i + S i + ( 0   <   C i + < 1 ,   1     i     m )
Step VIII: TOPSIS uses the result of C i + to rank the preference of solutions, and a larger C i + value indicates stronger preference.

4. Multi-Objective Optimization Implementation

4.1. Construct Multi-Objective Optimization Model

The goal of this research is to find the best combination of the selected injection molding parameters to minimize three objective functions, namely, simultaneously minimizing warpage, sink marks, and clamping force. The minimum design problem can be stated as follows:
find   : x = [ T m e l t ,   T m o l d ,   t i ,   t p ,   p p ] Minimize   : y 1 ( x ) ;   y 2 ( x ) ;   y 3 ( x ) s . t .   : 280   ° C     T m e l t     320   ° C 70   ° C     T m o l d     110   ° C 0.8   s     t i     4.2   s 4   s     t p     20   s 30   MPa     p p     60   MPa
where x denotes the variables, representing process parameters. The processing parameters involved in experimental design are the melt temperature, mold temperature, injection time, packing time, and packing pressure, which are represented by T m e l t , T m o l d , t i , t p , and p p , respectively. The selection range of each factor level is recommended by the material supplier and Moldflow Plastics Insight. The cooling temperature and cooling time are set to the ambient temperature 25 °C and 20 s, respectively. y 1 ( x ) , y 2 ( x ) , and y 3 ( x ) are quantified as the three objectives, warpage value, sink marks value, and clamping force value, respectively, which will be replaced by an approximate function based on the PSO-BPNN model in optimization iterations.

4.2. Taguchi Test and Analysis

The finite element simulation of the MTPL utilized in this study is performed using Moldflow software (Moldflow 2018), which is a commercial software based on the hybrid finite element and finite difference methods to solve flow, temperature, and pressure fields. The fusion mesh finite element simulation model of the MTPL with a cooling system and injection system are shown in Figure 3, and the analysis model consists of 14,618 triangle elements.
The Taguchi method is usually used to identify the significant factors for quality characteristics of the products [34]. The simulation experiments are executed according to the L 27 3 5 orthogonal array, and the factor levels are listed in Table 1. The Taguchi experimental results are listed in Table 2.
All objective performances in this paper are expected to be as small as possible, so they are smaller-the-better experiments. The S/N ratio of the smaller-the-better characteristic is calculated using the following equation in this experiment.
η S T B j = 10 log 1 n i = 1 n y ^ i j 2 j = 1 , 2 , m  
where η S T B j denotes the j-th objective S/N ratio.
Figure 4 shows the Taguchi response diagram for these three objectives. The results revealed that the significant injection parameters affecting the warpage of MTPL are packing pressure, melt temperature, and packing time. The significant injection parameters affecting the sink marks of MTPL are packing pressure, packing time, and injection time. For clamping force, the significant injection parameters are packing pressure, melt time, and injection time. It is not difficult to see that each objective has a clear competitive relationship and their best results cannot be achieved at the same time.

4.3. Establishing and Evaluating the PSO-BPNN Prediction Model

4.3.1. Establishing PSO-BPNN Prediction Model

The complexity of the BPNN model is basically determined by the network layer number and the number of neurons in each layer. Taking into account the conflicting relationship between the experimental data size and the expressive capability of the network, the PSO-BPNN fitting model with a single hidden layer is built for three objectives. The linear rectification function (ReLU) is used as the activation function of the network, the mean square error loss function (MSELoss) is set as the loss function of the network, and the Adam optimizer is used as the optimizer. Melt temperature, mold temperature, injection time, packing time, and packing pressure are selected as the input layer of the network, and the warpage, sink marks, and clamping forces are considered as the output layer of the network. The input dimensions are set to 5, and the output dimension is set to 1. There are 11 neuron nodes in the hidden layer of the network, which is acquired by tests. A three-layer BPNN (5-11-1) model is constructed accordingly, and the corresponding BPNN topology structure is shown in Figure 5.
The three constructed PSO-BPNN models operate with the following settings: the population size is set to 50, the maximum number of PSO iterations is 50, both the acceleration constants c1 and c2 are set to 0.5, and the inertia weight is 0.8. The maximum number of network training epochs allowed is 2000; and the speed of network learning is 0.01, 0.015, and 0.01 for warpage, sink marks, and clamping force, respectively.
The training and validation datasets were obtained by randomly disrupting the Taguchi test data, extracting the first 80% of the data as the training dataset to train the PSO-BPNN model and the last 20% of the data as the validation dataset to verify the model training effect. Additionally, using the uniform sampling method within the value range of each process parameter, 10 sets of process parameter schemes, not included in the Taguchi experimental dataset, are extracted as the model test dataset, which are used to validate the generalization performance of these PSO-BPNN models. The simulation experimental results of the test dataset are listed in Table 3.
Considering the significant dimensional differences between the input parameters, which will affect the convergences and performances of these PSO-BPNN models, the following formula is used to normalize the input data:
x i = x i μ σ  
where x denotes the i-th standardized value of an input parameter, x i denotes the i-th value of the corresponding parameter, and μ and σ denote the average value and the standard deviation of the same parameter.

4.3.2. Prediction Model Accuracy Analysis

Figure 6 shows the prediction model fitting loss variations with the training process and validation process for these triple objectives, warpage, sink marks, and clamping force.
Figure 6 shows that the training loss of warpage, sink marks, and clamping force of the three prediction models gradually decreased with continuous training iterations. It indicates that all PSO-BPNN models converge and achieve the ideal fitting results. When the three models were iterated to 517 rounds, 233 rounds, and 612 rounds, the accuracy of the three fitting models was acquired. Additionally, the change trend of the validation dataset RMSE loss curve for each model indicates that the three models fit the data well and did not show any underfitting or overfitting phenomenon. Figure 7 shows the validation results of these three trained prediction models using the validation dataset. It can be seen that the three fitting models obtained all show accurate prediction values for their respective objectives, and the maximum prediction error of these three training models is only 2.94%, 3.64%, and 1.27%.
To test the generalization ability of these three prediction models, the test dataset that did not appear in the Taguchi test was predicted, and R 2 and MAPE were used to check the generalization ability of these models. When R 2 is closer to 1, it indicates that the regression model has better fitting performance. And MAPE intuitively represents the proportion of the prediction error relative to the true value; the smaller the MAPE, the more accurate the prediction model. Figure 8 shows these three model prediction results. It can be seen that each predicted model presents a high degree of confidence, and the predicted values of the three models are all basically consistent with the experimental true values.
The evaluation results of the generalization abilities of these prediction models are shown in Table 4. It shows that, on the test dataset, the R 2 and MAPE for warpage, sink marks, and clamping force are 0.9746 and 1.05%; 0.9705 and 2.12%; and 0.9973 and 0.71%, respectively. Therefore, the three obtained PSO-BPNN models have good generalization ability, and each objective prediction model can well reflect the complex nonlinear mapping relationship between the injection molding process parameters and the corresponding objective.

4.4. Multi-Objective Optimization Pareto Frontier by OMOPSO

From the results of the analysis obtained in Section 4.2, it can be concluded that conflicting relationships exist among these objectives, which cannot be optimized to the minimum values simultaneously. This multi-objective optimization problem is solved using the OMOPSO algorithm with the number of iteration rounds, population size, and ε set to 10,000 rounds, 300, and 0.05, respectively. The three-objective Pareto frontier and the corresponding pairwise Pareto frontiers are presented in Figure 9. The results show that the Pareto fronts obtained with the OMOPSO algorithm are distributed uniformly on a surface, and this means that the algorithm has good convergence and robustness.
Figure 9 shows that there is an apparent Pareto frontal curve in each pairwise projection plot of the three-dimensional Pareto frontier. According to the warpage–sink marks Pareto frontiers in Figure 9a, it can be found that the sink marks generally increase with the warpage amount. While Figure 9a also shows that sink marks do not reach the maximum value when the warpage reaches the maximum value, the maximum sink marks value occurs when the warpage deformation is only about 0.8 mm. This indicates that there is a complex relationship between these two objectives, as there is no significant positive or negative correlation between them. The pairwise Pareto frontiers in Figure 9b show a significant trade-off relationship between warpage and clamping force. The clamping force decreases as warpage increases; when the warpage is close to 1 mm, the clamping force decreases to about 500 kN, and when the warpage decreases to less than 0.6 mm, the clamping force rises sharply to more than 1200 kN. It demonstrates that there is a strong negative correlation between these two objectives. According to Figure 9c, an apparent trade-off can also be noted in sink marks–clamping force Pareto frontiers; it means that the clamping force basically decreases with the sink marks’ increase.
The above analysis combined with the three-objective optimization Pareto frontiers shown in Figure 9d further demonstrate that these three objectives, warpage, sink marks, and clamping force, have a strong competitive and complex relationship with each other, and these objectives cannot be optimized to reach the optimum at the same time, which is consistent with the results of the previous signal-to-noise ratio analysis results.

4.5. Multi-Criteria Decision Making by TOPSIS

Finding out the best optimum solution from all non-dominated Pareto-optimal solutions obtained with the OMOPSO optimization algorithm is a multi-criteria decision making (MCDM) problem. Considering the lens quality requirements and the production energy requirements, the Pareto frontier dataset is initially reduced by setting the screening conditions: warpage less than 0.70 mm, sink marks less than 3.00%, and clamping force less than 1000.00 kN. The TOPSIS method with equal weight for each objective is then employed to sort and achieve the final best optimum process parameters of the injection modeling of MTPL. The initial screening optimal solutions and the corresponding TOPSIS ranking results are shown in Table 5. Therefore, solution No. 7 is selected as the best trade-off optimal design solution among all alternatives.

5. Verification of the Final Optional Solution

As shown in Table 6, it can be found that, compared to the Moldflow simulation results, the prediction accuracies for the triple objectives in the optimal selected solution are all very high. The relative errors for the prediction values of warpage, sink marks, and clamping force are 0.22, 1.49, and 0.92%, respectively, which further validates the effectiveness of the proposed method. Figure 10 shows the simulation results of warpage, sink marks, and clamping force before and after optimization.
Table 7 shows the optimization effects of the triple objectives. It reveals that the maximum warpage, sink marks, and clamping force of the MTPL, which are 0.7513 mm, 3.844%, and 951.96 kN before the optimization, are reduced to 0.6954 mm, 2.285%, and 899.04 kN after optimization, declining by about 7.44%, 40.56%, and 5.56%, respectively. According to the sink marks’ simulation results, the surface contour furthest from the gate of the molded MTPL, which has the largest sink marks, was measured using an Olympus OLS5000 3D confocal laser microscope, as is illustrated in Figure 11. It can be concluded that the MTPL surface profile status has been greatly improved after optimization. Figure 12 shows that the final MTPL produced using the TOPSIS-recommended injection molding parameters is high quality, which confirms that the proposed approach is valid.

6. Conclusions

To realize MTPL injection molding with a high quality and lower energy consumption at the same time, the present study selects the warpage, sink marks, and clamping force as the quality objectives and the energy consumption objective. The multi-objective problem was solved by using an optimization method integrated with the Taguchi orthogonal experiment, PSO-BPNN, OMOPSO, and TOPSIS methods. The major conclusions of this paper can be drawn as follows:
(1)
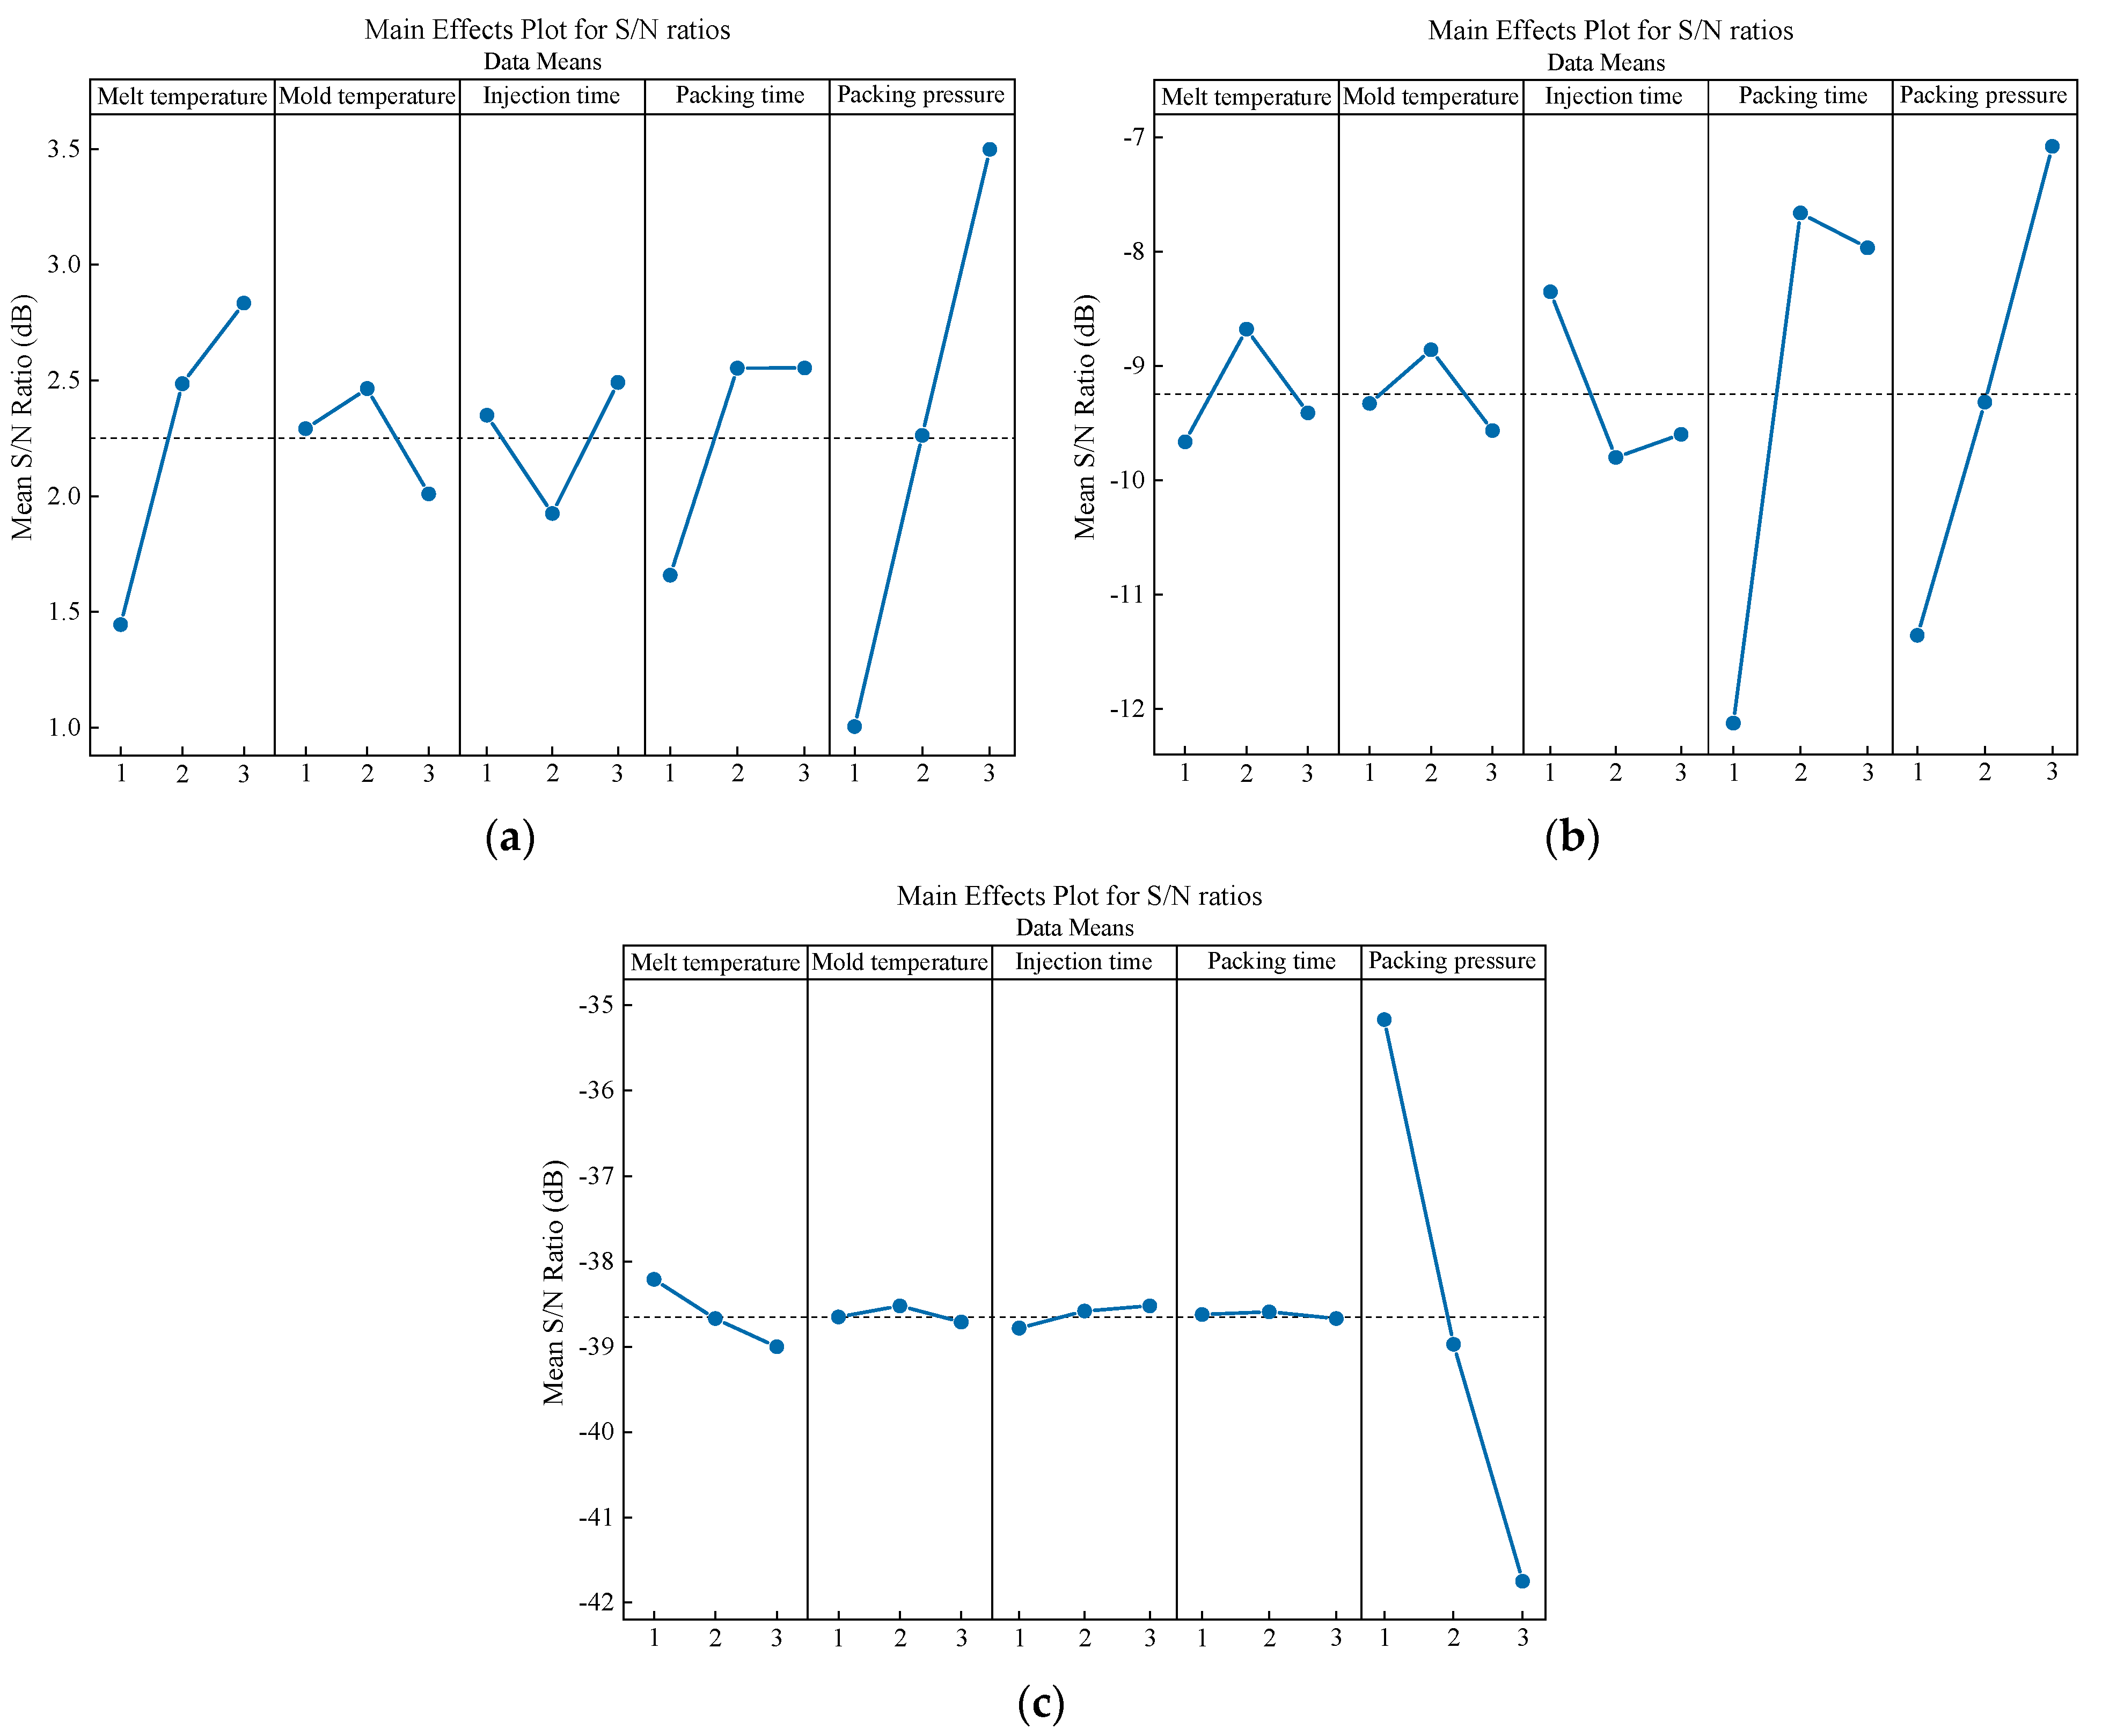
The results of the Taguchi S/N factor response reveal that the significant injection parameters of MTPL can be ranked in terms of a diminishing impact on the three objectives as follows: for warpage, packing pressure > melt temperature > packing time; for sink marks, packing pressure > packing time > injection time; and for clamping force, packing pressure > melt time > injection time. It shows that the three selected objectives cannot reach the optimal values simultaneously.
(2)
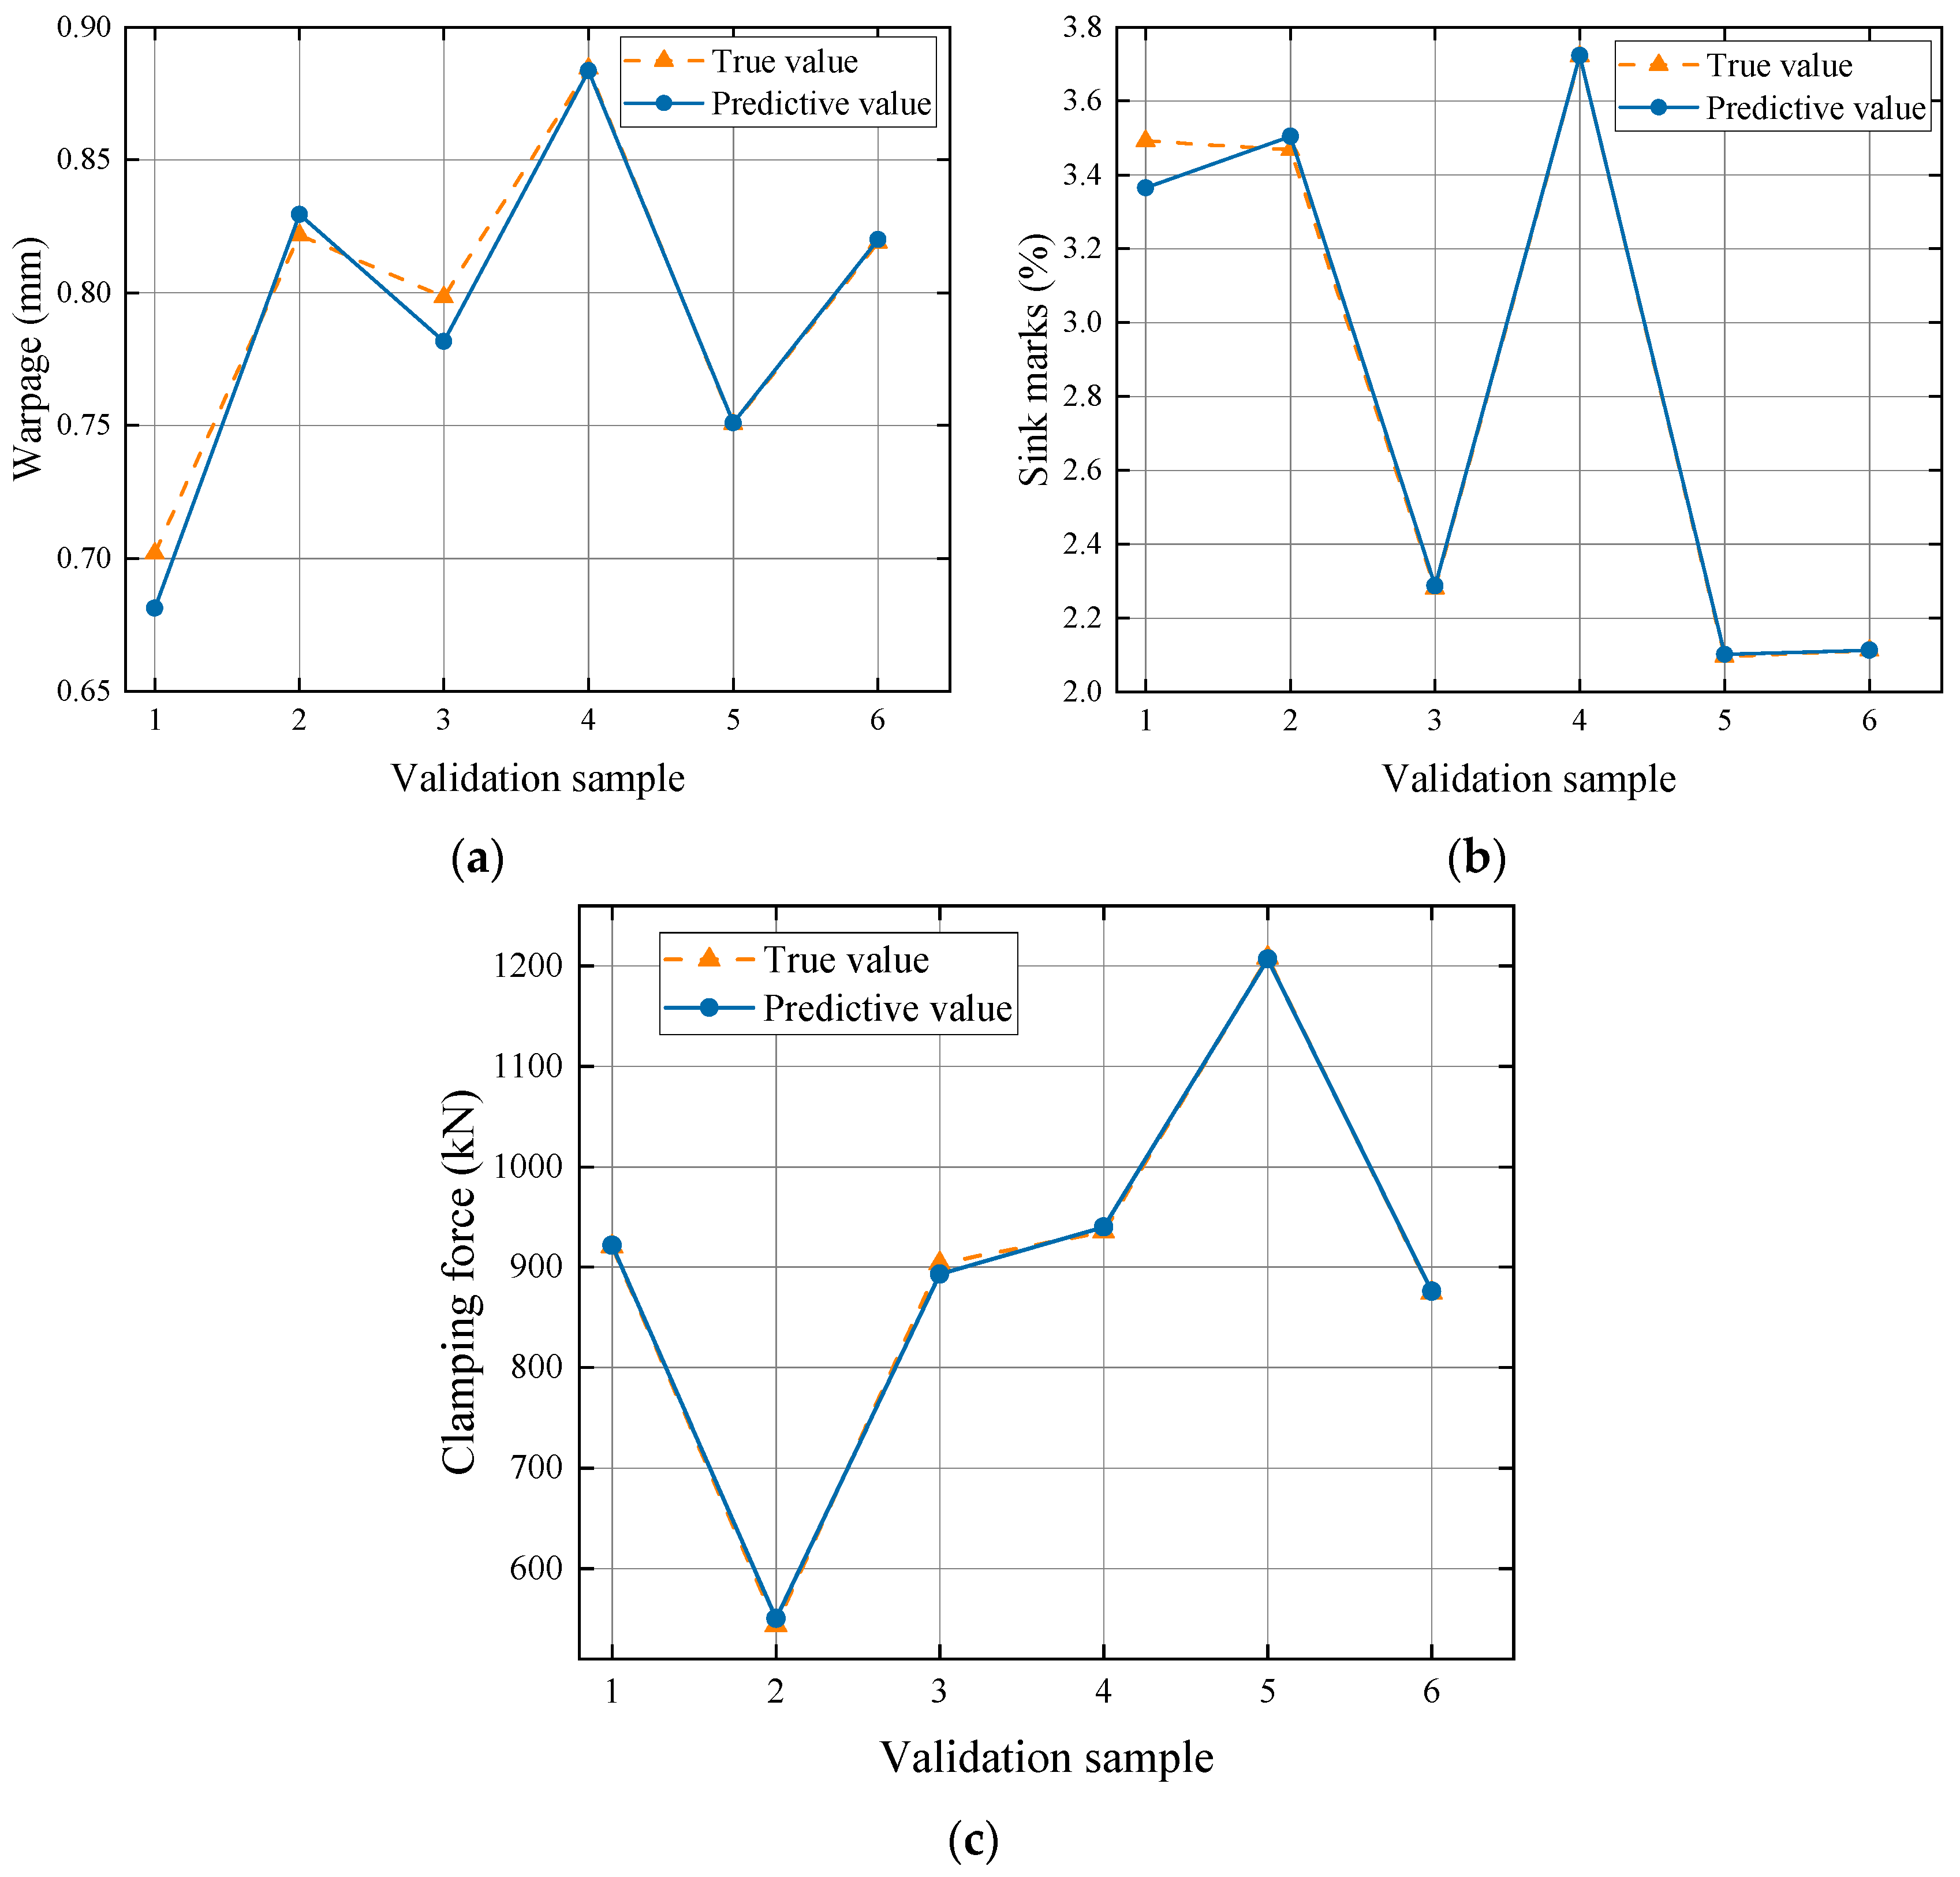
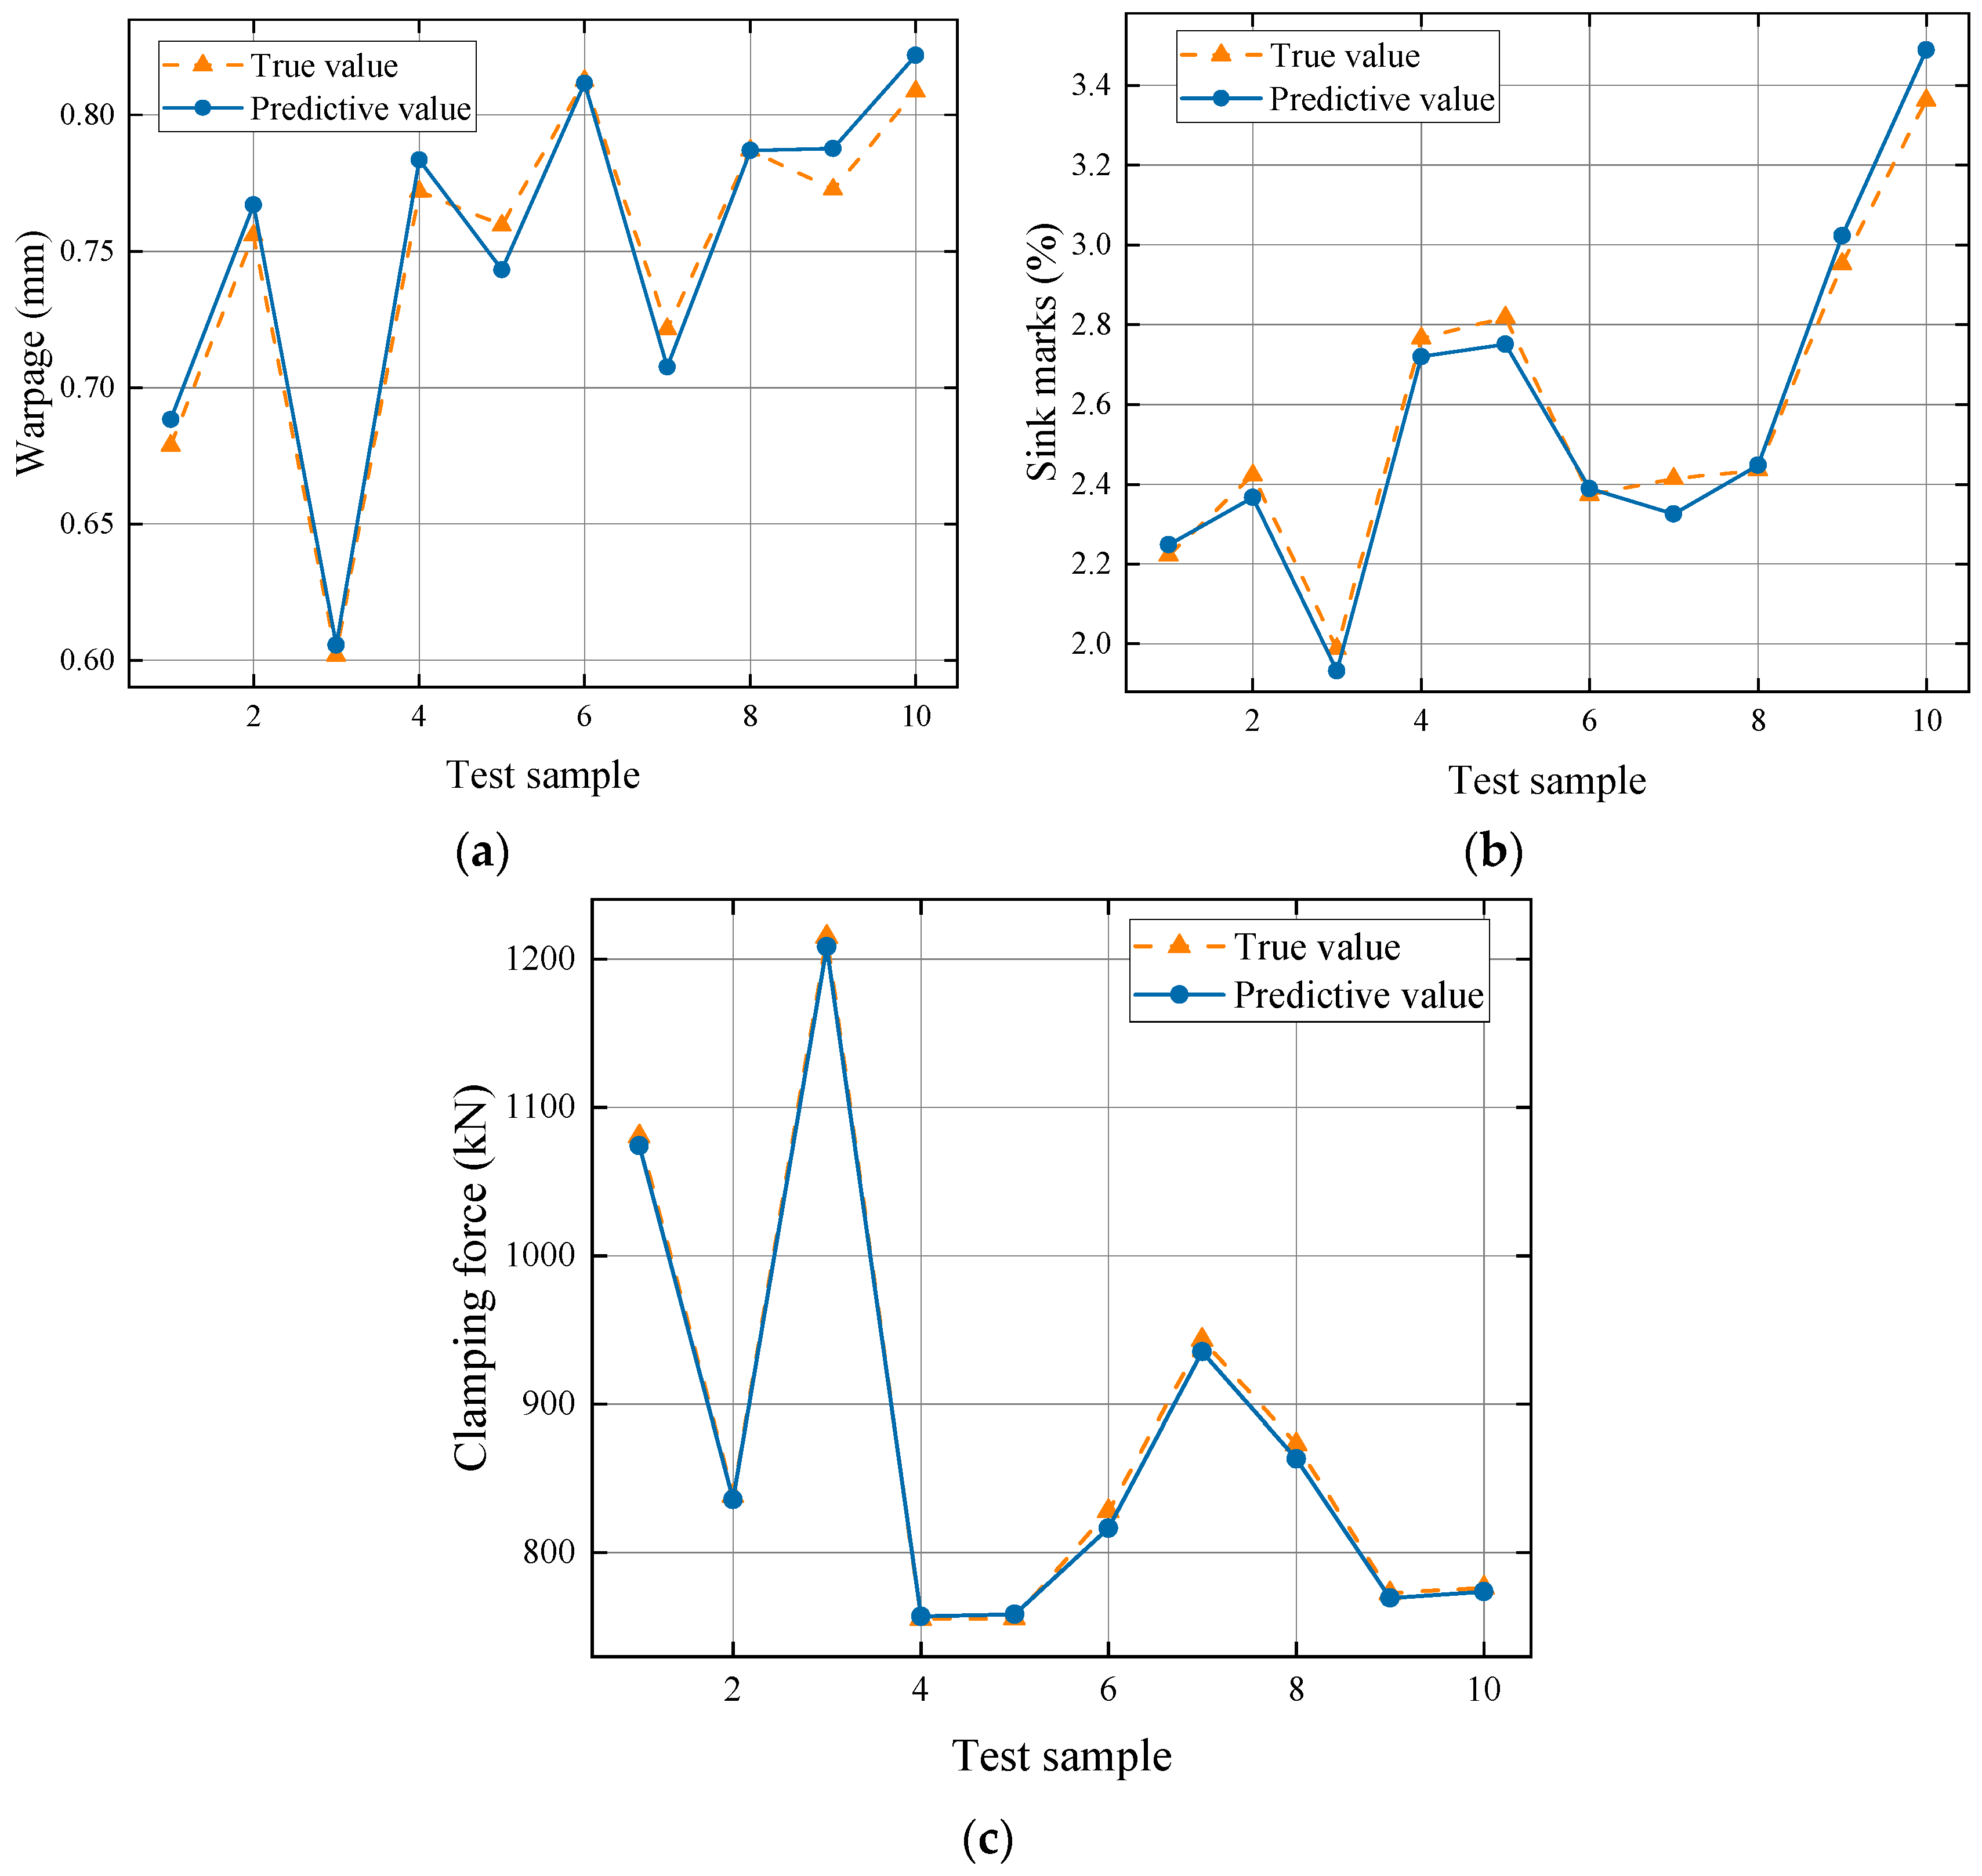
Considering the experimental dataset size limitation, PSO-BPNN prediction models with a single hidden layer are built for the three trade-off objectives. Each prediction model can well reflect the complex nonlinear mapping relationship between the injection molding process parameters and three objectives as the maximum relative error of the validation set is only 3.64%. And these three obtained PSO-BPNN models all presented good generalization ability, because for another 10 extracted uniformly distributed samples within the value range of each process parameter, which are not included in the training and validation datasets, the corresponding R 2 and MAPE for warpage, sink marks, and clamping force are 0.9746 and 1.05%; 0.9705 and 2.12%; and 0.9973 and 0.71%, respectively.
(3)
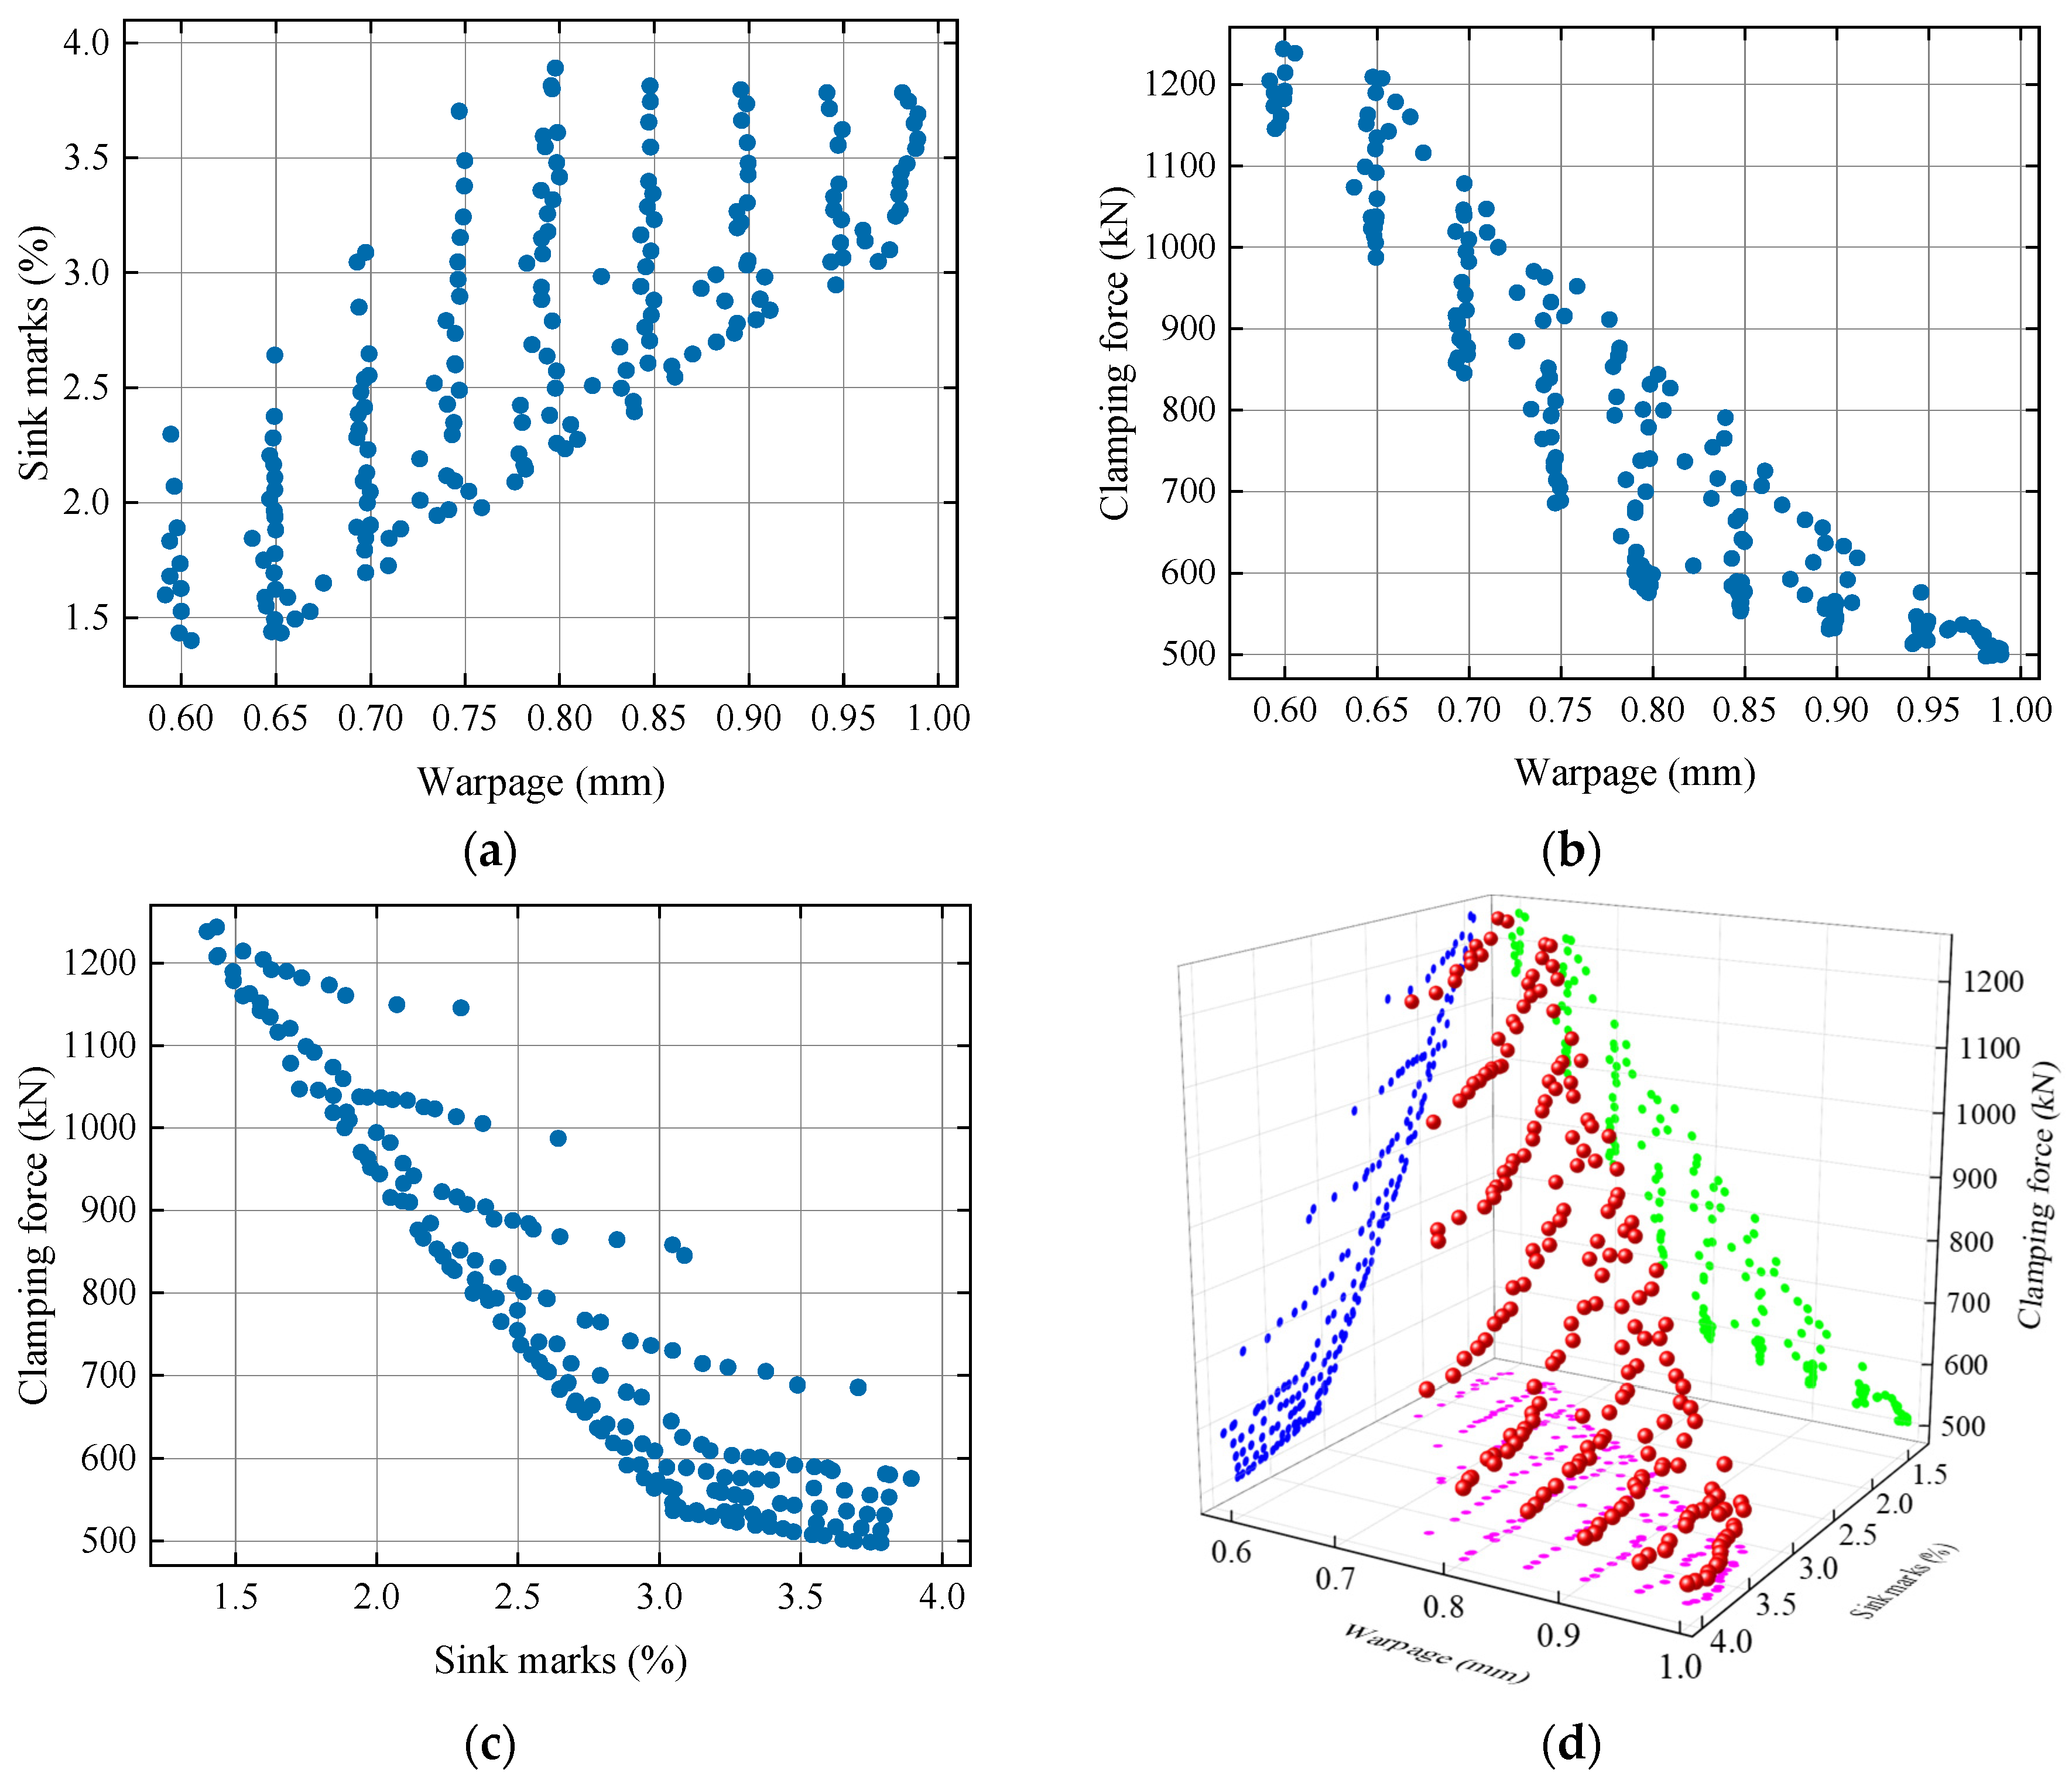
The non-dominated Pareto frontier solutions obtained by OMOPSO based on the PSO-BPNN prediction models are distributed uniformly, which means that this algorithm performs well with good convergence and robustness. The corresponding pairwise Pareto frontiers also show that there is a significant trade-off between warpage and clamping force and between sink marks and clamping force, and there is a complex relationship between warpage and sink marks, because when the maximum sink marks value of 3.891% occurs, the warpage is about 0.798 mm instead of the maximum 0.989 mm.
(4)
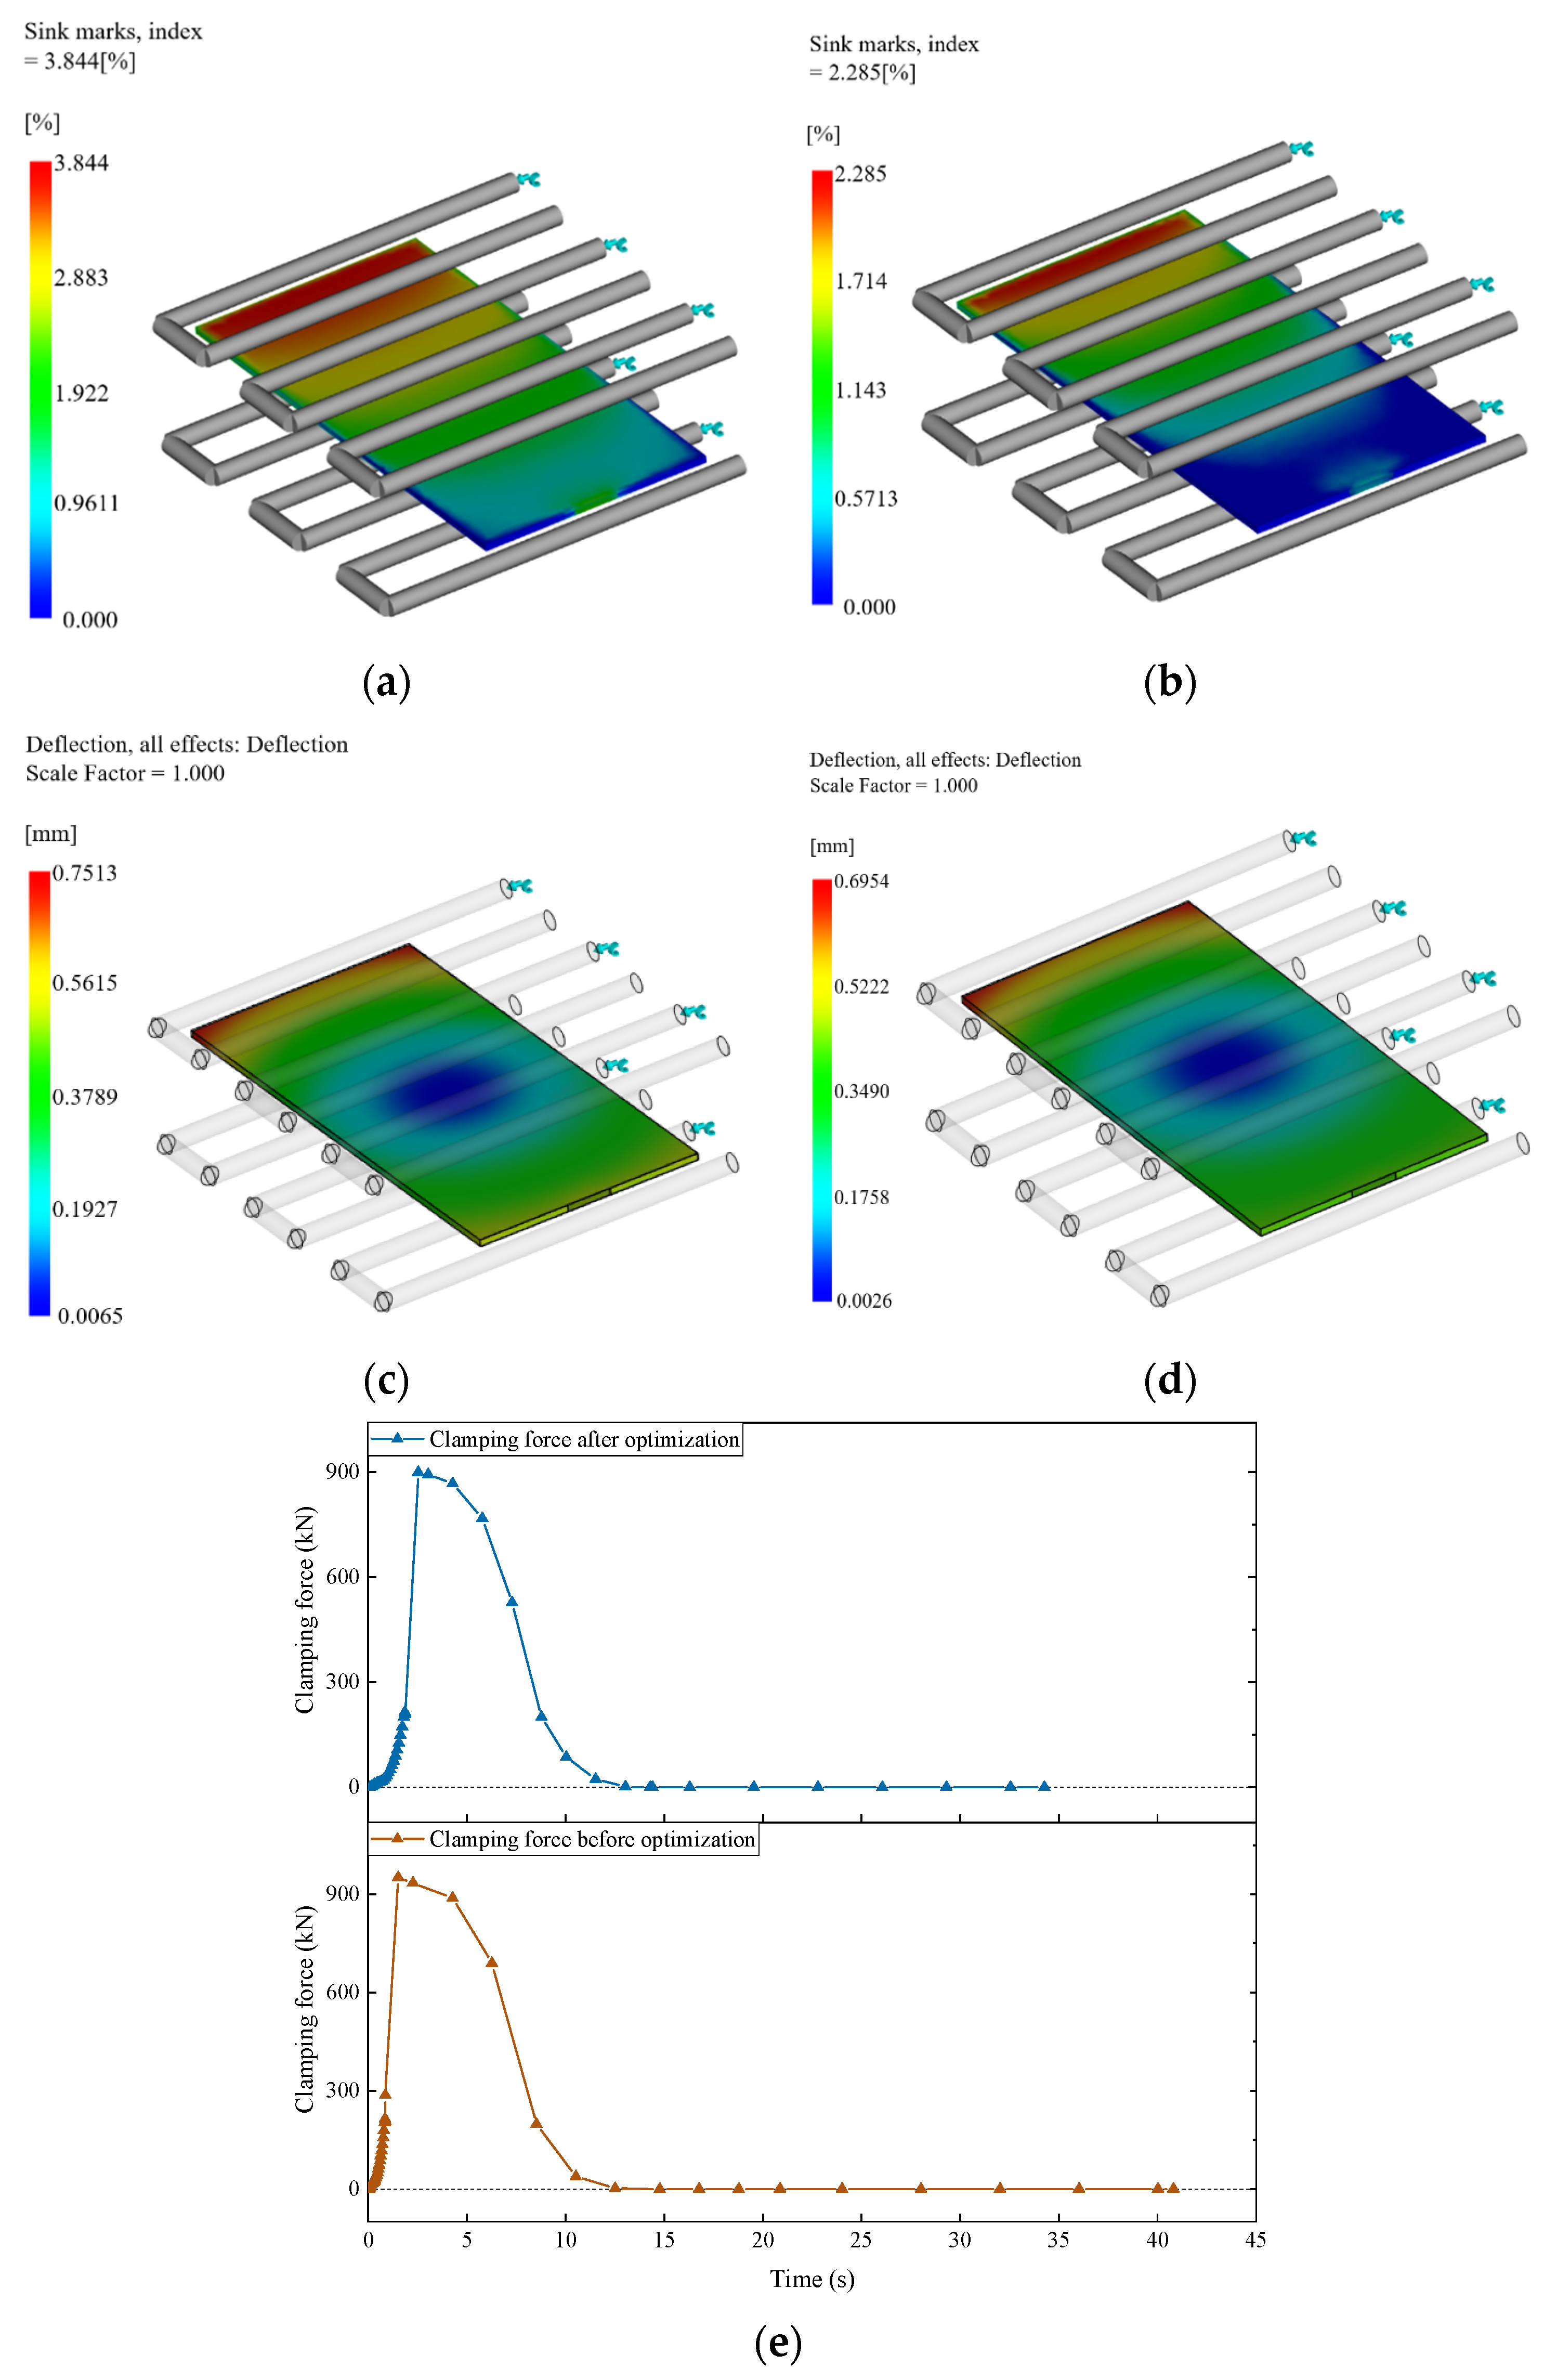
The final best optimal solution is achieved from the reduced non-dominated solution Pareto frontier by the TOPSIS method with equal weight. Compared with the simulation results, the prediction accuracies for these three objectives with the selected optimal solution are all very high, and the relative errors for the prediction values of warpage, sink marks, and clamping force are 0.22%, 1.58%, and 0.92%, respectively, which further validates the effectiveness of the proposed method. Moreover, the maximum values of warpage, sink marks, and clamping force, which are 0.7513 mm, 3.844%, and 951.96 kN before the optimization, are reduced to 0.6954 mm, 2.285%, and 899.04 kN after optimization, reduced by 7.44%, 40.56%, and 5.56%, respectively. MTPL injection molding is performed with high product quality and low energy consumption with the proposed method.

Author Contributions

Methodology and funding acquisition, F.L.; investigation, J.P. and F.L.; writing original draft, F.L., J.P. and Z.X.; software and analyses, F.L. and Z.X.; project administration, F.L.; validation, F.L.; writing and review and editing, F.L. and J.P. All authors have read and agreed to the published version of the manuscript.

Funding

This research was funded by the Zhejiang Provincial Natural Science Foundation of China, grant number LY19E050009; the State Key Laboratory of Materials Processing and Die & Mould Technology, Huazhong University of Science and Technology, grant number P2021-22; the Key Laboratory for Technology in Rural Water Management of Zhejiang Province (ZJWEU-RWM-202105); the Domestic Visiting Scholar Program for Higher Education Institutions of China; and Zhejiang University of Water Resources and Electric Power, grant number X20220020.

Institutional Review Board Statement

Not applicable.

Informed Consent Statement

Not applicable.

Data Availability Statement

All data used to support the findings of this study are included with the article.

Acknowledgments

The authors acknowledge the project help of the Teacher Professional Development Project for Domestic Visiting Scholars in Higher Education Institutions of China.

Conflicts of Interest

The authors declare no conflict of interest.

References

  1. Peixoto, C.; Valentim, P.T.; Sousa, P.C.; Dias, D.; Araújo, C.; Pereira, D.; Machado, C.F.; Pontes, A.J.; Santos, H.; Cruz, S. Injection molding of high-precision optical lenses: A review. Precis. Eng. 2022, 76, 29–51. [Google Scholar] [CrossRef]
  2. Michaeli, W.; Walach, P. Optical Plastics Components: Replication Processes and Plastic Materials. In Fabrication of Complex Optical Components, 1st ed.; Brinksmeier, E., Riemer, O., Gläbe, R.M., Eds.; Springer: Berlin/Heidelberg, Germany, 2013; pp. 25–40. [Google Scholar] [CrossRef]
  3. Lin, C.M.; Chen, Y.W. Grey optimization of injection molding processing of plastic optical lens based on joint consideration of aberration and birefringence effects. Microsyst. Technol. 2019, 25, 621–631. [Google Scholar] [CrossRef]
  4. Chien, R.D.; Chen, C.S.; Chen, S.C. Effect of moulding conditions on the tensile strength of cyclic olefin copolymers (COC) injection moulded parts. Plast. Rubber Compos. 2005, 34, 70–75. [Google Scholar] [CrossRef]
  5. Chung, C.Y. Integrated optimum layout of conformal cooling channels and optimal injection molding process parameters for optical lenses. Appl. Sci. 2019, 9, 4341. [Google Scholar] [CrossRef]
  6. Yin, X.H.; Yang, C.; Li, X.P.; Liang, D.; Zhang, Z.H.; Tang, Y.; He, L.J. 3D thickness distributions of plano lenses as a means of cavity pressure characterization in microinjection molding. Opt. Express 2018, 26, 11250–11264. [Google Scholar] [CrossRef] [PubMed]
  7. Liu, Y.; Cao, L.; Chi, W.K.; Zhang, L.Y.; Yang, W.M.; Xie, P.C. Multi-layer counter-pressure injection molding for thick-walled optical lens. Int. Polym. Process. 2021, 36, 131–136. [Google Scholar] [CrossRef]
  8. Gao, R.X.; Zhao, P.; Xie, J.; Chen, H.; Jiao, X.L.; Zhu, N.D.; Chen, Y.H.; Fu, J.Z. Research on the multilayer injection molding of thick-walled polymer optical products. J. Manuf. Process. 2023, 103, 309–319. [Google Scholar] [CrossRef]
  9. Park, K.; Kim, B.; Yao, D.G. Numerical simulation for injection molding with a rapidly heated mold, Part II: Birefringence prediction. Polym. Plast. Technol. Eng. 2006, 45, 903–909. [Google Scholar] [CrossRef]
  10. Hong, S.; Min, I.; Yoon, K.; Kang, J. Effects of adding injection–compression to rapid heat cycle molding on the structure of a light guide plate. J. Micromech. Microeng. 2014, 24, 5009. [Google Scholar] [CrossRef]
  11. Nian, S.C.; Li, M.H.; Huang, M.S. Warpage control of headlight lampshades fabricated using external gas-assisted injection molding. Int. J. Heat Mass Transf. 2015, 86, 358–368. [Google Scholar] [CrossRef]
  12. Lin, C.M.; Hsieh, H.K. Processing optimization of Fresnel lenses manufacturing in the injection molding considering birefringence effect. Microsyst. Technol. 2017, 23, 5689–5695. [Google Scholar] [CrossRef]
  13. Lu, X.H.; Khim, L.S. A statistical experimental study of the injection molding of optical lenses. J. Mater. Process. Technol. 2001, 113, 189–195. [Google Scholar] [CrossRef]
  14. Zhou, H.F.; Zhang, S.; Wang, Z. Multi-objective optimization of process parameters in plastic injection molding using a differential sensitivity fusion method. Int. J. Adv. Manuf. Technol. 2021, 114, 423–449. [Google Scholar] [CrossRef]
  15. Zhao, J.; Cheng, G.D.; Ruan, S.L.; Li, Z. Multi-objective optimization design of injection molding process parameters based on the improved efficient global optimization algorithm and non-dominated sorting-based genetic algorithm. Int. J. Adv. Manuf. Technol. 2015, 78, 1813–1826. [Google Scholar] [CrossRef]
  16. Bensingh, R.J.; Machavaram, R.; Boopathy, S.R.; Jebaraj, C. Injection molding process optimization of a bi-aspheric lens using hybrid artificial neural networks (ANNs) and particle swarm optimization. Measurement 2019, 134, 359–374. [Google Scholar] [CrossRef]
  17. Bensingh, R.J.; Boopathy, S.R.; Jebaraj, C. Minimization of variation in volumetric shrinkage and deflection on injection molding of Bi-aspheric lens using numerical simulation. J. Mech. Sci. Technol. 2016, 30, 5143–5152. [Google Scholar] [CrossRef]
  18. Liu, J.H.; Chen, X.D.; Lin, Z.Q.; Diao, S.P. Multiobjective optimization of injection molding process parameters for the precision manufacturing of plastic optical lens. Math. Probl. Eng. 2017, 2017, 2834013. [Google Scholar] [CrossRef]
  19. Yin, X.H.; Yang, C.; Li, X.P. Simultaneous control of birefringence and warpage for thermoplastic optical lenses fabricated using microinjection molding. Polym. Plast. Technol. Eng. 2015, 54, 1772–1779. [Google Scholar] [CrossRef]
  20. Tsai, K.M.; Luo, H.J. An inverse model for injection molding of optical lens using artificial neural network coupled with genetic algorithm. J. Intell. Manuf. 2017, 28, 473–487. [Google Scholar] [CrossRef]
  21. Lin, C.M.; Chen, W.C. Optimization of injection-molding processing conditions for plastic double-convex Fresnel lens using grey-based Taguchi method. Microsyst. Technol. 2020, 26, 2575–2588. [Google Scholar] [CrossRef]
  22. Wang, S.T. Integration of a fuzzy neural network and multi-objective genetic algorithm for optimisation of BLU light guide plate injection moulding parameters. Int. J. Mater. Prod. Technol. 2012, 45, 83–95. [Google Scholar] [CrossRef]
  23. Kuo, C.F.J.; Dewantoro, G.; Huang, C.C. Optimization of injection-molded light guide plate with microstructures by using reciprocal comparisons. J. Intell. Manuf. 2015, 26, 677–690. [Google Scholar] [CrossRef]
  24. Spina, R.; Walach, P.; Schild, J.; Hopmann, C. Analysis of lens manufacturing with injection molding. Int. J. Precis. Eng. Manuf. 2012, 13, 2087–2095. [Google Scholar] [CrossRef]
  25. Lan, X.; Li, C.; Yang, C.; Xue, C. Optimization of injection molding process parameters and axial surface compensation for producing an aspheric plastic lens with large diameter and center thickness. Appl. Opt. 2019, 58, 927–934. [Google Scholar] [CrossRef] [PubMed]
  26. Fang, F.Z.; Zhang, N.; Zhang, X.D. Precision injection molding of freeform optics. Adv. Opt. Technol. 2016, 5, 303–324. [Google Scholar] [CrossRef]
  27. Xu, Y.X.; Liu, G.; Dang, K.F.; Fu, N.H.; Jiao, X.L.; Wang, J.L.; Xie, P.C.; Yang, W.M. A novel strategy to determine the optimal clamping force based on the clamping force change during injection molding. Polym. Eng. Sci. 2021, 61, 25829. [Google Scholar] [CrossRef]
  28. Kitayama, S.; Tamada, K.; Takano, M.; Aiba, S. Numerical optimization of process parameters in plastic injection molding for minimizing weldlines and clamping force using conformal cooling channel. J. Manuf. Process. 2018, 32, 782–790. [Google Scholar] [CrossRef]
  29. Liu, X.; Fan, X.Y.; Guo, Y.H.; Cao, Y.L.; Li, C.X. Multi-objective optimization of GFRP injection molding process parameters, using GA-ELM, MOFA, and GRA-TOPSIS. Trans. Can. Soc. Mech. Eng. 2021, 46, 37–49. [Google Scholar] [CrossRef]
  30. Guo, W.; Deng, F.; Meng, Z.H.; Hua, L.; Mao, H.J.; Su, J.J. A hybrid back-propagation neural network and intelligent algorithm combined algorithm for optimizing microcellular foaming injection molding process parameters. J. Manuf. Process. 2020, 50, 528–538. [Google Scholar] [CrossRef]
  31. Liu, X.; Liu, Z.; Liang, Z.W.; Zhu, S.P.; Correia, J.A.F.O.; De Jesus, A.M.P. PSO-BP neural network-based strain prediction of wind turbine blades. Materials 2019, 12, 1889. [Google Scholar] [CrossRef]
  32. Coello, C.A.C.; Pulido, G.T.; Lechuga, M.S. Handling multiple objectives with particle swarm optimization. IEEE Trans. Evol. Comput. 2004, 8, 256–279. [Google Scholar] [CrossRef]
  33. Sierra, M.R.; Coello, C.A.C. Improving PSO-based multi-objective optimization using crowding, mutation and ∈-dominance. In Proceedings of the International Conference on Evolutionary Multi-Criterion Optimization, Guanajuato, Mexico, 9–11 March 2005. [Google Scholar]
  34. Fernandes, C.; Pontes, A.J.; Viana, J.C.; Gaspar-Cunha, A. Modeling and optimization of the injection-molding process: A review. Adv. Polym. Technol. 2018, 37, 429–449. [Google Scholar] [CrossRef]
Figure 1. MTPL injection molding mold structure: (a) 3D CAD model; (b) experimental mold.
Processes 12 00036 g001
Figure 2. Flowchart of the proposed optimization method.
Processes 12 00036 g002
Figure 3. MTPL simulation model.
Processes 12 00036 g003
Figure 4. Taguchi S/N ratio response diagram of (a) warpage; (b) sink marks; and (c) clamping force.
Processes 12 00036 g004
Figure 5. Topology structure of BPNN.
Processes 12 00036 g005
Figure 6. The fitting loss plot of PSO-BPNN prediction models: (a) warpage; (b) sink marks; and (c) clamping force.
Processes 12 00036 g006
Figure 7. The validation results of the PSO-BPNN models: (a) warpage; (b) sink marks; and (c) clamping force.
Processes 12 00036 g007
Figure 8. The prediction results of the PSO-BPNN models: (a) warpage; (b) sink marks; and (c) clamping force.
Processes 12 00036 g008
Figure 9. Pairwise Pareto front for (a) warpage–sink marks; (b) warpage–clamping force; (c) sink marks–clamping force; and (d) triple-objective Pareto frontier of OMOPSO model.
Processes 12 00036 g009
Figure 10. Simulation results: (a) warpage before optimization; (b) warpage after optimization; (c) sink marks before optimization; (d) sink marks after optimization; and (e) clamping force before and after optimization.
Processes 12 00036 g010
Figure 11. MPTL surface profile status (a) before optimization and (b) after optimization.
Processes 12 00036 g011
Figure 12. MTPL produced with TOPSIS-recommended solution.
Processes 12 00036 g012
Table 1. The control factors and levels of the Taguchi experiments.
LevelControl Factor
T m e l t
(°C)
T m o l d
(°C)
t i
(s)
t p
(s)
p p
(MPa)
1280700.8430
2300902.51245
33201104.22060
Table 2. The Taguchi L 27 3 5 orthogonal array with experimental simulation results.
No.Control FactorResults
T m e l t
(°C)
T m o l d
(°C)
t i
(s)
t p
(s)
p p
(MPa)
y 1
(mm)
y 2
(%)
y 3
(kN)
1111110.9994.301540.79
2111120.8883.851874.23
3111130.8033.4561208.24
4122210.9813.492505.83
5122220.8302.605843.95
6122230.7021.8891183.00
7133310.9743.802612.84
8133320.8192.851784.88
9133330.6892.0961128.53
10212310.8783.352569.59
11212320.7512.532903.35
12212330.6431.8821236.27
13223110.8854.070543.64
14223120.7633.722881.73
15223130.6613.5181218.44
16231210.8593.002589.76
17231220.7392.112920.49
18231230.6341.4931250.55
19313210.7983.468587.98
20313220.6782.617920.62
21313230.5711.9041252.23
22321310.7843.235612.82
23321320.6742.280941.24
24321330.5781.4391268.98
25332110.8864.932605.34
26332120.8224.595935.35
27332130.7744.1421264.45
Table 3. Test datasets’ simulation results.
No. T m e l t
(°C)
T m o l d
(°C)
t i
(s)
t p
(s)
p p
(MPa)
y 1
(mm)
y 2
(%)
y 3
(kN)
13031053.212530.67872.2221080.346
2305741.011410.75592.423838.523
3310784.213590.60171.9881214.942
4308710.89370.77212.766755.513
5317742.410370.75962.818755.999
62881001.018420.81272.374828.089
7308862.218460.72162.414943.414
8292791.718440.78722.435873.231
93021014.115400.77272.953772.687
10297963.35400.80883.363776.582
Table 4. PSO-BPNN prediction model generalization ability evaluation.
Prediction Model R 2 MAPE
Warpage0.97461.05%
Sink marks0.97052.12%
Clamping force0.99730.71%
Table 5. The screened optimal solutions and their corresponding TOPSIS ranking results.
No. T m e l t
(°C)
T m o l d
(°C)
t i
(s)
t p
(s)
p p
(MPa)
y 1
(mm)
y 2
(%)
y 3
(kN)
S i + S i C i + Rank
1320.0088.151.2320.0042.150.69682.536884.011.13970.92740.448710
2308.2889.851.3314.1348.210.69841.998994.531.39211.00010.418114
3320.00100.993.5320.0047.980.64942.642987.461.21061.02700.45906
4308.6594.331.5913.6147.740.69982.047982.281.34760.94700.412715
5320.0070.004.2016.6542.510.69392.850864.361.33151.00680.430613
6320.0070.002.4910.1242.680.69682.414889.331.07360.95840.47163
7319.6172.671.7312.5343.240.69392.319907.271.01190.92260.47701
8314.9980.951.1512.7245.020.69802.129941.981.14090.93810.45128
9320.0079.032.5811.6442.730.69492.481887.881.07820.93170.46365
10320.0072.302.5817.6641.960.69922.648868.401.24550.99760.444711
11320.0079.260.8518.7442.830.69352.384904.371.02920.89120.46414
12313.5494.290.8014.5845.790.69612.093957.321.17220.93600.444012
13320.0080.181.4520.0041.900.69922.553877.051.18420.96750.44979
14318.8086.421.3713.0543.630.69282.283916.251.00320.90740.47492
15316.5392.480.8014.9443.930.69862.230922.541.10420.91420.45297
Table 6. Prediction accuracy confirmation of the TOPSIS-recommended solution.
y 1 (mm) y 2 (%) y 3 (kN)
Prediction results0.6939 2.319 907.27
Simulation results0.6954 2.285 899.04
Relative error0.22%1.49%0.92%
Table 7. Optimization effects of the TOPSIS-recommended solution.
T m e l t
(°C)
T m o l d
(°C)
t i
(s)
t p
(s)
p p
(MPa)
y 1
(mm)
y 2
(%)
y 3
(kN)
Before
optimization
300902.512450.7513 3.844951.96
After
optimization
319.6172.671.7312.5343.240.69542.285899.04
Optimization effects-----7.44%40.56%5.56%
Disclaimer/Publisher’s Note: The statements, opinions and data contained in all publications are solely those of the individual author(s) and contributor(s) and not of MDPI and/or the editor(s). MDPI and/or the editor(s) disclaim responsibility for any injury to people or property resulting from any ideas, methods, instructions or products referred to in the content.

