

Optimized Scheduling of an Integrated Energy System with an Electric Truck Battery Swapping Station
by
Bin Liu
1,
Jie Chen
2,*,
Nan Zhang
1,
Jun Liu
3,
Yuchao Zhang
3,
Hongyin Bao
3,
Lili Liu
3 and
Kang Chen
3 1
College of Electrical Engineering, Xinjiang University, Urumqi 830017, China
2
College of Engineers, Xinjiang University, Urumqi 830017, China
3
China Shipbuilding Haiwei New Energy Company, Urumqi 830063, China
*
Author to whom correspondence should be addressed.
Processes 2024, 12(1), 84; https://doi.org/10.3390/pr12010084
Submission received: 14 December 2023
/
Revised: 25 December 2023
/
Accepted: 26 December 2023
/
Published: 29 December 2023
(This article belongs to the Special Issue 10th Anniversary of Processes: Recent Advances in the Optimisation and Control of Integrated Energy Systems and Energy Markets)
Abstract
:Currently, the focus of integrated energy system scheduling research is the multi-objective’s optimized operational strategies that take into account the economic benefits, carbon emissions, and new energy consumption rates of such systems. The integration of electric trucks with battery charging and swapping capabilities, along with their corresponding battery swapping stations, into an integrated energy system can not only optimize system operation, but also reduce investment costs associated with building energy storage equipment. This study first constructs an operational model for the electric trucks, as well as an electric truck battery swapping station, of the flexible charging and discharging; then, an optimized scheduling model of an integrated energy system is proposed, including an electric truck battery swapping station and using stepped carbon trading. On the basis of meeting the charging and battery swapping needs of electric trucks and coordinating the system’s electrical, thermal and cooling energies, the goal of the optimized scheduling model is to reduce the system’s carbon emissions, improve its economics, and optimize its ability to absorb new energy. Finally, a simulation model of the integrated energy system including an electric truck battery swapping station is built on the MATLAB platform, and commercial software package CPLEX is used to solve the model. In the calculation example, compared to the integrated energy system of disorderly charging and battery swapping of electric trucks and electric truck battery swapping stations, the proposed optimized model of the integrated energy system with the flexible charging and discharging of electric trucks and electric truck battery swapping stations reduces the operating costs by CNY 819, reduces carbon emissions by 414 kg, improves the utilization rate of wind and solar power by 0.3%, and fully utilizes wind and photovoltaic power. Therefore, the rational dispatching of the electric trucks and their battery swapping stations with flexible charging and discharging mentioned in this article can effectively optimize system operations.
1. Introduction
Against the backdrop of fossil fuels depletion on Earth and the intensification of greenhouse effects, energy infrastructure urgently needs to be reformed. In the current energy system, vigorous development of new energy on the energy supply side has reduced the carbon emissions of thermal power plants; on the other hand, the uncertainty of new energy output has resulted in great difficulties in stabilizing the operation of power systems. At the same time, the energy demand side is also rapidly promoting the transformation of new energy and reducing the use of fossil fuels. However, the demands of energy-consuming equipment further affect the stable operation of power systems. The current effective measure to address this issue is to build an integrated energy system (IES) [1], which can optimize the operation of itself through the coordinated conversion of multiple energies and further tapping the scheduling potential of the load side. A large number of scholars at home and abroad have conducted extensive studies on integrated energy systems. Current research focuses on building a more efficient IES structure [2], improving IES carbon trading strategies [3], further exploring the scheduling potential of IESs on the energy demand side [4,5,6,7,8], constructing IES optimization models that consider the uncertainty of new energy output and load [9,10,11,12,13] and constructing IES optimization models with multiple stakeholders [1,8,14], etc. Although the research of integrated energy systems has achieved many results, there are still many problems that need to be explored and solved.
In recent years, a large number of fuel vehicles have been replaced by electric vehicles (EVs), which effectively alleviates environmental problems caused by the use of fossil fuels. However, the energy demand for batteries that provide energy for EVs is very significant. If EVs undergo disorderly charging and battery swapping, this will have a significant negative impact on the safe and stable operation of IESs. At the same time, the batteries of EVs can be used as energy storage devices to participate in IES scheduling when EVs are not working, which can optimize the operation of IESs and reduce the investment costs of constructing energy storage equipment. Therefore, studying the charging and swapping behaviors of EVs is of great significance.
Currently, domestic and foreign scholars mainly focus on EV charging loads and battery swapping loads prediction, as well as optimizing the operations of charging stations and battery swapping stations. Currently, EV charging loads and battery swapping loads prediction is mostly made on the basis of historical data for charging and battery swapping loads [15,16,17,18], as well as probability distribution functions [19,20,21,22,23,24]. In addition, according to the operating characteristics of different model EVs, the charging loads and battery swapping loads can be predicted. For example, study [25] established an “electric taxi-battery-traffic-station” interconnected system based on the battery swapping mode and predicted the battery swapping demand based on the travel behavior of electric taxis and the battery swapping behavior in the station. Study [26] predicted the battery swapping demand according to bus number, task schedule, bus route, and other parameters. The authors of [27] calculated the battery charging and discharging demand by considering the two-day charging, unloading, and arrival and departure times of electric trucks in factories. However, there has been little research on electric truck (ET) charging and battery swapping behavior based on operating characteristics on fixed routes. Moreover, the EV power supply method is relatively simple, either charging or battery swapping, and few studies have combined considerations of the two modes.
Compared with charging mode, the battery swapping mode of EVs has the advantages of greater scheduling flexibility, fast power supply, easy centralized management, and low green energy losses [28]; thus, the application prospects are very good. However, the battery swapping load of the optimized operation model of the battery swapping station in the current study is generally not adjustable [20,25,26]. The charge and discharge behavior of batteries in the battery swapping station is generally regulated by a group [29,30]. Most batteries can only be swapped when they are fully charged and can only be charged and discharged continuously at constant power until they are full or drained [31,32,33]. In practice, on the basis of meeting the transportation tasks of ETs running on a fixed route, the battery swapping load of ETs can be adjusted to a certain extent; the charging and discharging behavior of each battery can be separately regulated by the battery swapping station; when the battery is swapped on an ET, it does not need to be fully charged; the charging and discharging power of the battery is variable; and the charging and discharging behavior of the battery can also be interrupted.
In view of the above research status and actual needs, firstly, the characteristics of ETs with battery charging and swapping capabilities running on fixed lines were analyzed, and the adjustable load model of ETs based on meeting transportation tasks was established. Furthermore, the operation model of the electric truck battery swapping station (ETBSS) was constructed, in which the charging and discharging power of each battery is variable, the charging and discharging behavior of each battery can be interrupted, and the battery does not need to be fully charged during swapping. Combined with an ETBSS operating model, the IES model that contained an ETBSS was established using a gas turbine with an adjustable thermoelectric ratio, while a waste heat boiler of heat output was used for the cooling and heating adjustable ratio, taking into account various flexible loads. Based on the above model, an optimized scheduling model of the IES with an ETBSS was established to calculate the carbon emissions costs of the IES using a stepped carbon trading mechanism. Based on meeting the demands of ET charging and battery swapping and coordinating the electrical, thermal and cooling energies of the IES, the scheduling strategy optimizes IES operation with the goal of reducing carbon emissions and improving the economics and the ability to absorb new energy of IES. Finally, CPLEX software was used to solve the simulation examples, and a variety of cases were set for comparative analysis to verify the economics and the low-carbon and new energy consumption abilities of the proposed model.
2. IES with an ETBSS Structure and Model Building
The basic structure of an IES containing an ETBSS, which integrates electrical, thermal, and cooling loads, is shown in Figure 1. It mainly includes three parts: the energy supply side, the conversion side, and the demand side. The energy supply side involves the power distribution network, gas network, wind turbine (WT), and photovoltaic (PV); the energy conversion side contains the gas turbine (GT), waste heat boiler (WHB), absorption cooler (AC), heat pump (HP), and electric cooler (EC); the energy demand side comprises the electrical, thermal, and cooling loads containing various flexible loads.
In the IES, the electricity is mainly supplied by the WT and PV, and the insufficient part can be obtained from the ETBSS, the power distribution network, and the GT. Thermal energy is provided by the WHB, HP, and accumulator tank (AT); cooling energy is provided by the AC and EC.
2.1. ET and ETBSS Models
Currently, ETs are mainly used for freight transportation on fixed lines. ETs can use battery swapping mode to improve their efficiency during working hours; during non-working hours, ETs are connected to the ETBSS via charge and discharge equipment to participate in IES scheduling. This research explores the optimal ETBSS scheduling under the case that the ETBSS can complete two or more round-trip operations with a battery swap. On the premise of meeting the transportation task of ETs, the number of battery swaps of ETs and the number of round-trip operations supported by each battery swap can be flexibly adjusted in order to adjust an ET’s battery swapping load. The idea of constructing the ETBSS model is shown in Figure 2.
In order to ensure the service life of an ET battery, undesirable charging and discharging behavior should be prevented. And in order to reserve a certain spare electrical energy for the ET, the state of charge (SOC) of the battery in this research was kept between 20% and 95% [26]. In order to simplify the calculation process and ensure that the simulation results did not deviate too much from actual situations, the following assumptions were made:
- (1)
- The ET battery is the same model as the battery in the ETBSS, and the ET can complete a round-trip operation and battery swap within a period of time.
- (2)
- The electricity of the ETBSS’s batteries at the initial moment of the battery swapping period should meet the power demands of ET users during the period, and the batteries swapped by the ETs can only start charging and discharging in the next period; that is, the impact of ET arrival time on the ETBSS charge and discharge plan is not considered.
- (3)
- A charge and discharge chamber can only charge or discharge a battery in a certain period of time.
- (4)
- The number of battery storage locations in the ETBSS is the same as the number of batteries in the ETBSS.
2.1.1. Modeling of ET Battery Swapping Load
According to the total number of round-trip running of an ET, the number of round-trip running that the SOC of battery swapped to the ET needs to support in each period can be obtained. The SOC of battery that is swapped to the ET at each time period needs to meet the power demand of the ET, so the following constraints shown in Equation (1) must be met:
where is the number of round-trip running that the SOC of battery swapped from the ETBSS to the ET needs to support in the time period (its value is 0, indicating that the battery of the ET is not swapped); is the total number of round-trip running of the ET; refers to the number of round-trip running that the battery power in the ET can support when it starts running; is the period when the ET starts running; and indicates the total number of time segments in a scheduling cycle.
Due to the battery capacity limitation, the battery on the ET can only support the ET for a limited number of round trips, so the value ranges of and are shown in Equation (2):
where is the maximum number of round-trip running that can be completed by a battery swap.
In addition, the of the same ET in different time periods affect each other, so the of the same ET needs to meet the following constraints shown in Equation (3):
In the equation, the value of of the same ET in the time period will affect the value of of the same ET in the time period after the time period. In addition, the value of of the ET in the last few time periods is also constrained by the remaining number of round-trip running.
Due to limitations in the numbers of battery swapping equipment and the time to complete a battery swap, the ETBSS can provide a limited number of battery swaps in a period of time, so the total number of ET battery swaps in a period of time needs to meet the following constraints shown in Equation (4):
where refers to the number of ETs, refers to the battery swapping status of the ET during the operating period (swapped with 1, not swapped with 0), and refers to the maximum number of battery swaps that the ETBSS can provide within a period of time.
2.1.2. ET Battery Swapping Model
The ET battery swapping model shown in Equation (5) is obtained through the corresponding relationship between the batteries on ETs in each time period and the batteries at each position in the ETBSS, as follows:
where is the storage location number in the ETBSS of the battery that was swapped from the ETBSS to the ET during the period (a value of 0 indicates that it is not swapped); is the total number of batteries (storage locations) in the ETBSS.
The storage location number in the ETBSS of the batteries that are swapped from the ETBSS to ETs during the same time period cannot be the same, so the in a time period must meet the constraints shown in Equation (6):
In the equation, and are the storage location numbers in the ETBSS of the batteries swapped from the ETBSS to the ET and the ET during the time period, respectively; if and are not all 0, then and cannot be the same.
2.1.3. ETBSS Battery Swapping Model
Based on the swap correspondence between the batteries on the ET and the batteries in the ETBSS, the round-trip operation times supported by battery SOC at the initial moment of each time period for a battery participating in the swapping in the ETBSS can be obtained, as shown in Equation (7). The SOCs of batteries swapped from a ET to the ETBSS in each time period constraint are shown in Equation (8). The minimum SOC constraints at the beginning of each time period for batteries at various locations in the ETBSS are shown in Equation (9), as follows:
where is the number of round-trip running supported by the SOC at the initial moment of time period for a battery to be swapped in the storage position in the ETBSS (its value is 0, indicating that the battery is not replaced); and are the average charging SOC and average discharging SOC of batteries in the ETBSS at the position in time period, respectively. is the SOC of a battery in the ETBSS at the position at the beginning of time period ; and are the average charging SOC and average discharging SOC of the battery in the ET in the time period, respectively. is the SOC of the battery in the ET at the beginning of time period ; is the SOC required for an ET to complete a round-trip operation; is the minimum SOC for battery operation; and indicates the duration of a period.
2.1.4. ETBSS Battery Charging and Discharging Model
Due to limitations in the charge and discharge power and capacity of battery in the ETBSS, , , and need to meet the following constraints shown in Equation (10):
where and are the maximum average charging power and maximum average discharging power of the battery within a period of time in the ETBSS, respectively. indicates the capacity of the battery.
Thus, the charge and discharge model of the battery in the ETBSS, as shown in Equation (11), can be obtained as follows:
Since only a battery can be charged or discharged in the charging and discharging equipment within a period of time, the following constraints shown in Equation (12) must be met:
where and are the charging and discharging states of the battery in the ETBSS at the position in the time period; if is 1, the battery in the ETBSS is in charge state, and if is 0, the battery in the ETBSS is not in charge state; if is 1, the battery in the ETBSS is in discharge state, and if is 0, the battery in the ETBSS is not in discharge state.
Due to limitations in the number of charge and discharge equipment in the ETBSS, the number of batteries in the charged and discharged states at each time period should meet the following constraints shown in Equation (13):
where is the number of charge and discharge equipment.
2.1.5. ET Battery Charging and Discharging Model
Due to limitations in the charging and discharging power and capacity of battery in an ET, , , and should meet the following constraints shown in Equation (14):
where and are the maximum average charging power and maximum average discharging power of the battery within a period of time in an ET, respectively.
ETs use the battery swapping mode to improve work efficiency during working hours and are connected to the ETBSS through charging and discharging equipment during non-working hours. Therefore, the charge and discharge model of a battery on an ET is shown in Equation (15):
In the equation, when the battery in the ET does not participate in battery swapping during the time period, the is obtained from the charging and discharging situation of the battery in the ET in the previous time period. When the battery in the ET participates in battery swapping during the time period, the is determined by the battery swapped from the ETBSS to the ET during the time period.
2.2. GT Model with Adjustable Thermoelectric Ratio
A GT with an adjustable thermoelectric ratio can change the ratio of electrical and thermal output for each time period, which can optimize IES operation. The working model is shown in Equation (16), as follows:
where , , and are the total average power, average generation electrical power, and average generation thermal power generated by the GT during time period, respectively. is the efficiency of the GT; is the average gas consumption rate of the GT during period; is the calorific value of natural gas; and and are the minimum and maximum thermoelectric ratios of the GT, respectively.
2.3. WHB Running Model
The WHB heat output is used for heating and AC cooling, and adjusting the ratio of WHB heat generation to heating and AC cooling for each time period can optimize IES operation. The working model is shown in Equation (17), as follows:
where is the average heating power of the WHB during time period; is the efficiency of the WHB; and and are parts of the average heating power of the WHB used for heating and for AC refrigeration in period, respectively.
The device models of the WT and PV are referred to in study [34]. The device models of the AC and EC are referred to in study [35]. The equipment model of the HB can be found in study [36]. The AT adopts the general model under the generalized energy storage system [37]. According to its characteristics, flexible loads can be divided into three categories: transferable loads, translatable loads, and reducible loads. For the corresponding load models, refer to study [38].
3. IES with an ETBSS Optimization Scheduling Model
3.1. Objective Function
Based on the IES with an ETBSS model, the IES with an ETBSS-optimized scheduling model is proposed, which converts carbon emissions, battery life decay, and new energy utilization into economic indicators and integrates them into the objective function. Therefore, its objective function includes the energy purchase cost , the equipment operation and maintenance cost , the flexible load compensation cost , the battery life decay cost , the stepped carbon trading cost , and WT and PV abandonment penalty cost of the entire IES. The specific model is shown in the following Equations (18)–(22):
where is the time-of-use electricity prices; is the price of natural gas of per unit volume; is the average electrical power purchased during the time period ; is the unit power operating cost factor of device k; is the daily maintenance cost of per unit power capacity of device k; is the average output power of device k during time period ; is the capacity of device k (k is 1, 2…8, and 9, representing the PV, WT, ETBSS, GT, WHB, AC, EC, HP, and AT, respectively); and and are the loss costs of charging and discharging 1 electrical energy of a battery, respectively. is the unit penalty cost of abandoned WT and PV; and and are the predicted output of the PV and WT during time period , respectively. and are the actual consumptions of the PV and WT during time period , respectively.
3.2. Constraints
3.2.1. Energy Balance Constraints
IES energy flow in this research includes electrical energy flow, thermal energy flow, and cooling energy flow, all of which must meet the following energy balance constraints shown in Equation (23):
In the equation, and are the average electrical power of the HB and EC in time period, respectively. is the average electrical power of the basic electric load in time period ; is the maximum average electrical power of the transferable electrical load in time period before optimization; is the average electrical power that is transferred of the transferable electric load in time period after optimization; is the average electrical power of the transferable electric load optimized for transfer to time period ; is the average electrical power of the translatable electric load after optimization in time period; is the maximum average electrical power of the reducible electric load during a period of before optimization; is the average electrical power that is curtailed of the reducible electric load after optimization in time period; and are the charging and discharging efficiency of the battery, respectively; and is the average thermal power of the HP during period. and are the average thermal power stored and released from the AT during period, respectively. and are the average thermal power of the basic heat load and the translatable heat load after optimization during period, respectively. is the maximum average thermal power of the reducible heat load during period before optimization. is the average thermal power that be curtailed of the reducible thermal load after optimization during period. and are the average cooling powers of the AC and EC in time period, respectively. and are average cooling powers of the basic cooling load and the translatable cooling load after optimization during period, respectively. is the maximum average cooling power of the reducible cooling load during period before optimization. is the average cooling power that be curtailed of the reducible cooling load after optimization during period.
3.2.2. Power Constraints of Energy Conversion Equipment
Due to limitations in the capacity and power output change rate, the output power of various energy conversion devices needs to satisfy the relevant constraints, as shown in Equation (24):
where is the average output power of device during time period; and are the maximum and minimum average output powers of device in a period of time, respectively; and is the upper limit of climbing power of device (the values of are 1, 2…5, and 6, which stand for the GT, WHB, AC, EC, HP, and AT, respectively).
3.2.3. Energy Trading Constraints
Due to power flow constraints of the power system and the capacity constraints of GT, the energy purchased from the power distribution network and the natural gas purchased from the gas network by the IES during each time period need to meet the following constraints of Equation (25):
where is the maximum average electrical power purchased for the IES in a time period; and indicates the maximum value of the IES’s average natural gas consumption rate in a time period.
For the PV and WP output constraints, refer to study [40].
3.3. Model Solving
Based on the mathematical model for optimizing scheduling of the IES with an ETBSS, a simulation model for optimizing their scheduling was built on MATLAB platform. Optimizing the scheduling model of the IES with an ETBSS in this research belongs to a type of mixed-integer linear programming problem. Therefore, the simulation model in this research uses MATLAB platform to call the CPLEX solver for a solution to this problem.
4. Analysis of Simulation Example
4.1. Basic Data
A community IES was selected as the research object, and its scheduling cycle was 24 h, with 1 h as the unit scheduling period. In order to reduce the operation time of the optimization model and achieve the expected results, the parameters selected in the example are small; alternately, a larger parameter can be selected, but more running time is required. The various equipment parameters are shown in Table 1 below; the relevant parameters of carbon trading are shown in Table 2; the relevant parameters of energy trading are shown in Table 3; and the electricity price adopts the time-of-use prices shown in Table 4. The fixed price of natural gas is 2.55 CNY/m3, and the calorific value of natural gas is 9.87 [41]. The predicted outputs of the WP and PV are shown in Figure 3. The components of each flexible part of the electrical, thermal and cooling loads before optimization are shown in Figure 4a–c, and the corresponding parameters are shown in Table 5.
4.2. Influence of ETBSS-Optimized Scheduling on IES Operation
In order to verify the rationality of the model proposed in this study, five optimization models for IESs in different cases were constructed for comparative analysis. The relevant parameters of the optimization models for each case are shown in Table 6, and the solution results of the optimization simulation models for each case are shown in Table 7.
Compared with case 1, the optimal scheduling of cases 2 and 3 does not play an electrical energy storage role for the ET; the ETBSS in case 4 and case 5 does not participate in scheduling. The ETBSS output of each case is shown in Figure 5 (positive value indicates ETBSS discharge, and negative value indicates ETBSS charging).
As can be seen from Figure 5, the batteries in cases 1 and 2 replenish electrical energy when the load of the IES is low and release electrical energy when the load of the IES is high. The electrical energy storage capacity in case 1 is provided by batteries in the ETBSS and ETs, which is larger than that provided only by the batteries in the ETBSS in case 2, so it is better optimized for the IES. In case 3, the ETBSS can only supplement the power when the load of the IES is low and cannot release the power when the load of the IES is high. In case 4, the ETBSS can only supplement the power when the load is high. In case 5, all of the batteries in the ETBSS replenish electrical energy at night and cannot absorb photovoltaic power during the day. Combined with Table 7, it can be seen that the energy storage function of ETs and the ETBSS can play a better role in filling peaks and valleys and can more efficiently reduce the operating costs and carbon emissions and improve the utilization rate of new energy of the IES.
5. Conclusions
The differences between the operational models of ETs and ETBSSs with flexible charging and discharging and other charging and discharging station models for EVs are shown in Table 8.
According to the contents in Table 8, combined with the above IES simulation example that includes the ETBSS, the following conclusions can be drawn:
- Under the premise of meeting the transportation tasks of ETs, the energy demands of ETs with integrated charging and battery swapping running on a fixed line can be adjusted within a certain range.
- Combined with the above simulation examples, it can be seen that an IES that adopts integrated charging and battery swapping in ETs and orderly charging and discharging operation modes in the ETBSS can better play an energy storage role for the ETBSS and ET batteries on the basis of meeting the energy supply requirements of ETs, as well as coordinate the electrical, thermal and cooling energies of the IES; this makes the economics of the IES better, as well as the abilities to absorb new energy and reduce carbon emissions. In the above simulation example, compared with the IES that adopts the battery swapping mode in ETs and the unordered charge mode in the ETBSS, the IES that adopts the integrated charge and battery swapping mode in ETs and the orderly charge and discharge modes in the ETBSS reduces the operating costs by CNY 819, reduces carbon emissions by 414 kg, improves the utilization rate of WP and PV by 0.3%, and fully utilizes WT and PV.
The optimized IES with an ETBSS scheduling scheme proposed in this paper takes the ETBSS and IES as a whole; however, in practice, the ETBSS and IES may have different interest demands. Moreover, the next-day new energy output and load in the IES optimization model cannot obtain accurate values in advance; only inaccurate predicted values can be obtained. However, the optimized operation scheme in this research is based on the predicted values of new energy output and load, so the operation scheme may be different from actual situations. In the future, we can further study the optimal scheduling method of energy supply systems with ETBSSs and IESs as different subjects of interest, considering the uncertainty of loads and new energy outputs.
Author Contributions
Conceptualization, J.C.; software, B.L.; validation, K.C.; formal analysis, Y.Z.; investigation, L.L.; resources, N.Z.; writing—original draft preparation, B.L.; supervision, H.B.; project administration, J.L. All authors have read and agreed to the published version of the manuscript.
Funding
This research was funded by major science and technology projects of Xinjiang Uygur Autonomous Region, grant number 2022A1001-3.
Data Availability Statement
Data are contained within the article.
Conflicts of Interest
Authors Jun Liu, Yuchao Zhang, Hongyin Bao, Lili Liu, Kang Chen were employed by the company China Shipbuilding Haiwei New Energy Company. The remaining authors declare that the research was conducted in the absence of any commercial or financial relationships that could be construed as a potential conflict of interest.
References
- Bai, L.; Li, F.; Cui, H.; Jiang, T.; Sun, H.; Zhu, J. Interval optimization based operating strategy for gas-electricity integrated energy systems considering demand response and wind uncertainty. Appl. Energy 2016, 167, 270–279. [Google Scholar] [CrossRef]
- Liu, Z.; Liu, R.; Liang, N.; Liu, X. Day-ahead optimal economic dispatching strategy for micro energy-grid with P2G. Trans. China Electrotech. Soc. 2020, 35, 535–543. [Google Scholar]
- Chen, J.; Hu, Z.; Chen, Y.; Chen, J.; Chen, W.; Gao, M.; Lin, M.; Du, Y. Thermoelectric optimization of integrated energy system considering ladder-type carbon trading mechanism and electric hydrogen production. Electr. Autom. Equip. 2021, 41, 48–55. [Google Scholar]
- Zhang, J.; Kong, D.; He, Y.; Fu, X.; Zhao, X.; Yao, G.; Teng, F.; Qin, Y. Bi-layer energy optimal scheduling of regional integrated energy system considering variable correlations. Int. J. Electr. Power Energy Syst. 2023, 148, 108840. [Google Scholar] [CrossRef]
- Wang, Y.; Zhou, M.; Zhang, F.; Zhang, Y.; Ma, Y.; Dong, H.; Zhang, D.; Liu, L. Chinese grid investment based on transmission and distribution tariff policy: An optimal coordination between capacity and demand. Energy 2021, 219, 119589. [Google Scholar] [CrossRef]
- Hao, H.; Zhou, B.; Zhang, X. Research of integrated energy system optimization carbon trading and demand response. Northeast Power Technol. 2022, 43, 32–37+43. [Google Scholar]
- Chen, W.; Ran, Y.; Han, Y.; Li, Q. Optimal scheduling of regional integrated energy systems under two-stage power to gas. J. Southwest Jiaotong Univ. 2023, 58, 1221–1230. [Google Scholar]
- Zhu, X.; Sun, Y.; Yang, J.; Dou, Z.; Li, G.; Xu, C.; Wen, Y. Day-ahead energy pricing and management method for regional integrated energy systems considering multi-energy demand responses. Energy 2022, 251, 123914. [Google Scholar] [CrossRef]
- Li, Y.; Zou, Y.; Tan, Y.; Cao, Y.; Liu, X.; Shahidehpour, M.; Tian, S.; Bu, F. Optimal stochastic operation of integrated low-carbon electric power, natural gas, and heat delivery system. IEEE Trans Sustain. Energy 2018, 9, 273–283. [Google Scholar] [CrossRef]
- Wang, R.; Gu, W.; Wu, Z. Economic and optimal operation of a combined heat and power microgrid with renewable energy resources. Power Syst. Autom. 2011, 35, 22–27. [Google Scholar]
- Azizipanah-Abarghooee, R.; Niknam, T.; Bina, M.A.; Zare, M. Coordination of combined heat and power-thermal-wind-photovoltaic units in economic load dispatch using chance-constrained and jointly distributed random variables methods. Energy 2015, 79, 50–67. [Google Scholar] [CrossRef]
- Zhu, J.; Liu, Y.; Xu, L.; Jiang, Z.; Ma, C. Robust day–ahead economic dispatch of microgrid with combined heat and power system considering wind power consumption. Power Syst. Autom. 2019, 43, 40–48. [Google Scholar]
- Peng, C.; Xie, P.; Zhan, J.; Sun, H. Robust economic dispatch of microgrid using improved bacterial foraging algorithm. Power Grid Technol. 2014, 38, 2392–2398. [Google Scholar]
- Wang, C.; Yan, C.; Li, G.; Liu, S.; Bie, Z. Risk assessment of integrated electricity and heat system with independent energy operators based on Stackelberg game. Energy 2020, 198, 117349. [Google Scholar] [CrossRef]
- Xu, X. Research on Short-Term Load Forecasting of Electric Vehicle Charging Station. Master’s Thesis, North China Electric Power University, Baoding, China, 2016. [Google Scholar]
- Liu, W.; Xu, X.; Zhou, X. Daily load forecasting based on SVM for electric bus charging station. Electr. Power Autom. Equip. 2014, 34, 41–47. [Google Scholar]
- Zhang, X.; Chan, K.W.; Li, H.; Wang, H.; Qiu, J.; Wang, G. Deep-learning-based probabilistic forecasting of electric vehicle charging load with a novel Queuing model. IEEE Trans. Cybern. 2021, 51, 3157–3170. [Google Scholar] [CrossRef] [PubMed]
- Quevedo, P.M.; Muñoz-Delgado, G.; Contreras, J. Impact of electric vehicles on the expansion planning of distribution systems considering renewable energy, storage, and charging stations. IEEE Trans. Smart Grid 2019, 10, 794–804. [Google Scholar] [CrossRef]
- Fan, M.; Zhang, Y.; Kang, J.; Yu, Y. Fuzzy clustering-markov chain based load forecasting modeling for battery-swap stations. Electr. Power Constr. 2023, 44, 63–71. [Google Scholar]
- Yan, X.; Lu, J.; Jia, J.; Qi, B.; Xu, X.; Li, Y. A multi-objective optimal dispatch of microgrid with cyclic swapping loads and charging stations. J. North China Electr. Power Univ. 2022, 7, 1–12. [Google Scholar]
- Luo, J.; Zhang, W.; Wang, G.; Zhang, S. An electric vehicle charging demand forecast model based on trip chain data. J. Chongqing Univ. Technol. Nat. Sci. 2020, 34, 1–8. [Google Scholar]
- Jackson, D.; Cao, Y.; Beil, I. Bi-level optimization framework for heavy-duty electric truck charging station design. In Proceedings of the 2022 IEEE Transportation Electrification Conference & Expo (ITEC), Anaheim, CA, USA, 15–17 June 2022; pp. 563–568. [Google Scholar]
- Jia, S.; Kang, X.; Cui, J.; Tian, B.; Zhang, J.; Xiao, S. Multi-layer coordinated optimization of integrated energy system with electric vehicles based on feedback correction. Front. Energy Res. 2022, 10, 1008042. [Google Scholar] [CrossRef]
- Jia, S.; Kang, X.; Cui, J.; Tian, B.; Xiao, S. Hierarchical stochastic optimal scheduling of electric thermal hydrogen integrated energy system considering electric vehicles. Energies 2022, 15, 5509. [Google Scholar] [CrossRef]
- Fu, Z.; Zhu, W.; Zhu, J.; Yuan, Y.; Feng, Y.; Wang, H. Battery swapping demand prediction of electric taxis and charging optimization strategy of battery swapping station under “electric taxi-battery-traffic-station” interconnection. Electr. Power Autom. Equip. 2022, 42, 116–124. [Google Scholar]
- Cai, Z.; Shu, H.; Shan, J. Optimal dispatching strategy for battery swapping of electric bus cluster considering operation cost. Autom. Electr. Power Syst. 2022, 46, 205–217. [Google Scholar]
- Razi, R.; Hajar, K.; Hably, A.; Mehrasa, M.; Bacha, S.; Labonne, A. Assessment of predictive smart charging for electric trucks: A case study in fast private charging stations. In Proceedings of the 2022 IEEE International Conference on Electrical Sciences and Technologies in Maghreb (CISTEM), Tunis, Tunisia, 26–28 October 2022; Volume 4, pp. 1–6. [Google Scholar]
- Tian, W.; He, J.; Jiang, J.; Niu, L.; Wang, X. Multi-objective optimization of charging dispatching for electric vehicle battery swapping station based on adaptive mutation particle swarm optimization. Power Syst. Technol. 2012, 36, 25–29. [Google Scholar]
- Meng, X.; Mi, Z.; Wang, J.; Dong, K.; Cai, X.; Han, S. An economic and optimal dispatch model for battery swapping stations containing photovoltaics considering variable-speed charging mechanism. Zhejiang Electric Power 2022, 41, 35–41. [Google Scholar]
- Liu, H.; Shen, H.; Hu, W.; Ji, L.; Li, J.; Yu, Y. Load forecast of electric trucks aggregation based on higher-order markov chains. Electr. Power 2023, 8, 1203–1207. [Google Scholar]
- Li, Y.; Zhao, Y.; Cui, Y.; Zhong, W.; Li, H. Low-carbon economic dispatching of battery swapping station and wind power-carbon capture virtual power plant considering charging and discharging strategy. Electr. Power Autom. Equip. 2023, 43, 27–36. [Google Scholar]
- Luo, H.; Zhang, X.; Li, Y.; Yu, H.; Peng, F.; Li, J. Low carbon economic scheduling of virtual power plants with wind power, carbon capture, charge and change station considering charge discharge strategy. Mod. Electr. Power 2023, 8, 1–10. [Google Scholar]
- Jiao, H.; Yu, A.; Wang, Y. Low-carbon economic dispatch of an integrated energy system considering battery swapping stations. Energy Storage Sci. Technol. 2023, 12, 3254–3264. [Google Scholar]
- Lin, S.; Liu, C.; Shen, Y.; Li, F.; Li, D.; Fu, Y. Stochastic planning of integrated energy system via Frank-Copula function and case reduction. IEEE Trans. Smart Grid 2021, 13, 202–212. [Google Scholar] [CrossRef]
- Wu, F.; Liu, X.; Sun, Y.; Chen, N.; Yuan, T.; Gao, B. Game optimization strategy for multiple parks based on combined cooling heating and power. Autom. Electr. Power Syst. 2018, 42, 68–75. [Google Scholar]
- Zhang, E.; Tai, N.; Chen, Y.; Yao, W.; Huang, W.; Zhao, S. A coordination strategy to smooth power fluctuation of distributed generation in integrated energy system based on virtual energy storage. Power Gener. Technol. 2020, 41, 30–40. [Google Scholar]
- Cheng, S.; Huang, T.; Wai, R. Multi-time-scale optimal scheduling of CCHP microgrid with ice-storage air-conditioning. Autom. Electr. Power Syst. 2019, 43, 30–38. [Google Scholar]
- Jiang, W.; Yan, Z.; Cao, J.; Xu, X. Multi-objective comprehensive optimal dispatch of energy hub considering flexible load. Electr. Meas. Instrum. 2018, 55, 31–39. [Google Scholar]
- Cui, Y.; Zeng, P.; Zhong, W.; Cui, W.; Zhao, Y. Low-carbon economic dispatch of electricity-gas-heat integrated energy system based on ladder-type carbon trading. Electr. Power Autom. Equip. 2021, 41, 10–17. [Google Scholar]
- Xue, K.; Chu, Y.; Ling, Z.; Li, Z. Low-carbon economic optimal dispatch of integrated energy system considering flexible load. Renew. Energy Resour. 2019, 37, 1206–1213. [Google Scholar]
- Wang, Z.; Shi, Y.; Tang, Y.; Men, X.; Cao, J.; Wang, H. Low carbon economy operation and energy efficiency analysis of integrated energy systems considering LCA energy chain and carbon trading mechanism. CSEE J. Power Energy Syst. 2019, 39, 1614–1626+1858. [Google Scholar]
Figure 1.
IES with an ETBSS architecture diagram.
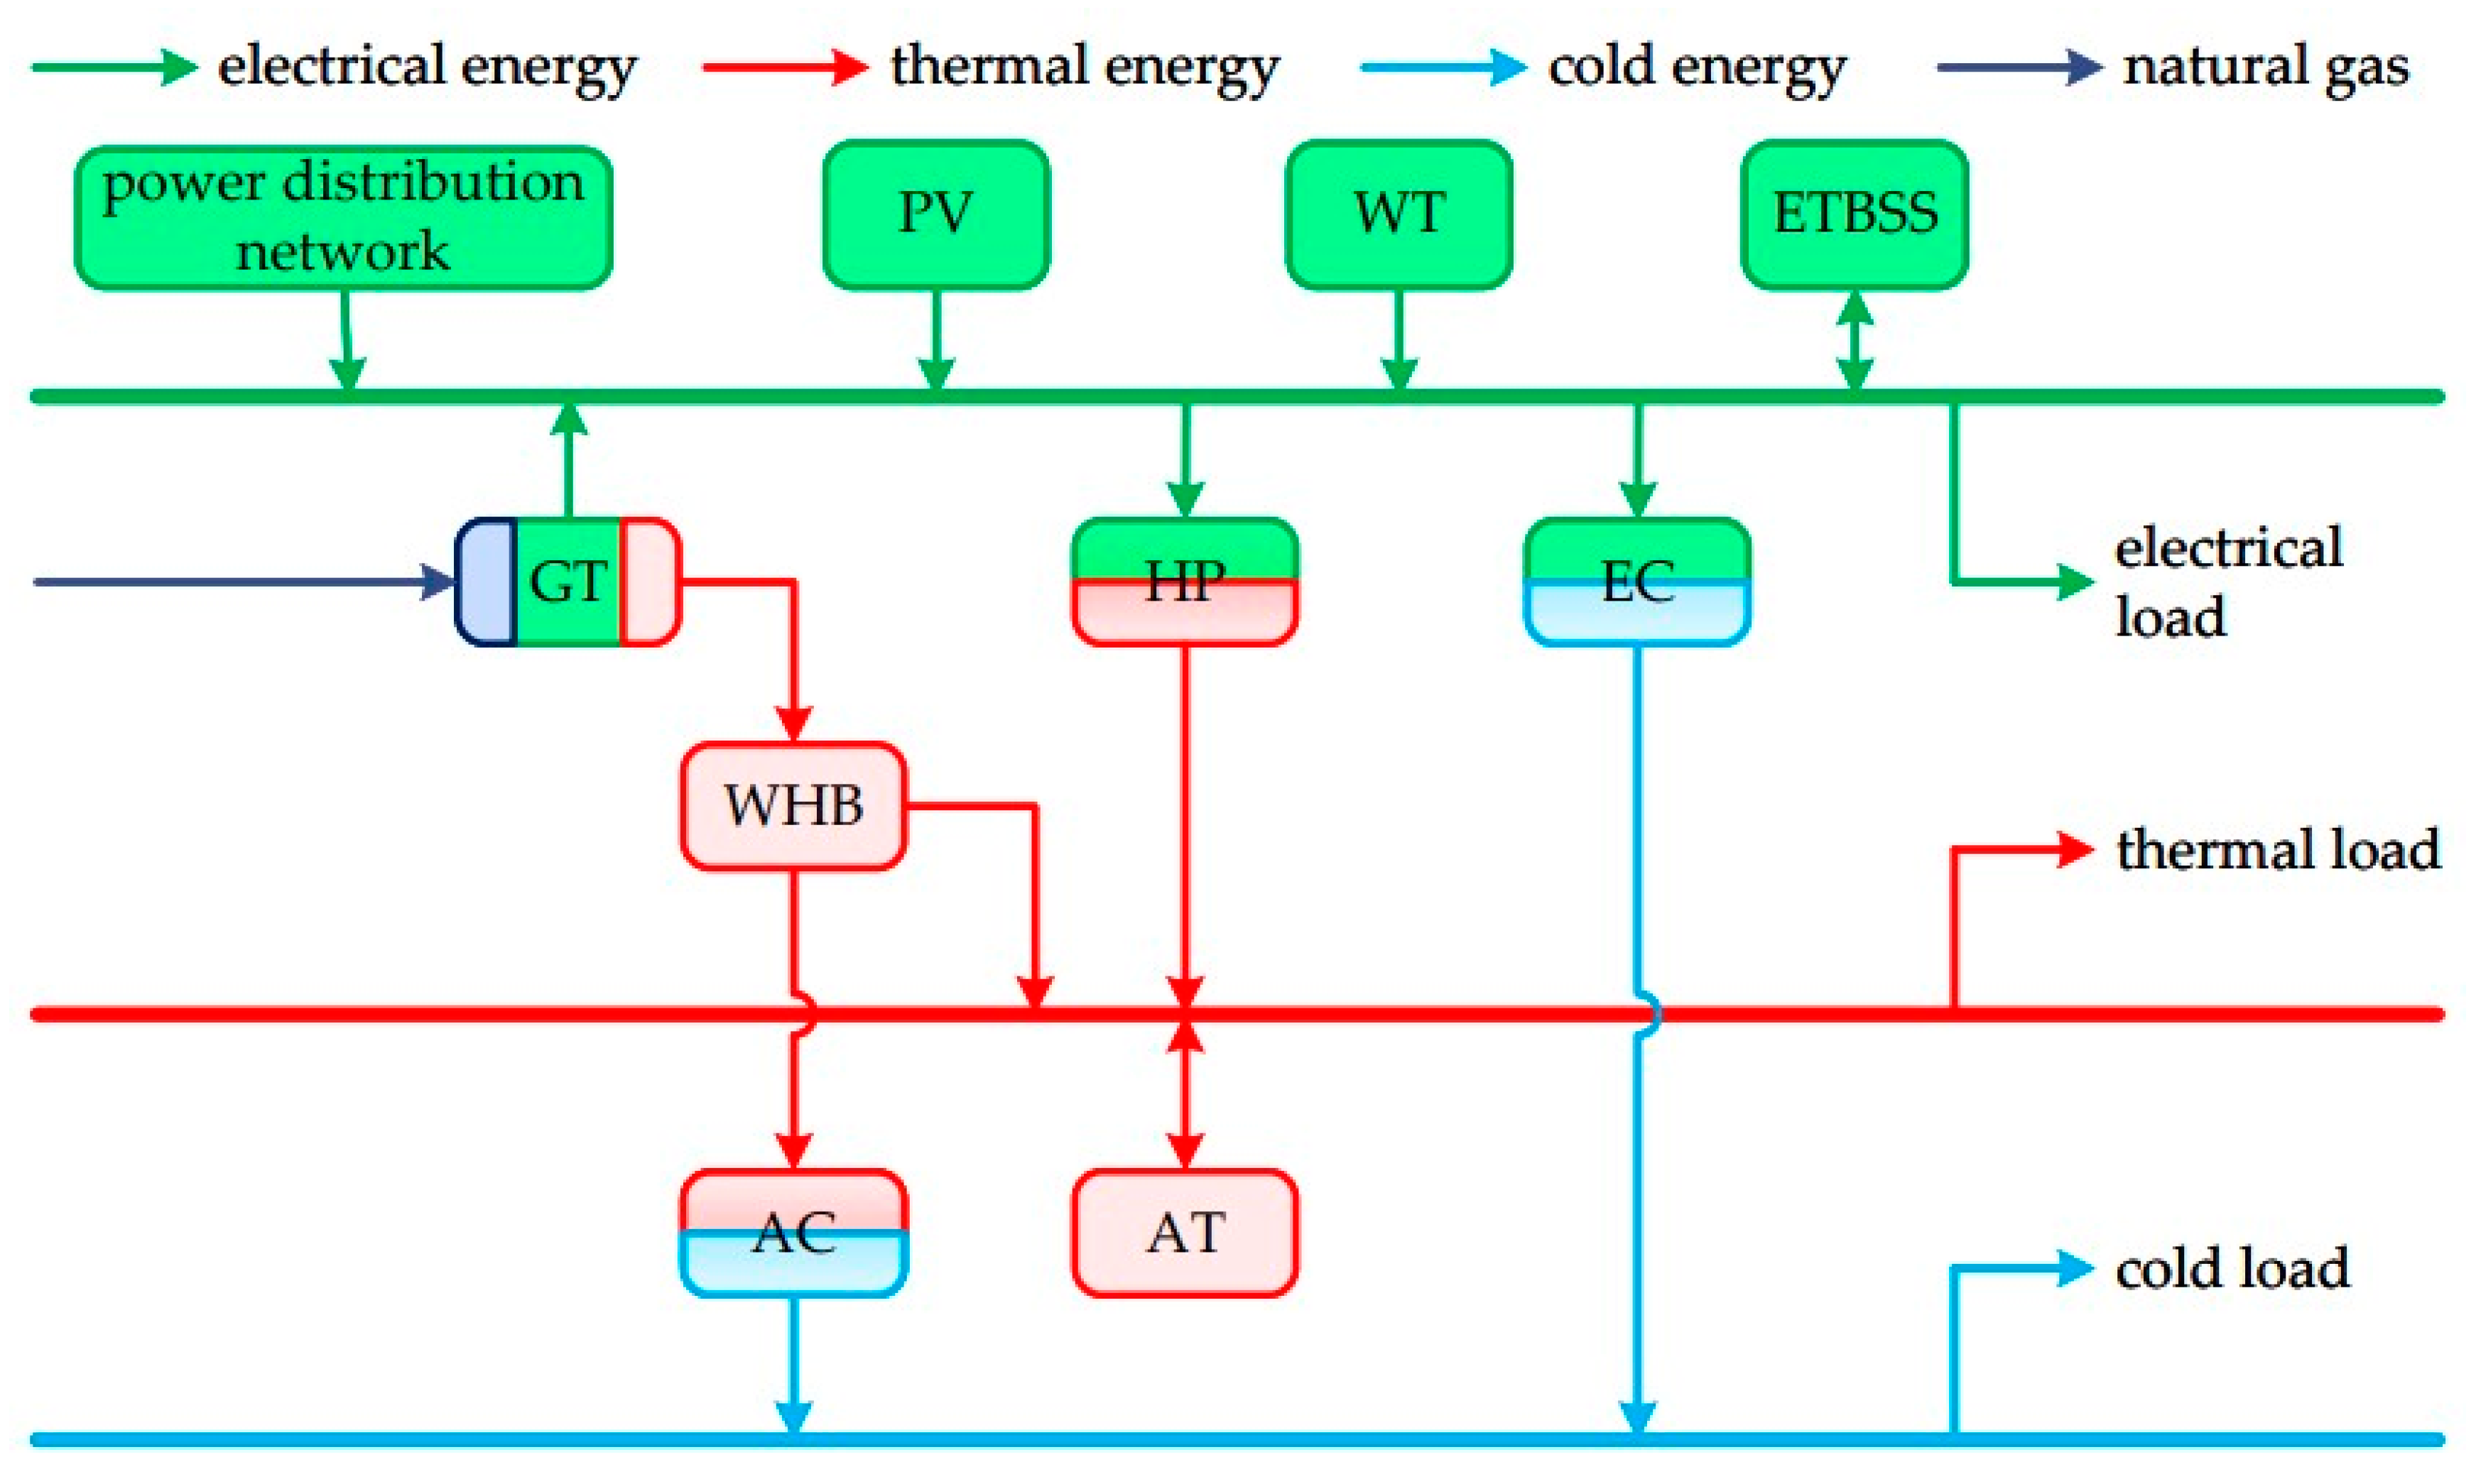
Figure 2.
ETBSS model construction idea diagram.
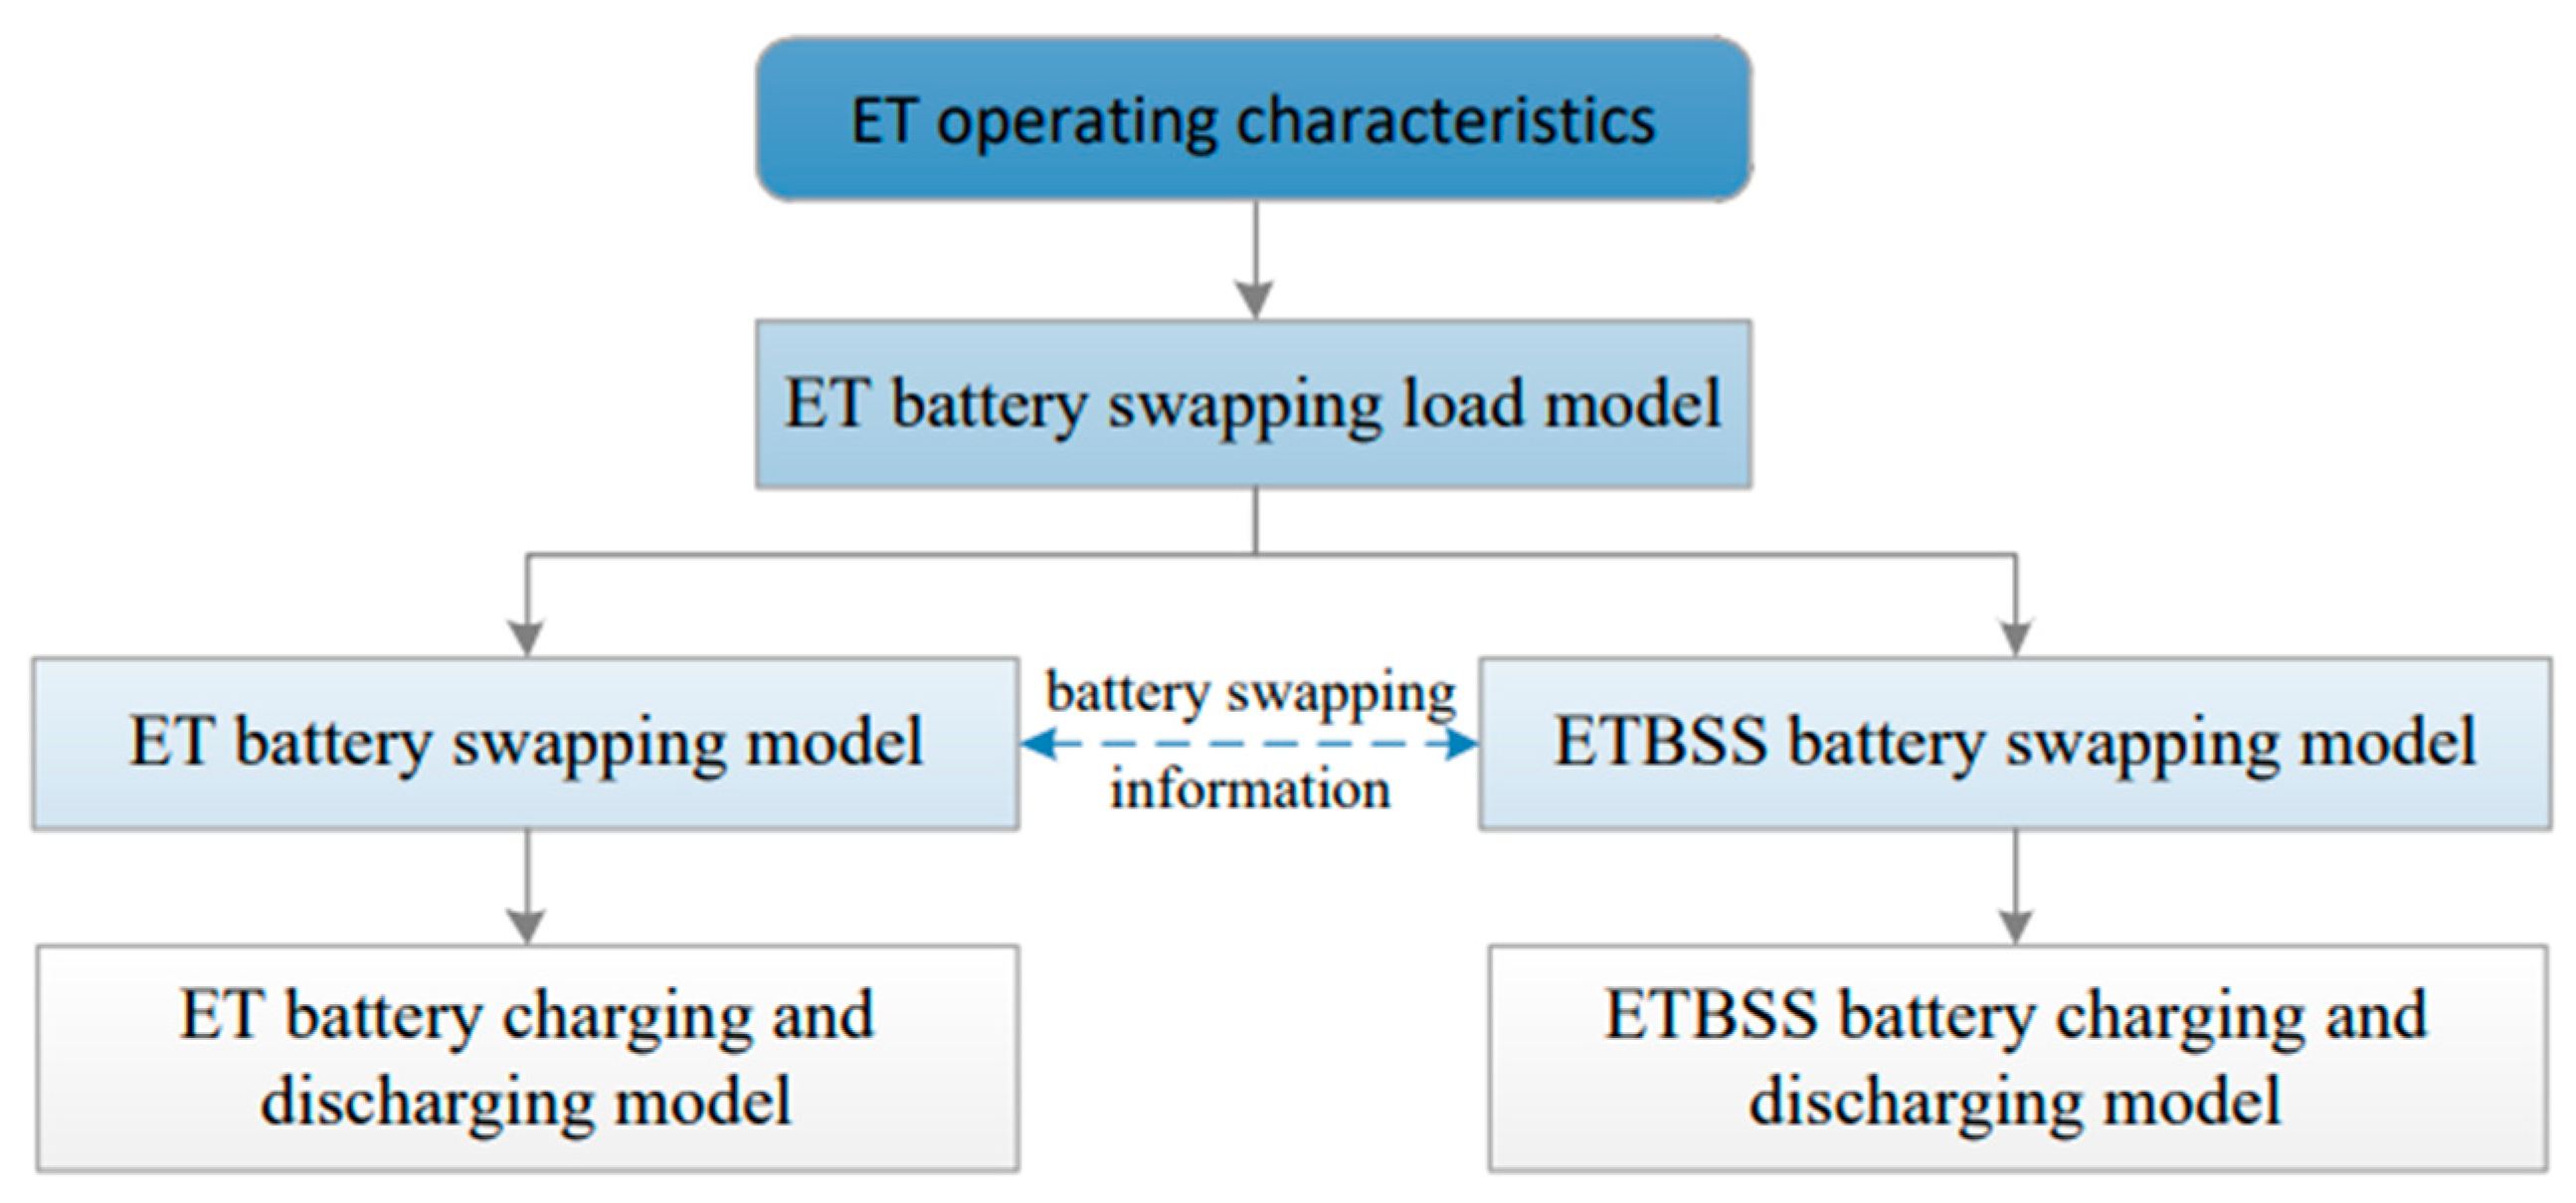
Figure 3.
Chart of maximum output (forecast output) of new energy.
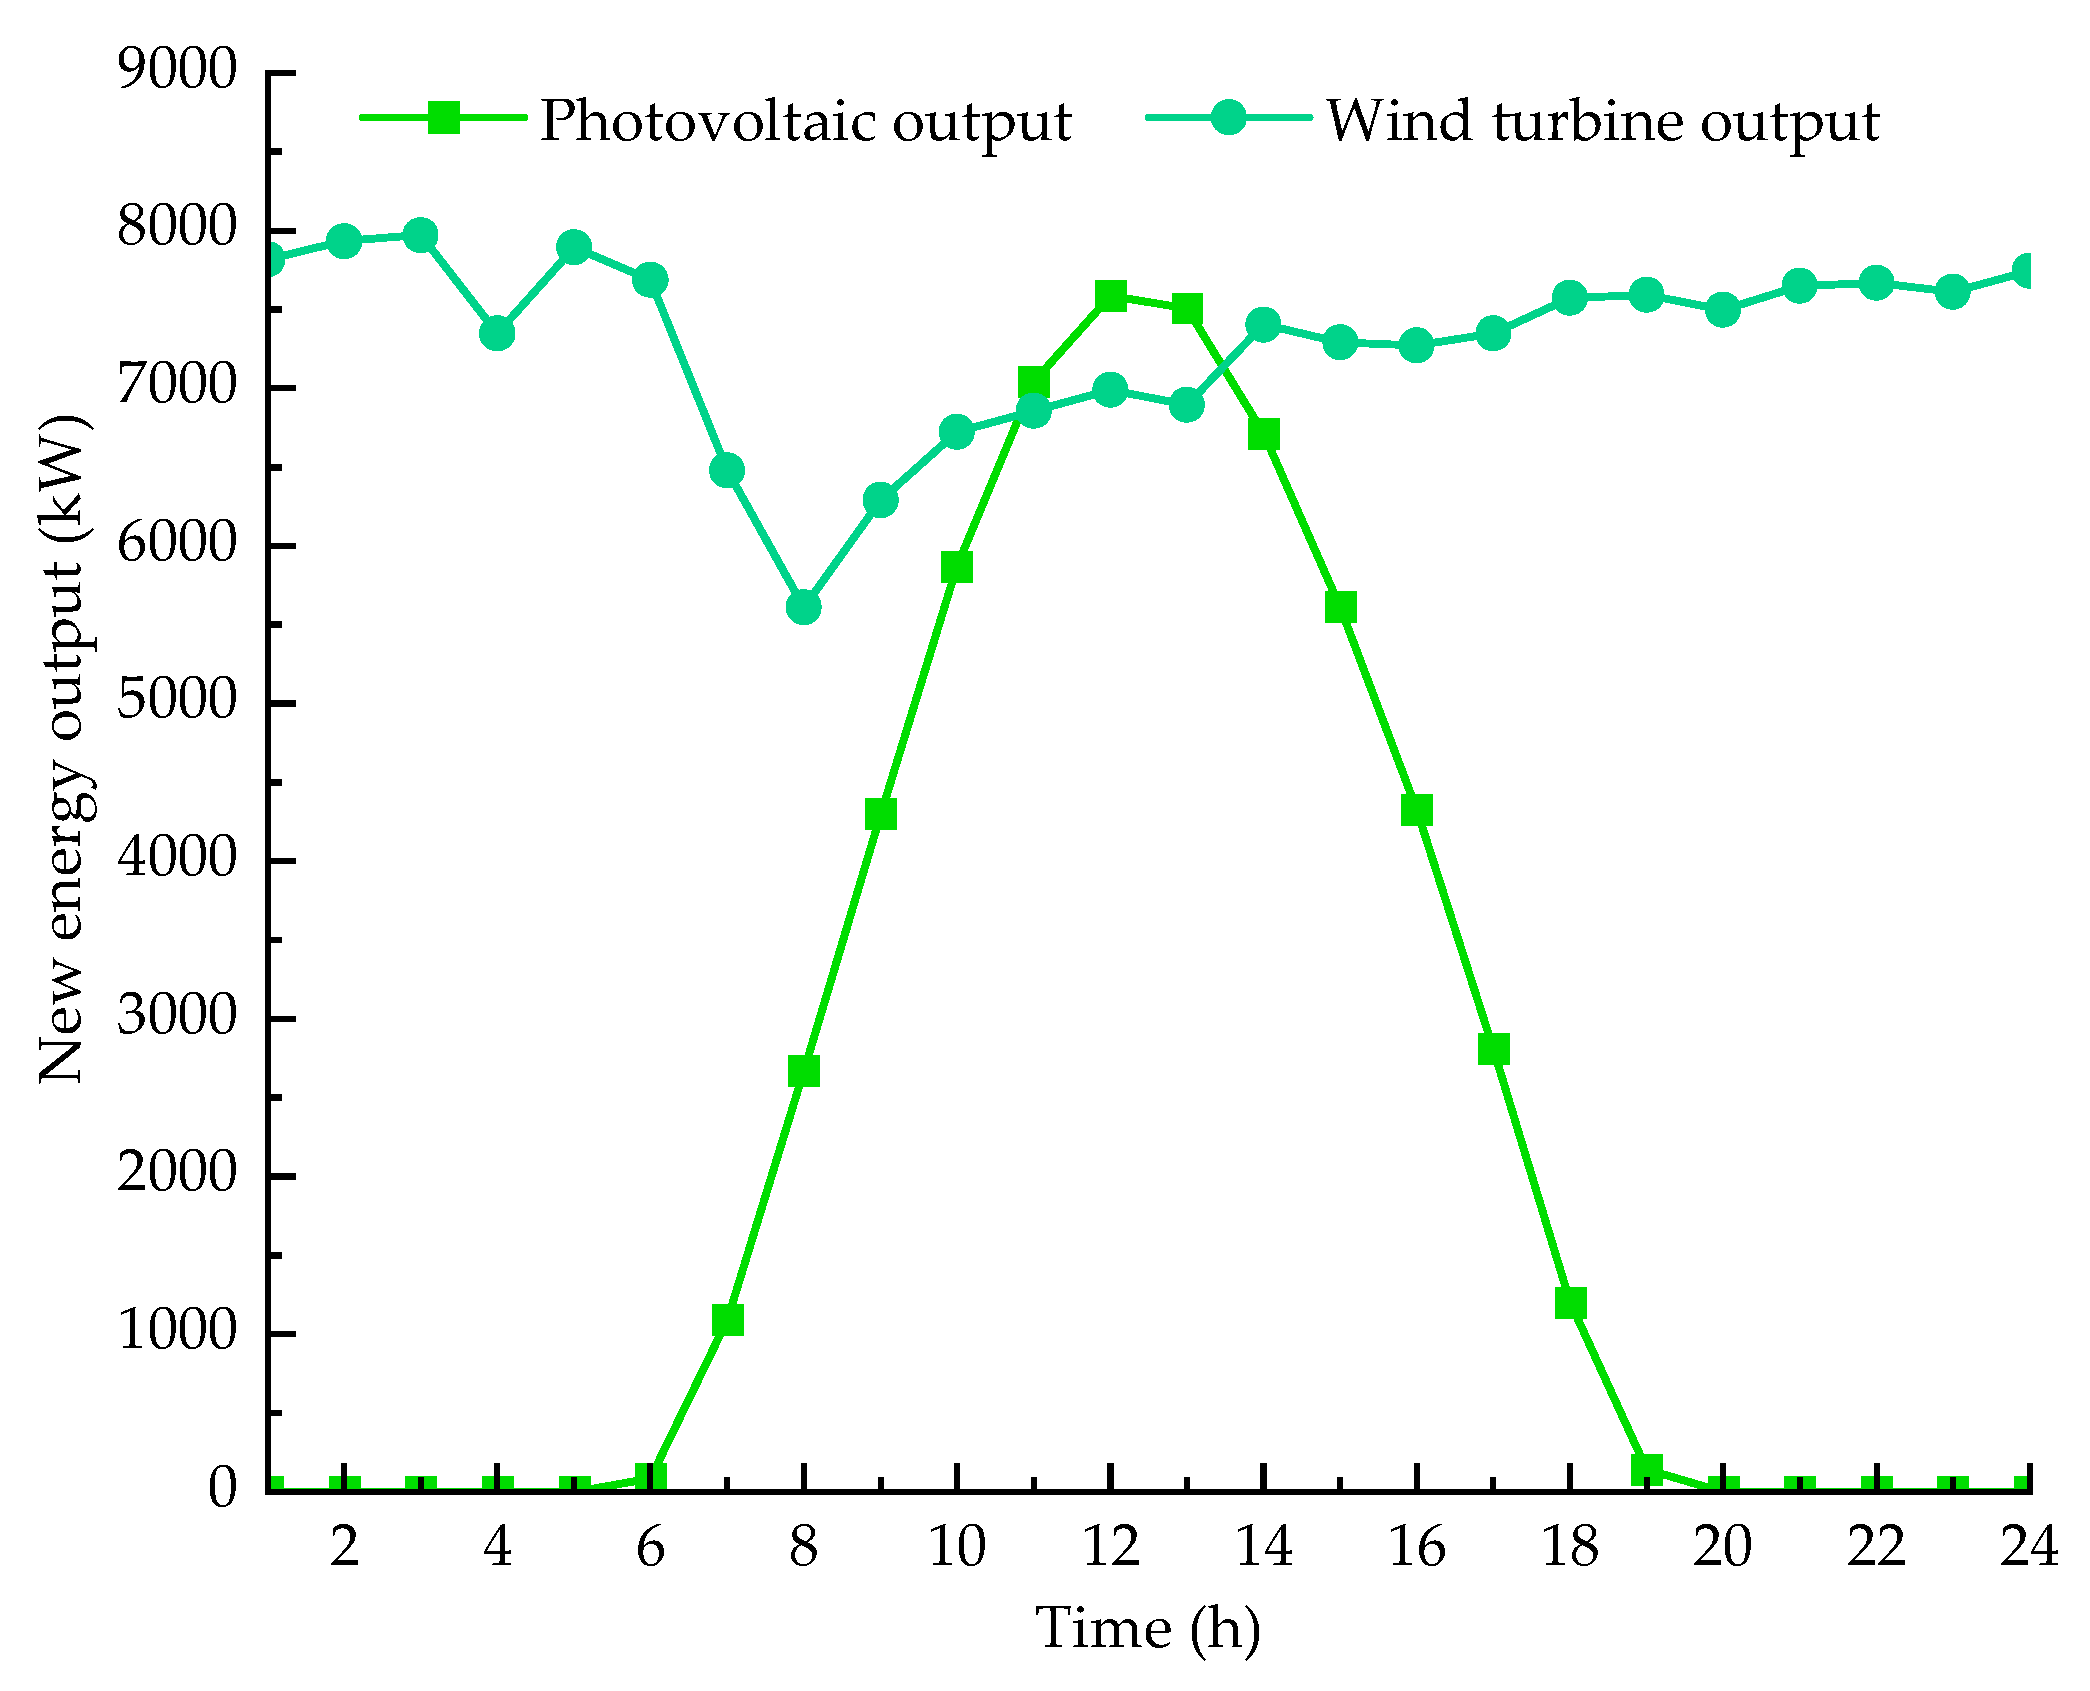
Figure 4.
(a) Electrical load composition before optimization. (b) Heating load composition before optimization. (c) Cooling load composition before optimization.
Figure 4.
(a) Electrical load composition before optimization. (b) Heating load composition before optimization. (c) Cooling load composition before optimization.

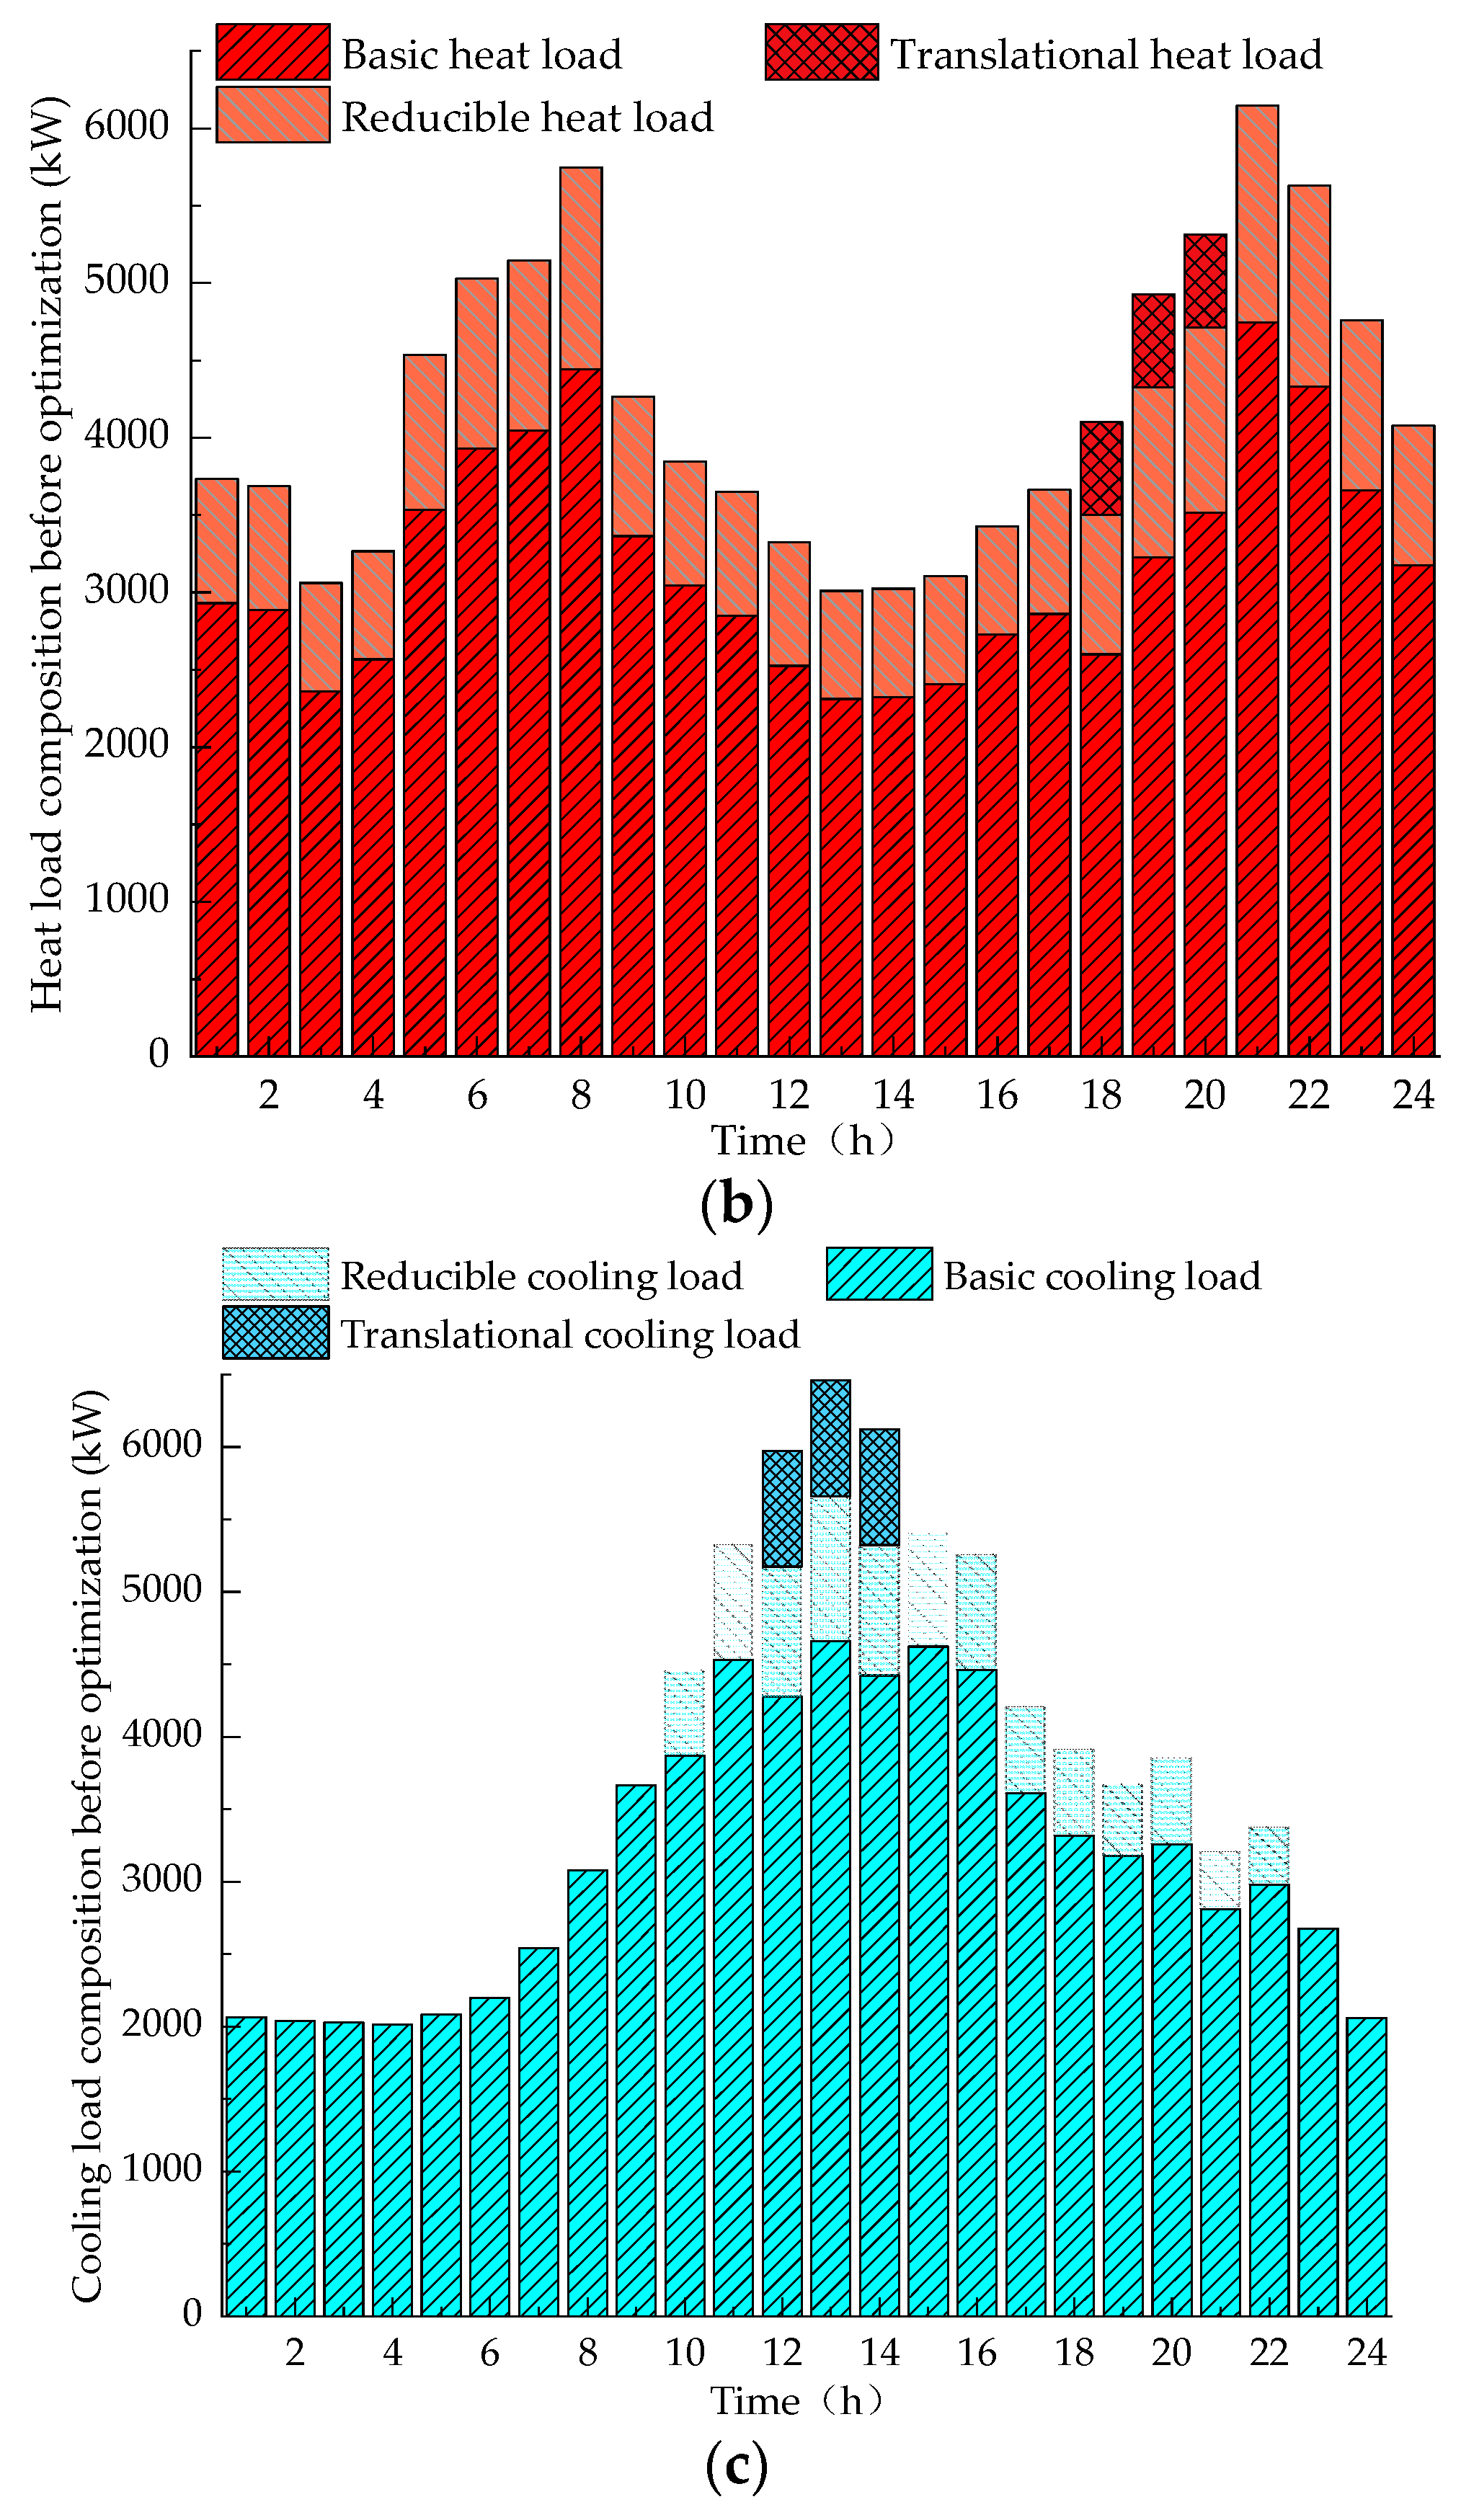
Figure 5.
ETBSS output in each case.


Table 1.
Device parameters of IES.
| Device Type | Parameter | Numerical Value |
|---|---|---|
| ET | ET quantity | 3 |
| Run time (h) | 8:00~12:00 | |
| Number of round trips (times) | 4 | |
| A round trip consumes the battery SOC | 32% | |
| Maximum average charging power () | 240 | |
| Maximum average discharge power () | 240 | |
| ETBSS | Number of batteries | 3 |
| Number of charge and discharge equipment | 3 | |
| Maximum number of batteries swapped in a period | 3 | |
| Maximum average charging power () | 240 | |
| Maximum average discharge power () | 240 | |
| Battery charging efficiency | 0.97 | |
| Battery discharging efficiency | 0.95 | |
| Operating cost () | 0.06 | |
| Maintenance cost () | 0.49 | |
| Battery | Battery capacity () | 281.92 |
| Battery charge and discharge loss cost () | 0.135 | |
| AT | AT capacity () | 1000 |
| Initial thermal energy () | 200 | |
| Maximum average power of charging and releasing heat () | 300 | |
| Thermal energy storage efficiency | 0.95 | |
| Thermal energy release efficiency | 0.9 | |
| Coefficient of thermal energy loss | 0.01 | |
| Utilization range of thermal energy () | 200∼950 | |
| Operating cost () | 0.016 | |
| Maintenance cost () | 0.6 | |
| GT | GT capacity () | 8000 |
| Efficiency | 0.8 | |
| Upper limit of climbing power () | 4000 | |
| Operating cost () | 0.04 | |
| Maintenance cost () | 0.72 | |
| Thermoelectric ratio range | 1.22~2.33 | |
| WHB | WHB capacity () | 5000 |
| Efficiency | 0.8 | |
| Upper limit of climbing power () | 2500 | |
| Operating cost () | 0.04 | |
| Maintenance cost () | 0.72 | |
| AC | AC capacity () | 6000 |
| COP | 1.1 | |
| Upper limit of climbing power () | 3000 | |
| Operating cost () | 0.05 | |
| Maintenance cost () | 0.8 | |
| HP | HP capacity () | 5200 |
| COP | 4.2 | |
| Upper limit of climbing power () | 2600 | |
| Operating cost () | 0.035 | |
| Maintenance cost () | 0.72 | |
| EC | EC capacity () | 5200 |
| COP | 3.5 | |
| Upper limit of climbing power () | 2600 | |
| Operating cost () | 0.04 | |
| Maintenance cost () | 0.72 | |
| WT | Operating cost () | 0.07 |
| Maintenance cost () | 0.48 | |
| Abandoning wind energy penalty costs () | 0.2 | |
| PV | Operating cost () | 0.039 |
| Maintenance cost () | 0.5 | |
| Abandoning light energy penalty costs () | 0.2 |
Table 2.
Parameters related to carbon trading.
| Parameter | Numerical Value |
|---|---|
| GT carbon quota () | 0.102 |
| Carbon quota for purchasing electrical energy () | 0.68 |
| Conversion coefficient for carbon quota for electricity generation and carbon quota for heat generation of GT | 1.67 |
| Carbon trading base price () | 0.06 |
| Length of carbon emission interval () | 2000 |
| Price growth rate | 0.5 |
| Carbon emissions from natural gas combustion () | 1.964 |
| The actual carbon emissions of electrical energy purchased () | 1.08 |
Table 3.
Parameters related to energy trading.
| Parameter | Numerical Value |
|---|---|
| Average purchasing electrical power range () | 0~5000 |
| Average rate of natural gas consumption () | 0~1000 |
Table 4.
Time-of-use electricity prices.
| IES Power Load Status | Time (h) | Electricity Price () |
|---|---|---|
| Valley load | 23:00~8:00 | 0.38 |
| Plain valley load | 8:00~12:00; 15:00~19:00 | 0.68 |
| Peak load | 12:00~15:00; 19:00~23:00 | 1.2 |
Table 5.
Load parameters can be shifted before optimization.
| Load Type | Parameter | Numerical Value |
|---|---|---|
| Translatable electrical load | Time of duration (h) | 3 |
| Translatable time period | 5:00~21:00 | |
| Offset cost () | 0.2 | |
| Translatable heat load | Time of duration (h) | 3 |
| Translatable time period | 5:00~21:00 | |
| Offset cost () | 0.1 | |
| Translatable cooling load | Time of duration (h) | 3 |
| Translatable period | 5:00~21:00 | |
| Offset cost () | 0.1 | |
| Transferable electrical load | Minimum duration (h) | 2 |
| Range of transferable load power (percentage of total transferable load power) | 20%~100% | |
| Transferable time period | 4:00~22:00 | |
| Offset cost () | 0.3 | |
| Reducible electrical load | Duration range (h) | 2~5 |
| Maximum number of cuts (1 time period means 1 time) | 8 | |
| Reducible period | 5:00~22:00 | |
| Offset cost () | 0.4 | |
| Reducible heat load | Duration range (h) | 2~5 |
| Maximum number of cuts (1 time period means 1 time) | 8 | |
| Reducible period | 6:00~22:00 | |
| Offset cost () | 0.2 | |
| Reducible cooling load | Duration range (h) | 2~5 |
| Maximum number of cuts (1 time period means 1 time) | 8 | |
| Reducible period | 11:00~19:00 | |
| Offset cost () | 0.2 |
Table 6.
Different case parameters.
| Case | ET Operating Mode | ETBSS Running Mode |
|---|---|---|
| Case 1 | Integrated charging and battery swapping | Ordered charge and discharge |
| Case 2 | Battery swapping | Ordered charge and discharge |
| Case 3 | Battery swapping | Ordered charging |
| Case 4 | Battery swapping | Unordered charging |
| Case 5 | Battery swapping | Use spare batteries and charge overnight |
Table 7.
Scheduling results in different cases.
| Case | Total Cost (CNY) | Amount of Carbon Emissions | Wind Electricity and Photovoltaic Utilization Rate |
|---|---|---|---|
| Case 1 | 105,294 | 6178 | 100% |
| Case 2 | 105,900 | 6489 | 99.87% |
| Case 3 | 106,059 | 6592 | 99.70% |
| Case 4 | 106,113 | 6592 | 99.70% |
| Case 5 | 106,497 | 6700 | 99.43% |
Table 8.
The differences between the operational model proposed in this paper and other EV charging and battery swapping station models.
Table 8.
The differences between the operational model proposed in this paper and other EV charging and battery swapping station models.
| The Operational Model of ETs and ETBSSs with Flexible Charging and Discharging | Other EV Charging and Battery Swapping Station Models |
|---|---|
| Each battery is managed individually. | Most batteries are classified and then managed in clusters. |
| The energy demands of ETs can be obtained according to the running characteristics of ETs; on the premise of meeting the transportation demands of ETs, the load can be adjusted to some extent according to the demand on the IES. | The energy supply requirements of the most EVs are predicted based on the EV operation law, and almost all of them are not adjustable. |
| The battery does not need to be fully charged when the battery is swapped. | The battery does not take part in a battery swapping until it is fully charged. |
| The charging and discharging behavior of the battery can be interrupted. | The charging and discharging behavior of the battery cannot be interrupted. |
| The charging and discharging power of the battery is variable. | Most batteries are charged and discharged at constant power. |
| When an ET is working, the battery swapping mode is adopted to improve the working efficiency of the ET. When an ET is idle, the ET accesses the ETBSS to participate in IES scheduling and improve the electrical energy storage capacity of the IES. | Most EVs use a single means for energy supply, charging, or battery swapping. |
| Calculations of the optimization model are substantial, and the optimization model takes a long time to solve. | Calculations of the optimization model are small, and the optimized operation scheme can be obtained quickly. |
Disclaimer/Publisher’s Note: The statements, opinions and data contained in all publications are solely those of the individual author(s) and contributor(s) and not of MDPI and/or the editor(s). MDPI and/or the editor(s) disclaim responsibility for any injury to people or property resulting from any ideas, methods, instructions or products referred to in the content. |
© 2023 by the authors. Licensee MDPI, Basel, Switzerland. This article is an open access article distributed under the terms and conditions of the Creative Commons Attribution (CC BY) license (https://creativecommons.org/licenses/by/4.0/).
Share and Cite
MDPI and ACS Style
Liu, B.; Chen, J.; Zhang, N.; Liu, J.; Zhang, Y.; Bao, H.; Liu, L.; Chen, K. Optimized Scheduling of an Integrated Energy System with an Electric Truck Battery Swapping Station. Processes 2024, 12, 84. https://doi.org/10.3390/pr12010084
AMA Style
Liu B, Chen J, Zhang N, Liu J, Zhang Y, Bao H, Liu L, Chen K. Optimized Scheduling of an Integrated Energy System with an Electric Truck Battery Swapping Station. Processes. 2024; 12(1):84. https://doi.org/10.3390/pr12010084
Chicago/Turabian StyleLiu, Bin, Jie Chen, Nan Zhang, Jun Liu, Yuchao Zhang, Hongyin Bao, Lili Liu, and Kang Chen. 2024. "Optimized Scheduling of an Integrated Energy System with an Electric Truck Battery Swapping Station" Processes 12, no. 1: 84. https://doi.org/10.3390/pr12010084
Note that from the first issue of 2016, this journal uses article numbers instead of page numbers. See further details here.