Communication

First Approach Using Fluidic Force Microscopy (FluidFM®) to Measure Adhesion Forces between Droplets and Flat/Rough Surfaces Immersed in Water

Institute of Micro-Process-Engineering and Particle Technology (IMiP), University of Applied Sciences Trier, Environmental Campus Birkenfeld, P.O. Box 1380, D-55761 Birkenfeld, Germany
*
Author to whom correspondence should be addressed.
Processes 2024, 12(1), 99; https://doi.org/10.3390/pr12010099
Submission received: 8 December 2023 / Revised: 22 December 2023 / Accepted: 28 December 2023 / Published: 1 January 2024
(This article belongs to the Section Separation Processes)

Abstract

:
The research program “Engineered Artificial Minerals (EnAM)” addresses the challenge of recycling valuable elements from battery waste streams. These elements, such as lithium (Li), often migrate in the slag phase, in some cases as crystals. EnAM crystals represent concentrated reservoirs of these elements, which can only be effectively recycled if they are extracted from the slag matrix and then separated. Selective wet agglomeration is a separation process based on a three-phase system and is often used in coal and ore processing. The produced agglomerates in this process can be easily separated from the remaining suspension. The precise quantification of the wetting properties and adhesion strength between suspended particles and binding liquid droplets is a scientific challenge. An accurate technique suitable for adhesion force measurements in three-phase systems with micrometer-scale particles is Fluidic Force Microscopy (FluidFM®). An experimental setup with optical control is being developed to measure adhesion forces between droplets and flat/rough surfaces. This will enable precise measurements of adhesion forces between solid EnAM crystals and binding liquid droplets. Based on these measurements, optimal agglomeration conditions can be selected in the future to improve selective wet agglomeration with respect to recycling processes.

1. Introduction

A key objective in battery recycling is to recover a high-quality metal phase rich in cobalt and nickel. However, in pyrometallurgical recycling processes, essential elements such as lithium (Li) become part of the waste stream, migrating into the slag phase and thus remaining unrecovered [1,2]. The German Research Foundation (DFG)-funded Priority Program SPP2315 entitled “Engineered Artificial Minerals (EnAM)—a geo-metallurgical tool to recycle critical elements from waste streams” addresses this challenge. This program has a strong focus on the slag phase as a critical carrier of essential technology elements. Within the slag phase, these elements manifest either as a homogenous amorphous structure or as crystals whose formation is thermodynamically dependent. These crystals are called engineered artificial minerals (EnAMs) and act as concentrated reservoirs for the dilute elements. Lithium aluminate (LiAlO2), known for its high lithium-storage capacity, is a particularly promising EnAM candidate [1]. To enable recycling, EnAM crystals need to reach a certain size and stability. The recovery of these crystals from the slag phase is achieved by an adapted crushing process. The liberated EnAM crystals then must be separated from the remaining slag phase.
A separation process commonly used in coal and ore processing is the selective wet agglomeration, which is based on a three-phase system [3]. This system consists of two liquid phases with a miscibility gap and a heterogeneous solid phase suspended in the continuous phase, usually water. The second liquid phase, the binding liquid, is either dispersed in the continuous phase or added as an emulsion. The hydrophobic binding liquid droplets adhere preferentially to particles with better wetting properties, resulting in the formation of agglomerates [4,5,6,7,8]. These agglomerates can be easily separated from the remaining suspension by solid–liquid separation. The process of selective wet agglomeration focuses on the controlled manipulation of the wetting properties of the suspended particles of interest (EnAMs).
One of the scientific challenges is to accurately quantify the wetting properties and adhesion strength of the EnAM against droplets of the binding liquid. This is essential for the effective control and modification of the selective wet agglomeration process. Therefore, it is important to develop a measurement method designed for a three-phase system with micrometer-scale particles. Fluidic Force Microscopy (FluidFM®) appears to be a high-precision technique based on atomic force microscopy. Unique hollow cantilevers, connected to a fluid reservoir with a pressure control system, allow the dispensing and aspiration of fluids in the femtoliter scale [9,10,11]. Particularly in the field of biology, the FluidFM® system has significantly advanced the approach of single-cell force spectroscopy (SCFS) on bacteria or cells [12,13,14,15]. In addition to quantifying cell-adhesion forces, this technique has also allowed experiments to be carried out on biomolecule delivery, patch clamping, and cell injection [10,11,16,17,18,19,20,21].
In 2021, Demir et al. first introduced the possibility to measure the interactions between air bubbles produced with the hollow cantilever and (bio)interfaces using FluidFM® technology [22]. Thus, the characteristics and versatility of FluidFM® make it potentially suitable for the study of wetting and adhesion, with a focus on binding liquid droplets adhering to surfaces (particle layer) in a continuous liquid phase. This paper presents an experimental setup with an optical control to extend the application range of the FluidFM® system from biology to particle technology. The first attempts to measure adhesion forces between droplets and flat and rough surfaces are described. As these are trials, the wetting assessment results from the adhesion force measurements are compared with contact angle measurements, and the suitability of the system is discussed based on these comparisons. The aim of this attempt is to provide a basic platform for future adhesion force measurements between EnAM crystals and binding liquid droplets to investigate and modify the wetting properties with respect to selective wet agglomeration processes.

2. Materials and Methods

2.1. Model Material System

A representative model material system was chosen to measure the contact angle and adhesion force between the binding liquid droplets on both flat and rough surfaces. The flat surface was simulated via a 15 mm × 15 mm rectangular cover glass composed of borosilicate glass D 236® (Paul Marienfeld GmbH & Co. KG, Lauda-Königshofen, Germany). Silicon carbide sandpaper (ATM Qness GmbH, Mammelzen, Germany) with FEPA-standard P600 grit (25.8 ± 1 µm grit size) was used to simulate a rough surface and thus fixed particles, as shown in Figure 1. The silicon carbide particles were coated with synthetic resin by the manufacturer. Liquid paraffin oil with a density of 0.85 g/cm3 (Merck KGaA, Darmstadt, Germany) was used as a medium to generate binding liquid droplets. Measurements were performed using deionized (DI) water as the suspension liquid (continuous phase).

2.2. FluidFM® Measurements

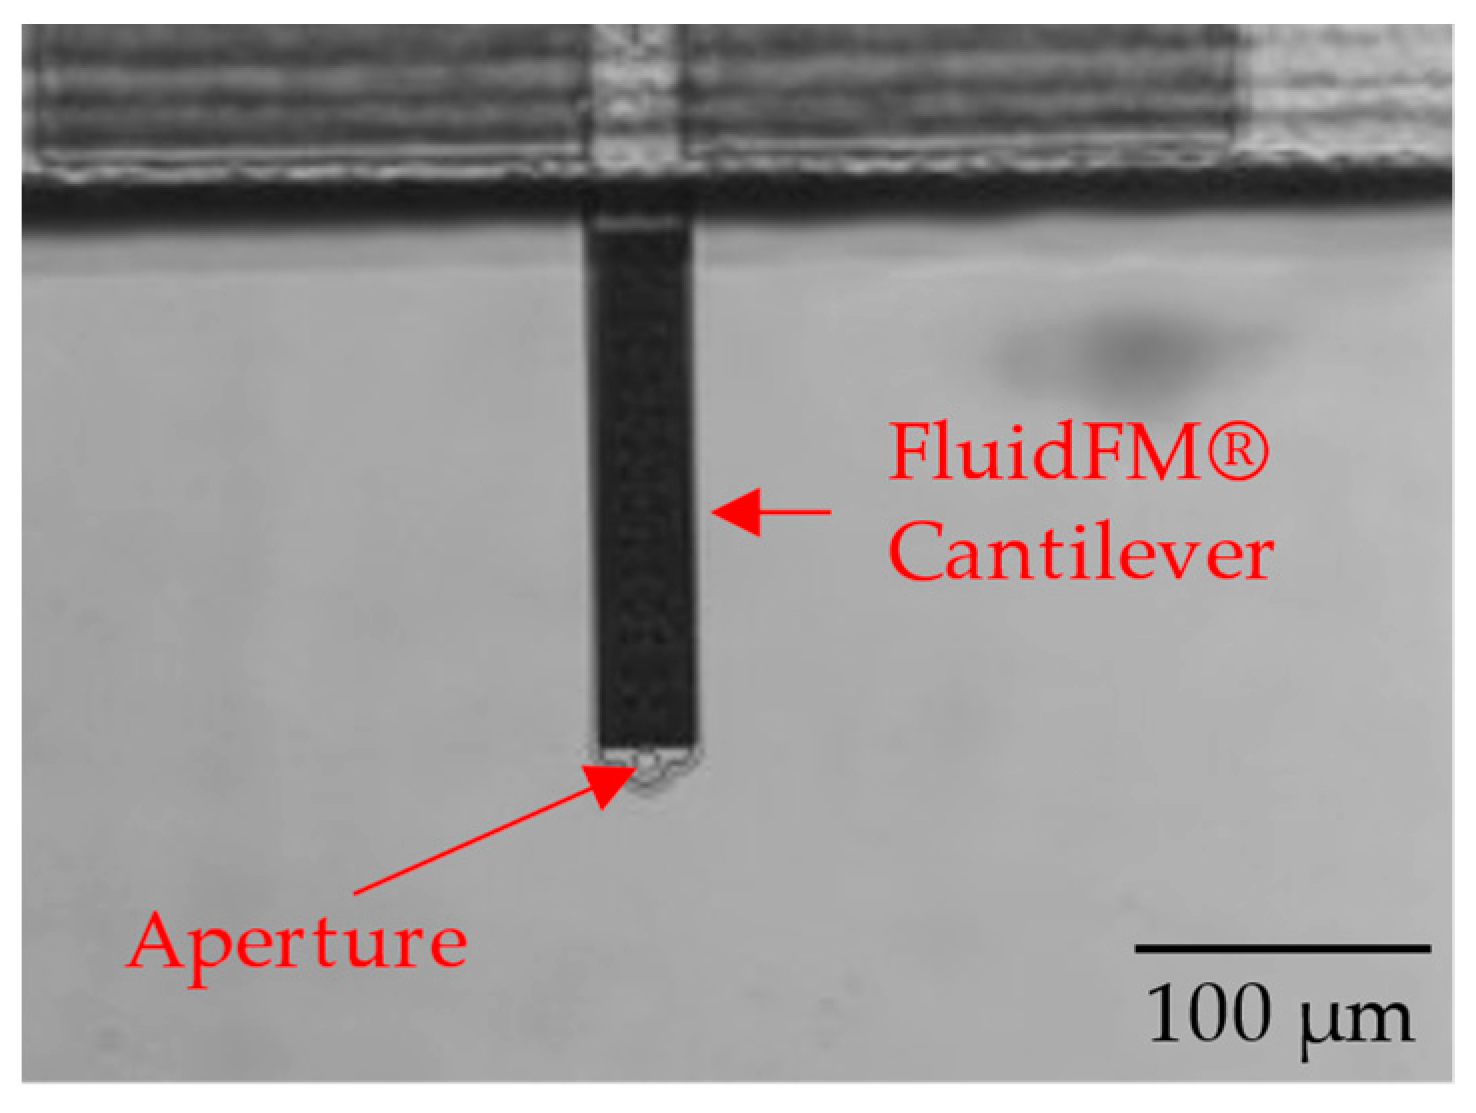
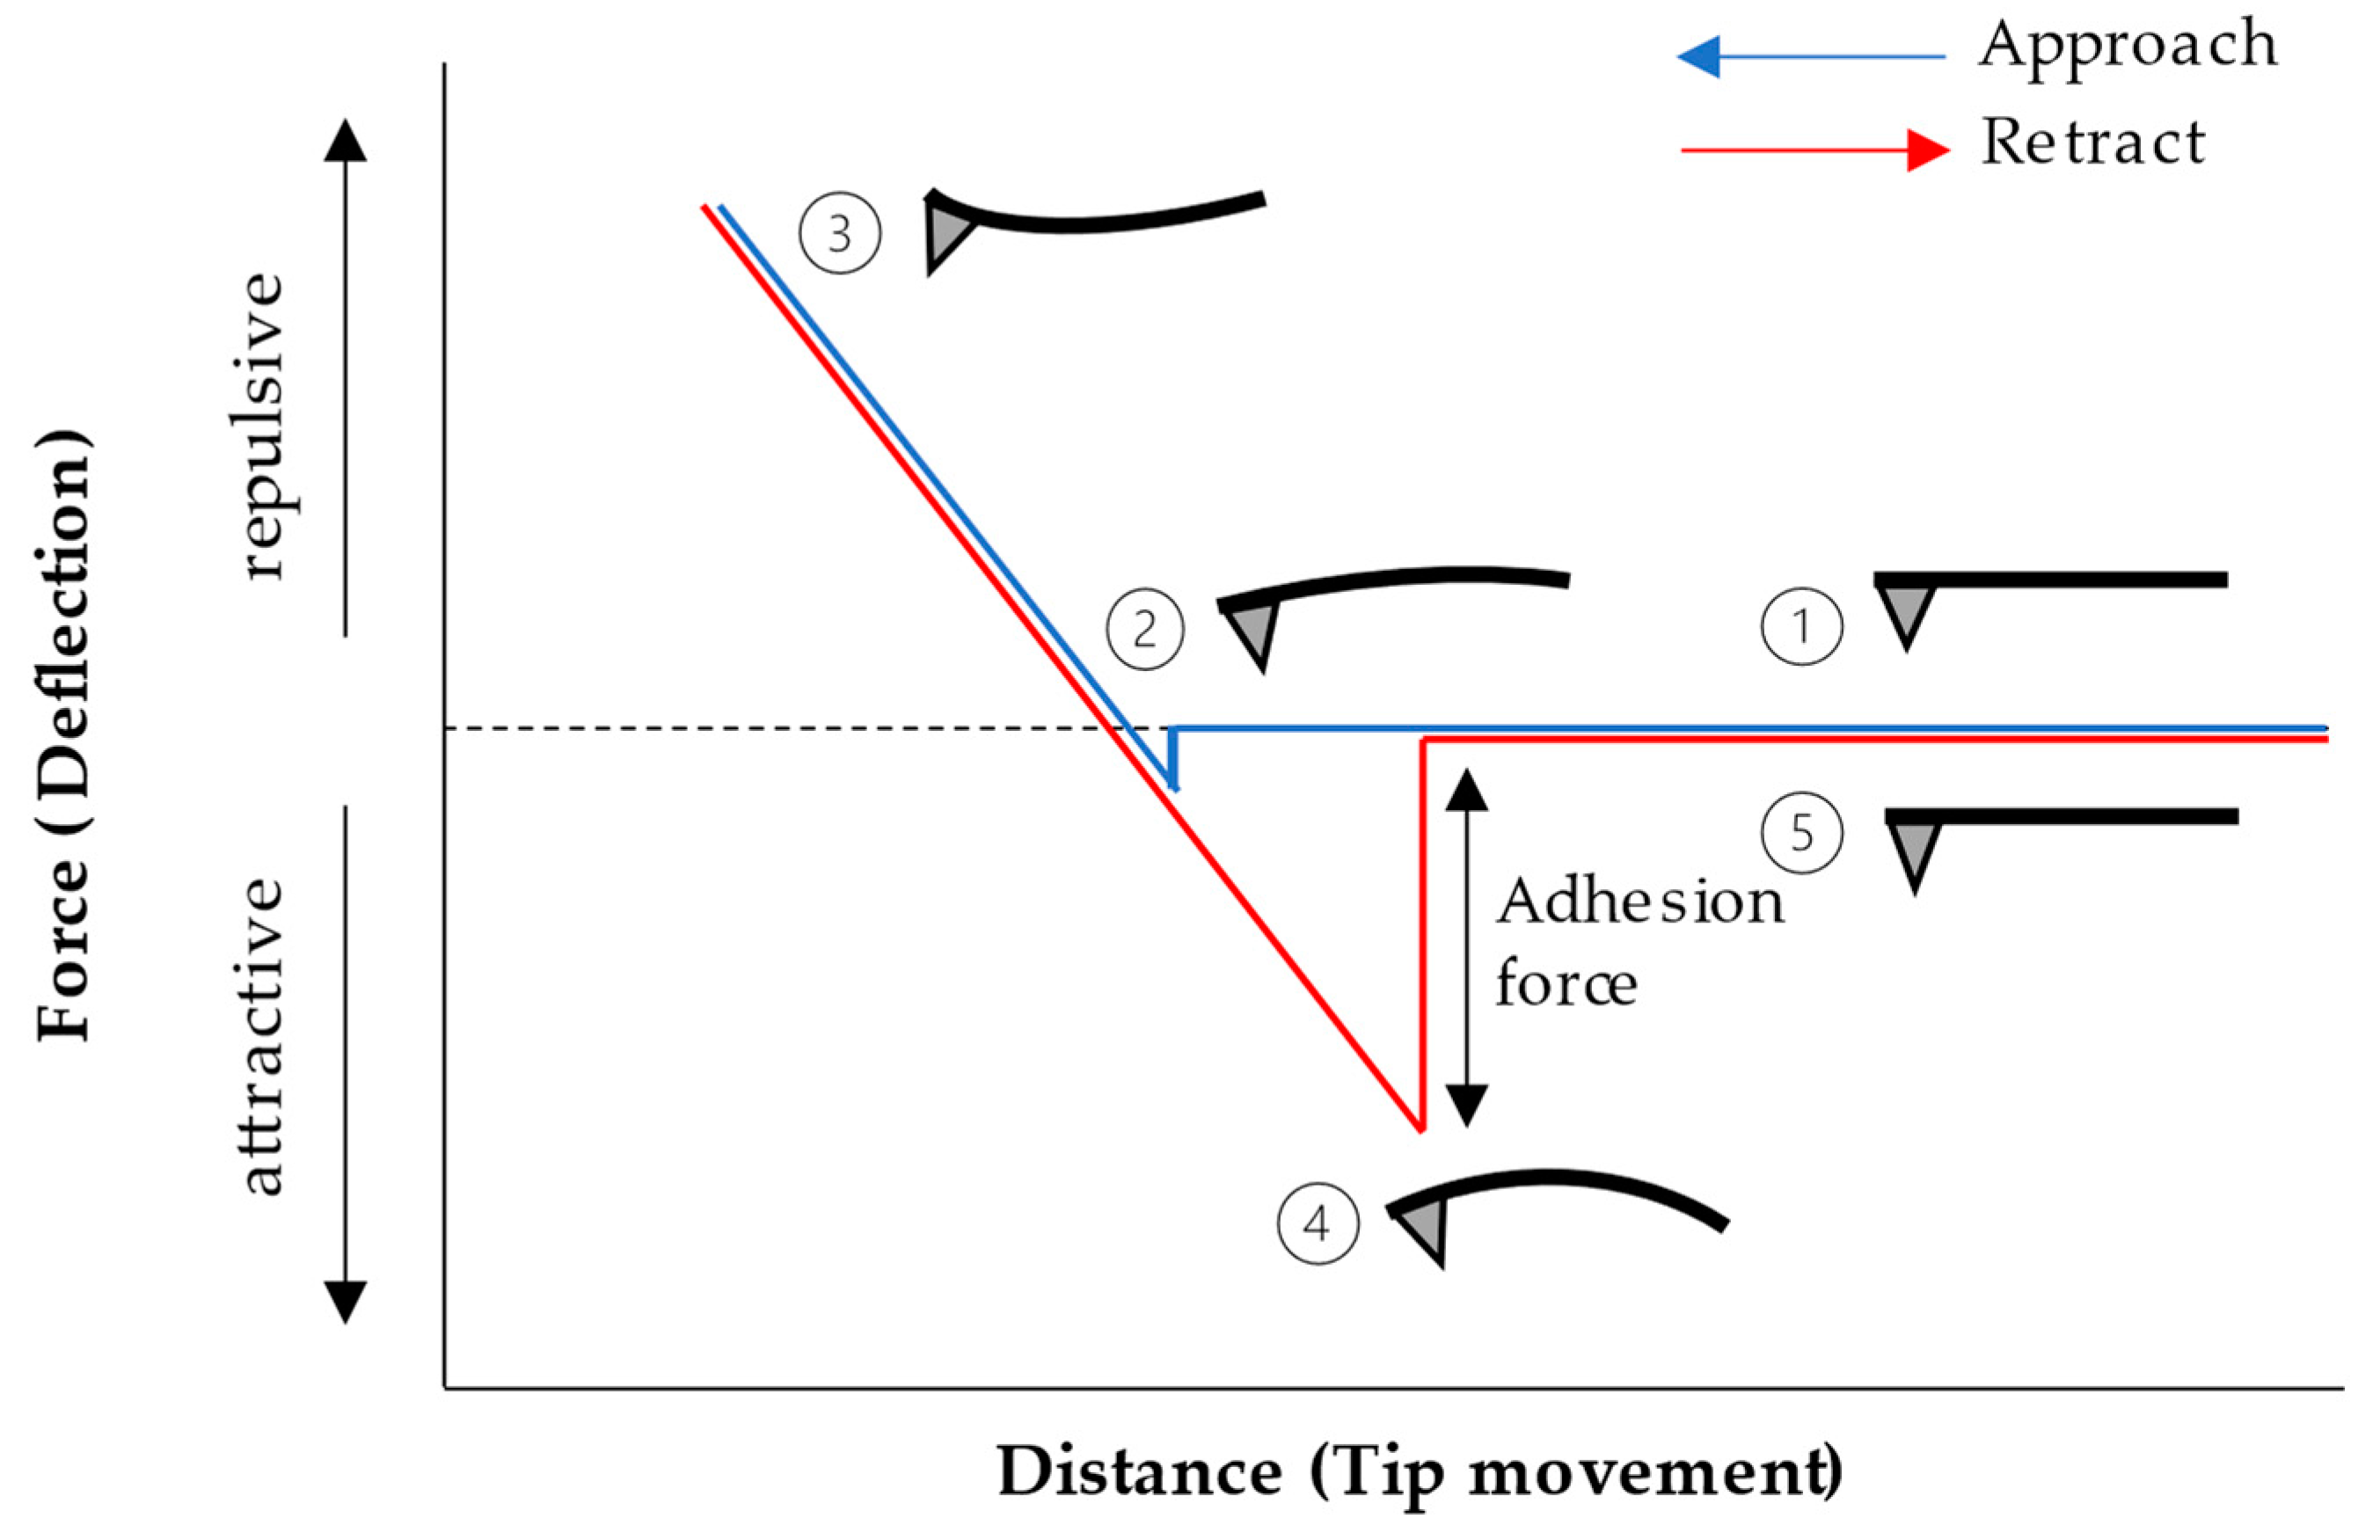
2.2.1. Fundamentals of the FluidFM® Technology

FluidFM® technology is based on Atomic Force Microscopy (AFM) but is differentiated by using specialized micro-channeled cantilevers (micropipettes) that are unique to FluidFM®. These cantilevers have closed channels that are connected to a pressure control system through tubing, enabling them to contain and deliver various types of liquids. This technology enables the accurate dispensing of a fluid into a liquid environment by controlling the pressure of the fluid channel through an aperture located at the tip of the cantilever (see Figure 2) [9,23,24]. The hydraulic system provides an adjustable pressure range that spans from −800 to 1000 mbar according to the manufacturer’s specification. Negative pressure is useful for fixing cells or particles to the micropipette, while positive pressure can be used to dispense controlled amounts of liquid from the micropipette. This wide pressure range enables flexibility and control in the process of fluid manipulation and dispensing, such as the creation of liquid droplets.
The deflection of the FluidFM® cantilever is precisely measured using an established AFM laser detection system. This measurement, combined with the spring constant of the cantilever, allowed the calculation and generation of force–distance curves [9]. A model force–distance curve is shown in Figure 3.
The cantilever first approaches the sample surface ①. As it approaches, a ‘snap-in’ phenomenon occurs due to tip–sample interactions, indicating the start of the measurement ②. The z-piezo, responsible for tip movement, continues to approach the surface until a predetermined force setpoint (stop value) is reached. At this point, the cantilever starts to bend upwards ③. During the following retraction of the cantilever, it bends towards the surface due to adhesion forces. This bending continues until the ‘pull-off’ event, which represents the detachment of the cantilever from the sample ④. After the pull-off event, the cantilever returns to an unperturbed state as it continues to retract from the sample, completing the measurement process ⑤. The force–distance curves act as a fundamental element for evaluating various interactions throughout the measuring procedure.

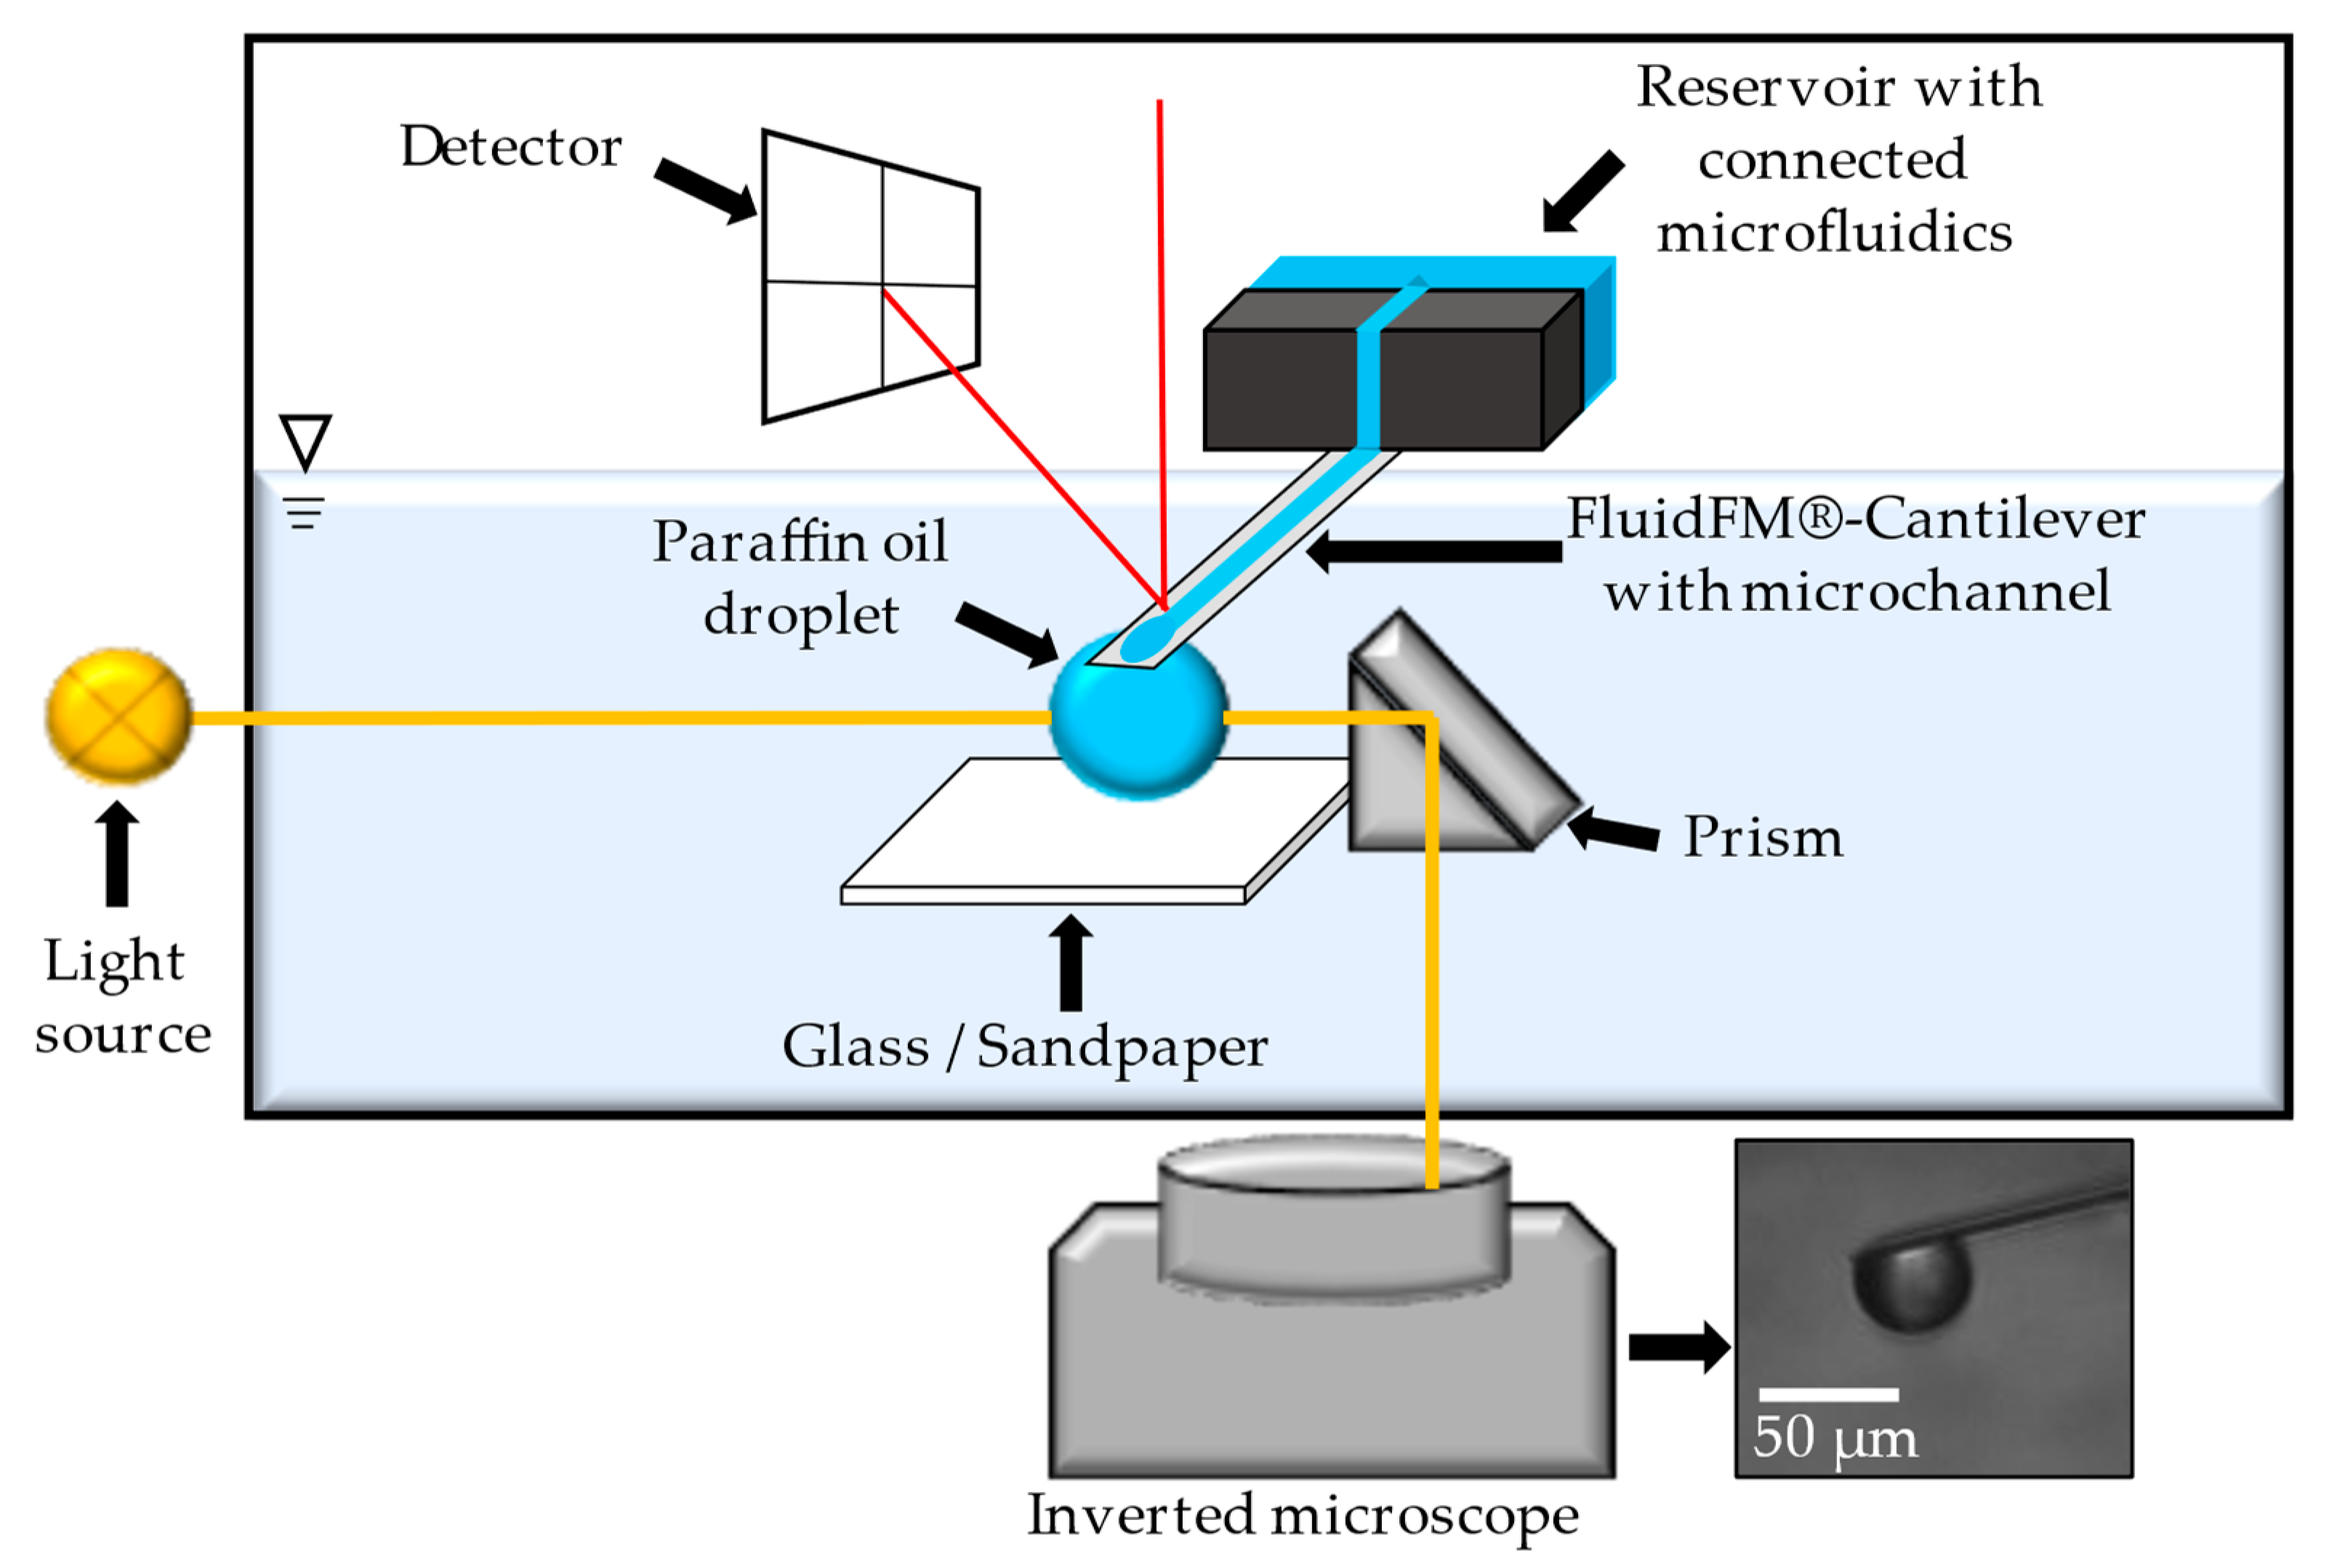
2.2.2. Experimental Setup
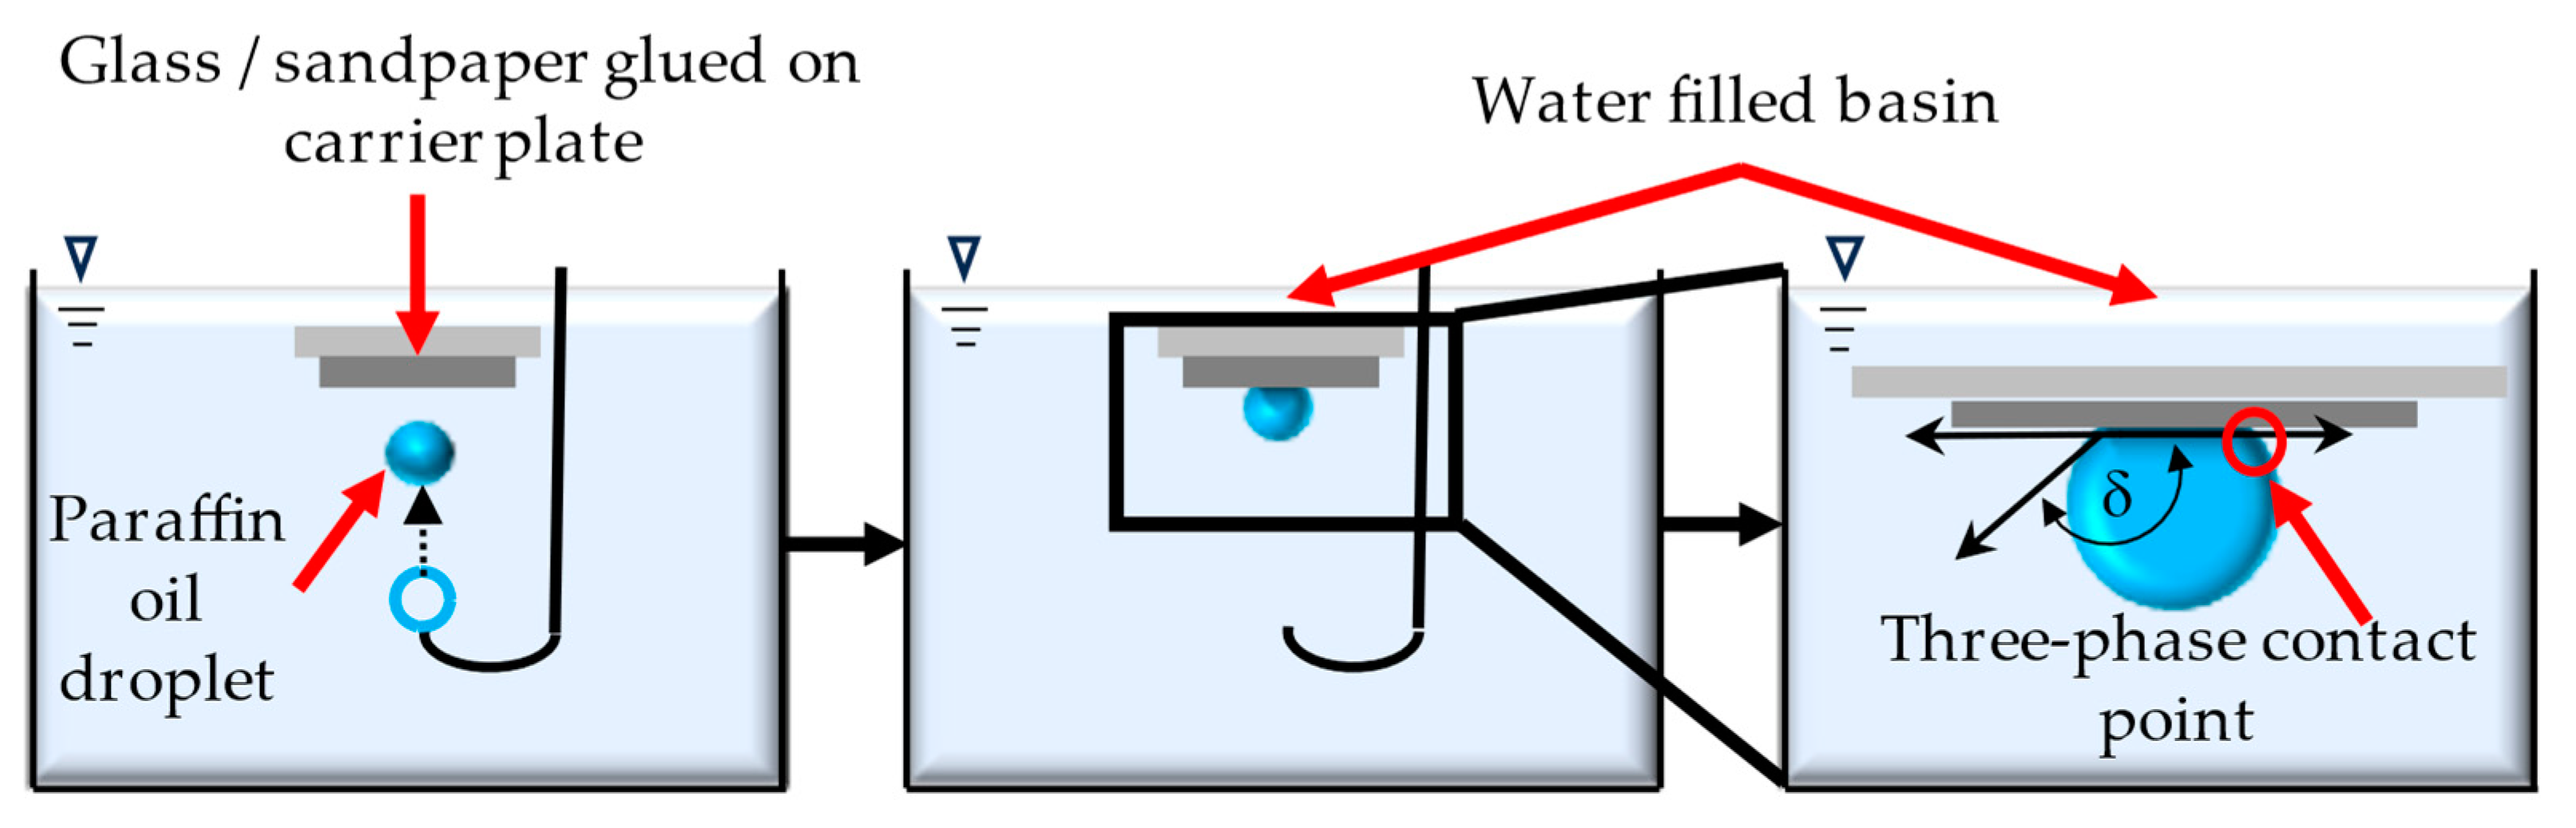
Adhesion force measurements were conducted using a FluidFM® system that integrated a scan head (FlexAFM, Nanosurf GmbH, Liestal, Switzerland) and its microfluidic system (Cytosurge AG, Opfikon, Switzerland). An inverted microscope (IX 71, Olympus Corporation, Tokyo, Japan) was also linked to the setup, which was then placed on a vibration isolation system (Accurion Halcyonics i4, Nanosurf GmbH, Liestal, Switzerland) to minimize any external disturbances and vibrations. To address the limited space between the scan head and the microscope, either the cover glass or a small section of sandpaper was attached to the lids of Petri dishes (52 mm × 4 mm, Plano GmbH, Wetzlar, Germany) using double-sided adhesive tape. Projection images of the generated droplets were obtained by placing a 0.70 mm rectangular reflective prism (Edmund Optics GmbH, Mainz, Germany) adjacent to each sample, inspired by Demir et al. [22]. This prism was illuminated by an external light source positioned on the opposite side. For measurements carried out in a liquid environment, the Petri dish is filled with 4 mL of sterile filtered and degassed DI water, resulting in a liquid height of about 3 mm. Figure 4 shows a schematic representation of this configuration.

2.2.3. Methodology

In the experimental setup, micropipette probes with an aperture of 4 µm and a spring constant of 2 N/m (Cytosurge AG, Opfikon, Switzerland) were used for all measurements. It is important to note that the spring constant is a manufacturer-specified value and can vary for individual cantilevers. To ensure precision, the actual spring constant was automatically calibrated each time a cantilever was replaced. The actual spring constant in air was calculated for the cantilever with thermal tuning in the static force mode, using the C3000 data processing software from Nanosurf GmbH, Liestal, Switzerland.
Before immersing the cantilever in DI water, 10 µL of sterile filtered paraffin oil was filled in the reservoir of the micropipette to act as a medium for droplet generation. After immersing the cantilever in the liquid environment, the laser must be readjusted to obtain a sufficient signal. A deflection sensitivity calibration was then performed automatically by approaching a silica surface placed in the Petri dish. The sensitivity of the cantilever was then set for following measurements based on the slope of five force–distance curves recorded by the system. After calibration, the cantilever was placed next to the prism to observe the droplet formation using lateral images. It is important to note that these images are not exact representations and can be affected by various factors, including the position of the cantilever and prism, as well as the position of the external light source. To determine the scale of the images, the cantilever was moved in the z-direction at a known speed of 10 µm/s and video recordings were taken. Two specific images taken during this movement were used to calculate the scale based on the known speed of the cantilever. For droplet formation, a manual overpressure of approximately 45 mbar was set, considering a target droplet diameter of 40 µm. Under this applied pressure, the droplet size remained stable for the duration of the measurement, as confirmed by video recordings taken over a 30 min period prior to the start of the measurement. The calculation of the pressure needed to maintain droplet stability was based on the Young–Laplace equation, where ΔP represents the pressure difference between the inside and the outside of the droplet, γ represents the surface tension of the paraffin oil–water system, and R represents the radius of the droplet, as given in Equation (1).
Δ P = 2 γ R
The droplet was generated and approached the model surfaces with a constant force of 20 nN to ensure consistent results and to prevent the movement of the cantilever from being influenced by the buoyancy of the surrounding liquid. The cantilever continued to move towards the surface until it reached the predefined stop value of 40 nN. The force–distance curves were then recorded. The maximum retraction length was limited by the system to 10.5 µm and a measurement speed of 10.5 µm/s. The force–distance curves were recorded at different locations on the model surfaces, with the droplet size controlled between each experiment. Five force–distance curves with the maximum adhesion force measured for each surface were used for the discussion in Section 3.

2.3. Contact Angle Measurements

The sessile drop method is a fundamental technique for investigating the wetting characteristics of flat surfaces, providing a flexible strategy that can be applied to both planar and uneven surfaces, as described by Schreier et al. [25]. Instead of using individual particles, the cover glass or sandpaper is attached to a carrier plate using double-sided adhesive tape. The carrier plate is immersed in a water-filled basin and rotated to invert the model surfaces during this process. The deionized water is degassed prior to measurement in order to prevent the formation of unwanted gas bubbles on the surface, which could have a negative effect on the results. To initiate the measurement, a droplet of paraffin oil is dispensed using a needle attached to a micro syringe, which is released when the buoyancy force is sufficient. As the droplet rises, it collides with the surfaces, enabling a complete investigation of the wetting properties based on the contact angles at the three-phase contact points (see Figure 5) [25].
Dynamic contact angles, which transition to static contact angles, were measured using a high-speed camera. The camera recorded at a rate of 7969 images per second. The last 1000 images of each measurement were used to evaluate the averaged static contact angle and capture the droplets in their equilibrium state. This process was repeated in five separate experiments for each surface to ensure reliable and consistent results.
It must be recognized that due to the relatively large droplet size (≈4 mm in diameter), the measurements, even when based on a single droplet, usually cover a larger area than that of an individual particle. Therefore, the measurement records an average wetted perimeter, which may not accurately reflect the conditions encountered during the selective wet agglomeration process. During the agglomeration process, the particles and binding liquid droplets are initially isolated, and the droplets are noticeably smaller. For example, when a paraffin oil–water emulsion is used in the agglomeration process, the droplets are in the lower micrometer-range.
The contact angle measurements serve as a supporting method for the adhesion force measurements. The contact angles are used to obtain initial information on the wettability of the model surfaces by paraffin oil droplets and to check whether the adhesion force correlates with these results in relation to method development.

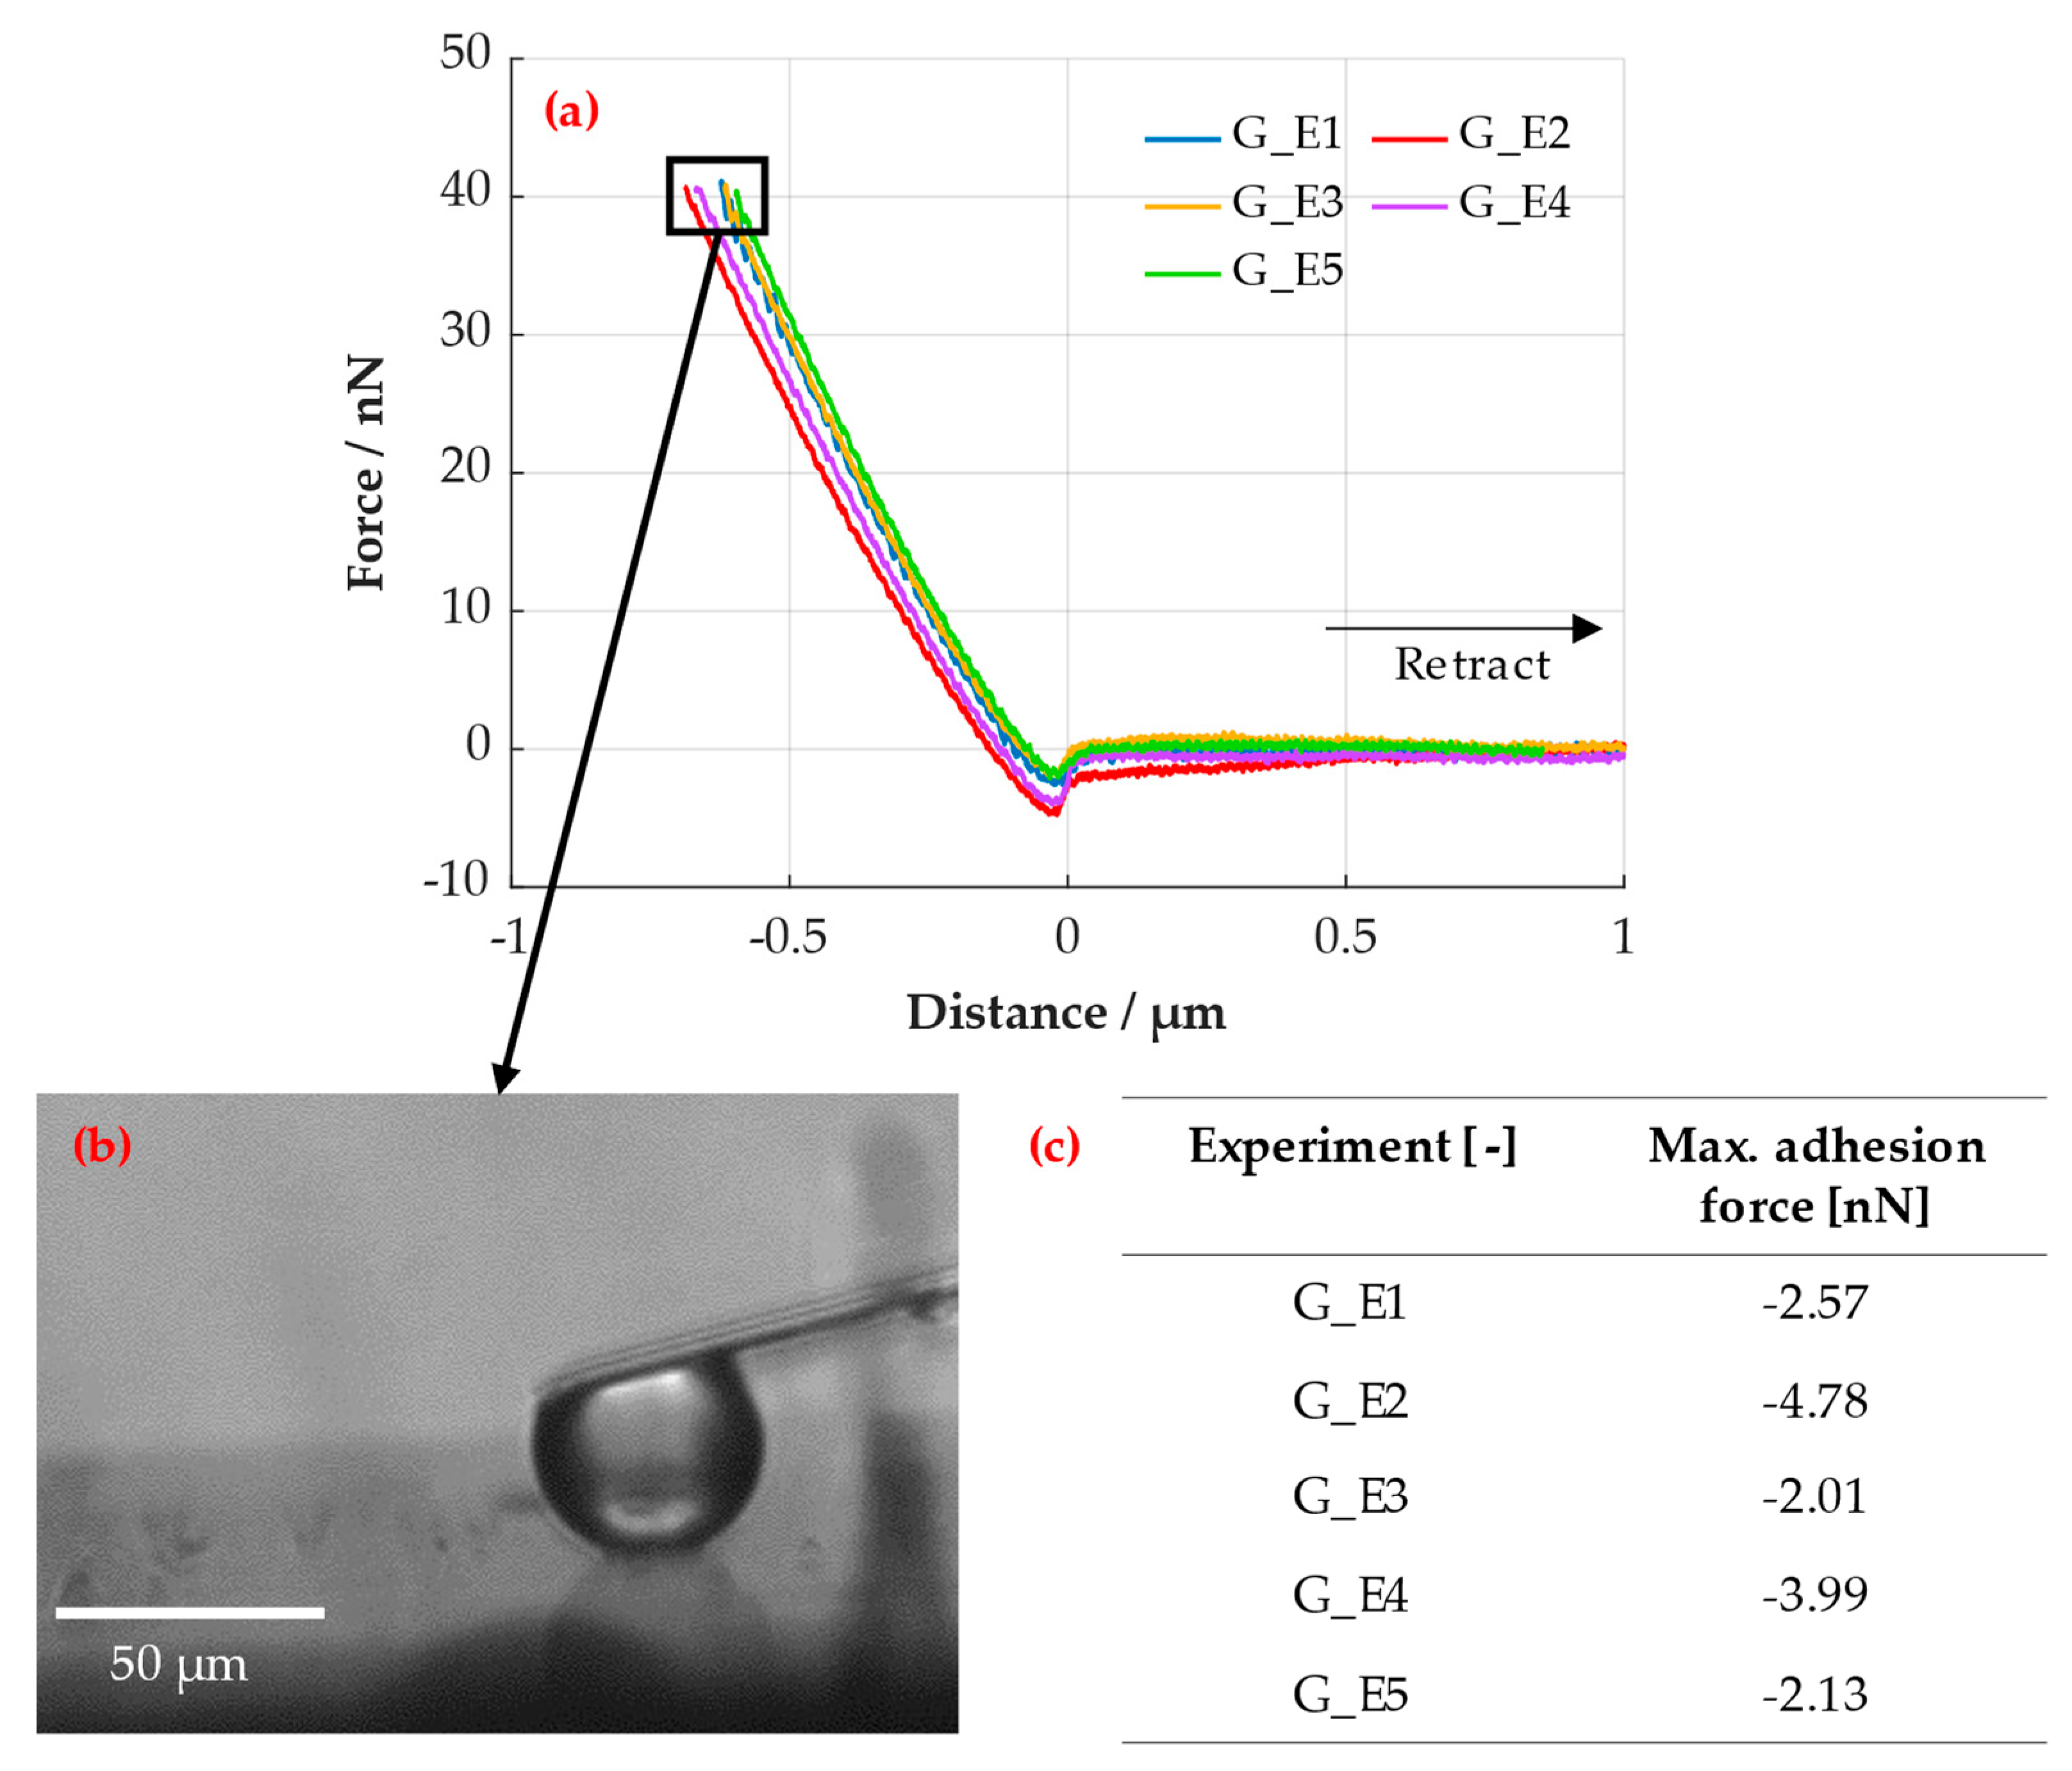
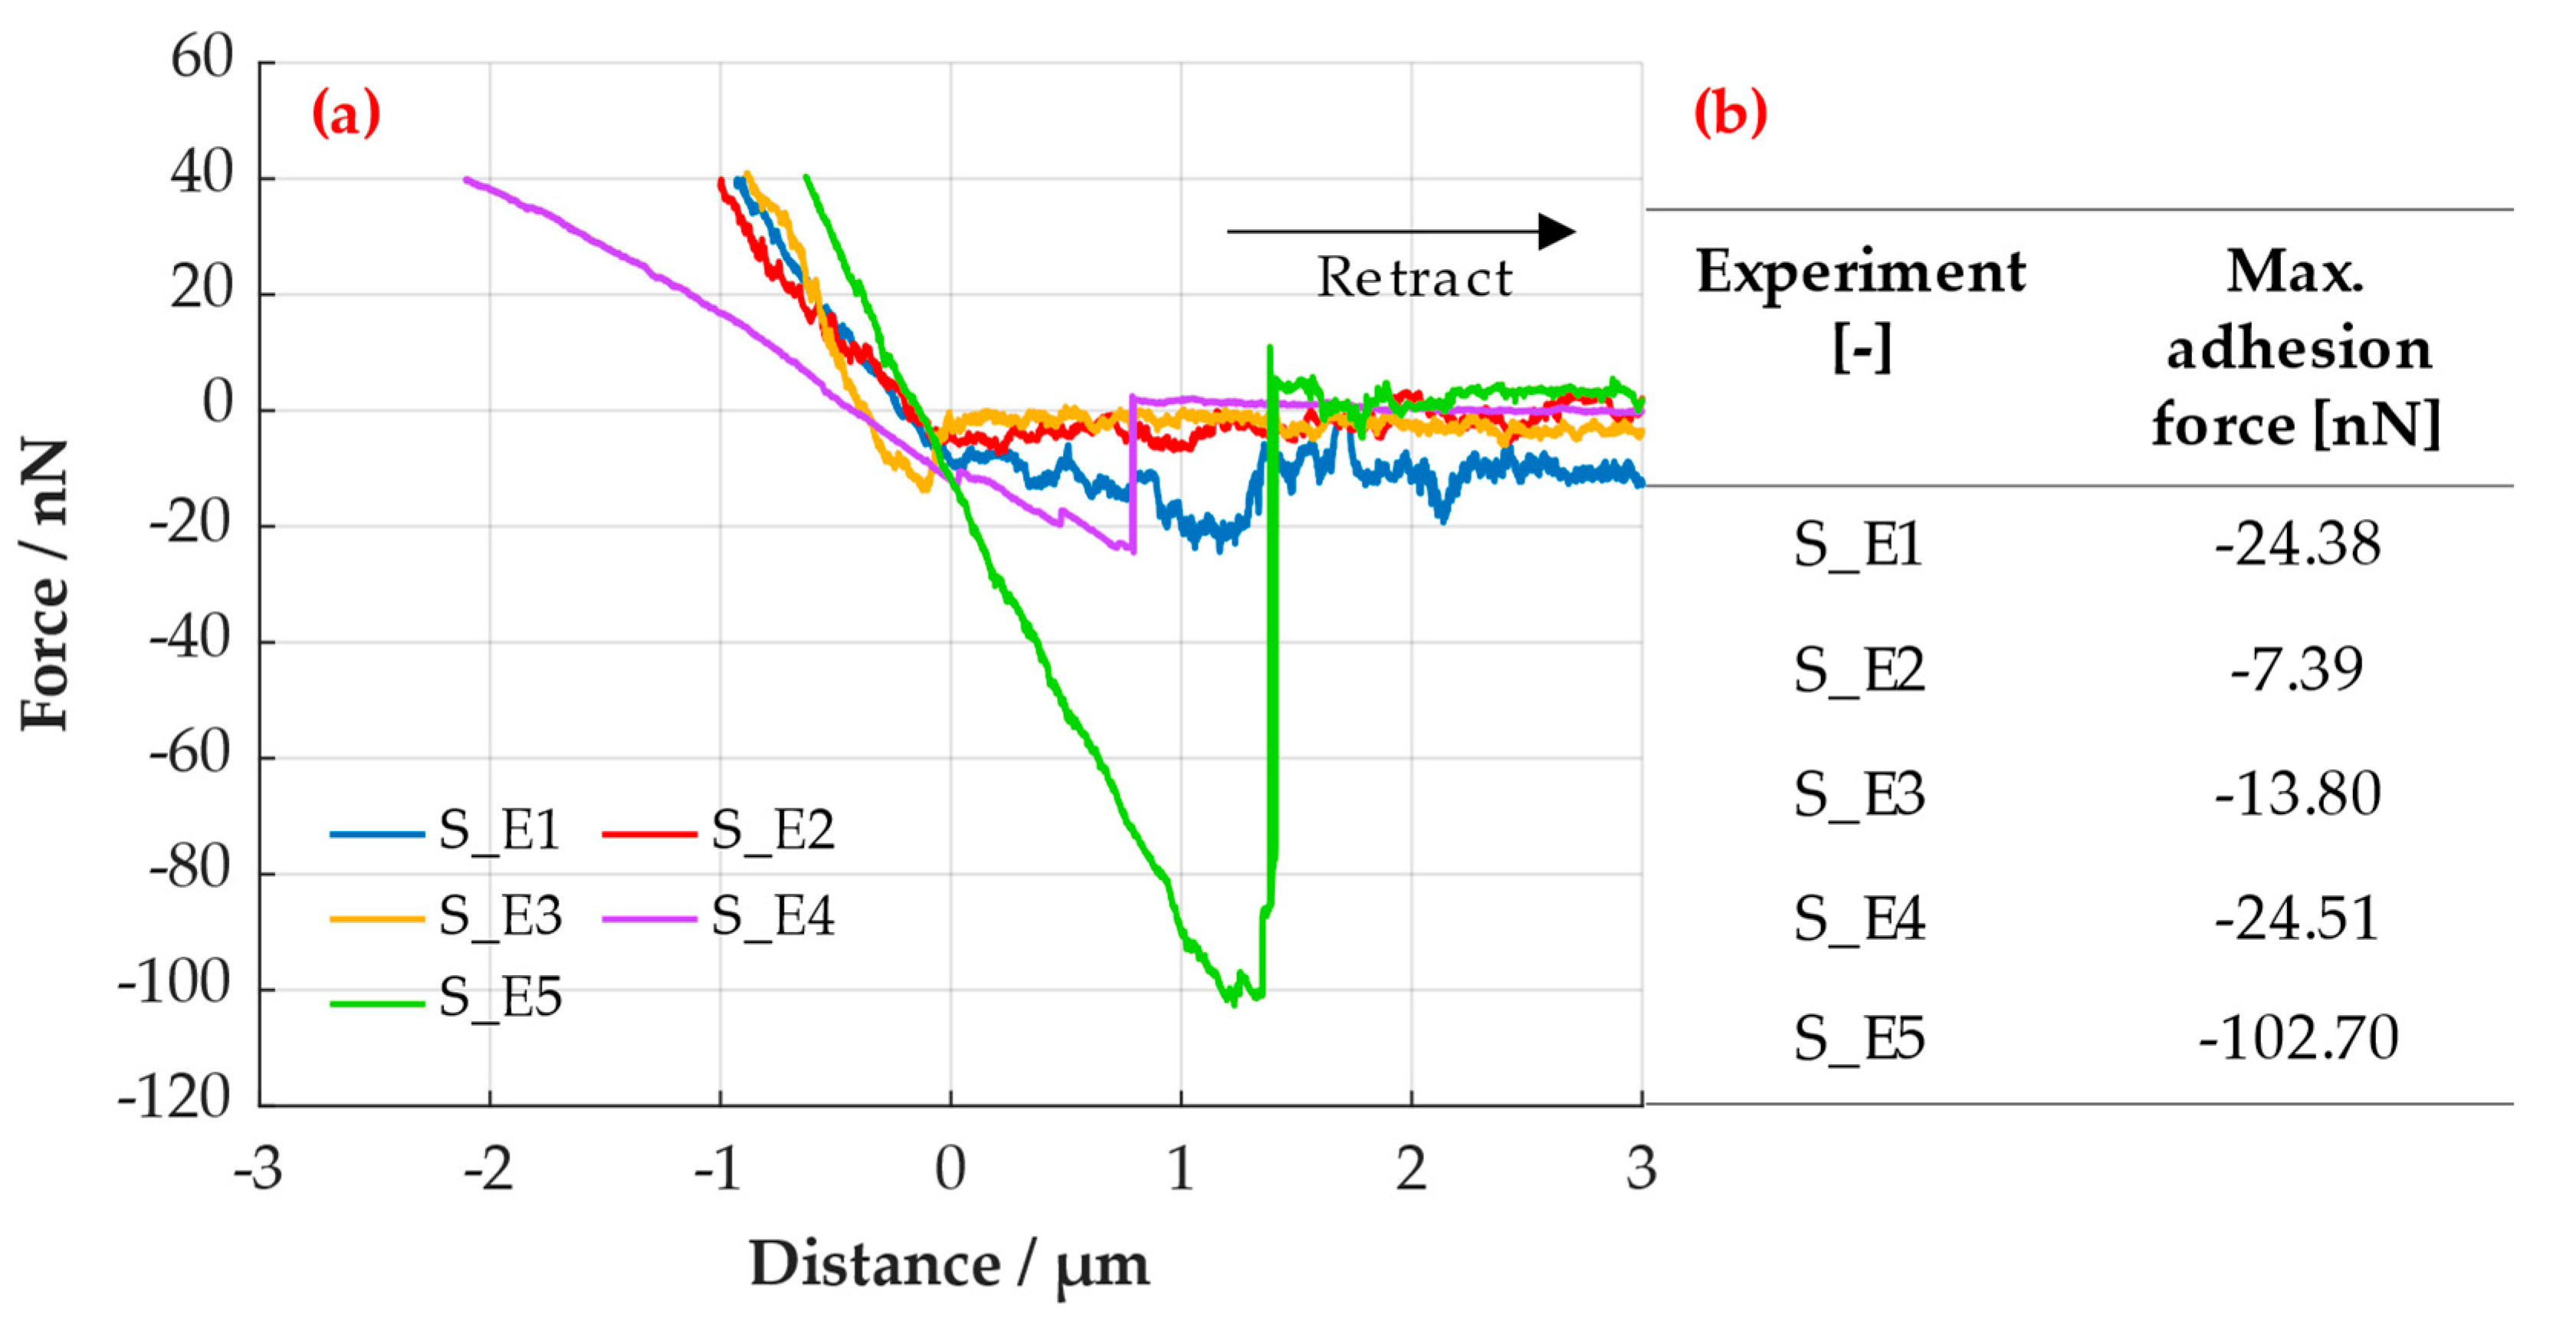
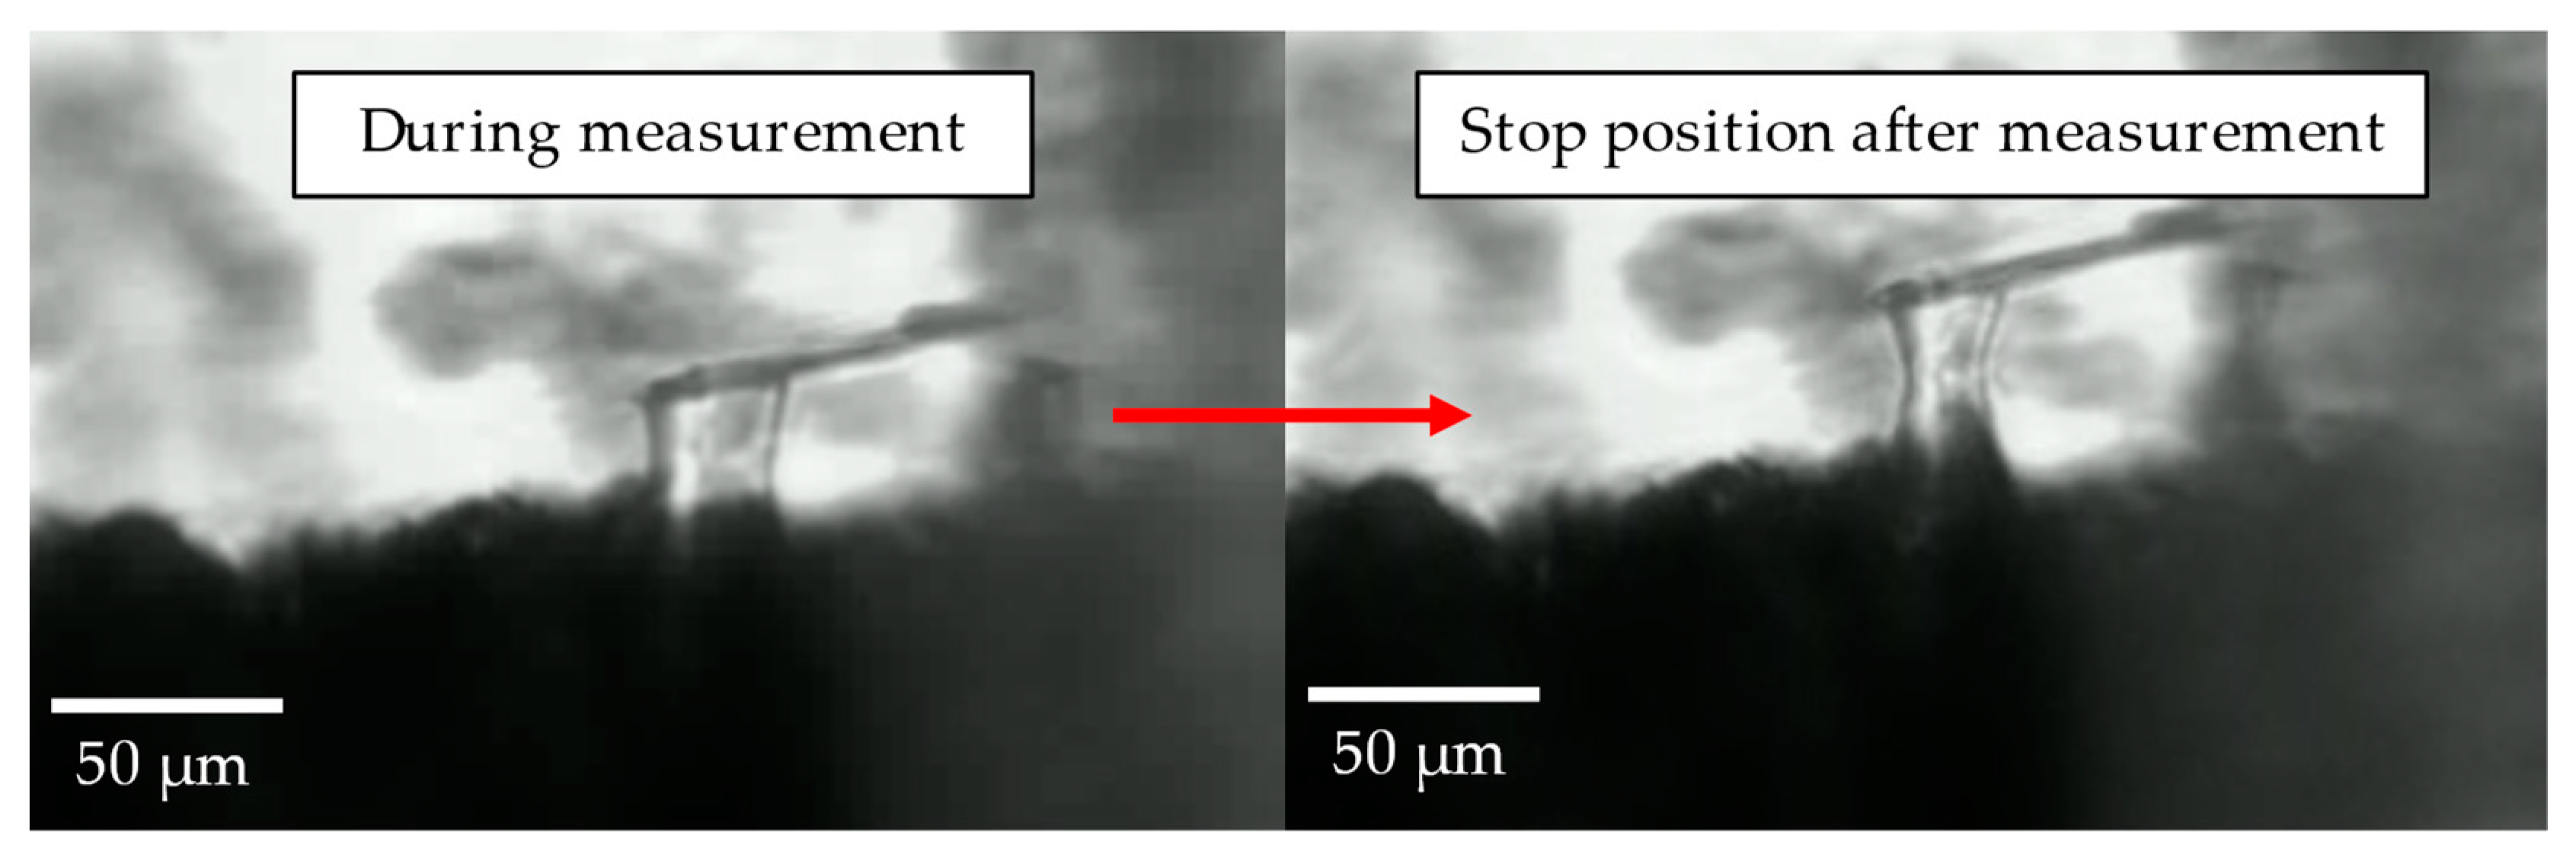
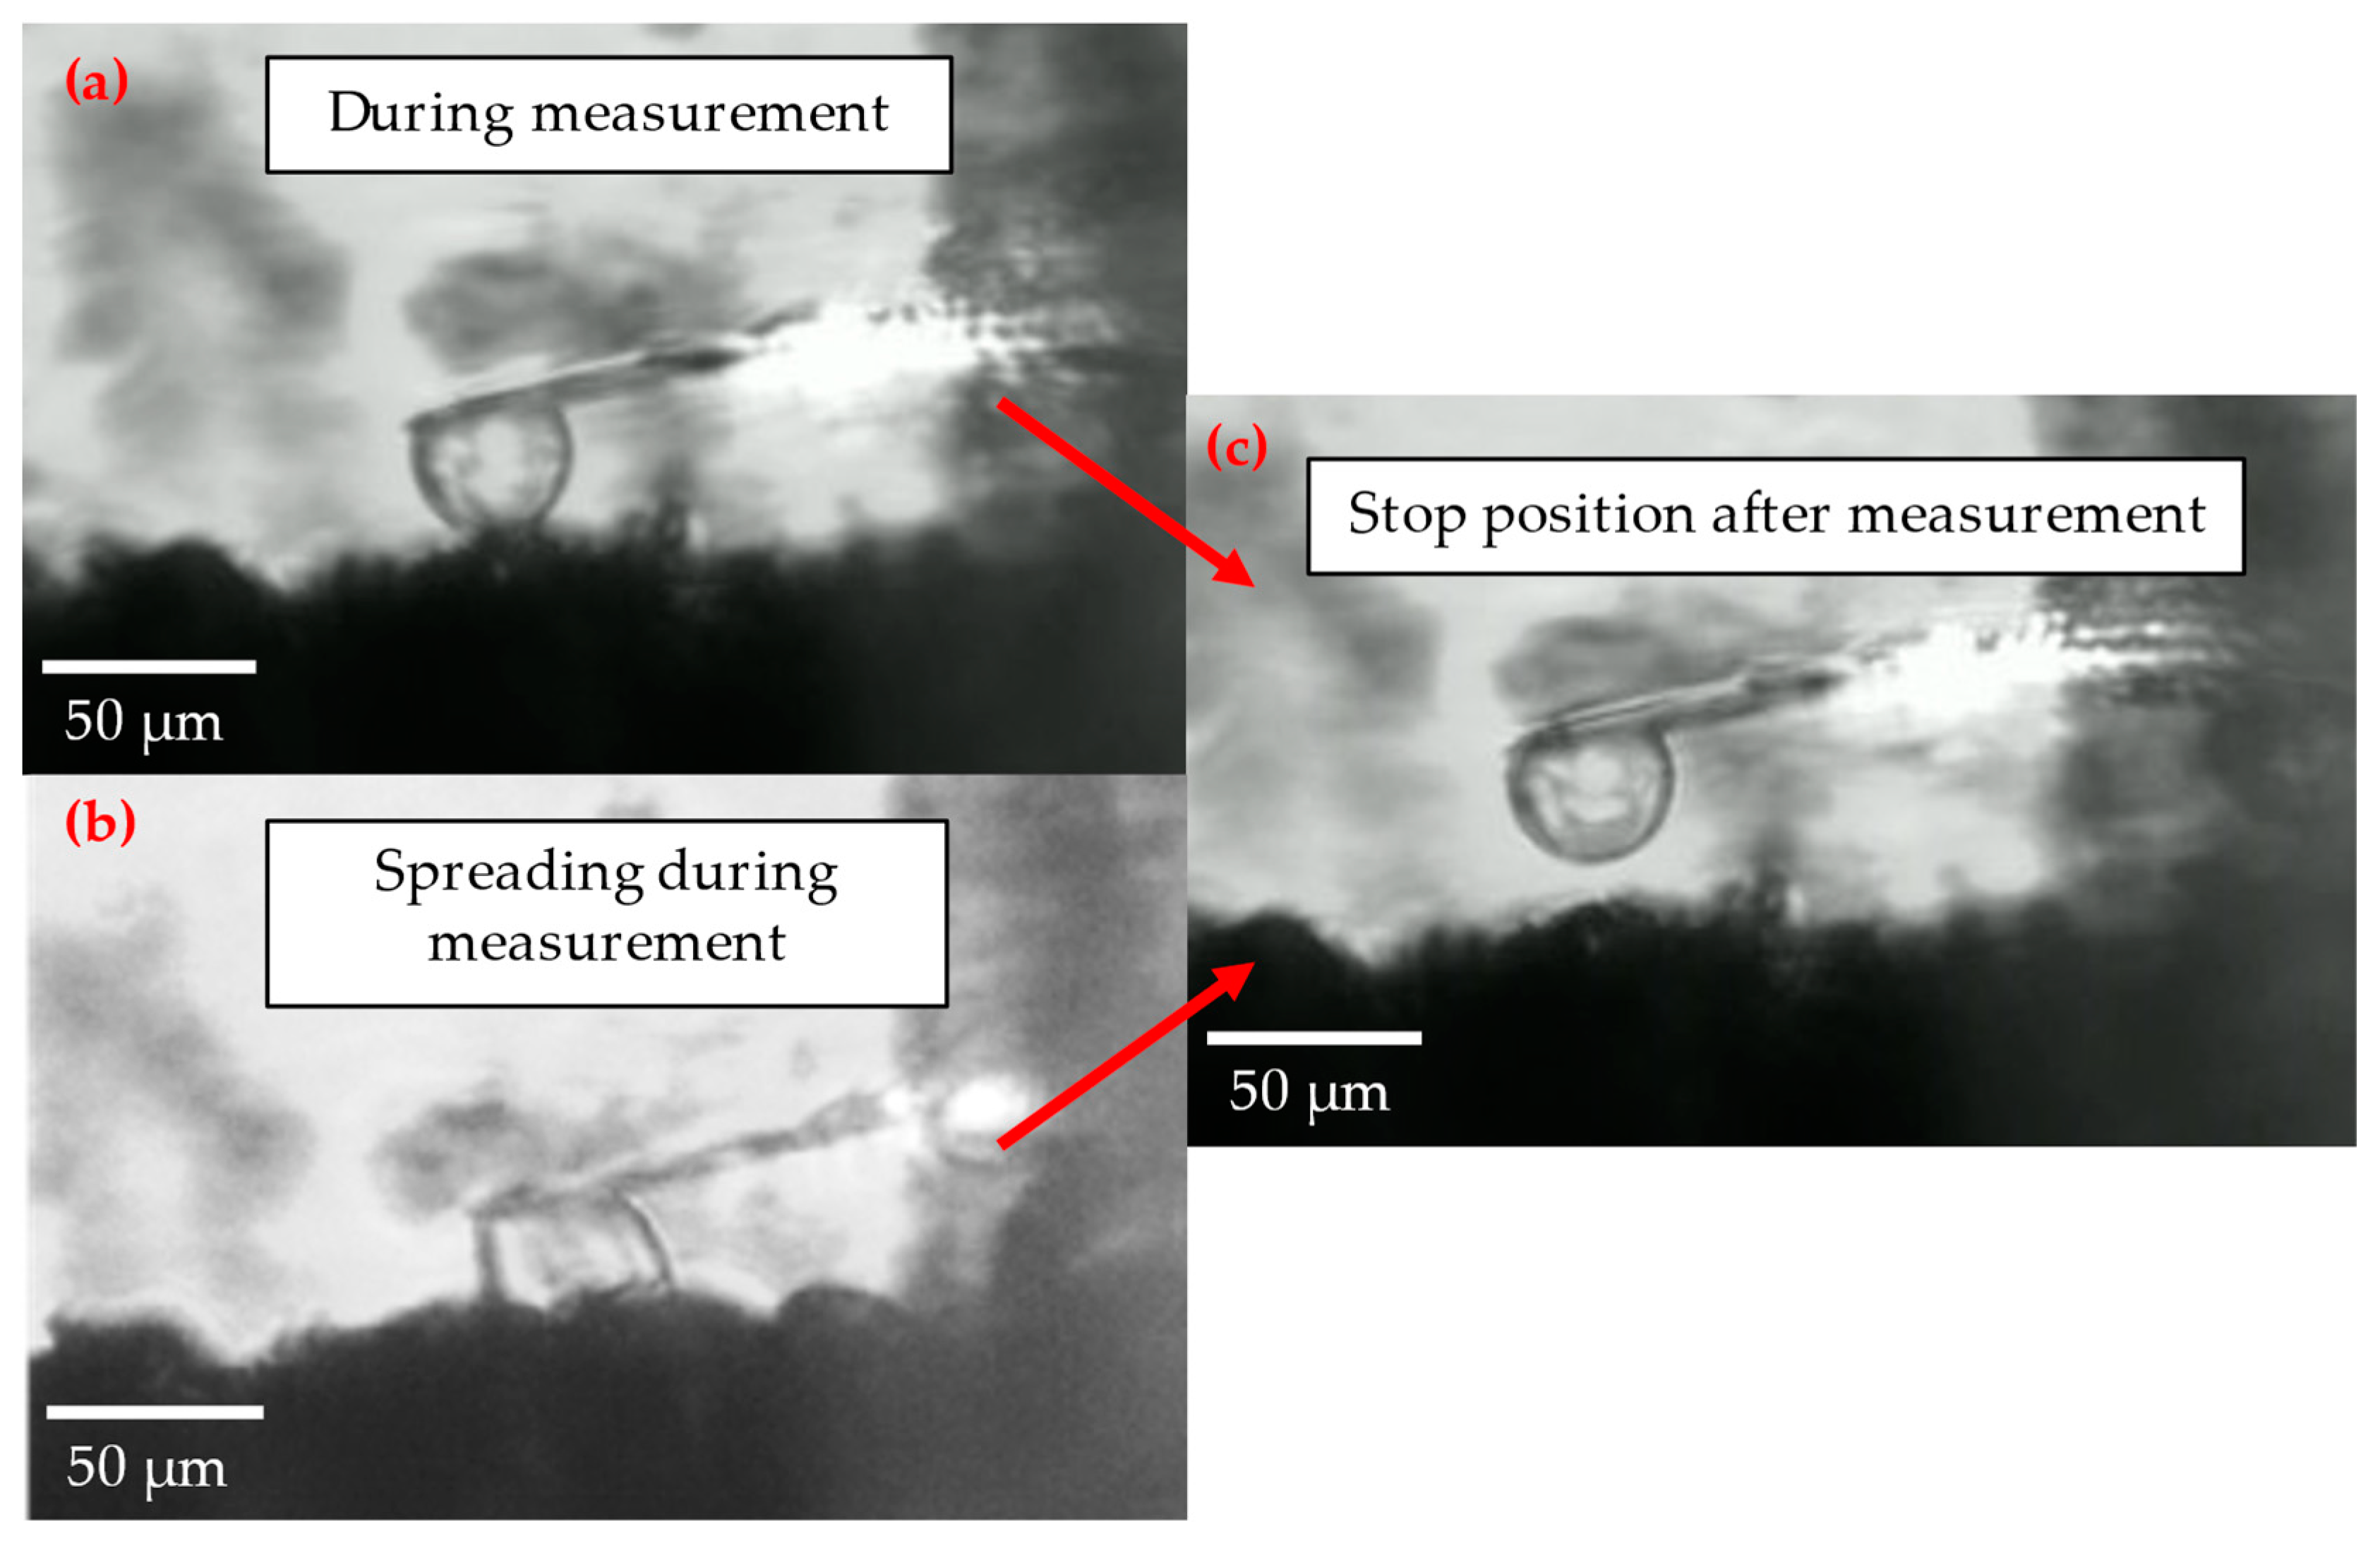
3. Results and Discussion

As the maximum adhesion force is to be discussed, only the retract curves of the experiments and the values of the measured maximum adhesion force will be presented in this section. The complete force–distance curves considered, including the approach curves, can be found in the Appendix A (glass surface) and Appendix B (sandpaper surface).
The adhesion force measured in water between a paraffin oil droplet and a glass surface is represented by the force–distance curves displayed in Figure 6a. The five distinct curves show the interaction forces at different points on the surface model. Measurements are taken at different positions to analyze the differences in surface texture. The retraction begins when the predetermined stop value of 40 nN is reached. At this point, the cantilever holding the droplet starts to separate from the surface and shows detectable adhesion in all five experiments, as indicated by negative peaks in the measured force. The peaks were identified by examining each curve individually, indicating the maximum adhesion forces which range from −2.01 nN to −4.78 nN (see Figure 6c).
The consistent slope of the curves indicates that the surface is homogenous in terms of its mechanical response. If there were variations in material composition across the surface, variations in the slope are to be expected. Although the curves were generally close together, it is important to note that there were slight variations in the maximum adhesion forces. These variations may be due to the influence of several factors. One factor is the size of the paraffin oil droplet. To ensure a consistent droplet size, and thus the reproducibility of the experiments performed, side images were taken to verify the measurements. After the recording of a force–distance curve, the droplet size was checked before starting another measurement. As shown in Figure 6b, the images also helped to ensure that the droplet was in contact with the surface during the measurement process. To do this, the cantilever with the droplet had to be moved manually to the next position in the focal plane of the prism, with the resulting quality of the side image being limited by the resolution of the inverted microscope. As a result, changes in size can only be observed to a limited extent. Another important factor is that even apparently flat surfaces can have microscopic irregularities. These microscopic irregularities on the glass surface can cause variations in the maximum adhesion forces.
In summary, the first adhesion force measurements between the droplet and the glass surface were successfully performed using the predefined parameters for the FluidFM® system. The measured force–distance curves show an adhesion behavior primarily characterized by uniformity and low maximum adhesion forces with only slight variations, as expected for the flat surface. The low adhesion forces indicate a limited wetting of the surface by the paraffin oil, which is confirmed by a high measured average contact angle of 145.45° for this system. The full comparison between adhesion forces and contact angles will be discussed in detail later.
By way of comparison, force–distance curves were obtained between the droplet and a sandpaper surface with roughness. Rough surfaces are more challenging to measure than flat-glass surfaces due to their unevenness and varying voids. It is therefore likely that there will be significant variations in both the maximum adhesion force and the trajectory of the curve. These variations are supported by the force–distance curves from different experiments carried out at different locations on the sandpaper, as shown in Figure 7a. The experiments show a wide range of fluctuation in the maximum adhesion forces, from −7.39 nN to −102.70 nN (refer to Figure 7b).
In one case, it was found that the force remained constantly negative over the entire area of the retraction distance (see Figure 7a, Experiment S_E1). As the distance between the paraffin oil droplet and the rough sandpaper surface increased, the side images show that the droplet still adhered to the surface after the measurement (see Figure 8). In this case, the maximum retraction z-length was not sufficient to cause the droplet to be detached from the surface. This results in a permanent capillary force, measured as an adhesion force.
Experiments S_E2 and S_E3 also showed a force distribution with fluctuations over the retraction length but in the lower nanonewton range. The lowest value of the maximum adhesion force was measured in experiment S_E2 at −7.39 nN and a value almost twice as high was measured in experiment S_E3. In contrast to the first three experiments, S_E4 shows a classic progression of the force–distance curve with almost no fluctuations and a maximum adhesion force of −24.51 nN. The measured curve of experiment S_E5 shows a surprisingly high maximum adhesion force of −102.70 nN. One reason for this could be the roughness and surface structure of the sandpaper. As measurements are made locally, an experiment can be made on the tip of a single particle with a small contact area, resulting in small values for the maximum adhesion force. On the other hand, a measurement can be taken in a gap between several particles, resulting in multiple contact points which can lead to a significantly increased maximum adhesion force. This could be the case with experiment S_E5, but it is difficult to prove this hypothesis. The FluidFM® system is equipped as standard with a camera for a top and a 45° view of the cantilever and surface. Due to reflections from the water surface caused by the laser aimed at the cantilever and the external light source, it is not possible to visualize the topography at the measurement points from above or at a 45° angle. Due to these circumstances, the experimental setup (see Figure 4) takes images in a plane–parallel view to the surface. It is therefore not possible to obtain precise optical information about the surface topography of the measurement points.
Besides the differences in the maximum adhesion forces, it is evident that the curves have distinct gradients. The steepness of a force–distance curve can provide insight into the deformation characteristics of the droplet during the interaction. If the roughness of the sandpaper surface is non-uniform, as can be observed in the microscope images in Section 2, the retraction curve may feature various slopes as the droplet interacts with different irregularities on the surface. For liquid droplets, a force–distance curve that is steeper indicates that the droplet has limited spreading on the surface. As a result, the droplet retains a more compressed shape that resists significant lateral expansion (see Figure 9a). A flattened curve signifies greater droplet deformation, spreading over a larger area of the sandpaper and requiring a larger distance range to reach the stop value force (see Figure 9b). Except for experiment S_E1, the droplet remained stationary at the cantilever tip for all other measurements in the stop position upon competition, as shown in Figure 9c exemplary.
Both the regular retract curves, which clearly show a maximum adhesion force, and the curves displaying an adhesion force distribution or even a distribution of capillary forces, have occurred in the experiments. These effects can be attributed to the complex interaction of the surface topography and wettability. The rough surface measurements indicate a complex system with significantly higher adhesion forces than the flat surface, as predicted. To verify this outcome, the maximum adhesion forces should be compared to the results of the contact angle measurements regarding the wetting properties of the model materials. Figure 10 shows the results for the adhesion force and contact angle measurements of five experiments for each surface.
As previously stated, the maximum adhesion forces acting upon glass show minimal values with slight variances. The maximum adhesion force, averaged over five tests, is 3.01 nN. Conversely, the sandpaper displays a greater average adhesion force overall (Favg = −34.56 nN), with significant fluctuations in a wide range. These findings suggest that the sandpaper surface exhibits improved wetting properties compared to the glass surface when utilizing paraffin oil.
Examining the contact angle measurements taken on the glass, a clear trend can be observed. The experiments indicate high contact angles, with an average of 145.45° (min: 140.39°, max: 147.67°). It is evident that the contact angle distribution in this case is minimal. In comparison, the contact angles measured with sandpaper are lower but with highly variable values (avg: 120.17°, min: 92.52°, max: 141.09°). These measurements demonstrate good agreement with the higher adhesion forces and, hence, indicate better wetting properties. The measurements against the flat glass serve as validation for this purpose. From these initial experiments, it is therefore possible to compare the interaction between immersed droplets and solid surfaces using both techniques.
In the case of rough surfaces, both contact angle and adhesion force experiments show the complexity of interpreting the contact mechanics. For the contact angles between droplets and rough surfaces, there are studies describing scattering results as a cause of surface topography [6] and the contact angle elevation at the edges [26]. The edges occur due to the irregular shape of the particles and their random orientation on the substrate. Therefore, a contact angle or adhesion force distribution is to be expected because the measurements are performed locally on the edges or smooth surfaces. In general, these investigations should lead to a better understanding of the measurement behavior between droplets and real particle surfaces using FluidFM® technology and the correlation of wetting properties with the measured adhesion forces.

4. Conclusions

This work has demonstrated the potential for measuring adhesion forces between a droplet and varied surfaces in a liquid environment with the help of FluidFM® technology. In these initial trials, it has been demonstrated that adhesion force measurements can be linked to contact angle measurements to investigate wetting properties in three-phase systems. In more fundamental experiments, the effect of varying droplet sizes and spring constants on the maximum adhesion force on flat-glass surfaces is investigated. These factors are also studied on rough surfaces simulating real particle surfaces. This requires an improvement in the accurate determination of the topography at each measurement point and the use of this topography to better describe the measured force–distance curves. Further fundamental studies are planned to transfer these measurements taken from model surfaces to real measurements on a fixed EnAM crystal layer.
Higher adhesion forces are expected to result in the formation of more stable micro-agglomerates during the wetting phase, which is the basis of the selective wet agglomeration. Agglomeration experiments are being planned to use the knowledge obtained from adhesion force measurements between binding liquid droplets and fixed EnAM crystals. In the future, the outcome of the agglomeration experiments will be correlated with the results gained from FluidFM®. The versatility of the FluidFM® system also allows for the adjustment of parameters such as pH and surfactant type and concentration. This offers the potential for a deeper understanding and description of the wetting behavior of EnAM crystals under the influence of parameter variations, which is also part of the future work. The results of the adhesion force measurements with the FluidFM® technology should contribute to a broader understanding of the wetting behavior in three-phase systems and pave the way for potential applications in a wide range of fields.

Author Contributions

L.S.: conceptualization, methodology, formal analysis, investigation, data curation, writing—original draft, and visualization; U.B.: conceptualization, resources, writing—review and editing, supervision, funding acquisition, and project administration. All authors have read and agreed to the published version of the manuscript.

Funding

This research was funded by the German Research Foundation (DFG) within the priority program SPP 2315 “Engineered Artificial Minerals (EnAM)” (Project number: 470538422).

Data Availability Statement

The data generated in this study is available from the corresponding author upon request.

Conflicts of Interest

The authors declare no conflicts of interest.

Appendix A

Figure A1. Force–distance curve of experiment G_E1.
Processes 12 00099 g0a1
Figure A2. Force–distance curve of experiment G_E2.
Processes 12 00099 g0a2
Figure A3. Force–distance curve of experiment G_E3.
Processes 12 00099 g0a3
Figure A4. Force–distance curve of experiment G_E4.
Processes 12 00099 g0a4
Figure A5. Force–distance curve of experiment G_E5.
Processes 12 00099 g0a5

Appendix B

Figure A6. Force–distance curve of experiment S_E1.
Processes 12 00099 g0a6
Figure A7. Force–distance curve of experiment S_E2.
Processes 12 00099 g0a7
Figure A8. Force–distance curve of experiment S_E3.
Processes 12 00099 g0a8
Figure A9. Force–distance curve of experiment S_E4.
Processes 12 00099 g0a9
Figure A10. Force–distance curve of experiment S_E5.
Processes 12 00099 g0a10

References

  1. Elwert, T.; Strauss, K.; Schirmer, T.; Goldmann, D. Phase composition of high lithium slags from the recycling of lithium ion batteries. World Metall.-Erzmetall 2012, 65, 163–171. [Google Scholar]
  2. Velázquez-Martínez, O.; Valio, J.; Santasalo-Aarnio, A.; Reuter, M.; Serna-Guerrero, R. A Critical Review of Lithium-Ion Battery Recycling Processes from a Circular Economy Perspective. Batteries 2019, 5, 68. [Google Scholar] [CrossRef]
  3. Cattermole, A.E. Classification of the Metallic Constituents of Ores. U.S. Patent No. US763259A, 21 June 1904. [Google Scholar]
  4. Cassie, A.B.D.; Baxter, S. Wettability of porous surfaces. Trans. Faraday Soc. 1944, 40, 546–551. [Google Scholar] [CrossRef]
  5. Fritzsche, J.; Peuker, U.A. Wetting and adhesive forces on rough surfaces—An experimental theoretical study. Procedia Eng. 2015, 102, 45–53. [Google Scholar] [CrossRef]
  6. Kubiak, K.J.; Wilson, M.C.T.; Mathia, T.G.; Carval, P. Wettability versus roughness of engineering surfaces. Wear 2011, 271, 523–528. [Google Scholar] [CrossRef]
  7. Rays, B.R.; Bartell, F.E. Hysteresis of contact angle of water on paraffin—Effect of surface roughness and of purity of paraffin. J. Colloid Sci. 1952, 8, 214–223. [Google Scholar]
  8. Xia, W.; Ni, C.; Xie, G. The influence of surface roughness on wettability of natural/gold-coated ultra-low ash coal particles. Powder Technol. 2018, 288, 286–290. [Google Scholar] [CrossRef]
  9. Meister, A.; Gabi, M.; Behr, P.; Studer, P.; Vörös, J.; Niedermann, P.; Bitterli, J.; Polesel-Maris, J.; Liley, M.; Heinzelmann, H.; et al. FluidFM: Combining atomic force microscopy and nanofluidics in a universal liquid delivery system for single cell applications and beyond. Nano Lett. 2009, 9, 2501–2507. [Google Scholar] [CrossRef]
  10. Guillaume-Gentil, O.; Grindberg, R.V.; Kooger, R.; Dorwling-Carter, L.; Martinez, V.; Ossola, D.; Pilhofer, M.; Zambelli, T.; Vorholt, J.A. Tunable Single-Cell Extraction for Molecular Analyses. Cell 2016, 166, 506–516. [Google Scholar] [CrossRef]
  11. Guillaume-Gentil, O.; Potthof, E.; Ossola, D.; Franz, C.M.; Zambelli, T.; Vorholt, J.A. Force-controlled manipulation of single cells: From AFM to FluidFM. Trends Biotechnol. 2014, 32, 381–388. [Google Scholar] [CrossRef]
  12. Helenius, J.; Heisenberg, C.-P.; Gaub, H.E.; Muller, D.J. Single-cell force spectroscopy. J. Cell Sci. 2008, 121, 1785–1791. [Google Scholar] [CrossRef]
  13. Selhuber-Unkel, C.; Erdmann, T.; Lopez-Garcia, M.; Kessler, H.; Schwarz, U.S.; Spatz, J.P. Cell Adhesion Strength Is Controlled by Intermolecular Spacing of Adhesion. Biophys. J. 2012, 98, 543–551. [Google Scholar] [CrossRef] [PubMed]
  14. Sztilkovics, M.; Gerecsei, T.; Peter, B.; Saftics, A.; Kurunczi, S.; Szekacs, I.; Szabo, B.; Horvath, R. Single-cell adhesion force kinetics of cell populations from combined label-free optical biosensor and robotic fluidic force microscopy. Sci. Rep. 2020, 10, 61. [Google Scholar] [CrossRef] [PubMed]
  15. Nagy, A.G.; Bonyar, A.; Szekacs, I.; Horvath, R. Analysis of single-cell force-spectroscopy data of Vero cells recorded by FluidFM BOT. In Proceedings of the IEEE 26th International Symposium for Design and Technology in Electronic Packaging (SIITME), Pitesti, Romania, 21–24 October 2020; pp. 21–25. [Google Scholar]
  16. Potthoff, E.; Ossola, D.; Zambelli, T.; Vorholt, J.A. Bacterial adhesion force quantification by fluidic force microscopy. Nanoscale 2015, 7, 4070–4079. [Google Scholar] [CrossRef] [PubMed]
  17. Ossola, D.; Amarouch, M.Y.; Behr, P.; Voros, J.; Abriel, H.; Zambelli, T. Force-controlled patch clamp of beating cardiac cells. Nano Lett. 2015, 15, 1743–1750. [Google Scholar] [CrossRef] [PubMed]
  18. Guillame-Gentil, O.; Rey, T.; Kiefer, P.; Ibanez, A.J.; Steinhoff, R.; Brönnimann, R.; Dorwling-Carter, L.; Zambelli, T.; Zenobi, R.; Vorholt, J.A. Single-Cell Mass Spectrometry of Metabolites Extracted from Live Cells by Fluidic Force Microscopy. Anal. Chem. 2017, 89, 5017–5023. [Google Scholar] [CrossRef] [PubMed]
  19. Dörig, P.; Stiefel, P.; Behr, P.; Sarajic, E.; Bijl, D.; Gabi, M.; Vörös, J.; Vorholt, J.A.; Zambelli, T. Force-controlled spatial manipulation of viable mammalian cells and micro-organisms by means of FluidFM technology. Appl. Phys. Lett. 2010, 97, 023701. [Google Scholar] [CrossRef]
  20. Guillaume-Gentil, O.; Potthoff, E.; Ossola, D.; Dorig, P.; Zambelli, T.; Vorholt, J.A. Force-controlled fluidic injection into single cell nuclei. Small 2013, 9, 1904–1907. [Google Scholar] [CrossRef]
  21. Potthoff, E.; Guillaume-Gentil, O.; Ossola, D. Rapid and serial quantification of adhesion forces of yeast and mammalian cells. PLoS ONE 2012, 7, e52712. [Google Scholar] [CrossRef]
  22. Demir, I.; Lüchtefeld, I.; Lemen, C.; Dague, E.; Guiraud, P.; Zambelli, T.; Formosa-Dague, C. Probing the interactions between air bubbles and (bio)interfaces at the nanoscale using FluidFM technology. J. Colloid Interface Sci. 2021, 604, 785–797. [Google Scholar] [CrossRef]
  23. Binnig, G.; Quate, C.F.; Gerber, C. Atomic force microscope. Phys. Rev. Lett 1986, 56, 930–933. [Google Scholar] [CrossRef]
  24. Li, M.; Xi, N.; Wang, Y.C.; Liu, L.Q. Atomic force microscopy for revealing micro/nanoscale mechanics in tumor metastasis: From single cells to microenvironmental cues. Acta Pharmocol. Sin. 2021, 42, 323–339. [Google Scholar] [CrossRef]
  25. Schreier, J.; Furat, O.; Cankaya, M.; Schmidt, V.; Bröckel, U. Automated evaluation of contact angles in a three-phase system of selective agglomeration in liquids. Image Anal. Stereol. 2020, 39, 187–196. [Google Scholar] [CrossRef]
  26. Morrow, N.R. Physics and Thermodynamics of Capillary Action in Porous Media. Ind. Eng. Chem. 1970, 62, 32–56. [Google Scholar] [CrossRef]
Figure 1. Sandpaper surface used as substitute for a rough particle surface: (a) Image taken with a digital microscope (Keyence, VHX-700FD); (b) height profile of the sandpaper surface taken using the digital depth composition function (Keyence, VHX-700FD).
Processes 12 00099 g001
Figure 2. FluidFM® cantilever/micropipette with an aperture of 4 µm in diameter seen through an inverted microscope.
Processes 12 00099 g002
Figure 3. Exemplary approach (red) and retract curve (blue) with respective cantilever deflection of an AFM measurement.
Processes 12 00099 g003
Figure 4. Schematic representation of the setup. With the prism placed next to the samples, it is possible to visualize the cantilever and the droplets produced. The red color line shows the laser for measuring the deflection of the cantilever, the yellow color line represents the light path of the external light source.
Processes 12 00099 g004
Figure 5. Schematic representation of the sessile drop method for evaluating the contact angle in a three-phase system.
Processes 12 00099 g005
Figure 6. Adhesion force measurements between a paraffin oil droplet and a flat-glass surface in water: (a) force–distance curves of five experiments at different positions of the glass surface; (b) exemplary image of the micropipette with a droplet in contact to the flat-glass surface at a stop value of 40 nN; and (c) values of the measured maximum adhesion forces for each experiment.
Processes 12 00099 g006
Figure 7. Results of adhesion force measurements between a paraffin oil droplet and a rough sandpaper surface in water: (a) force–distance curves of five experiments on different positions of the sandpaper surface and (b) maximum adhesion force measured for each experiment.
Processes 12 00099 g007
Figure 8. Side image of the droplet stuck on the surface explaining the remaining negative adhesion force over a longer retraction distance (Experiment S_E1).
Processes 12 00099 g008
Figure 9. Exemplary horizontal images of the measurements against the sandpaper surface showing different behaviors of the droplet in contact with the surface, resulting in different slopes of the force–distance curves: (a) limited spreading of the droplet; (b) greater droplet deformation and spreading; and (c) similar behavior at stop position after the experiment.
Processes 12 00099 g009
Figure 10. Comparison of the results: (a) maximum measured adhesion forces for five experiments carried out on the glass and sandpaper surface and (b) contact angles of five experiments for each of the model surfaces.
Processes 12 00099 g010
Disclaimer/Publisher’s Note: The statements, opinions and data contained in all publications are solely those of the individual author(s) and contributor(s) and not of MDPI and/or the editor(s). MDPI and/or the editor(s) disclaim responsibility for any injury to people or property resulting from any ideas, methods, instructions or products referred to in the content.

