Article

Extrapolation Framework and Characteristic Analysis of Load Spectrum for Agriculture General Power Machinery

1
College of Mechanical and Electronic Engineering, Northwest A&F University, No. 3 Taicheng Road, Yangling District, Yangling 712100, China
2
State Key Laboratory for Manufacturing Systems Engineering, Xi’an Jiaotong University, West Building 5, 99# Yanxiang Road, Yanta District, Xi’an 710054, China
3
Scientific Observing and Experimental Station of Agricultural Equipment for the Northern China, Ministry of Agriculture, No.22 Xinong Road, Yangling District, Yangling 712100, China
*
Authors to whom correspondence should be addressed.
Processes 2024, 12(10), 2078; https://doi.org/10.3390/pr12102078
Submission received: 2 September 2024 / Revised: 19 September 2024 / Accepted: 23 September 2024 / Published: 25 September 2024
(This article belongs to the Section Food Process Engineering)

Abstract

:
As a crucial step in food production, tillage and land preparation play a pivotal role in achieving sustainable crop production and improving the soil environment. However, accurate assessment of the load that agricultural machinery implements during the operation process has always been a vexing problem that needs urgent solutions. In this paper, an extrapolation and reconstruction framework for the time-domain load is constructed based on the probability-weighted moments (PWM) estimation and the peaks-over-threshold function, and the load spectrum is obtained for agriculture general power machinery. Firstly, the load acquisition system was developed, the traction resistance and output torque of the tractor were measured, and the collected load signals were preprocessed. Next, the mean excess function and PWM estimation are introduced to select the optimal threshold and generalized Pareto distribution (GPD) fitting parameters and the extreme load distribution that exceeds the threshold range is fitted. The extreme points in the original data are replaced by generating new extreme points that follow the GPD distribution, and the extrapolation of the load spectrum is achieved. Finally, the real extrapolated load spectrum was validated based on statistical characteristics and rainflow counting analysis, and the correlation coefficient between the fitting data and the extreme load samples was greater than 0.99. It can retain the load sequence characteristics of the original load to a great extent, truly reflecting the load state during the operation of agricultural machinery. Meanwhile, the characteristics of the load spectrum can be accurately obtained, such as extreme, mean, and amplitude values, and the real load during deep loosening and rotary tillage are accurately described. The values provide more authentic and reliable data support for the subsequent selection of optimal operating parameters, reliability design of the power transmission system, and the life assessment of the agricultural implements.

1. Introduction

The tillage and land preparation are key stages in food production, mainly including deep loosening and rotary tillage, aiming to create a good soil structure and surface state, improve soil fertility, and provide favorable conditions for seeding, crop growth, and field management. However, the operation process involves interaction between machinery and soil, as well as straw, which results in significant loads being borne by the agricultural machinery and its working components. Clarifying the load data during the operation process can provide data support for the design of key components and power matching of agricultural power machinery. In actual operation, due to the unevenness of soil texture and complex surface conditions, the load data borne by agricultural machinery often exhibits unstable characteristics, and it is difficult to obtain true and accurate load information. So, accurate assessment of the load for agriculture general power machinery is an important issue in food production, and this lack of precise load data support makes it challenging to design agricultural machinery accurately and select the optimal operating parameters of agricultural processes.
The load spectrum is the most direct representation of load data, which is the basis of fatigue life and reliability design, which has a wide range of applications in aerospace [1], vehicle [2], machine tool [3], wind power [4], and other fields [5]. For the agriculture general power machinery, the tractor is hailed as a versatile and multipurpose power machine, and power take-off (PTO) and three-point suspension systems are important components for driving agricultural implements such as straw returning, deep loosening, and rotary tillage, and its performance and reliability have a direct impact on the quality and efficiency of agricultural operations. However, due to the complexity of tractor operation scenarios, the variability of loads, and the intensity of usage, the requirements for evaluating the overall fatigue durability and reliability of tractors are increasing. Therefore, compiling a realistic load spectrum is crucial for evaluating the performance of agricultural power machinery and developing new products.
The load spectrum can accurately assess the load conditions during operation. It can be an important data foundation for the structural optimization and reliability design of transmission systems, providing strong support for the structural design and optimization of agricultural machinery. During operation, these data provide important references for matching operational efficiency, quality, and fuel consumption, laying the technical foundation for achieving efficient and high-quality operational processes, contributing to achieving good soil structure and a conducive environment for crop growth. Therefore, the results not only provide a scientific basis for the design and improvement of agricultural machinery but also establish a theoretical foundation for enhancing operational efficiency, prolonging service life, and reducing operation and maintenance costs.
To comprehensively obtain the loads that can occur throughout the entire life cycle, especially the extreme loads under extreme conditions, which have a significant impact on the product life, the process of compiling a true and accurate load spectrum is particularly important. The process of compiling the load spectrum mainly includes the collection and processing of load data, load extrapolation and prediction, as well as load spectrum evaluation and application. Hansson et al. utilized a testing system that includes strain gauge transducers, fuel consumption sensors, and engine speed sensors to estimate the effects of transient load components on the fuel efficiency of agricultural tractor engines [6]. Roeber et al. installed a sensor on the PTO shaft to measure the torque delivered by the implement [7]. Upadhyay et al. set a bellow coupling between the torque transducer and the telescopic shaft to protect the measurement unit and maintain an in-line connection, then obtained the load data [8]. Hensh et al. developed a wireless instrumentation system to test the torque data of PTO agricultural machinery without disturbance in telescopic action or vertical inclination of the Cardan shaft [9]. Dai et al. obtained four representative vertical acceleration signals from the front and rear axles of the tractor to collect vibration load data [10]. Although, theoretically, the load spectrum can be derived from installing sensors to gather load data throughout the entire service life of a product. Nevertheless, due to constraints in the measurement environment and cost, it is impractical to directly collect a substantial amount of real load data. However, accurate measurement technology for short-term loads provides the data foundation for acquiring the load spectrum.
Load extrapolation and prediction are the key technologies of the load spectrum. In recent years, numerous methods have been proposed to provide a feasible and reliable approach for obtaining a long-term load spectrum [11]. Agarwal et al. deduced the long-term loads based on the peaks-over-threshold method and three-parameter Weibull distribution, resulting in a satisfactory extrapolated outcome [12]. Heidenreich et al. researched the bandwidth selections for kernel density estimation and identified some methods that can be applied in non-parametric extrapolation techniques [13]. Socie et al. presented a method for statistically extrapolating a measured service load time history to obtain an expected long-term load spectrum [14]. Chen et al. proposed a method for dynamically generating a representative load spectrum [15]. Wang et al. developed a method for selecting the appropriate threshold using multi-criteria decision-making technology, resulting in the extrapolation of extreme loads [16]. Wang et al. proposed a peaks-over-threshold loading method that utilizes the dynamic load spectrum obtained from fieldwork, specifically targeting PTO torque load as the subject [17]. Johannesson first proposed the time-domain load extrapolation method and focused on the challenge of extrapolating a measured load history to a longer duration [18]. Yang et al. introduced a time-domain extrapolation method for tractor drive shaft load [19], utilizing the Markov chain Monte Carlo-peaks-over-threshold model, and successfully derived the dynamic torque spectrum, and then [20] addressed the two issues of insufficient adaptability of traditional peak-over-threshold extrapolation methods to non-stationary loads and the lack of discussion on extrapolation reconstruction by utilizing the empirical mode decomposition peaks-over-threshold model; it is still being explored in terms of application scenarios. Yang et al. introduced a genetic algorithm to select the threshold for the peaks-over-threshold extremum extrapolation model, enabling the extrapolation and reconstruction of the load spectrum [21]. However, the calculation process is complex, and the calculation efficiency needs to be improved.
We aimed to accurately evaluate the precision of load extrapolation methods and the quality of data, as well as explore their application effects in specific fields. Choulakian et al. illustrated the estimation techniques and the goodness-of-fit procedures of Generalized Pareto Distribution [22]. Li et al. compared the out-of-plane bending moment at the blade root using the generalized extreme value theory and generalized Pareto distribution [23]. Yang et al. researched the effect of threshold on the quality of load extrapolation data and gave an empirical threshold selection method [24]. Bai et al. investigated the influence of critical factors on the dynamic characteristics and fatigue damage of the powertrain under load and unequivocally identified the mean engine torque as the primary contributor to the fatigue damage of gear parts [25]. Xia et al. developed a novel continuously variable transmission system tailored to real-world loads aimed at enhancing transmission efficiency in vehicles [26]. Lu et al. examined the influence of the track spectrum on the car body load spectrum, elucidating the impact of longitudinal load on the fatigue damage of the car body [27]. Janulevicius et al. developed a methodology for monitoring engine performance indicators and exhaust emission characteristics, leveraging the load spectrum of the ploughing process [28]. Shao et al. analyzed the load characteristics of the transmission shafting based on the load transfer model of a tractor plowing operation [29] and provided practical guidance for structural optimization design, fatigue durability analysis, and reliability loading test of the tractor drivetrain. However, the universality of agricultural scenario applications still needs to be improved.
Many research achievements have already assessed the loads under specific working conditions, laying a solid foundation for accurately drawing the load spectrum. However, the operation process of agricultural machinery is characterized by complexity, continuity, and randomness. Especially for continuously connected operation scenarios, there is an urgent need for a real and effective load spectrum to support the fatigue load, reliability, and operation quality analysis of agricultural machinery and implements. Therefore, obtaining the real load spectrum is the main research target. The typical agricultural operation processes with agricultural implements have been analyzed, all based on agronomic standards. The testing process and the extrapolation method of time-domain loads will be discussed.
In this paper, the objective is to define a methodology to obtain the load spectrum of agriculture general power machinery on real farm operation processes. First, the experimental platform and acquisition systems of the load are developed, the load test experiment of deep loosening is designed, and their primitive loads are obtained and preprocessed. Based on the comprehensive application of PWM estimation and mean excess function, the key parameters of the Generalized Pareto Distribution are determined, then the extrapolation and reconstruction process of the time-domain load is systematically constructed, and the rationality of the extrapolated load spectrum is verified. Then, the GPD function is determined for each type of load, and the main characteristics of both original and extrapolated loads are studied so that reasonable extrapolation data of real loads are achieved. The load spectrum of agriculture general power machinery is obtained, laying the foundation for predicting fatigue life and conducting reliability testing of tractors and agricultural machinery implements.

2. Materials and Methods

A set of field load acquisition systems has been developed for the complex working conditions of agricultural general power machinery. This system integrates tractors, high-precision sensors, and efficient data transmission and processing modules, and the precise and real-time data of torque, rotational speed, traction resistance, traveling speed, etc., are collected during actual agricultural production processes. Aligning with the agronomic requirements of the tillage and land preparation phase in the Guanzhong District, Shaanxi, China, the experimental methods for acquiring actual load data have been designed for deep loosening and rotary tillage, and the comprehensive and precise testing and analysis have been conducted, then, effective measured load data can be obtained and preprocessed.

2.1. Basic Experimental Conditions

Choosing a tractor with more versatile tractor and typical operating conditions is beneficial for obtaining real-time load signals of the power output system. The tests were carried out with a heavy-duty agricultural TD-904 tractor (Weichai Lovol Intelligent Agriculture Technology Co., Ltd., Weifang, China) during its regular use. By using three-point suspension to connect attachment tools, such as straw returning, ploughing, deep loosening, rotary tillage, and sowing, the entire process operations can be achieved. The experiments are conducted in accordance with the GB/T 24675.2-2009 [30] and GB/T 5668-2017 [31], which monitors the working environment and working quality. The experimental boundary conditions and soil characteristics are shown in Table 1.

2.2. Experimental Processes

The experiment is designed to measure the torque during rotary tillage and the traction resistance during deep loosening, respectively. These experiments all utilized the same testing system and tractor, were conducted at the same measurement location, and were completed by the same driver in accordance with standard agronomic production requirements.
The process of rotary tillage operation is shown in Figure 1. The tractor model is TD-904. The rotary tiller model is 1GKNB-250G, manufactured by Xi’an Ya’ao Agricultural Machinery Co., Ltd, Xi’an, China. The overall dimensions are 1260 × 2750 × 1400 mm, the work width is 2500 mm, the weight is 680 kg, and the adjustment range of tillage depth is 80~180 mm. The actual rotary tillage depth is 150 mm, and the width is 2500 mm. The constant forward speed is 4.1 km/min. The PTO speed is set at 700 r/min. In normal agricultural production, after the tractor reached a stable driving state, the time-domain torque during the rotary tillage process was tested and stored by the torque sensor based on the load acquisition systems. The soil surface is covered with corn stalks and stubble, and the soil type is yellow loam soil. The soil crushing rate after rotary tillage reaches up to 75%. After rigorous inspection, it is confirmed that the operation quality fully complies with agronomic standards.
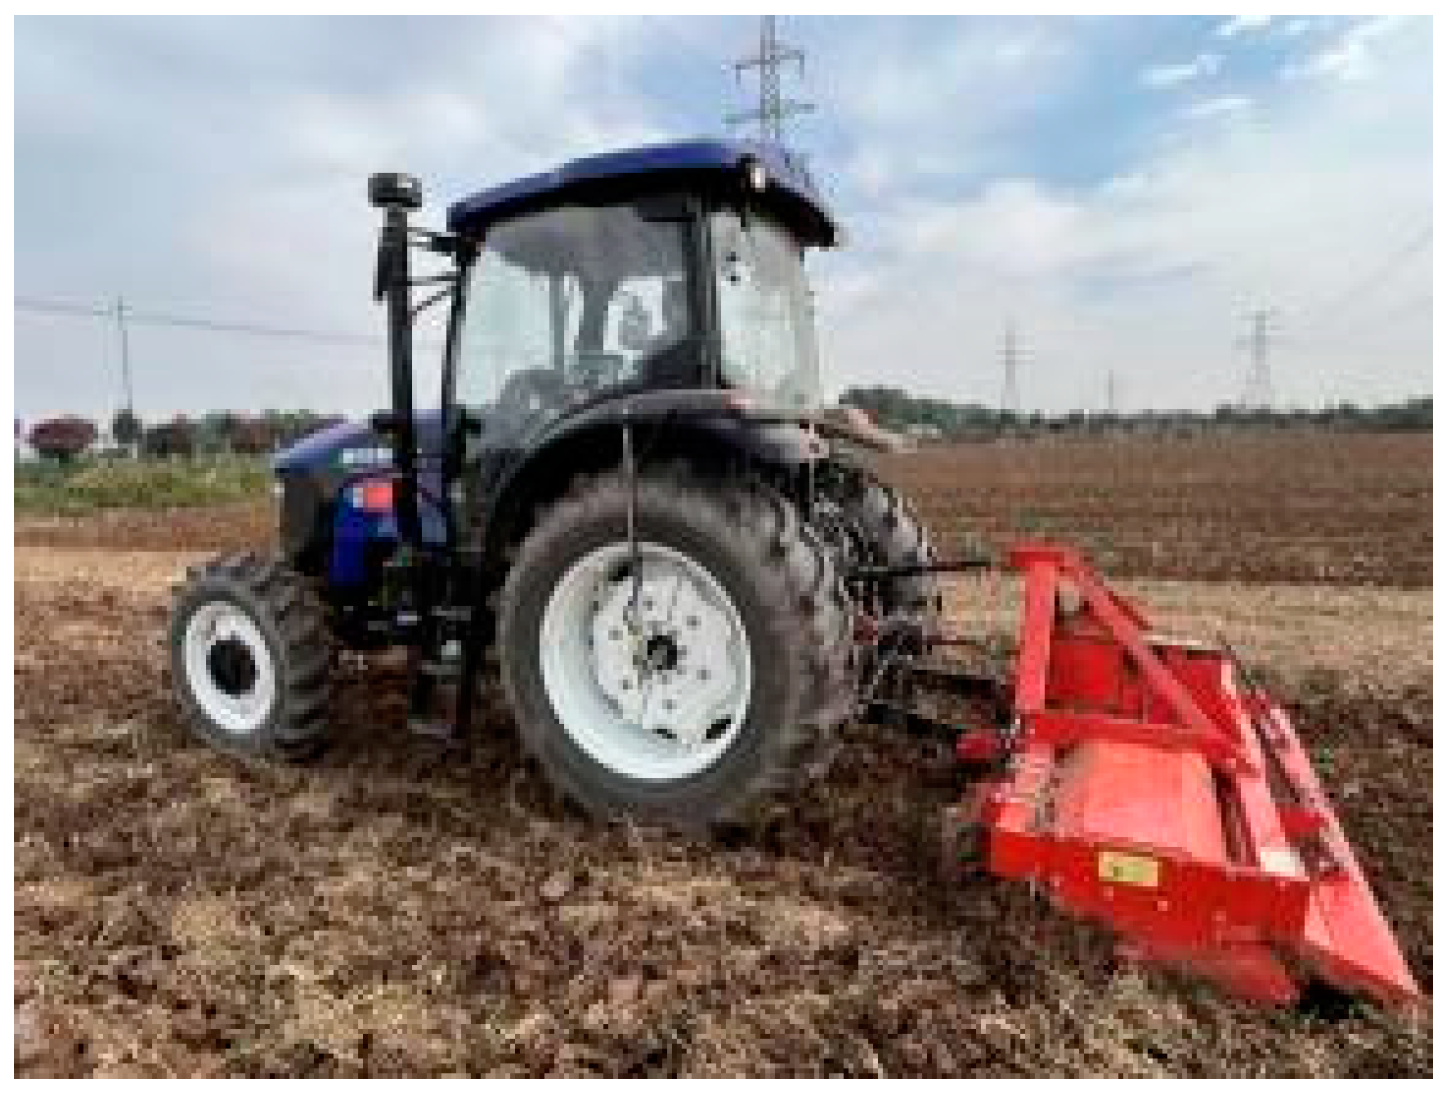
The process of deep loosening operation, as depicted in Figure 2, utilizes the same powered tractor as the rotary tillage. The deep loosening model is Meinuo 2306, manufactured by Meinuo Technology Co., Ltd., Handan, China. The overall dimensions are 2718 × 2140 × 1585 mm, the work width is 2000 mm, the number of rows is 5, the weight is 1280 kg, and the adjustment range of loosening depth is 250~500 mm. The actual loosening depth is 300 mm, and the width is 2000 mm. The constant forward speed is 2.8 km/min. In normal agricultural production, after the tractor reached a stable driving state, the time-domain traction resistance data during the deep loosening process were tested and stored by the pin-type tension sensor based on the load acquisition systems. After rigorous inspection, it is confirmed that the operation quality fully complies with the national standard.

2.3. Platform of the Experimental Tractor

For the TD-904 tractor, the schematic diagram of the entire transmission system is shown in Figure 3. When working in the field, a portion of the power output from the engine passes through the clutch, transmission, and front and rear drive axles to drive the wheels; the other part is transmitted to the agricultural implements through the power take-off shaft and coupling. By setting tension sensors in the suspension system and torque and speed sensors in the power take-off shaft, the original loads during the operation process are achieved, which can be used to describe the real-time power requirements of the operating equipment.

2.4. Load Acquisition Systems

In consideration of the open and complex environment during tractor field operations, as well as the vibration generated under the random load of soil and crops, the test equipment is designed with good anti-vibration capability. Meanwhile, for high-speed, heavy-duty rotating parts, a special sensor with simple installation and stable signal transmission is set up. The model of the outdoor mobile operation testing system is TCS 90-10, as shown in Figure 4. The test system consists of a wheeled tractor (TD-904), field operation test system, controller, touch vehicle terminal, and various sensors installed on the tractor.
The load acquisition system mainly consists of a torque sensor, pin-type tension sensor, torque connector, signal receiver, acquisition module, and upper computer. The system configuration is shown in Figure 5, which can realize real-time collection and processing of sensor data, parameter configuration, data file storage, fault detection of the acquisition module, and other functions. The torque sensor can be directly connected to the output shaft of the tractor to test torque and speed in real-time. Three tension sensors are set on the three-point suspension system of the tractor, respectively, which are transmitted to the upper computer of the load acquisition system through the connecting line, and the resultant force of the operating tension can be calculated according to the operating attitude angle.
The acquisition method of the sensor data is set as the time interval acquisition, which can directly display the real-time data acquisition, and the collected data will be directly stored in the computer database. Meanwhile, the acquisition software is utilized to verify the proper functioning of every parameter and signal within the entire detection system.

2.5. Experimental Operation Methods

The field load during tractor operation is influenced by various factors, such as implement types, soil conditions, and the driver’s skill. The same typical soil environment is selected, the standard tillage and land preparation methods are adopted, and the mainstream agricultural machinery and tools are used to conduct load testing, such as deep loosening and rotary tillage. Meanwhile, to ensure consistency in load testing for each operating scenario, the load tests were conducted under the same conditions and location. The general scheme of such an approach is represented in Figure 6; according to the information provided in reference number [32], the approach is used to collect the load data of rotary tillage and deep loosening on the same farmland.
The test process was executed by a skilled operator, and the driver conducted the test according to their regular working habits, ensuring that the measurement data truly reflected the experimental conditions. Throughout the entire process, the same individual drove, and human intervention was minimized to ensure consistency and reliability. During the testing process, the tractor moves forward at a constant speed in the same operating scenario. The scenarios, the system composed of tractor and implement, and the working parameters for each scenario are variables. So, the tractor PTO torque and the tension of the three-point suspension system change during the operation process were measured and recorded in the computer, which could be remotely monitored using Team-viewer 14.0 software.

2.6. Original Load Preprocessing

According to the sensor data of the load acquisition systems collected from field experiments, the original load signal can be obtained through processing by the controller. However, due to the influence of the field environment and test system, there may be interference noise present in the measured load signals. If the original data are used directly to compile the load spectrum, the reliability of the extrapolated load spectrum may not be very high.
In order to obtain the true and reliable signal of tractor output load, the trend term is removed by polynomial fitting from the original signal, the singular points are moved by the amplitude threshold method and dynamic standard deviation method, and the high-frequency loads are filtered by the butter-worth low-pass filter. The preprocessing result of load history is shown in Figure 7.
Meanwhile, a statistical characteristic is conducted on the data before and after processing, and the preprocessing effect is verified by means of the maximum value, minimum value, mean value, standard deviation, and variance so as to ensure that the load extremes before and after preprocessing remain unchanged, true, and effective.

3. Load Extrapolation Framework

The core of the load extrapolation method lies in accurately describing extreme value samples by extreme value theory. For load data changing with time, it is necessary to build an effective load extrapolation model and clarify its implementation process.

3.1. Determine the Generalized Pareto Distribution

Assuming X = (x1, x2xn) is a time series of sample load data, and the data points are n random and are independent of each other while coming from the same distribution function F(x). For a specific threshold value μ, samples that are greater than the threshold are defined as the over-threshold data with the excess Zi, which can be expressed as:
Z i = x i x i > u μ
Therefore, the corresponding over-threshold distribution function Fμ(y) can be obtained as follows:
F μ ( y ) = P ( x μ < y x > μ ) = F ( μ + y ) F ( μ ) 1 F ( μ )
Since the ideal distribution function remains unknown, this research undertakes an analysis of the distribution of over-threshold data and the volume of data to derive a conditional distribution function. Research indicates that when the threshold is sufficiently large, the exceedance distribution tends to follow GPD. So, the GPD distribution is used to fit the excess distribution of time series loads. Generally, the GPD cumulative distribution function can be expressed as:
G Z , μ , σ , ξ = 1 ( 1 + ξ Z σ ) 1 ξ ,   ξ 0 ,   x > μ 1 exp ( Z σ ) ,   ξ = 0 ,   x > μ
Then, the GPD probability density function can be expressed as:
g Z , μ , σ , ξ = 1 σ ( 1 + ξ Z σ ) 1 + ξ ξ   ,   ξ 0 ,   x > μ 1 σ exp ( Z σ ) ,   ξ = 0 ,   x > μ
where σ is the scale parameter, and ξ is the shape parameter.

3.2. GPD Function Parameters Estimation

The probability-weighted moments (PWM) estimation is a more effective and consistent method for finding the solutions in the GPD function, as shown in reference number [33]. Assuming the continuous over-threshold samples x1, x2, …, xn are conformed to the GPD, the r-th order probability weighted moment can be defined as:
ω r ( θ ) = E ( X G r ( X ; θ ) ) ,   r N 0
Substituting the GPD function, the estimation formula for the r-th order probability weighted moment of the GPD distribution can be expressed as:
ω r = E ( X G r ) = σ ξ × n ! ( n + 1 ξ ) ( n ξ ) ( 1 ξ ) 1 n + 1
To estimate the values of the parameters σ and ξ in the GPD distribution, set n is 0th and 1st, respectively, the corresponding zero-order and first-order probability weighted moments can be obtained and expressed as:
ω 0 = σ 1 ξ ω 1 = σ 3 ξ 2 ( 1 ξ ) ( 2 ξ )
Then, use sample probability-weighted moments to replace the population probability-weighted moments; the parameter can be estimated as:
σ = 2 ω 0 ( ω 1 ω 0 ) ω 0 2 ω 1 ξ = 2 + ω 0 ω 0 2 ω 1

3.3. Selection Method of the Threshold

In the peaks-over-threshold (POT) extreme value model, the choice of threshold significantly impacts the quality of the GPD fitting. If the threshold is set too low, numerous data points exceed it, leading to unnecessary computational burden. Conversely, a threshold that is too high may not capture the full range of the data distribution, compromising the accuracy of the model. To strike a balance and identify an optimal threshold, we employ a graphical method with the use of the mean excess function (MEF) method. According to the principle of the GPD, if X = (x1, x2xn) obeys the GPD function G(Z, μ, σ, ξ), the mean function of the excess of the random variable X is defined as e(μ), which can be expressed as:
e ( μ ) = E ( x μ | X > μ ) = σ + ξ μ 1 ξ
When the parameters σ and ξ are determined, the function e(μ) is linear to the selected threshold μ. So, the appropriate threshold region can be determined by observing the shape of the MEF curve. For each threshold, there exists a corresponding mean of the excess, which can be expressed as:
e n ( μ ) = 1 N i = 1 n ( X i μ )
where N is the number of excess samples, and Xi is the extreme sample beyond the threshold μ.
Therefore, the threshold located within the linear region of the MEF diagram is selected as the optimal threshold for the GPD fitting.

3.4. GPD Distribution Goodness-of-Fit Test

As mentioned previously, the extrapolated method identifies the recommended scale and shape parameters, determines the threshold for load data, and subsequently fits the extreme value data. Nonetheless, the applicability and quality of the GPD fitting remain uncertain. In addition to drawing cumulative distribution function (CDF) curves for correlation analysis, the quantile–quantile (Q-Q) plot is introduced to evaluate the fitting effect.
After acquiring the distribution function, the corresponding uniform distribution function over the interval (0, 1) can be derived, which is defined as F(X) and can be expressed as:
L k , m = F ( X k , m ) = n k + 1 n + 1 ,   k = 1 , , n
where X1,m ≥ … ≥ Xn,m represents the order statistic of the random time series.
Subsequently, the Q-Q diagram of the extreme value data can be drawn as follows in the equation:
( X k , n , F 1 ( n k + 1 n + 1 ) ) ,   k = 1 , , n
Through CDF curves and Q-Q diagrams, the fitting GPD distribution can be well evaluated.

3.5. Load Spectrum Extrapolation Process

After validating the proposed threshold through goodness-of-fit analysis for the GPD, the extreme value obtained from the actual operation conditions can be used to further extrapolate the possible theoretical extreme, enabling bidirectional extrapolation of both maximum and minimum values. This process expands the range of load coverage and enhances the overall effectiveness. The extrapolation process is shown in Figure 8.

4. Results

4.1. Tillage and Land Preparation Operation Scene

The experimental site is situated in the Guanzhong District, Shaanxi Province, China, which is a representative area characterized by a one-year, two-season rotation of corn and wheat cultivation with arid and semi-arid climatic conditions. The soil type is yellow clayey soil. Tillage and land preparation are crucial steps in ensuring a favorable growth environment for crops. In order to create a good soil structure and sowing environment, it is necessary to carry out closely connected operations such as deep loosening and rotary tillage. For the farmland after straw returns, deep loosening is employed to effectively break the hard plow layer, achieving vertical connectivity between the upper and lower soil layers, enhancing soil water-holding capacity, and promoting deep root penetration of plants. Immediately afterward, the rotary tillage is implemented to meticulously achieve a soft surface soil structure, laying a solid foundation for the subsequent sowing operations, as shown in Figure 9. The two modes complement each other and together form an ideal soil cultivation layer, providing excellent environmental conditions for crop growth. On the same piece of land where the previous crop has been harvested, deep loosening is performed first, followed by rotary tillage. Meanwhile, the general operating parameters are selected for filed experimental tests based on agronomic standards and tillage and land preparation from national standards, and the operation mode and quality meet the growth requirements of crops.
During the experimental testing process, the working scenarios are characterized by complexity, variability, and randomness. As a result, the tractor frequently requires the replacement of various implements, such as the deep loosening implement for effectively loosening the deep soil and the rotary tillage for finely crushing and mixing the soil. But, all tests were conducted on the same experimental field using the same tractor and testing system. Furthermore, each tillage mode was tested three times under the same experimental conditions.

4.2. Load Characteristics of Rotary Tillage

Based on the torque testing process of the rotary tillage experiment, the PTO torque values during the rotary tilling operation are collected through the load acquisition systems, and a complete set of time-domain torque load samples was obtained after preprocessing, as shown in Figure 10.
The mean excess function for the time-domain load is reconstructed to generate a load sequence that meets the target length. This sequence is then used to calculate the average exceedances, which are subsequently utilized to select the optimal upper and lower threshold intervals employing the mean excess function method. For the upper threshold, the MEF is plotted in Figure 11.
The average excess of the sample belongs to a statistical indicator, as shown in Figure 11, and fluctuates with the change of threshold, especially when the sample threshold increases, the fluctuation is more significant. Based on the shape of the curve and the characteristics of the GPD distribution, the fluctuation of the sample average exceedance function near a straight line during the threshold selection process is deemed optimal. Therefore, the threshold located within the linear region of the MEF diagram is selected as the optimal threshold for the GPD fitting, and the upper limit threshold domain is [783, 792]. Similarly, the lower threshold range can be determined as [692, 701].
To find the optimal threshold during the initial domain of upper and lower thresholds, 10 equal interval thresholds are chosen, and the gray correlation degree is calculated. The results are shown in Table 2.
The higher gray correlation degree indicates a closer trend between the sample distribution and the fitted distribution curve, so the optimal upper threshold is selected as 788, and the optimal lower threshold is selected as 698. Then, using the extracted exceedance samples for parameter estimation, the exceedance samples were fitted to the GPD distribution using the PWM estimation to determine the corresponding parameters σ and ξ, as shown in Table 3.
After obtaining the GPD parameter for the upper and lower thresholds, the cumulative distribution function corresponding to the upper and lower thresholds can be written as:
G ( Z , μ , σ , ξ ) = 1 ( 1 0.4650 Z 68.0592 ) 2.1505
G ( Z , μ , σ , ξ ) = 1 ( 1 0.3715 Z 81.4326 ) 2.6918
The goodness-of-fit can be visually assessed by plotting the CDF plot and the quantile–quantile (Q-Q) plot of the original sample points against the fitted sample points. As depicted in Figure 12 and Figure 13, the CDF plots of the upper and lower thresholds exhibit a high degree of overlap with a correlation coefficient exceeding 0.99. Additionally, the Q-Q plot of the final fitted sample closely approximates a straight line, further corroborating the accuracy of the fitting and the normality of the data. These observations collectively indicate a good fit of the Generalized Pareto Distribution (GPD) at this threshold.
Using the probability density function of the fitted GPD distribution for the excess amount, a random load sequence is generated that corresponds to the number of samples. Subsequently, the original exceedance sequence at its respective time points is replaced with this newly generated load sequence to derive the extrapolated load sequence. After that, adjacent load intervals are calibrated, and ultimately, the complete time-domain load signal is obtained after extrapolation. The extrapolation of the 1-time and 10-time load history is shown in Figure 14.
As can be seen from Figure 13, the extrapolation results can not only effectively retain the original load sequence but also obtain the maximum value sequence that does not appear in the original load, and both have the same load trend. Meanwhile, this approach accurately replicates the time intervals of load variations, and the extrapolated time-domain load signal includes comprehensive time-frequency information, which is a genuine time-domain load extrapolation.
The rainflow counting method is employed to conduct further statistical analysis of the time load. The rainflow matrices for the original load data and the extrapolated load data are presented in Figure 15. Upon analyzing the overall distribution of the rainflow matrix, it becomes evident that the extrapolated load spectrum adheres to the same distribution law as the original load data, which confirms the adequacy of the extrapolated data. Additionally, the primary function of the time-domain extrapolation method is to reconstruct data that exceed the threshold value, while data below this threshold remain unchanged. Meanwhile, the frequency signifies the concentration level of the load cycle; a higher value corresponds to a greater cumulative frequency, and the extrapolated extreme value exhibits a higher frequency compared to the original dataset. Consequently, it is evident that the extrapolation process is applicable and effective.
The amplitude and mean frequency histogram can be obtained based on the rainflow matrix, as shown in Figure 16, which clearly describes the load cycle characteristics. The extrapolated load cycle distribution in the time domain is similar to the original data load cycle distribution and has consistent load characteristics, as well as correlation coefficients of 0.9943 and 0.9912 for amplitude and mean value, respectively. Therefore, the real distribution law of the load can be effectively simulated for the rotary tillage conditions.
The maximum and minimum values of the extrapolated load are 928.52 and 555.54, respectively, and the amplitude corresponding to the maximum frequency is 9.38, and the mean is 736.9, which characterizes the features of the original load and accurately describes the real load spectrum under the rotary tillage mode. Furthermore, during a future fatigue test for the tractor and the rotary tiller, extrapolation load enables the application of more rigorous cycles with greater amplitude rather than simply using the maximum measured load. Meanwhile, the real load spectrum can be directly applied to the power-matching design of agricultural power machinery, the reliability design of power transmission systems, and the structural design and fatigue testing of agricultural implements.

4.3. Load Characteristics of Deep Loosening

On the same experimental field, the tension sensor equipped on the three-point suspension system based on the traction resistance testing process of the deep loosening experiment, the traction resistance data can be accurately collected, and the complete set of time-domain traction resistance load samples was obtained after preprocessing, as shown in Figure 17.
Based on the same extrapolation process of the rotary tillage load, the mean excess function is reconstructed for the traction resistance data, and the threshold domain is selected from the linear region of the MEF diagram. Meanwhile, based on the results of grey relational analysis, the optimal upper and lower thresholds are determined to be 43,958 and 38,621, respectively. The corresponding parameters σ and ξ are defined by the PWM estimation; the values are shown in Table 4.
Based on the GPD parameter for the upper and lower thresholds of traction resistance data, the cumulative distribution function can be written as:
G ( Z , μ , σ , ξ ) = 1 ( 1 0.4995 Z 225.2947 ) 2.0020
G ( Z , μ , σ , ξ ) = 1 ( 1 + 0.2943 Z 871.0537 ) 3.3979
A comprehensive evaluation of the fitting effect was conducted using the CDF plot and Q-Q plot, and the correlation coefficient of the CDF function reached 0.99, the fitted data points on the Q-Q plot are almost precisely aligned in a straight line. It can be confirmed that the fitted parameters fully meet our requirements. Based on this, the traction resistance load is extrapolated, and the load spectrum will be obtained; the results are shown in Figure 18.
The histogram can be plotted based on rainflow statistics data for deep loosening; as shown in Figure 19, the correlation coefficient of amplitude is 0.9985, and the coefficient of the mean is 0.9945, which proves the extrapolation data are believable. The maximum and minimum values of the extrapolated load are 44,392 and 38,177, respectively, and the amplitude corresponding to the maximum frequency is 233.75, and the mean is 44,074.25. These data are the real load spectrum under the deep loosening mode.

5. Discussion

In engineering practice, the compilation and analysis of the load spectrum are crucial tasks. First, the GPD function is studied, and the optimal threshold selection strategy is clarified by utilizing the mean excess function and grey relational analysis. Subsequently, the shape and scale parameters are accurately estimated through the PWM method, and the specific form of the GPD function is determined. Meanwhile, the original loads are acquired by acquisition systems for rotary tillage and deep loosening. The goodness-of-fit is tested using GPD fitting curves and Q-Q plots. The results show that the correlation coefficients are all above 0.99, which fully indicates that the GPD function can well describe the distribution patterns of the excess threshold samples, and the applicability is verified. Based on this, the generated random load sequences with the same distribution are used to replace the original excess threshold loads, and time-domain extrapolation of the loads is achieved. Based on the same extrapolation principle and process, the extrapolation load of rotary tillage and deep loosening are achieved. At the same time, the time-domain load sequences are extended to obtain a more complete and accurate load spectrum.
Rainflow counting statistics are performed separately on the extrapolated load and the original load to obtain the amplitude and mean frequency distribution diagrams for the three operating modes. A correlation analysis is conducted on the frequency distribution of the mean and amplitude, and the correlation coefficients for both the amplitude and mean are greater than 0.95, so the accuracy and authenticity are verified for the extrapolated load. It is feasible to effectively reflect the characteristics of rotary tillage and deep loosening.
Furthermore, the extrapolation method successfully extrapolates the loads for two operation scenes and obtains the corresponding load spectrum. Compared with the traditional rainflow counting extrapolation method, the extrapolation method used in this paper can retain the changing trend of the original load in the time domain to a greater extent, which makes this method more suitable for extrapolating measured loads.
Meanwhile, a novel platform and system for load testing is ingeniously designed, and innovatively direct and precise measurement of the load is achieved for the entire agricultural machinery operational system. The GPD function is determined by the mean excess function and PWM estimation, and a framework for load extrapolation is established. It is noteworthy that the correlation between the original load and the extrapolated load reaches 0.99, not only ensuring the accuracy of the testing but also greatly simplifying the parameter determination process and significantly enhancing computational efficiency. This theory has been successfully applied to load extrapolation and characteristic analysis in two operational scenarios, rotary tilling and deep loosening, which demonstrate an excellent universality.
The load spectrum is obtained, which truly reflects the load states during agricultural machinery operation and serves as a direct basis for the power matching design of power machinery. Meanwhile, the load value with the highest frequency in the load spectrum can be used as important data for fatigue testing and provide strong support for the reliable design of power transmission systems and life assessment of the entire machine. This data also directly reflects the actual load states of the operating implements, which can be used to accurately assess the carrying capacity and provides important guidance for structural optimization design and performance improvement. Furthermore, the load spectrum lays an important foundation for intelligent monitoring, operation and maintenance, and analysis of optimal operation quality of power machinery.

6. Conclusions

The research in this paper has successfully achieved load extrapolation for power machinery under multi-condition connection operation modes and has obtained an accurate and effective load spectrum. The results are summarized as follows:
The extrapolation and reconstruction method of time-domain load is established based on the actual field load by the GPD function, and the parameters are precisely determined based on the MEF function and the PWM estimation. This approach not only simplifies the calculation process but also significantly improves computational accuracy and efficiency.
The actual field load of deep loosening and rotary tillage operations has been achieved with the help of a test system for traction resistance and torque at the three-point suspension system. Meanwhile, the data preprocessing process is elaborated, and invalid load data is effectively eliminated, significantly improving the accuracy and effectiveness of the load data.
For the time-domain load samples of rotary tillage, the optimal threshold and parameters for the load extrapolation function are determined. The goodness-of-fit test was performed using CDF and Q-Q plot, and the correlation coefficient between the GPD function fitting curve and the sample loads is greater than 0.99; the distribution pattern of the extreme value samples is accurately described. The amplitude and mean frequency characteristics are analyzed using the rainflow counting method. Based on the load extrapolation method, the time domain extrapolation of the load is achieved.
This paper has successfully achieved reasonable extrapolation of loads, obtaining the load original of deep loosening and rotary tillage, as well as the occurrence frequency for load means and amplitudes. This load spectrum truly reflects the load conditions during agricultural machinery operations, providing important load data for product developers and manufacturers in the structural optimization of transmission systems, reliability analysis of the entire machine, and structural design of agricultural implements. Furthermore, the highest frequency load value can be used as input data for fatigue testing to conduct fatigue life analysis. At the same time, these data also lay the foundation for users in optimizing agricultural implement operating parameters, thereby ensuring high efficiency and quality, as well as low fuel consumption of food production.
The research objective has been successfully realized for obtaining the load spectrum; however, the vibration issues highlighted during the load testing process still require our heightened attention in future research endeavors. Furthermore, the load spectrum of the entire series with the same type of agricultural machinery needs further improvement. Looking forward, innovations in reducing resistance for agricultural operations, optimizing the design of machinery structures, and achieving efficient matching of operational quality will become important directions for research.

Author Contributions

D.S. conceptualization, formal analysis, data curation, writing—original draft, writing—review and editing. T.W. investigation, data curation, project administration, writing—review and editing. S.Z. data curation, project administration, writing—review and editing. Z.L. conceptualization, formal analysis, writing—review and editing. All authors have read and agreed to the published version of the manuscript.

Funding

This research was funded by the National Key R&D Program of China (Grant No. 2022YFD2001300, 2023YFD2000301-03), as well as the Open Foundation of State Key Laboratory for Manufacturing Systems Engineering (Grant No. sklms2022013).

Data Availability Statement

The original contributions presented in the study are included in the article; further inquiries can be directed to the corresponding authors.

Acknowledgments

The authors thank the Northwest A&F University, Scientific Observing and Experimental Station of Agricultural Equipment for the Northern China Ministry of Agriculture, P. R. China, and Apple Full Mechanized Scientific Research Base of the Ministry of Agriculture and Rural Affairs. We would also like to thank the National Key R&D Program of China.

Conflicts of Interest

All the authors declare no conflicts of interest.

References

  1. Owczarek, W.; Rodzewicz, M. Investigations into glider chassis load spectrum. Fatigue Aircr. Struct. 2009, 1, 150–169. [Google Scholar] [CrossRef]
  2. Zhang, L.P.; Guo, L.X. The vehicle dynamic load identification under the excitation of random road surface. Adv. Mater. Res. 2011, 299–300, 255–259. [Google Scholar]
  3. He, J.L.; Zhao, X.Y.; Li, G.F.; Chen, C.H.; Yang, Z.J.; Hu, L.; Zhang, X. Time domain load extrapolation method for CNC machine tools based on GRA-POT model. Int. J. Adv. Manuf. Technol. 2019, 103, 3799–3812. [Google Scholar] [CrossRef]
  4. Moriarty, P.J.; Holley, W.E.; Butterfield, S. Effect of turbulence variation on extreme loads prediction for wind turbines. J. Sol. Energy Eng. 2002, 124, 387–395. [Google Scholar] [CrossRef]
  5. Wang, J.; Hu, J.; Wang, N.; Yao, M.; Wang, Z. Multi-criteria decision-making method-based approach to determine a proper level for extrapolation of Rainflow matrix. Proc. Inst. Mech. Eng. Part C J. Mech. Eng. Sci. 2012, 226, 1148–1161. [Google Scholar] [CrossRef]
  6. Hansson, P.A.; Lindgren, M.; Nordin, M.; Pettersson, O. A methodology for measuring the effects of transient loads on the fuel efficiency of agricultural tractors. Appl. Eng. Agric. 2003, 19, 251–257. [Google Scholar] [CrossRef]
  7. Roeber, J.B.; Pitla, S.K.; Hoy, R.M.; Luck, J.D.; Kocher, M.F. Tractor power take-off torque measurement and data acquisition system. Appl. Eng. Agric. 2017, 33, 679–686. [Google Scholar] [CrossRef]
  8. Upadhyay, G.; Raheman, H. Effect of velocity ratio on performance characteristics of an active-passive combination tillage implement. Biosyst. Eng. 2020, 191, 1–12. [Google Scholar] [CrossRef]
  9. Hensh, S.; Tewari, V.K.; Upadhyay, G. A novel wireless instrumentation system for measurement of PTO (power take-off) torque requirement during rotary tillage. Biosyst. Eng. 2021, 212, 241–251. [Google Scholar] [CrossRef]
  10. Dai, D.; Chen, D.; Wang, S.M.; Li, S.; Mao, X.; Zhang, B.; Wang, Z.Y.; Ma, Z. Compilation and Extrapolation of Load Spectrum of Tractor Ground Vibration Load Based on CEEMDAN-POT Model. Agriculture 2023, 13, 125. [Google Scholar] [CrossRef]
  11. Wang, J.X.; Chen, H.B.; Li, Y.; Wu, Y.Q.; Zhang, Y.S. A review of the extrapolation method in load spectrum compiling. Stroj. Vestn.-J. Mech. Eng. 2016, 62, 60–75. [Google Scholar] [CrossRef]
  12. Agarwal, P.; Manuel, L. Empirical wind turbine load distributions using field data. J. Offshore Mech. Arct. Eng. 2008, 130, 011006. [Google Scholar] [CrossRef]
  13. Heidenreich, N.B.; Schindler, A.; Sperlich, S. Bandwidth selection for kernel density estimation: A review of fully automatic selectors. Adv. Stat. Anal. 2013, 97, 403–433. [Google Scholar] [CrossRef]
  14. Socie, D.; Pompetzki, M. Modeling variability in service loading spectra. J. ASTM Int. 2004, 1, 46–57. [Google Scholar] [CrossRef]
  15. Chen, C.; Yang, Z.; He, J.; Tian, H.; Li, Z.; Wang, D. Load spectrum generation of machining center based on rainflow counting method. J. Vibroeng. 2017, 19, 5767–5779. [Google Scholar] [CrossRef]
  16. Wang, J.X.; Zhai, X.T.; Liu, C.; Zhang, Y.S. Determination of the threshold for extreme load extrapolation based on multicriteria decision-making technology. J. Mech. Eng. 2017, 63, 201–211. [Google Scholar] [CrossRef]
  17. Wang, Y.; Wang, L.; Zong, J.H.; Lv, D.X.; Wang, S.M. Research on Loading Method of Tractor PTO Based on Dynamic Load Spectrum. Agriculture 2021, 11, 982. [Google Scholar] [CrossRef]
  18. Johannesson, P. Extrapolation of load histories and spectra. Fatigue Fract. Eng. Mater. Struct. 2006, 29, 201–207. [Google Scholar] [CrossRef]
  19. Yang, Z.H.; Song, Z.H.; Zhao, X.Y.; Zhou, X.X. Time-domain extrapolation method for tractor drive shaft loads in stationary operating conditions. Biosyst. Eng. 2021, 210, 143–155. [Google Scholar] [CrossRef]
  20. Yang, Z.H.; Song, Z.H.; Luo, Z.H.; Zhao, X.Y.; Yin, Y.Y. Time-domain load extrapolation method for tractor key parts based on EMD-POT model. J. Mech. Eng. 2022, 58, 252–262. [Google Scholar]
  21. Yang, M.; Sun, X.X.; Deng, X.T.; Lu, Z.X.; Wang, T. Extrapolation of Tractor Traction Resistance Load Spectrum and Compilation of Loading Spectrum Based on Optimal Threshold Selection Using a Genetic Algorithm. Agriculture 2023, 13, 1133. [Google Scholar] [CrossRef]
  22. Choulakian, V.; Stephens, M.A. Goodness-of-Fit for the Generalized Pareto Distribution. Technometrics 2001, 43, 478–484. [Google Scholar] [CrossRef]
  23. Li, X.; Wang, Y. Comparison of different statistic extrapolation methods in calculation of extreme load of offshore wind turbines. J. Shanghai Jiaotong Univ. 2016, 50, 844–848. [Google Scholar]
  24. Yang, X.; Zhang, J.; Ren, W.X. Threshold selection for extreme strain extrapolation due to vehicles on bridges. Procedia Struct. Integr. 2017, 5, 1176–1183. [Google Scholar] [CrossRef]
  25. Bai, J.Y.; Wu, X.L.; Gao, F.; Li, H.B. Analysis of powertrain loading dynamic characteristics and the effects on fatigue damage. Appl. Sci. 2017, 7, 1027. [Google Scholar] [CrossRef]
  26. Xia, Y.; Sun, D.Y. Characteristic analysis on a new hydro-mechanical continuously variable transmission system. Mech. Mach. Theory 2018, 126, 457–467. [Google Scholar] [CrossRef]
  27. Lu, Y.H.; Bi, W.; Zhang, X.; Zeng, J.; Chen, T.L.; Wu, P.B. Calculation method of dynamic loads spectrum and effects on fatigue damage of a full-scale carbody for high-speed trains. Veh. Syst. Dyn. 2020, 58, 1037–1056. [Google Scholar] [CrossRef]
  28. Janulevicius, A.; Juostas, A.; Pupinis, G. Tractor’s engine performance and emission characteristics in the process of ploughing. Energy Convers. Manag. 2013, 75, 498–508. [Google Scholar] [CrossRef]
  29. Shao, X.D.; Yang, Z.H.; Mowafy, S.; Zheng, B.W.; Song, Z.H.; Luo, Z.H.; Guo, W.J. Load characteristics analysis of tractor drivetrain under field plowing operation considering tire-soil interaction. Soil Tillage Res. 2023, 227, 105620. [Google Scholar] [CrossRef]
  30. GB/T 24675.2-2009; Conservation Tillage Equipment—Subsoiler. Standards Press of China: Beijing, China, 2010.
  31. GB/T 5668-2017; Rotary Tiller. Standards Press of China: Beijing, China, 2018.
  32. Fargnoli, M.; Vita, L.; Gattamelata, D.; Tronci, M. A reverse engineering approach to enhance machinery design for safety. In Proceedings of the DESIGN 2012, the 12th International Design Conference, Dubrovnik, Croatia, 21–24 May 2012; pp. 627–636. [Google Scholar]
  33. Jing, D.; Dedun, S.; Ronfu, Y.; Yu, H. Expressions relating probability weighted moments to parameters of several distributions inexpressible in inverse form. J. Hydrol. 1989, 110, 259–270. [Google Scholar] [CrossRef]
Figure 1. Schematic diagram of rotary tillage.
Processes 12 02078 g001
Figure 2. Schematic diagram of deep loosening.
Processes 12 02078 g002
Figure 3. Load testing schematic for tractor power transmission system.
Processes 12 02078 g003
Figure 4. Sensor arrangement of the experiment tractor.
Processes 12 02078 g004
Figure 5. Configuration of the test system.
Processes 12 02078 g005
Figure 6. Load test framework for field operation process.
Processes 12 02078 g006
Figure 7. Load history after preprocessing.
Processes 12 02078 g007
Figure 8. Extrapolation process of load.
Processes 12 02078 g008
Figure 9. Schematic diagram of deep loosening and rotary tillage.
Processes 12 02078 g009
Figure 10. Load history of rotary tillage after preprocessing.
Processes 12 02078 g010
Figure 11. Function graph of the MEF.
Processes 12 02078 g011
Figure 12. Fitting results test of upper threshold. (a) CDF plot, (b) Q–Q graph.
Processes 12 02078 g012
Figure 13. Fitting results test of lower threshold. (a) CDF plot, (b) Q–Q graph.
Processes 12 02078 g013
Figure 14. Time history of extrapolated load. (a) Extrapolation of 1-time load history, (b) extrapolation of 10-time load history.
Processes 12 02078 g014
Figure 15. Comparison of rainflow matrixes. (a) 10-time original load, (b) 10-time extrapolation load.
Processes 12 02078 g015
Figure 16. Histograms of mean and amplitude frequency. (a) Histogram of load amplitude, (b) histogram of load mean.
Processes 12 02078 g016
Figure 17. Load history after preprocessing of deep loosening.
Processes 12 02078 g017
Figure 18. Time history of deep loosening. (a) Extrapolation of 1-time load history, (b) extrapolation of 10-time load history.
Processes 12 02078 g018
Figure 19. Histograms of mean and amplitude frequency for deep loosening. (a) Histogram of load amplitude, (b) histogram of load mean.
Processes 12 02078 g019
Table 1. Field experiment boundary conditions.
ParameterValue
WeatherSunny
Environmental temperature24.8 °C
Environmental humidity52%
Soil typeyellow clayey soil
Soil moisture content28% (120 mm)
Bulk density of soil1.09 g/cm3 (0–100 mm)
1.17 g/cm3 (100–200 mm)
1.29 g/cm3 (200–300 mm)
Table 2. Grey correlation degree corresponds to the thresholds.
Upper ThresholdLower Threshold
ThresholdGrey CorrelationThresholdGrey Correlation
7830.70936920.6258
7840.67196930.6073
7850.71366940.6070
7860.71526950.6192
7870.70856960.6123
7880.71766970.6180
7890.71386980.6304
7900.70406990.6204
7910.69007000.6123
7920.69267010.5980
Table 3. GPD distribution parameters of rotary tillage process data.
ExcessThresholdξσ
Upper788−0.465068.0952
Lower698−0.371581.4326
Table 4. GPD distribution parameters of deep loosening process data.
ExcessThresholdξσ
Upper43,958−0.4995225.2947
Lower38,6210.2943871.0537
Disclaimer/Publisher’s Note: The statements, opinions and data contained in all publications are solely those of the individual author(s) and contributor(s) and not of MDPI and/or the editor(s). MDPI and/or the editor(s) disclaim responsibility for any injury to people or property resulting from any ideas, methods, instructions or products referred to in the content.

