Article

Study on the Fracture Evolution Characteristics of Overlying Strata in a Fully Mechanized Mining Face with a Large Mining Height Based on a Three-Dimensional Large-Scale Physical Simulation Experimental System

by
Zongyong Wei
1,2,
Yucai Yin
1,2,
Botao Li
3,*,
Shugang Li
1,2,
Haifei Lin
1,2,
Peng Xiao
1,2 and
Yang Ding
1,2
1
College of Safety Science and Engineering, Xi’an University of Science and Technology, Xi’an 710054, China
2
Western Engineering Research Centra of Mine Gas Intelligent Drainage for Coal Industry, Xi’an 710054, China
3
School of Safety Science and Engineering, Henan Polytechnic University, Jiaozuo 454003, China
*
Author to whom correspondence should be addressed.
Processes 2024, 12(10), 2087; https://doi.org/10.3390/pr12102087
Submission received: 21 August 2024 / Revised: 14 September 2024 / Accepted: 19 September 2024 / Published: 26 September 2024
(This article belongs to the Topic New Advances in Mining Technology)

Abstract

:
To investigate the evolution characteristics of overlying rock fractures, based on a geological prototype of a large-height comprehensive mining face in Shanxi, a three-dimensional large-scale physical similarity model was established. The experiments were carried out using microseismic monitoring and physical model cutting methods to study the activity and fissure evolution of the overburden rock. Model cutting revealed that, approximately 65 m from the bottom of the coal seam, delamination occurred, marking the top of the overburden rock fissure zone and the bottom of the bending and sinking zone. At 25 m from the coal seam bottom, the rock layer was highly fragmented, forming the collapse zone, which was 4.8 times the mining height. Between 25 and 65 m from the bottom, a fissure zone existed, which was 12.5 times the mining height, with abundant delamination fissures at the top of the fissure zone. Significant microseismic events were observed as the coal face advanced to 45 m, with notable increases in the concentrations and distribution ranges of these events in both the strike and height directions of the coal seam. The subsidence range of the overlying rock layer expanded from the top to the bottom, with the subsidence slope area extending gradually and the central compaction area remaining relatively flat. The overall shape presented an irregular ellipse, with peripheral uplift phenomena observed in the subsidence area. At 39 m from the coal seam bottom, the maximum subsidence of the rock stratum was 4.0 m, with subsidence amounts decreasing with increasing stratum height. Fissure density along the coal seam inclination and direction exhibited a double hump pattern, with fissure areas on both sides showing high densities and the central compaction areas having low densities. Coal seam mining caused stress redistribution in the surrounding rock layer, and the stress in front of the work was divided into the stress reduction zone, dynamic influence zone, mining influence zone, and unaffected zone. Coal rock porosity under high stress was less sensitive to stress changes, resulting in smaller changes in fissure permeability and fissures remaining mostly closed.

1. Introduction

China is extremely rich in coal resources, which is one of the country’s major sources of energy. China’s total coal resources comprise about 5.57 trillion tons of reserves within a burial depth of 2000 m, accounting for a significant share of global coal resources [1,2,3]. In recent years, due to the continuous growth of coal demand, large-height integrated mining technology has been widely used in the mining of thick coal seams with small inclination angles, stability, and good roofs [4,5]. Compared with traditional integrated mining technology, large-height integrated mining technology has increased the coal extraction rate by 10–15% and has the advantages of a high yield, high efficiency, safety, etc.; this technology has broad promotion prospects [6,7]. The extensive use of coal resources has prompted the depth of coal mining in China to increase at a rate of 10–25 m per year [8]. Many factors, such as the high intensity of coal seam mining, deep burial of coal seams, and high gas content of surrounding rock, make it very easy for gas overlimit to occur in a comprehensive mining working face. Gas explosions, gas asphyxiation, and other disasters and accidents resulting from coal mine safety production bring great security risks [9]. High-intensity mining under the conditions of large-height integrated mining causes the collapse and destruction of coal seams and the fissure evolution of the overburden; the mechanisms of gas transport and storage change significantly, increasing the difficulty of gas control in coal mines [10,11]. At present, gas extraction is an effective means of preventing and controlling gas disasters, especially the management of unpressurized gas in mining overburden. However, the parameters of gas extraction in most mines are not reasonably designed, and the gas drilling holes fail to be arranged in the unpressurized gas-rich area, resulting in unsatisfactory extraction effects and hidden safety hazards [12,13]. Therefore, it is necessary to further study the transport and storage characteristics of unpressurized gas in the overburden fissures and to accurately locate the unpressurized gas-enriched areas to improve the effectiveness of gas management processes.
Furthermore, the collapse of overlying strata in high-intensity mining environments, especially under large-height integrated mining conditions, significantly alters the fissure evolution characteristics of the overburden, thereby intensifying the challenges associated with gas control. These concerns necessitate more sophisticated and comprehensive monitoring systems to prevent such hazards [14,15]. Kuznetsov [16] first proposed the similarity theory, and later scholars established a complete systematic similarity simulation test research method based on this theory and causal subanalysis, including physical testing, mechanical testing, modeling testing, and even engineering practice, which has become an important research tool in the domestic and international mining industries [17,18,19,20]. Zhou [21] took the lead in establishing a similar simulation test frame for mine pressure monitoring; scholars began to study and apply it and gradually expanded the corresponding application fields. Subsequently, Somerton et al. [22] independently designed and developed the strain model (strain model size of 10 mm), but its structure was complex, the price was high, and its operation was more complex. Liu and Yu [23] developed a plane strain simulation test frame using flexible hydraulic pillow loading, and the vertical loading force was up to 10,000 Kn. The coupled, multi-field, large-scale simulation test system for a coal mine power disaster independently developed by Yin et al. [24,25] was used to investigate the distribution of fissures in the overlying rock strata during the mining process, the movement of the rock strata, and the laws of dynamic stress characteristics. To ensure the safety of the comprehensive mining face, Vu [26,27] proposed measures to prevent the occurrence of disasters after analyzing the geological conditions, process parameters, and support methods of the comprehensive mining face. Subsequently, Jiang et al. [28] developed a new true three-axis (1 m × 1 m × 0.2 m) roadway planar model test bed for studying the deformation and damage mechanisms of the peripheral rock roadway. Kang and Wang [29] used a self-developed, large-scale, three-dimensional (3 m × 2 m × 2 m) solid–fluid coupling simulation test rig to conduct a three-dimensional simulation study of pressure mining in the mining area and deeply analyzed the change in the stress-induced displacement of the roof of the coal seam. Shi and Zhang [30] studied the deformation and damage characteristics of the surrounding rock and overburden of the sharply inclined coal seam based on a large-scale, combined pile, three-dimensional simulation experimental device with dimensions of 10 m × 8 m × 3 m. Lai et al. [31] constructed a three-dimensional physical similarity model and comprehensively investigated the instability mechanisms of high and steep slopes by using various instruments, such as geo-radar, acoustic emission monitor, optical borehole camera, and digital close-up shadow gauge. Yang et al. [32] constructed a large-scale true three-dimensional similar physical simulation test (3.5 m × 3 m × 2 m) and analyzed the overburden rock breakage and transport and the three-zone dynamic evolution law in the safe mining of the thick coal seam with the use of a grating displacement continuous monitoring device. Ye et al. [33] carried out a three-dimensional physical similarity test of the stresses and displacements in the overburden rock in deep coal seams with large dips. The results showed that the formation of the false top of the overlying rock layer basically reflected the evolution process of the fissure. Li et al. [34] investigated the crushing and transport laws of the overlying rock layer in the process of downcutting the very close coal seam by utilizing the three-dimensional physical similarity testing and on-site observation methods. Wen et al. [35], after investigating the structure and movement law of the overlying rock layer in the large-height mining face, and based on the structure of the overlying rock body, established the following modeling method for the roof structure of the large-height mining face. In our past studies [36,37], we independently developed a set of three-dimensional large-scale physical simulation experimental systems, which is able to effectively carry out modeling experimental research on the process of coal and gas co-mining in the working face.
The above studies show that physical similarity simulation experiments are an effective method for theoretical research and simulation of engineering practices. However, most of the current studies are focused on the two-dimensional planar framework, and the three-dimensional physical simulation framework is less often seen. Although some efforts have been made to employ 3D models, they remain underutilized, and their integration with real-time monitoring systems is insufficient. Additionally, experimental platforms that combine coal seam mining, ventilation, and gas migration tend to have limited coverage, often overlooking the complex interactions between gas transport, storage, and dynamic stress redistribution characteristics in the overburden. There is a lack of a comprehensive 3D modeling framework, including the lack of advanced real-time monitoring tools, such as microseismic systems, fiber optic sensing, and remote sensing technologies, which can be used to adequately explore and predict fissure evolution and gas aggregation. Therefore, we take a typical large-height integrated mining face as a prototype and conduct a large-scale 3D physical similarity simulation experiment. By using the method of microseismic monitoring and physical model dissection, the activity and fissure evolution laws of the overburden rock of the large-height comprehensive mining were investigated. The results provide a basis for the study of the overburden unloading gas transport and storage mechanisms in large-height comprehensive mining faces.

2. Experimental Design

2.1. Experimental Prototype

The experimental prototype of the fully mechanized mining face with a large mining height is selected from the 302 working face of the Tianchi coal mine in Shanxi Province, China. The mine has a designed production capacity of 1.2 million tonnes/year, and mainly involves the #15 coal seam of Taiyuan Formation (C3t) of the Upper Carboniferous System, with a dip angle ranging from 1° to 21° and an average dip angle of 7° [38,39]. The working face is arranged along the direction of the coal seam. The inclination length of the working face is 174 m, the strike length is 2088 m, and the mining height of the coal seam is 5.2 m, which is a large mining height working face. The occurrence of coal seams in the working face does not change much, and there are local soft layers. The Platts hardness coefficient of #15 coal is f = 0.17~0.8, the recoverable index is 1.0, the coefficient of variation of coal seam thickness is 12.93%, the thickness of coal seam is 4.1~6.5 m, the average thickness is 5.2 m, and the thickness of the coal seam is stable. The dip angle of the coal seam is 5~14°, with an average value of 8°. The gas content and gas pressure of the #15 coal seam are large, and the working face exhibits coal rock gas dynamics, which belongs to the high gas outburst working face, as shown in Figure 1.

2.2. Three-Dimensional Similar Physical Simulation Scheme

2.2.1. Similarity Constant of Three-Dimensional Model

The three-dimensional model is similar to the prototype, mainly including geometric similarity, time similarity, bulk density similarity, Poisson’s ratio similarity, stress similarity, strength similarity, permeability coefficient similarity, and microseismic source similarity. The specific similarity constants are determined as follows [36]. (1) The size of the three-dimensional model is consistent with the actual size of the site working face. The geometric similarity ratio is determined to be 1:100; that is, 1 m in the three-dimensional model is equivalent to 100 m on site. (2) The time similarity constant is the square root of the geometric similarity constant. For example, if the working face advances 3 m every 24 h on site, the three-dimensional model advances 3 cm every 2.4 h. (3) The bulk density similarity is generally 1:1.5; that is, the bulk density ratio of the three-dimensional model material to the site rock layer is 1:1.5. (4) The Poisson’s ratio similarity constant is generally 1:1. The value is the product of the bulk density similarity constant and the geometric similarity constant. Therefore, the stress similarity constant is determined to be 1:150. (5) The strength similarity is equal to the stress similarity constant. Therefore, the strength similarity ratio is 1:150. (6) The microseismic results monitored in the three-dimensional experiment are consistent with the actual site, mainly including the concentrated distribution range and maximum distribution range of microseismic events at different advancement rates. Since the distribution range of microseismic monitoring is mostly related to distance and belongs to the geometric scale, its similarity constant is consistent with the geometric similarity constant, with a ratio of 1:100.

2.2.2. Experimental Model Similar Material Ratio

Based on the research results of gas transport and the storage similarity simulation experimental materials, the raw materials used to build the three-dimensional physical similarity simulation include aggregate sand, cement as a binder, starch, and coal ash as an aggregate to simulate coal seams, with water as a plasticity agent. According to the histogram of the coal and rock layers of the 302 working face, the categories of coal and rock layers mainly include mudstone, aluminous mudstone, coal seams, fine-grained sandstone, and limestone. Based on the compressive strength, permeability coefficient, and stress similarity constant of different rock layers, the mechanical parameters and permeability parameters of each layer of rock in the three-dimensional model are obtained. According to the research results of similar materials, the mix ratio numbers of each coal and rock layer in the 302 working face are determined, and the mix ratio table of each rock layer is obtained in Table 1.
The three-dimensional similar simulation rock layers are laid layer by layer according to the histogram of the working face. From the prototype to the model, according to the geometric similarity constant, the thicknesses of each coal and rock layer in the model are determined. Based on the size of the three-dimensional model (length 3.0 m, width 2.5 m) and the thickness of the simulated rock layer, the numbers of similar materials are calculated layer by layer. The calculation principle is as follows. First, the total mass G of each layer is calculated based on the volume and bulk density m. Then, the mass mmm of each raw material is calculated for similar materials in each layer. The calculation is based on m = G × R, where R is the proportion of the similar material in that layer.
The buried depth of the 302 working coal seam in this coal mine ranges from 275 to 498 m, with an average value of 386.5 m. According to the geometric similarity ratio model, the laying height should be 386.5 cm. The thickness of the strip steel is 12 cm, the rise of the strip steel is 5 cm, the laying height of the model is 170 cm, and the thickness of the solid laying material is 153 cm. The loading force F = ρ Vg is required, where ρ is the bulk density of similar materials, and V is the volume of unpaved similar materials. The value of ρ is 1.6 × 10³ kg/m3, and V = 3 × 2.5 ((386.5 − 153) × 0.01) = 17.5125 m3, so the loading force F = 280,200 N. The time similarity constant is α t = α t = 10 , and formal operation of the 302 working face is on-site daily, with 4 cycles of production. Each cycle footage is 0.8 m, the coal cutting height is 5.2 m, and the daily footage is 3.2 m; in the model, the footage is 3.2 cm every 2 h and 24 min.

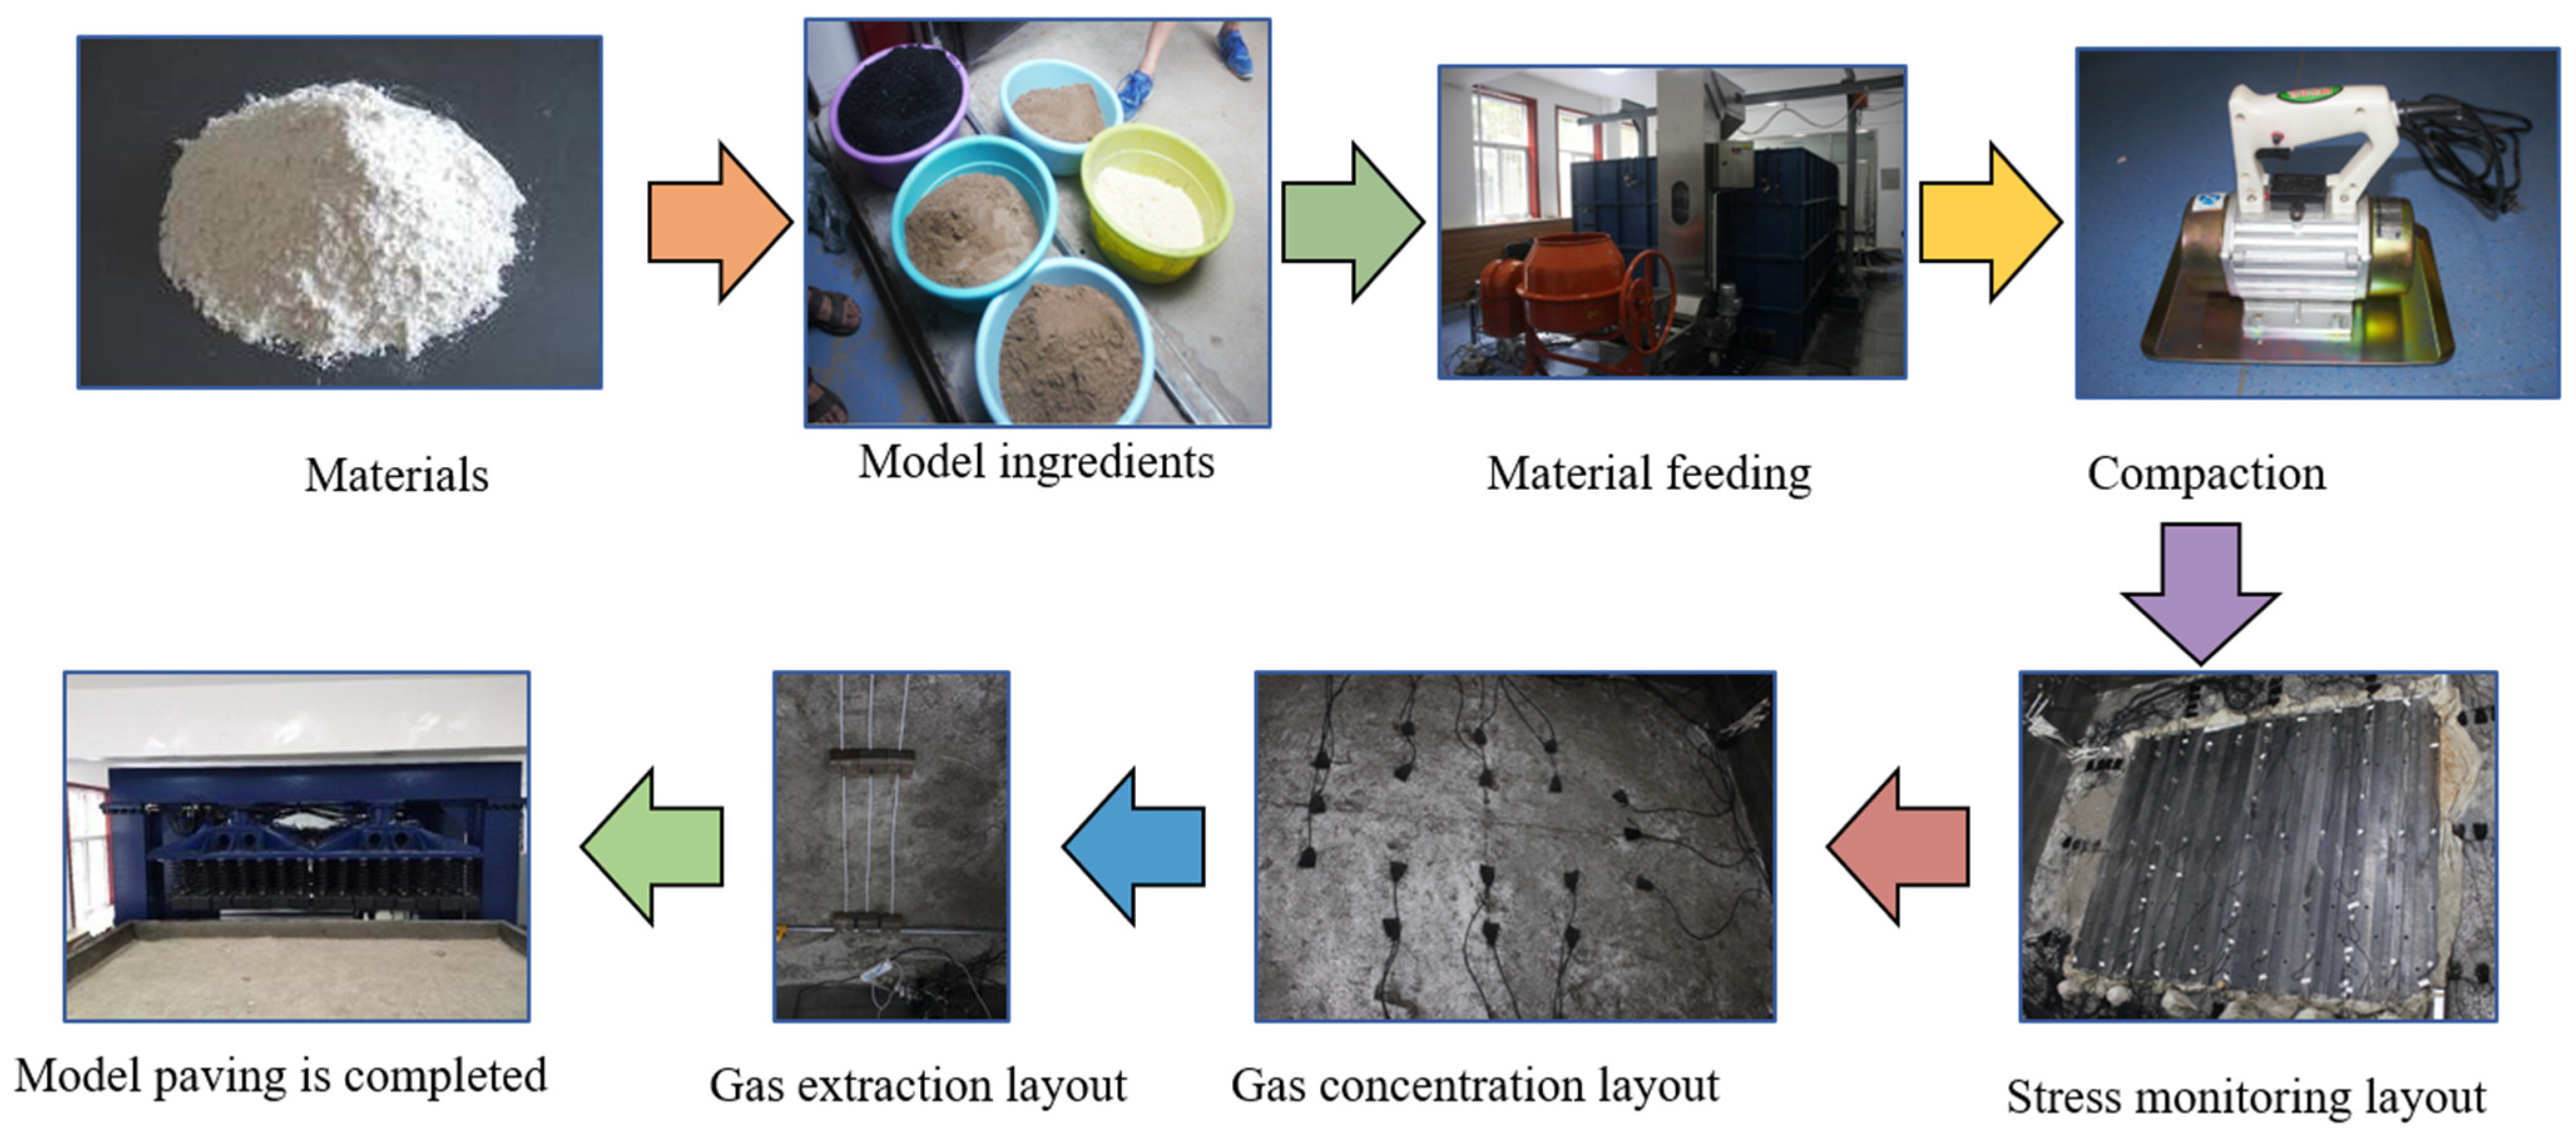
2.2.3. Construction Process of the Three-Dimensional Experimental Model

The construction process of the three-dimensional physical similarity experimental model is shown in Figure 2. First, the materials are carefully screened to ensure that the experimental aggregate sand meets the required particle size. Then, the sand, cement and starch are weighed to an appropriate amount, put into the mixing system of the experimental system, and combined with an appropriate amount of water for stirring. Next, the mixed material is transported to the experimental box by a feeder, and the material is evenly laid in the box. The material is compacted with a tamping hammer to a predetermined thickness, and the surface is evenly sprinkled with mica sheets to simulate rock separation. After laying one layer, the next layer is laid according to the coal rock histogram until the whole three-dimensional model is completed. When the model is built, according to the experimental scheme, the stress, gas concentration, microseismic sensor, gas drainage pipeline, etc. are embedded in the predetermined layer of the three-dimensional model. The 3D experimental model is dried for 6 months after being laid to ensure that it is free from the effects of water, allowing us to maintain consistent conditions throughout the study. After the model completely dries, experiments related to coal seam mining operations are conducted. No sealants are used during the process to preserve the natural behaviors of fissure formation and gas migration in the overburden.

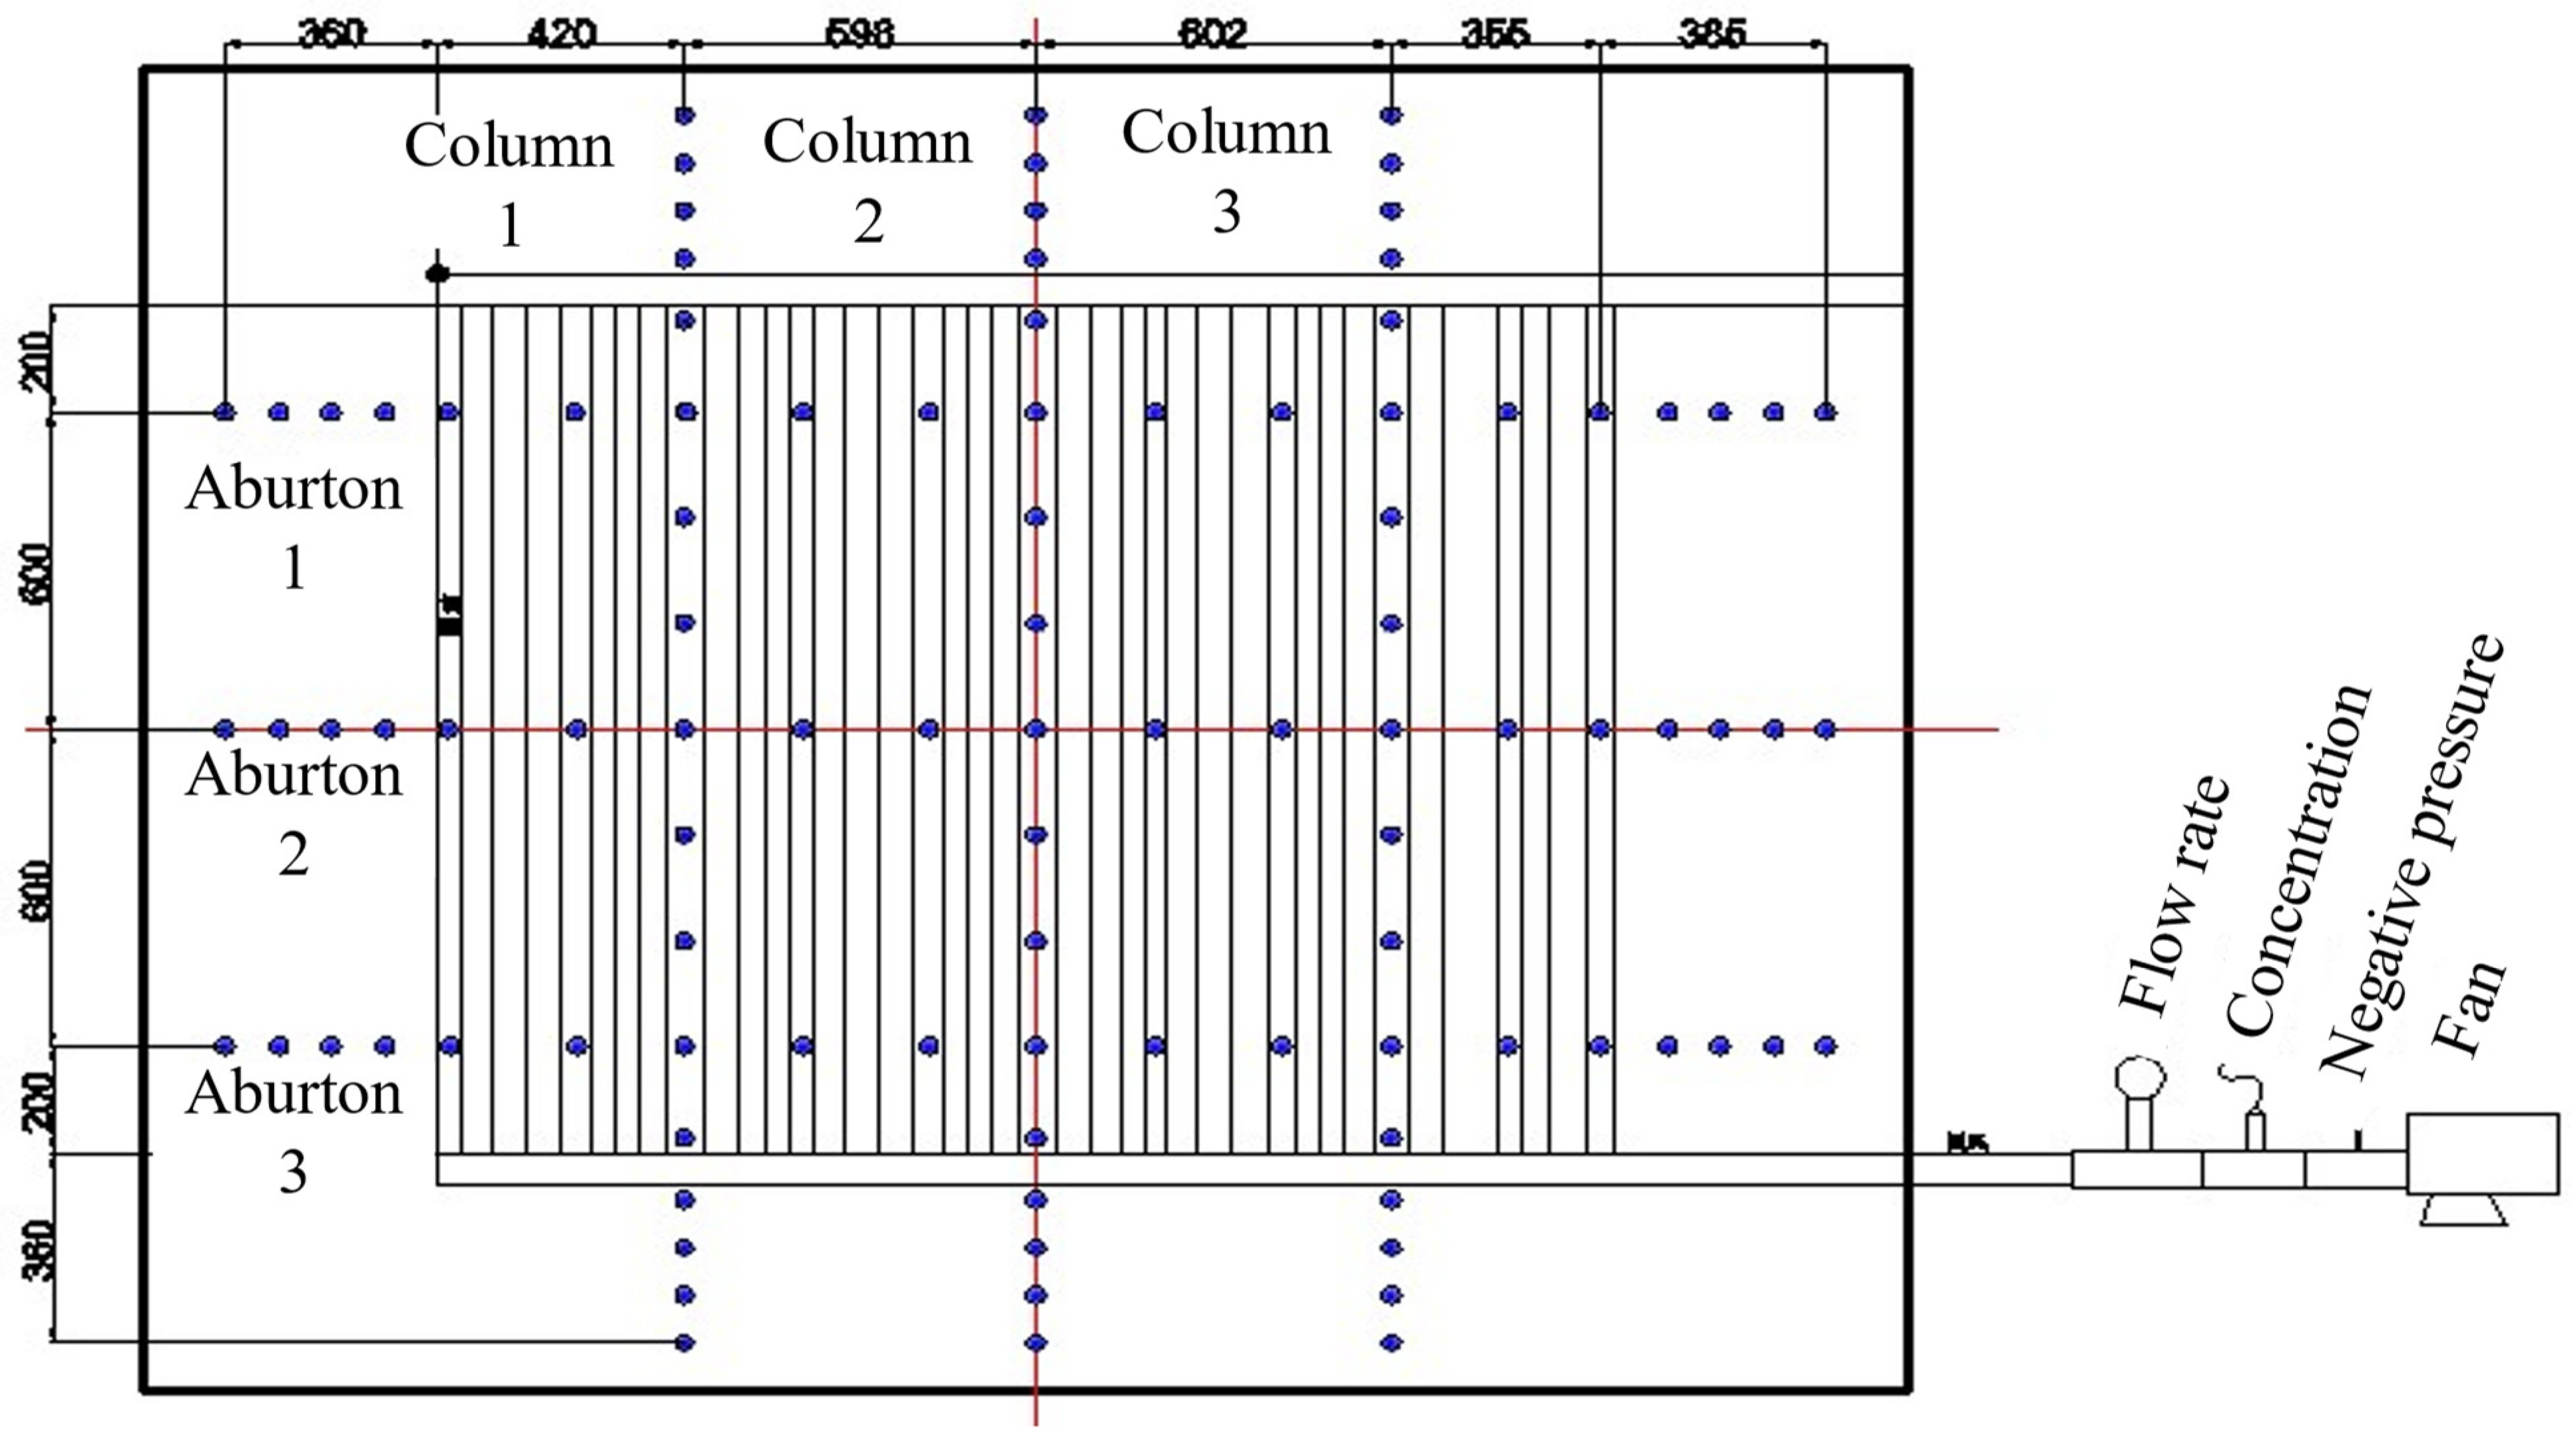
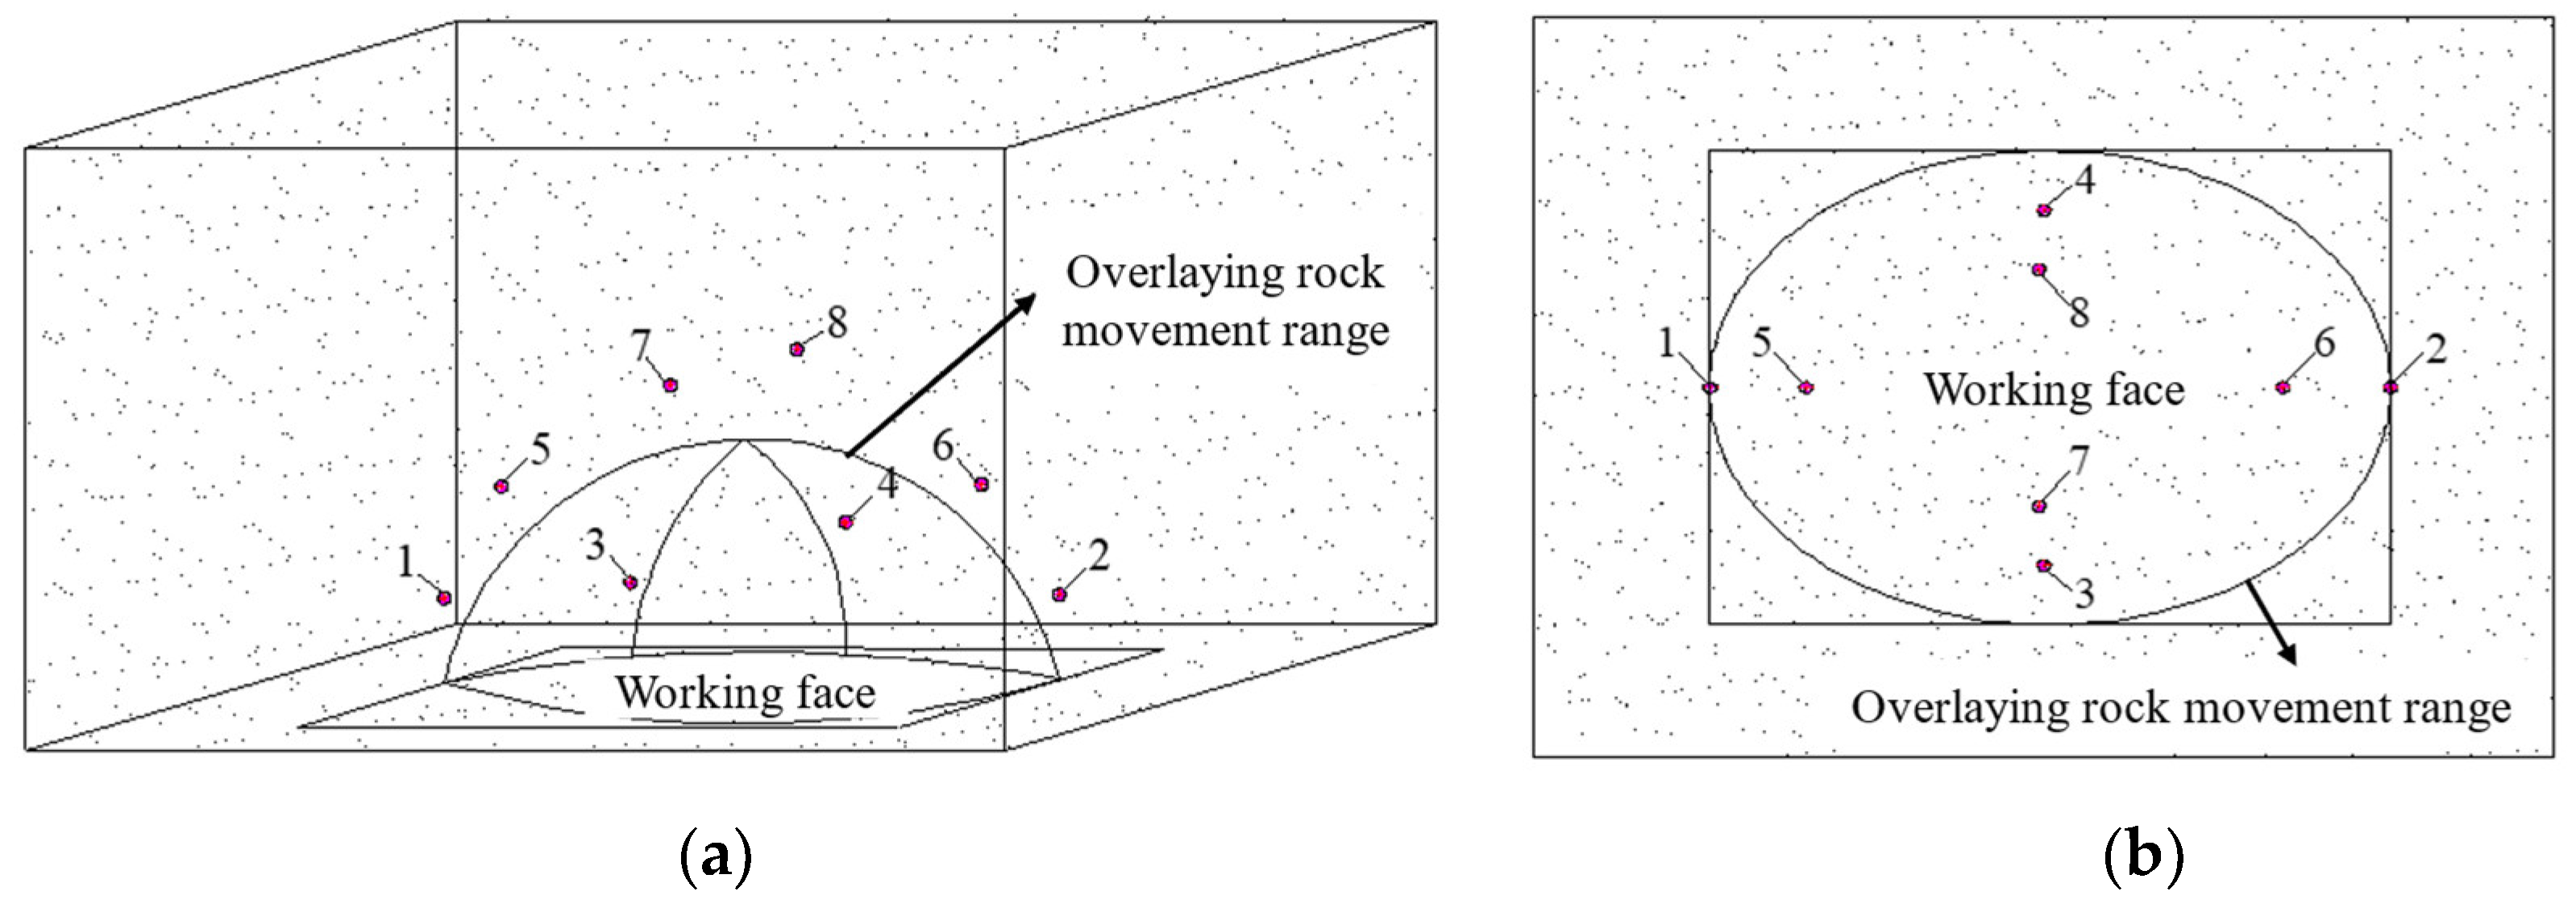
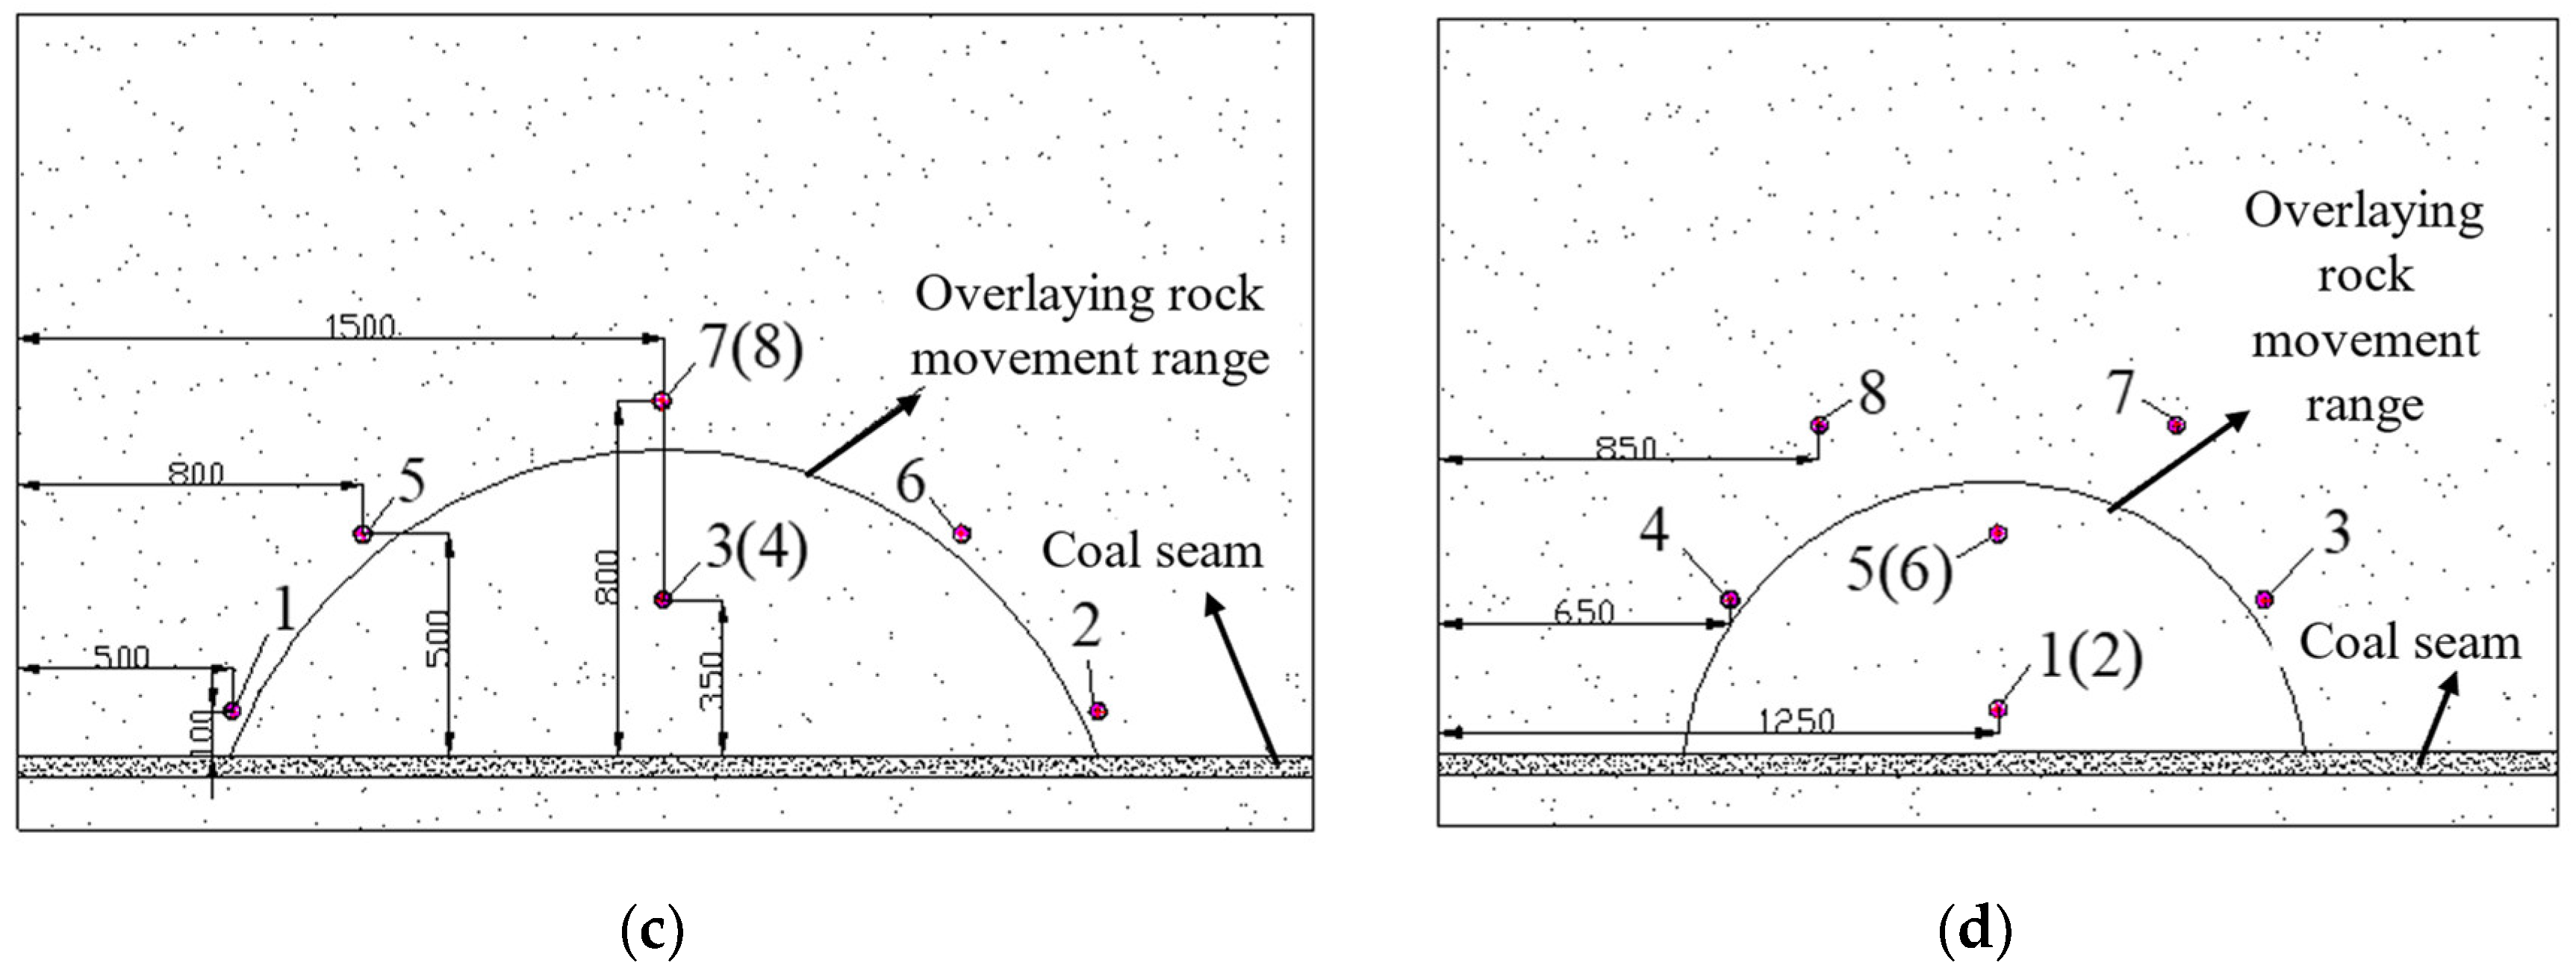
2.2.4. Scheme of Sensor Arrangement

During the advancement of the working face coal seam, the stresses at specific locations on the coal seam floor show a process of increasing, reaching a peak, unloading, and gradually restoring. To accurately observe the stress change pattern of the coal seam floor, stress sensors are arranged throughout the mining environment. The AT8106 miniature compressive stress sensor is selected for the experiment. The sensor’s mV signal through the analog weight transmitter is converted to analog signals (output 4~20 mA, 0~5 V, 0~10 V) and other signals to achieve the PLC and other communication connections. The stress sensors are arranged in three horizontal and three vertical rows to observe the stress changes along the strike and dip of the coal seam. The three horizontal rows are along the strike direction of the working face, and the three vertical rows are along the dip direction of the working face. The horizontal sensors extend 36 m into the coal wall with a spacing of 9 m from the cut to the stopping line, which has a spacing of 20 m; the spacing between each of the three horizontal rows is 60 m. The vertical rows extend 36 m into the coal wall, with a spacing of 9 m from the intake airway to the return airway and a sensor spacing of 20 m. The first vertical row is 40 m from the cut, the second vertical row is 100 m from the cut, and the third vertical row is 160 m in front of the cut, as shown in Figure 3.
During the mining process of the working face, the original stress balance state inside the three-dimensional physical similarity simulation model is destroyed, and the rock strata in the mining space are fractured and damaged, releasing elastic strain energy and generating microseismic signals. The source energy is transmitted in the form of elastic waves. To accurately locate the microseismic signal and receive it, eight sensors are used in the test, and the layout design is shown in Figure 4. In order to accurately capture the vibration signal in three-dimensional space and determine the vibration position, the sensors of adjacent layers are staggered. To prevent the sensor from being suspended after the collapse and to effectively receive the seismic signal, the sensor is arranged outside the collapse area.

3. Results and Discussion

3.1. Three-Zone Morphology Distribution of Overburden Fissure

3.1.1. Three-Zone Shape Distribution of Overburden Fissure

In the process of coal seam mining, the overlying strata are increasingly suspended. When the internal stress exceeds the strength of the strata, the overlying strata are first broken and collapsed. With the continuous advancement of the working face, due to the continuous suspension of the main roof and the action of mine pressure, the overlying rock falls periodically. The breaking height of the overlying rock rises continuously until the main key layer is touched. The mining-induced overburden fractures form a three-zone with obvious characteristics from the bottom to the top, namely, the caving zone, the fracture zone, and the bending subsidence zone. The crisscross fractures of the caving zone and the fracture zone constitute a three-dimensional fracture network space for gas transport and storage, as shown in Figure 5.
Through the experimental cutting, it can be seen that the three-dimensional physical similarity simulation experiment can better reflect the process of breaking, caving, and re-compaction of the overlying strata after coal seam mining. In the three-dimensional cutting map, the strike and tendency fracture zone can be clearly divided, as well as the range of fracture compaction zone and bending subsidence zone. With the cutting of the model, the separation phenomenon occurs about 65 m from the coal seam floor, at the top of the overburden fracture zone, and the bottom of the bending subsidence zone. The rock stratum is relatively broken 25 m from the coal seam floor. Therefore, in the height direction, the caving zone is within 25 m of the coal seam floor, which is 4.8 times the mining height; the fracture zone is 25–65 m away from the coal seam floor, which is 12.5 times the mining height, and the top of the fracture zone is rich in separation cracks. The distance from the coal seam floor is greater than 65 m, making it a curved subsidence zone. In Figure 4, the X-direction is the inclined direction of the coal seam, and the Y-direction is the advancing direction of the working face. The Z-direction is the height direction of the coal seam, and the overall collapse form is an ellipsoid. The main channel for gas migration and storage is between the inner and outer ellipsoids, and an obvious masonry beam structure is formed at the edge of the ellipsoid.

3.1.2. Variations in Microseismic Events in Coal Seam Mining

With the mining of coal seams, microseismic signals are continuously transmitted in the stope space, and the high-frequency microseismic system collects and analyzes the microseismic signals from time to time. The working face begins to be mined to advance the three-dimensional model space within 200 m to produce microseismic events, as shown in Figure 6.
From Figure 6, as the working face progresses to 21 m, microseismic events are predominantly located in the central and lateral regions of the overlying rock strata within the mining face. The extent of these events reaches heights of 20 m, strike lengths of 50 m, and dip lengths of 150 m. At an 8 m height in the overlying rock, the high densities of microseismic events indicate well-developed fractures. Additional events are observed at the coal seam floor, the rear of the goaf, and ahead of the working face. The microseismic signals at the rear of the goaf are largely attributed to the re-compaction of collapsed rock, while those ahead of the working face occur due to stress concentration causing micro-fractures. In the dip direction, microseismic events are focused within a height range of 2–13 m, with significant concentrations at the upper and lower ends and the central area. When the working face reaches 45 m, considerable destruction ensues, leading to a marked increase in the number of microseismic events. The range of these events expands farther in both the strike and dip directions. In the strike direction, the concentration of microseismic events within the goaf grows to approximately 20 m, with the maximum distribution range extending to 30 m. This increase before and after the goaf indicates an expanded range of coal–rock fractures due to mining. In the dip direction, the heights of microseismic events also rise, with increased concentrations at the extremities and the central area, initially forming an elliptical paraboloid shape.
Advancing to 81 m, the concentration area of microseismic events in the overlying rock expands farther in both the strike and height directions. In the strike direction, the concentrated distribution grows to around 45 m, with the maximum height increasing to 58 m. In the dip direction, the microseismic event distribution shows a layered pattern from the bottom to the top based on density. Ahead of the working face, further stress concentration and fracturing cause microseismic events to extend forward, with pre-advanced events occurring. Every 20 m of advancement shows large-scale concentrations of microseismic events, forming an elliptical paraboloid shape in the spatial distribution. As mining continues, the concentration area of microseismic events further develops in the strike and height directions, forming an overall elliptical paraboloid shape. When the coal seam is mined from the cut to 180 m, the elliptical paraboloid shape in the height direction stabilizes. Upon advancing to 200 m, the height of the concentrated distribution of microseismic events stabilizes at 67 m, with the maximum height distribution reaching around 113 m. In both the strike and dip directions, the outer coal–rock microseismic events are more numerous and widely distributed, gradually decreasing toward the outer edges.

3.2. Characteristic Parameters of the Overburden Fissure

To accurately analyze the characteristic parameters of overlying rock fissures after coal seam mining, the subsidence of each rock stratum is counted and drawn into three-dimensional graphics along the strike and dip of the model during the cutting process, as shown in Figure 7.
From Figure 7, the overlying strata in the goaf sink 150 m away from the roof of the coal seam, and the subsidence and subsidence range are relatively small. The maximum subsidence at 150 m of the overlying strata is 1.1 m, the subsidence range is concentrated in the small area of the goaf, and the subsidence shape is irregular oval. The maximum subsidence of the overlying strata 130 m away from the coal seam floor is 1.2 m, the subsidence range expands, and the subsidence shape is irregularly oval. The maximum subsidence of the overlying strata 88 m away from the coal seam floor is 1.5 m, and the subsidence area is further expanded. The subsidence shape is irregularly elliptical, and there is an uplift phenomenon in a small area of the rock layer outside the subsidence area. The maximum subsidence of the overlying strata 72 m away from the coal seam floor is 1.5 m, and the subsidence range is basically similar to that at 88 m, showing an irregular oval shape. The maximum subsidence of the overlying strata 64 m away from the coal seam floor is 1.7 m, the subsidence range is further expanded, and the shape is irregularly elliptical. The maximum subsidence of overburden strata 53 m away from the coal seam floor is 3.3 m, and the subsidence range is further expanded. The subsidence slope area is relatively long, the central compaction area is relatively flat, and the overall shape is irregularly oval. The maximum subsidence of the overlying strata 39 m away from the coal seam floor is 4.0 m, the subsidence range is further expanded, and the subsidence slope area is further extended. From top to bottom, the subsidence range of the overlying strata continues to expand, and the subsidence slope area gradually extends. The central compaction area is relatively flat, and the overall shape shows an irregular oval shape.

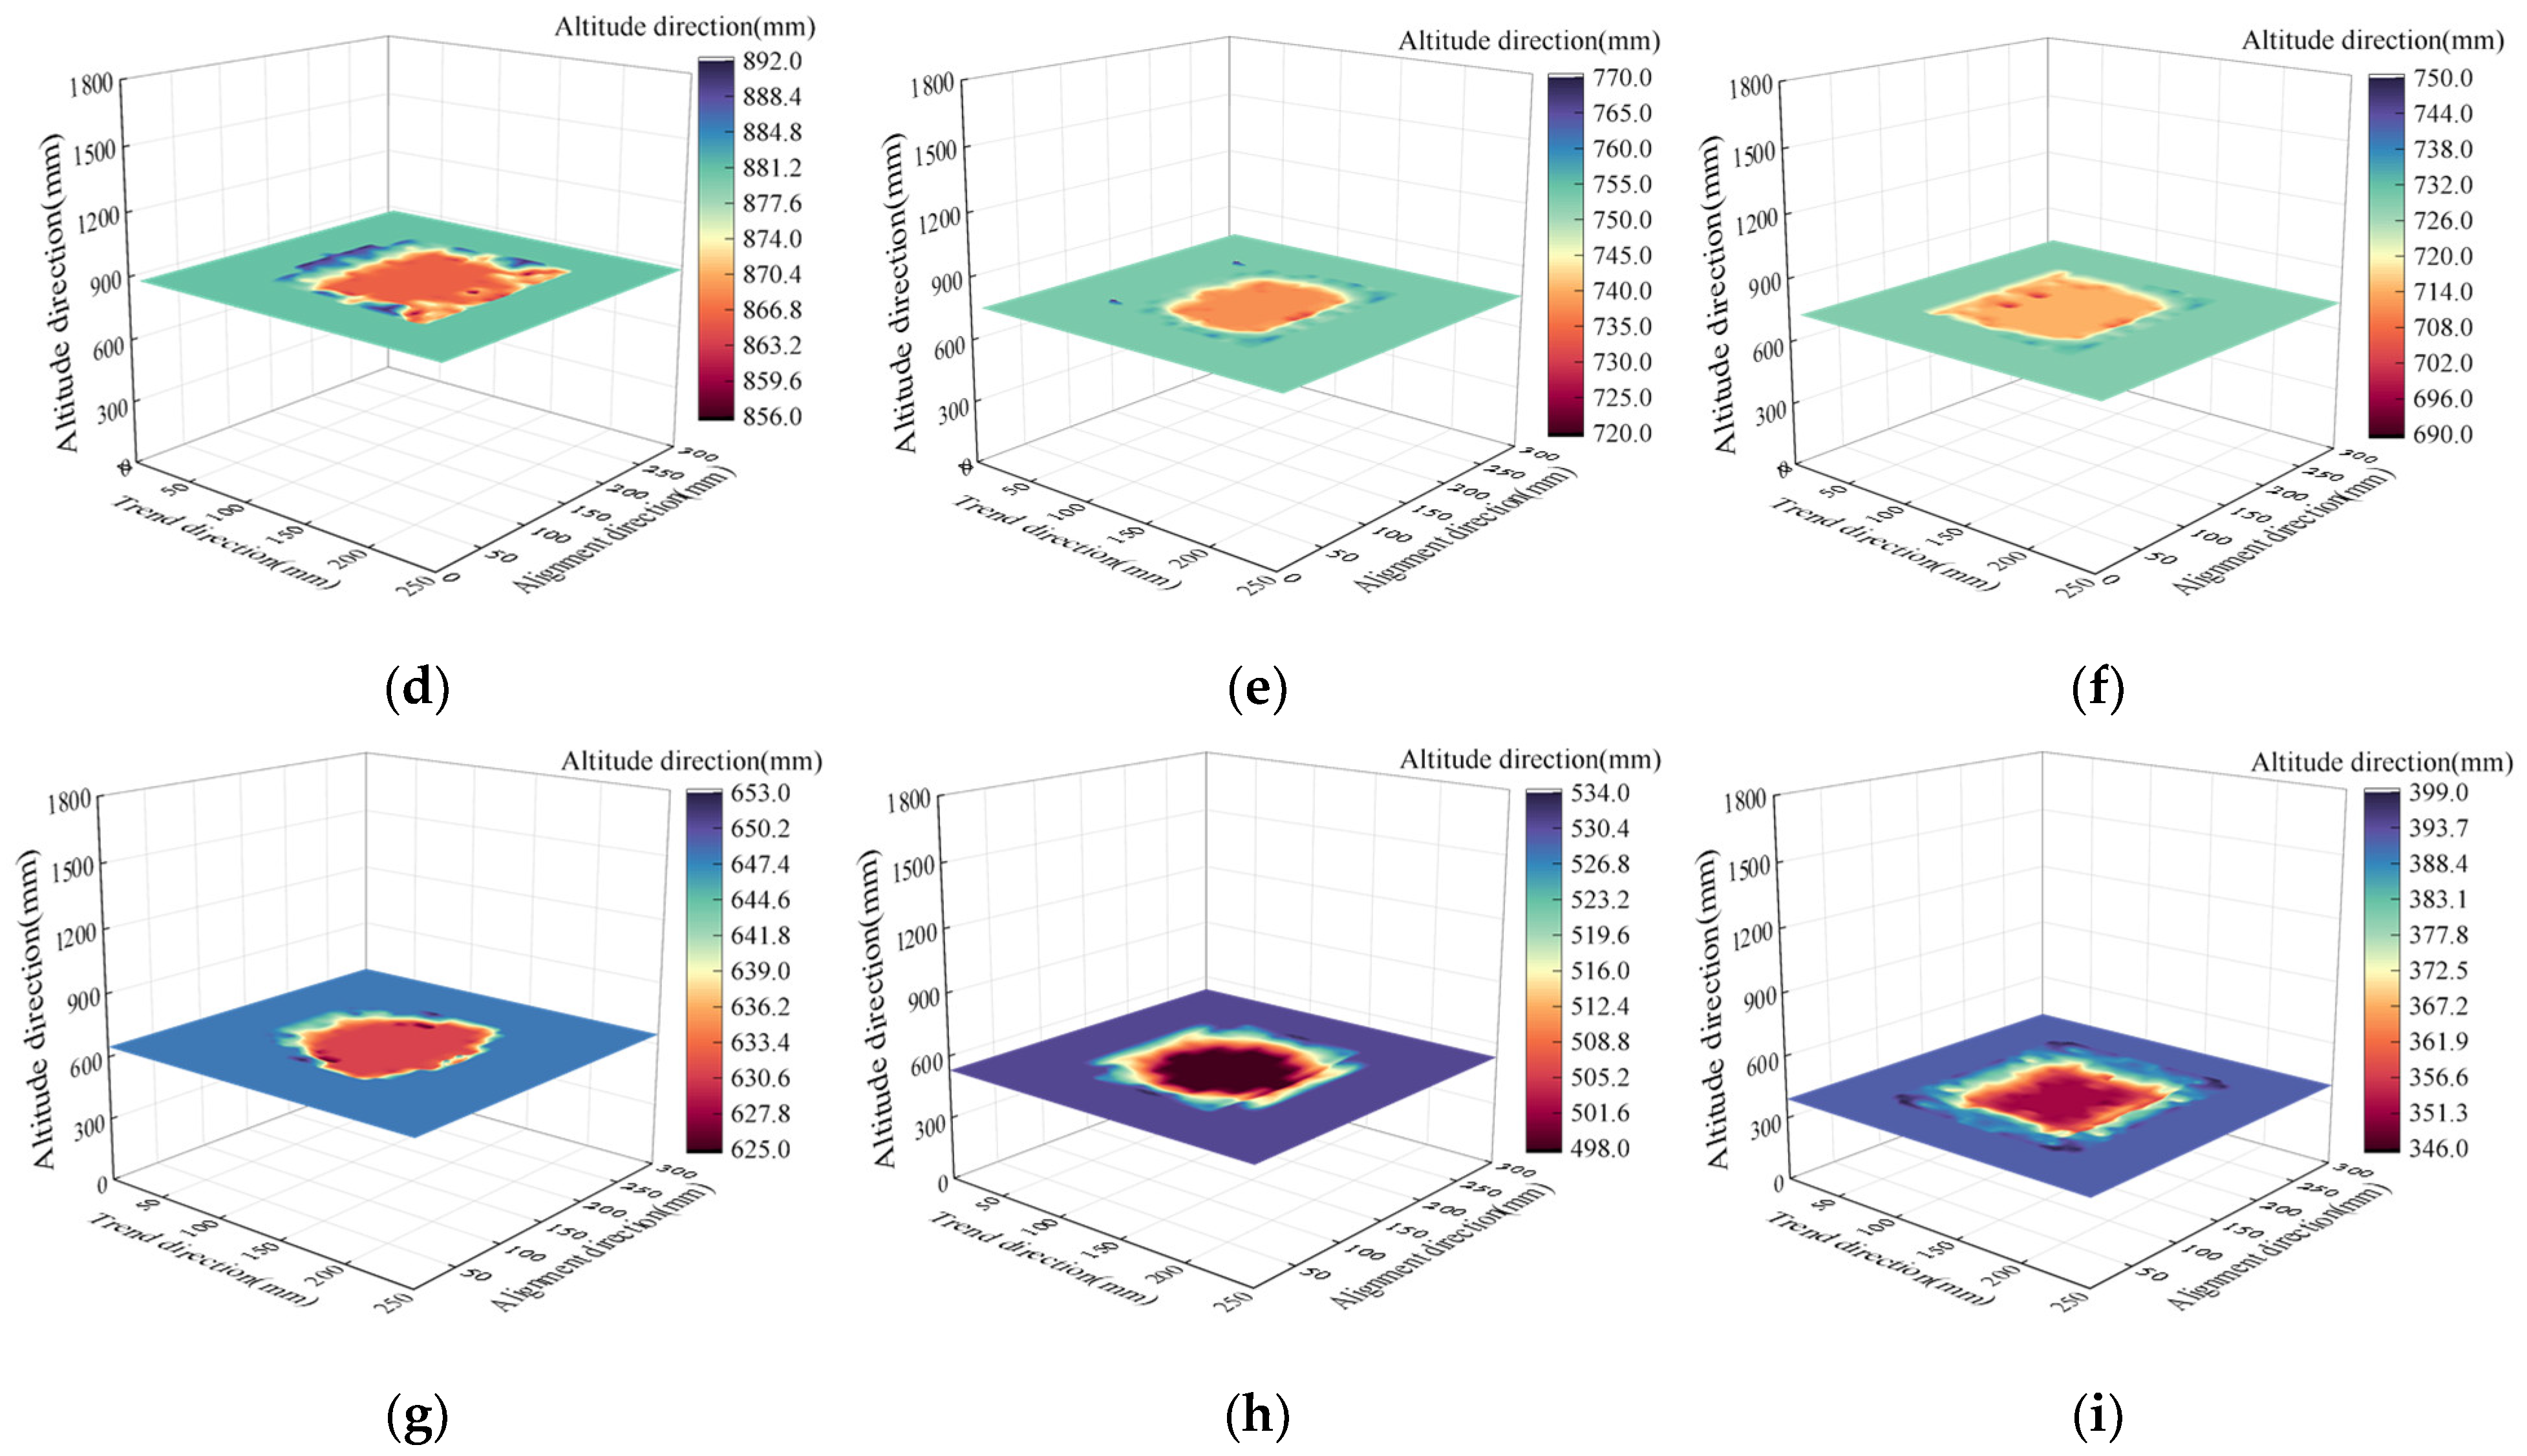
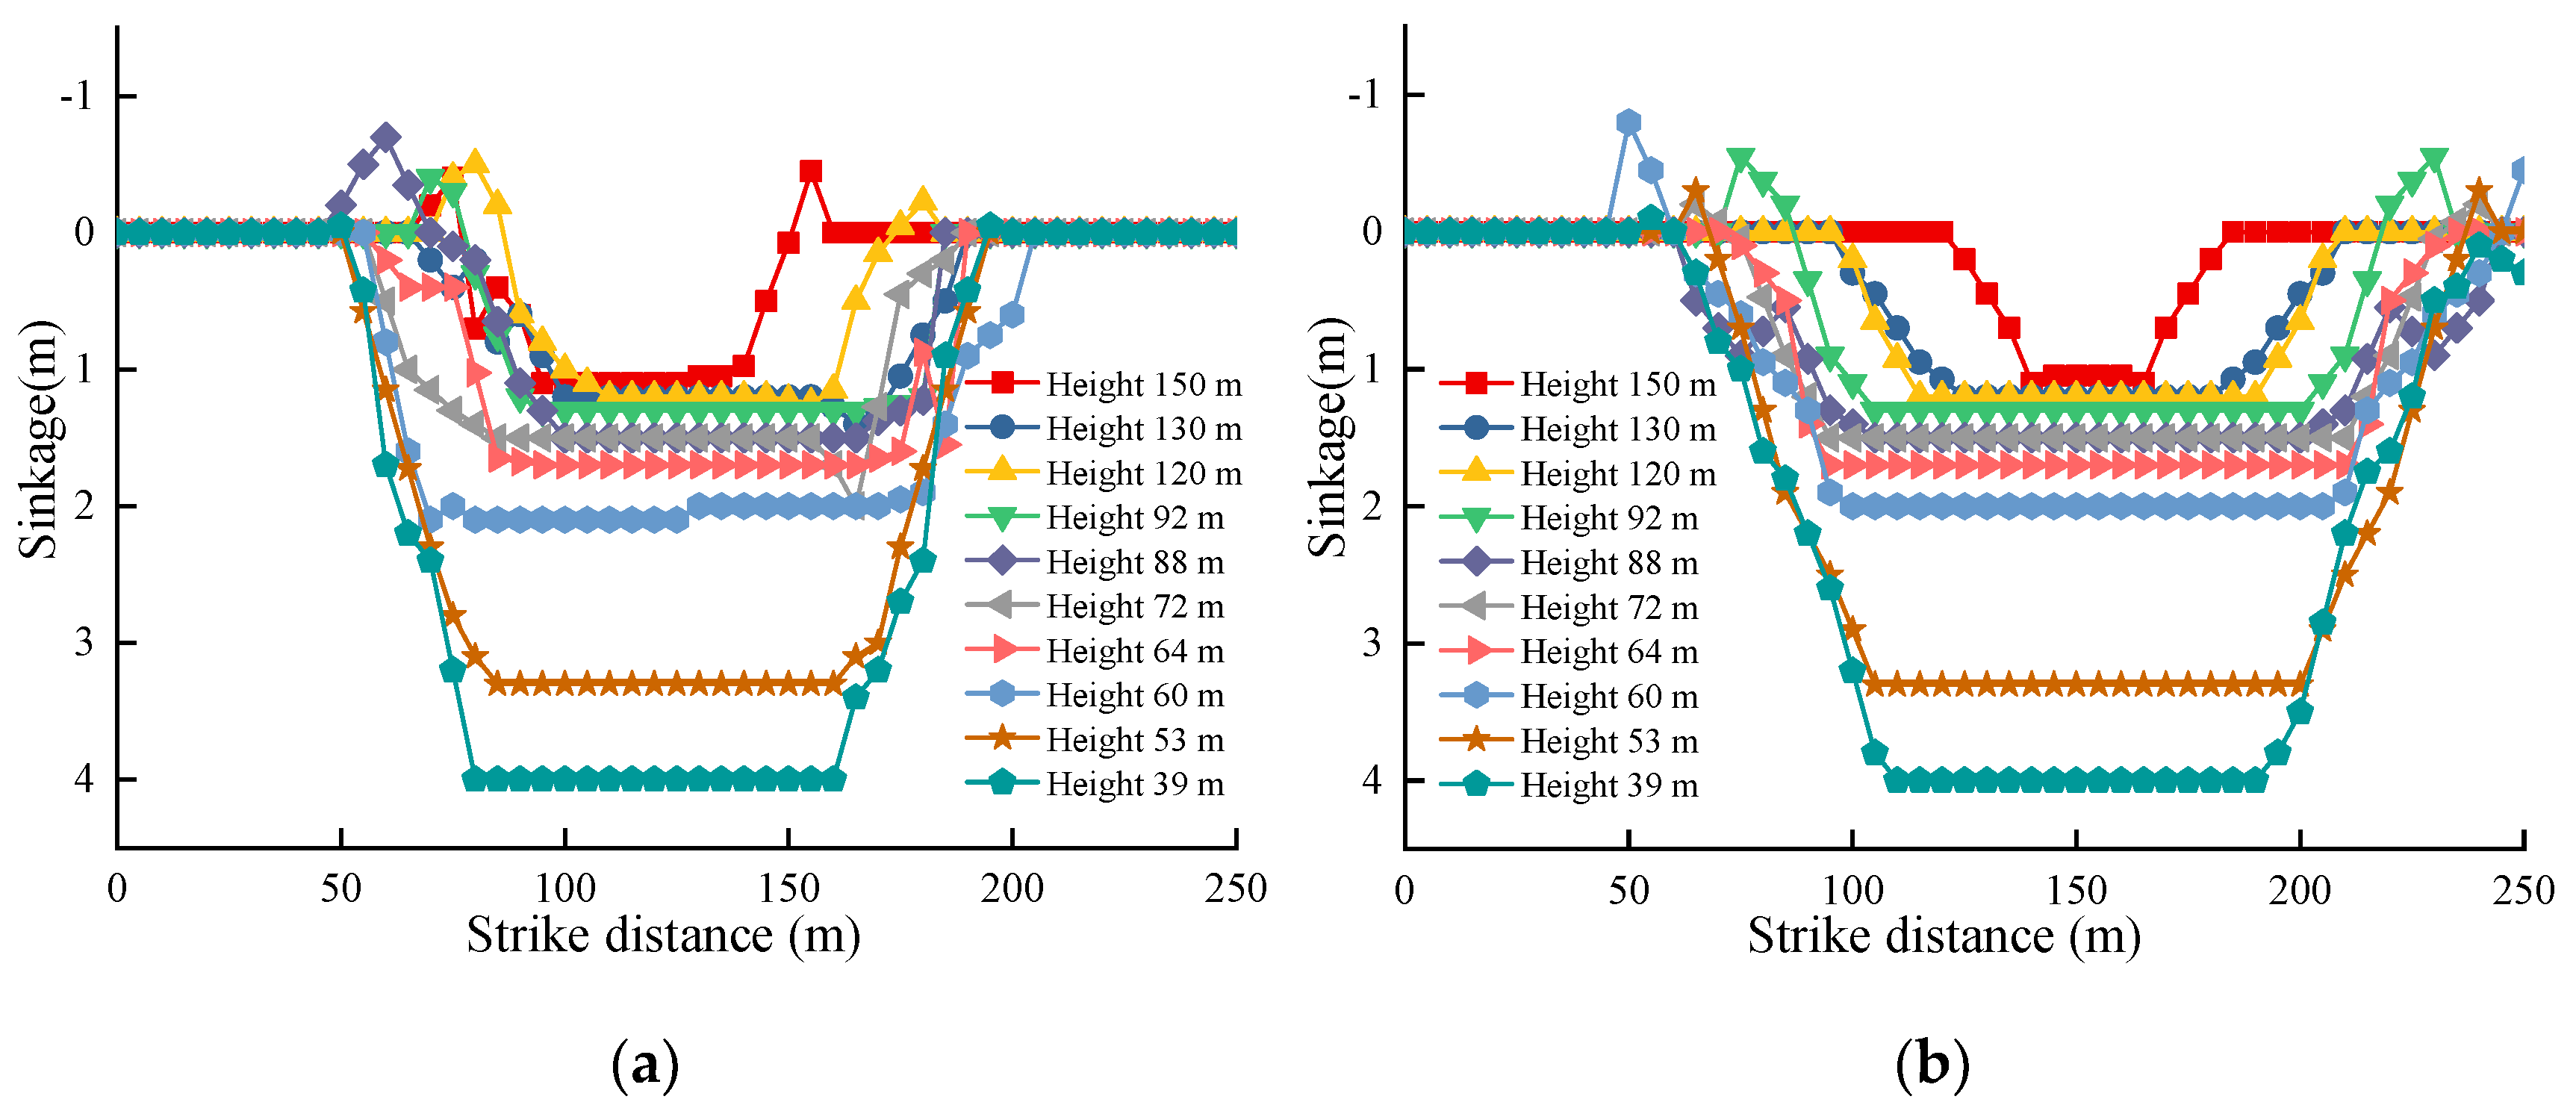
3.2.1. Sinking Amount of Overlying Strata

To accurately analyze the subsidence of each layer of overlying strata after coal seam mining, a measuring point is arranged every 5 cm along the strike and tendency during the model cutting process to test the subsidence. The subsidence of each layer is determined by layer-by-layer statistics, and the middle of each layer along the tendency and direction of the working face is plotted and analyzed, as shown in Figure 8.
From Figure 8, the maximum subsidence of overlying strata in the range of fracture zone is 4.0 m at a distance of 39 m from the floor of the coal seam, 3.3 m at a distance of 53 m from the floor of the coal seam, 2.1 m at a distance of 60 m from the floor of the coal seam, and 1.7 m at a distance of 64 m from the floor of the coal seam. In this height range, the subsidence is larger, and the rate of subsidence change is faster with the increase in height. Under the action of self-weight load, the uncaving overlying strata in the upper part of the model produce bending and overall subsidence, and there is a large separation fracture between the caving strata and the bending lower strata. The transverse cracks and longitudinal fracture cracks in the fracture zone are abundant; these cracks are the main space and channel for gas migration and storage. In the range of bending subsidence zone, the maximum subsidence of overlying strata is 1.5 m at a distance of 72 m from the coal seam floor. The maximum subsidence of overlying strata is 1.2 m at a distance of 130 m from the coal seam floor, and the maximum subsidence of overlying strata is 1.1 m at a distance of 150 m from the coal seam floor. The subsidence relationship in this range is basically the same, and the strata belong to the bending deformation subsidence.

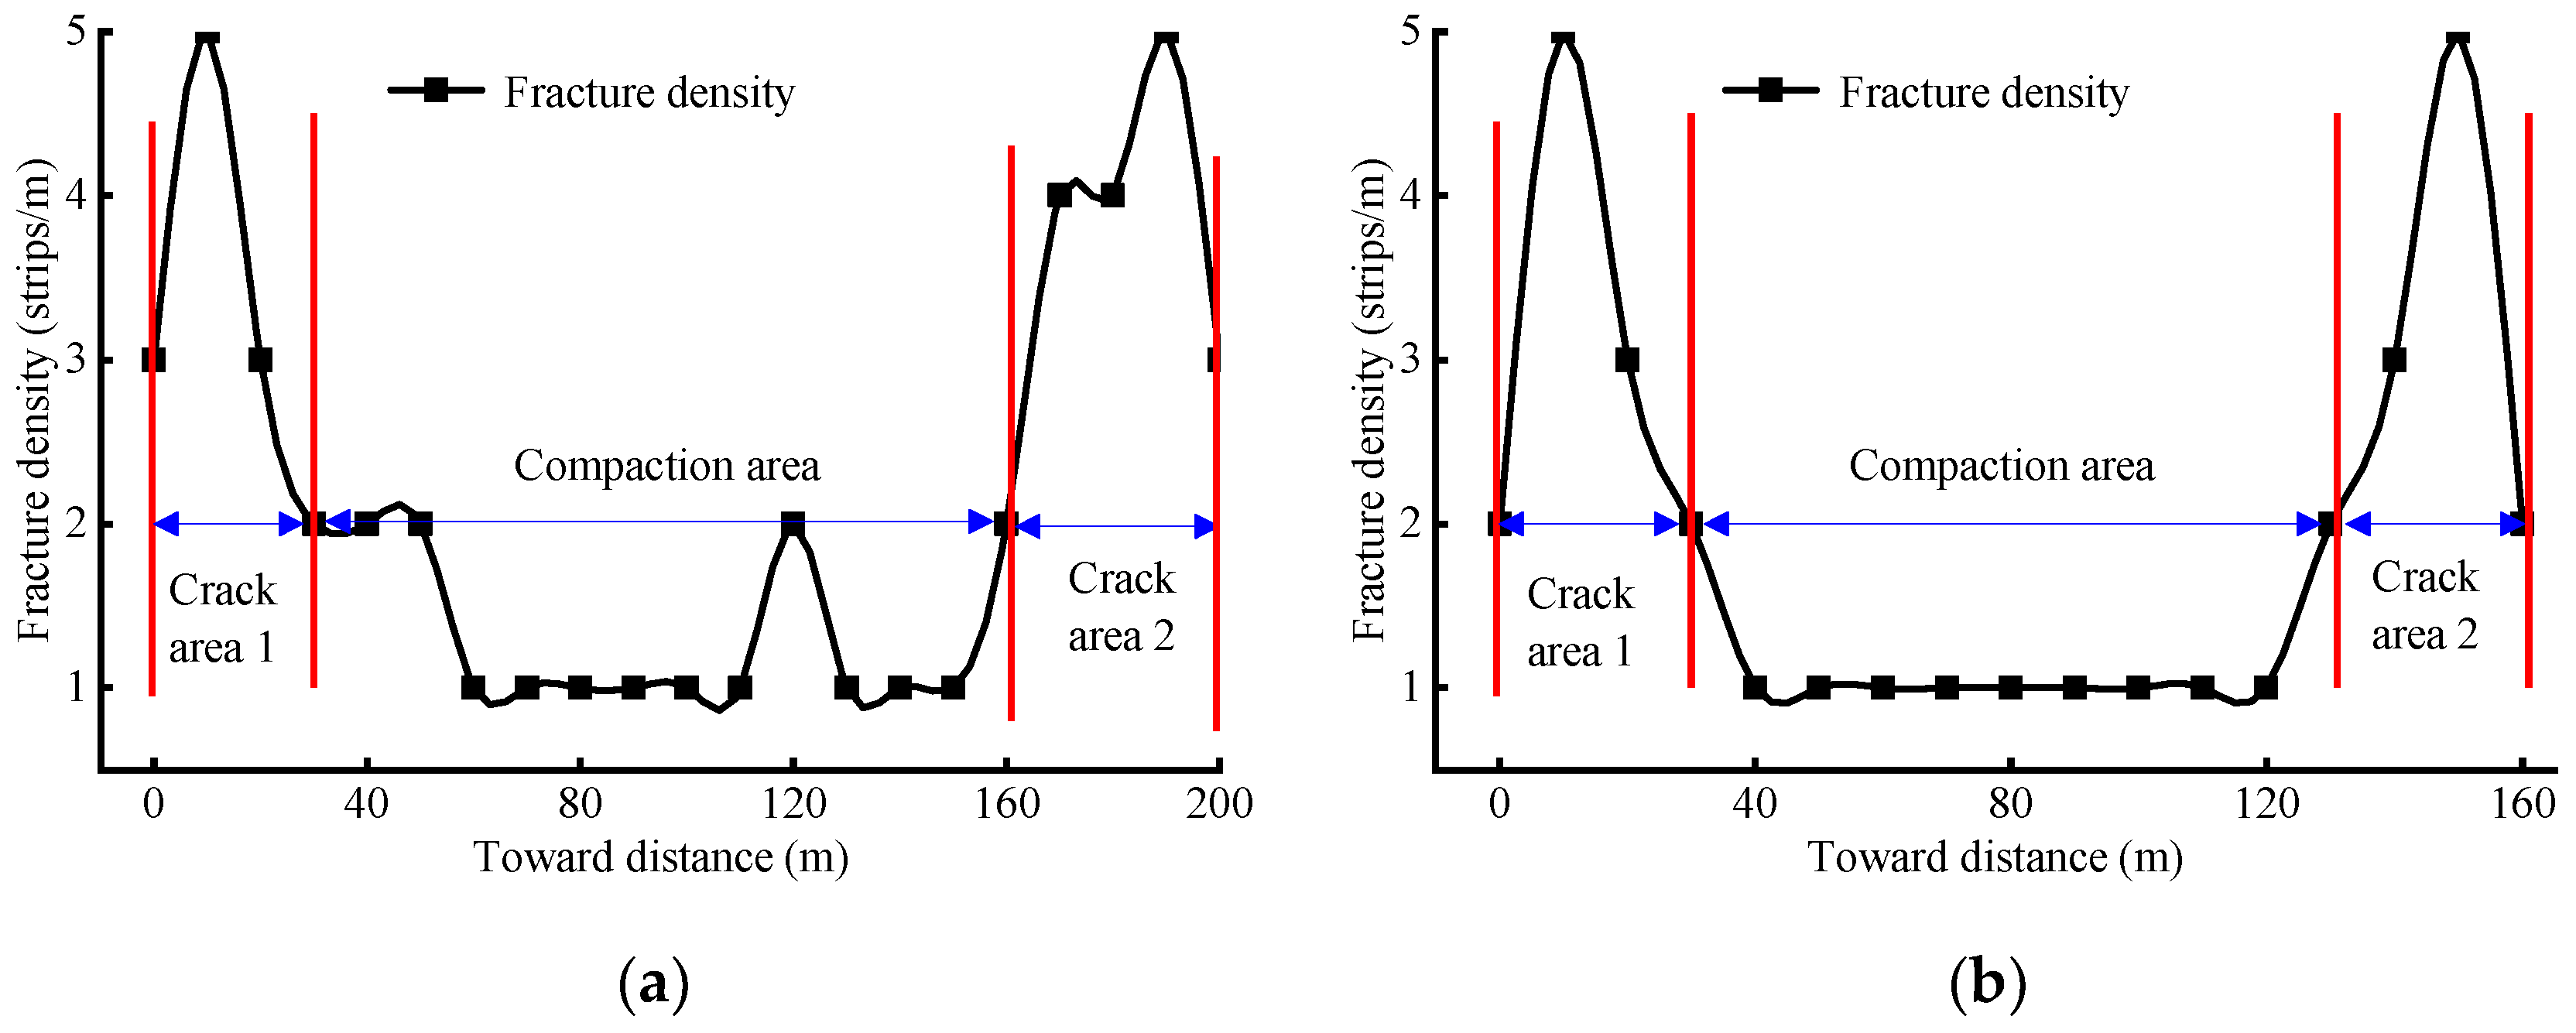
3.2.2. Overburden Fissure Density Distribution

To quantitatively describe the development laws of fractures in the overlying strata of the coal seam mining face, the fracture density is introduced to quantitatively characterize the richness of fracture development. According to the statistical experimental data during cutting, in the direction of the coal seam tendency (X-direction) and strike direction (Y-direction), the number of fractures in this range is counted every 10 m as 1 counting unit. The distribution curve of fracture density after the working face stops advancing is shown in Figure 9.
In the directions of the inclination and strike, the fracture density presents a double hump shape, and the two sides are fracture zone 1 and fracture zone 2 with large fracture densities. Moreover, the fracture density reaches 5/m. In the middle, the fracture density of the compacted area with a relatively small fracture density is between 1 and 2/m. In the strike direction of the coal seam, the distribution range of the first fracture zone is 0–30 m, the maximum fracture density is located at 10 m, and the fracture density is 5/m. The distribution range of the second fracture zone is 160–200 m, the maximum fracture density is located at 190 m, and the fracture density is 5/m. The fracture density in the fracture zone is 4–5 times that in the compacted zone. In the dip direction of the coal seam, the distribution range of the first fracture zone is 0–30 m, the maximum fracture density is located at 10 m, and the fracture density is 4/m. The distribution range of the second fracture zone is 130–160 m, the maximum fracture density is located at 150 m, and the fracture density is 5/m. The fracture density in the fracture zone is 4–5 times the fracture density in the compaction zone, and the fracture zone on the side of the return air roadway is the best area for the layout of the high roadway.

3.3. Stress Distribution of Mining Overburden Fissure

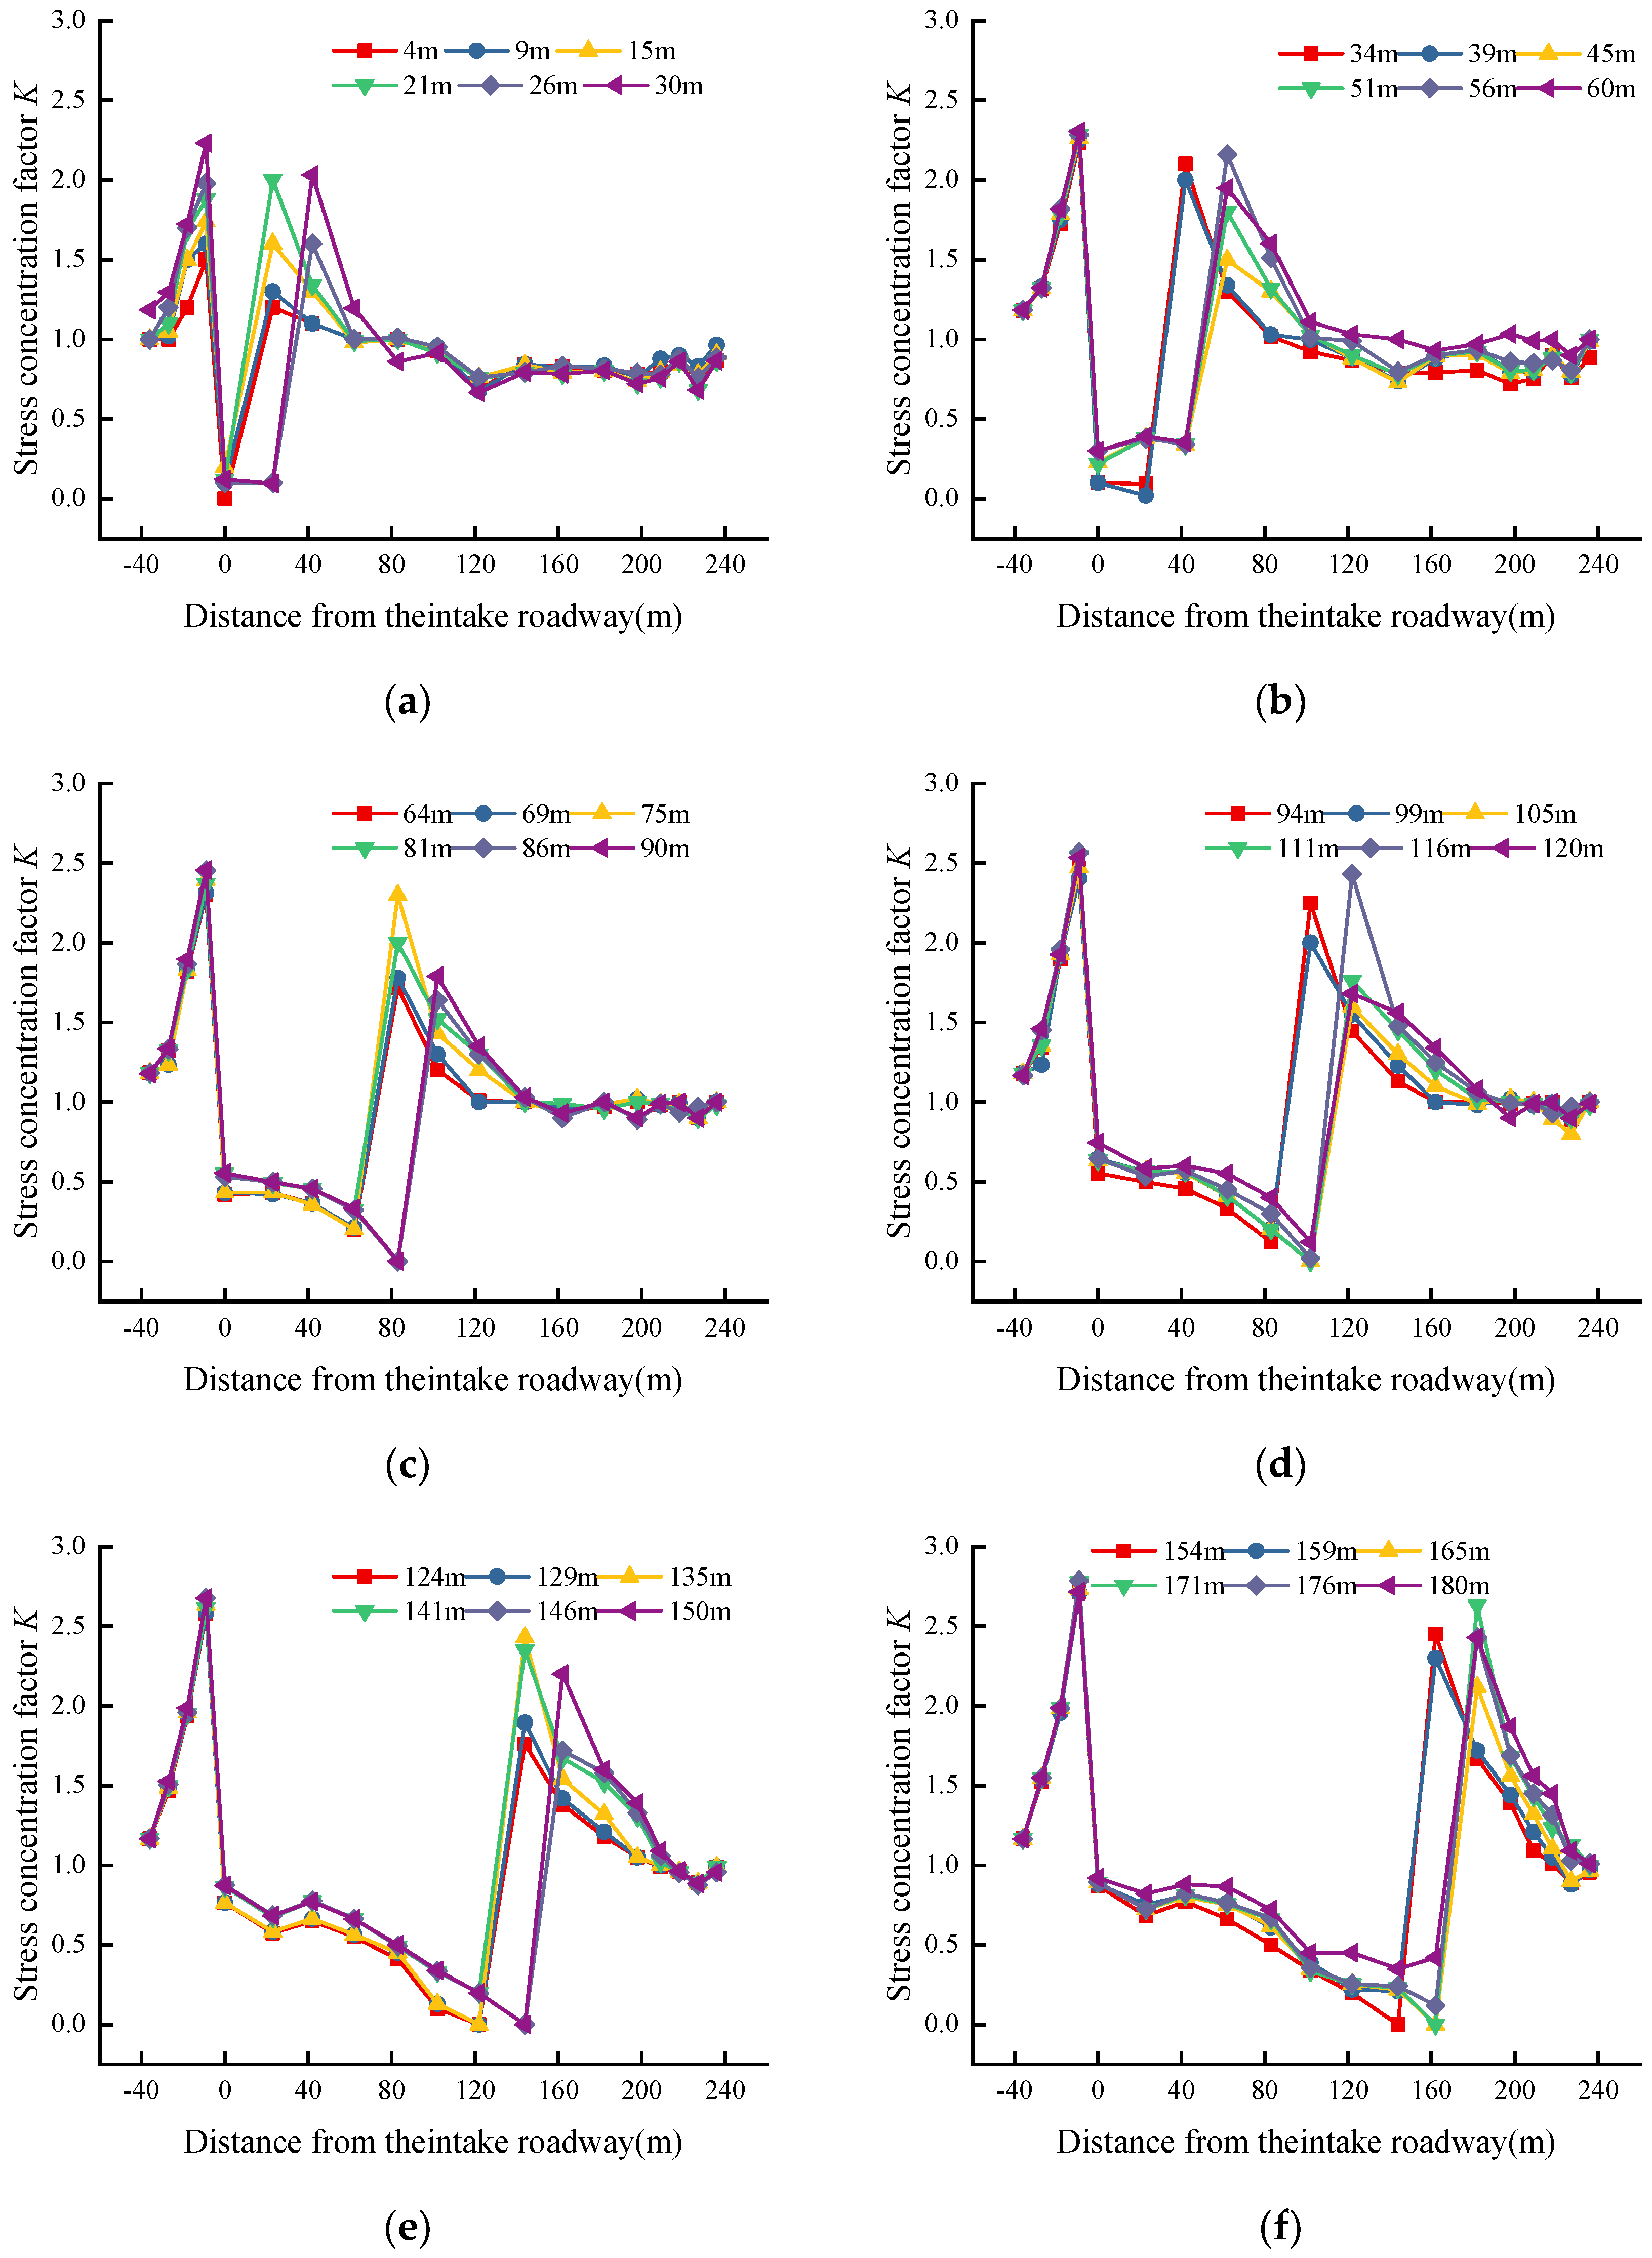
3.3.1. Vertical Stress Distribution along the Strike of the Coal Seam

In the normal mining process of the coal seam working face, the vertical stress concentration area and the pressure relief area appear in the roof in front of the coal wall, and cracks with certain regular characteristics are produced between and within the roof strata in the pressure relief area. To accurately describe the change law of stress in the mining process, the stress concentration coefficient K is used to quantitatively describe the dynamic change law of overburden stress caused by coal seam mining. K is calculated using the following formula:
K = σ max σ avg
where σ max represents the maximum local stress at the point of interest (e.g., near a fissure or around a discontinuity) and σ avg is the average stress in the surrounding area, typically in the undisturbed regions of the rock strata.
According to the stress value of the measuring point of the working face floor before and after coal seam mining and the distance between the cutting hole, the distribution law of the stress of the coal seam floor along the strike direction under different advance distances can be obtained. Three rows of sensors are arranged along the strike direction of the working face. The first row is 20 m away from the air inlet roadway, the second row is in the center of the working face (80 m away from the air inlet roadway), and the third row is 20 m away from the return air roadway. The distance of each of the three rows of sensors entering the coal wall behind the open-off cut is 36 m, and the distance of the three rows of sensors entering the coal wall behind the stop line is 34 m. Figure 10 shows the distribution characteristics of vertical stress in the strike direction of the working face when advancing from the open-off cut to the working face to 200 m.
With the mining of the coal mining face, the abutment pressure shows dynamic change characteristics. Due to the influence of mining, the abutment pressure in front of the coal wall is constantly moving forward, and its influence range is divided into three areas with obvious changes. The first area is not affected by mining, which is located 70 m away from the front of the working face, and this area is relatively less affected by mining. The second area is the mining-affected area, which is located in the range of 20–70 m in front of the working face. The pinch abutment pressure in this area tends to decrease, and the floor sensor fluctuates obviously when the pressure arrives until the stress reaches a new state of balance and is stable. The third area is the area with severe mining influence, which is located in the range of 20 m from the working face itself to its front. The stress reduction area is formed 0~5 m in front of the working face. The peak stress moves forward about 8–11 m in front of the working face. This area is severely affected by mining. With the advancement of the working face, the stress sensor of the floor fluctuates violently, and the fluctuation time is long. With the advancement of the working face, the peak value of the partial stress concentration factor, the distance from the peak value to the working face, and the influence range of the advance abutment pressure are determined, as shown in Table 2.

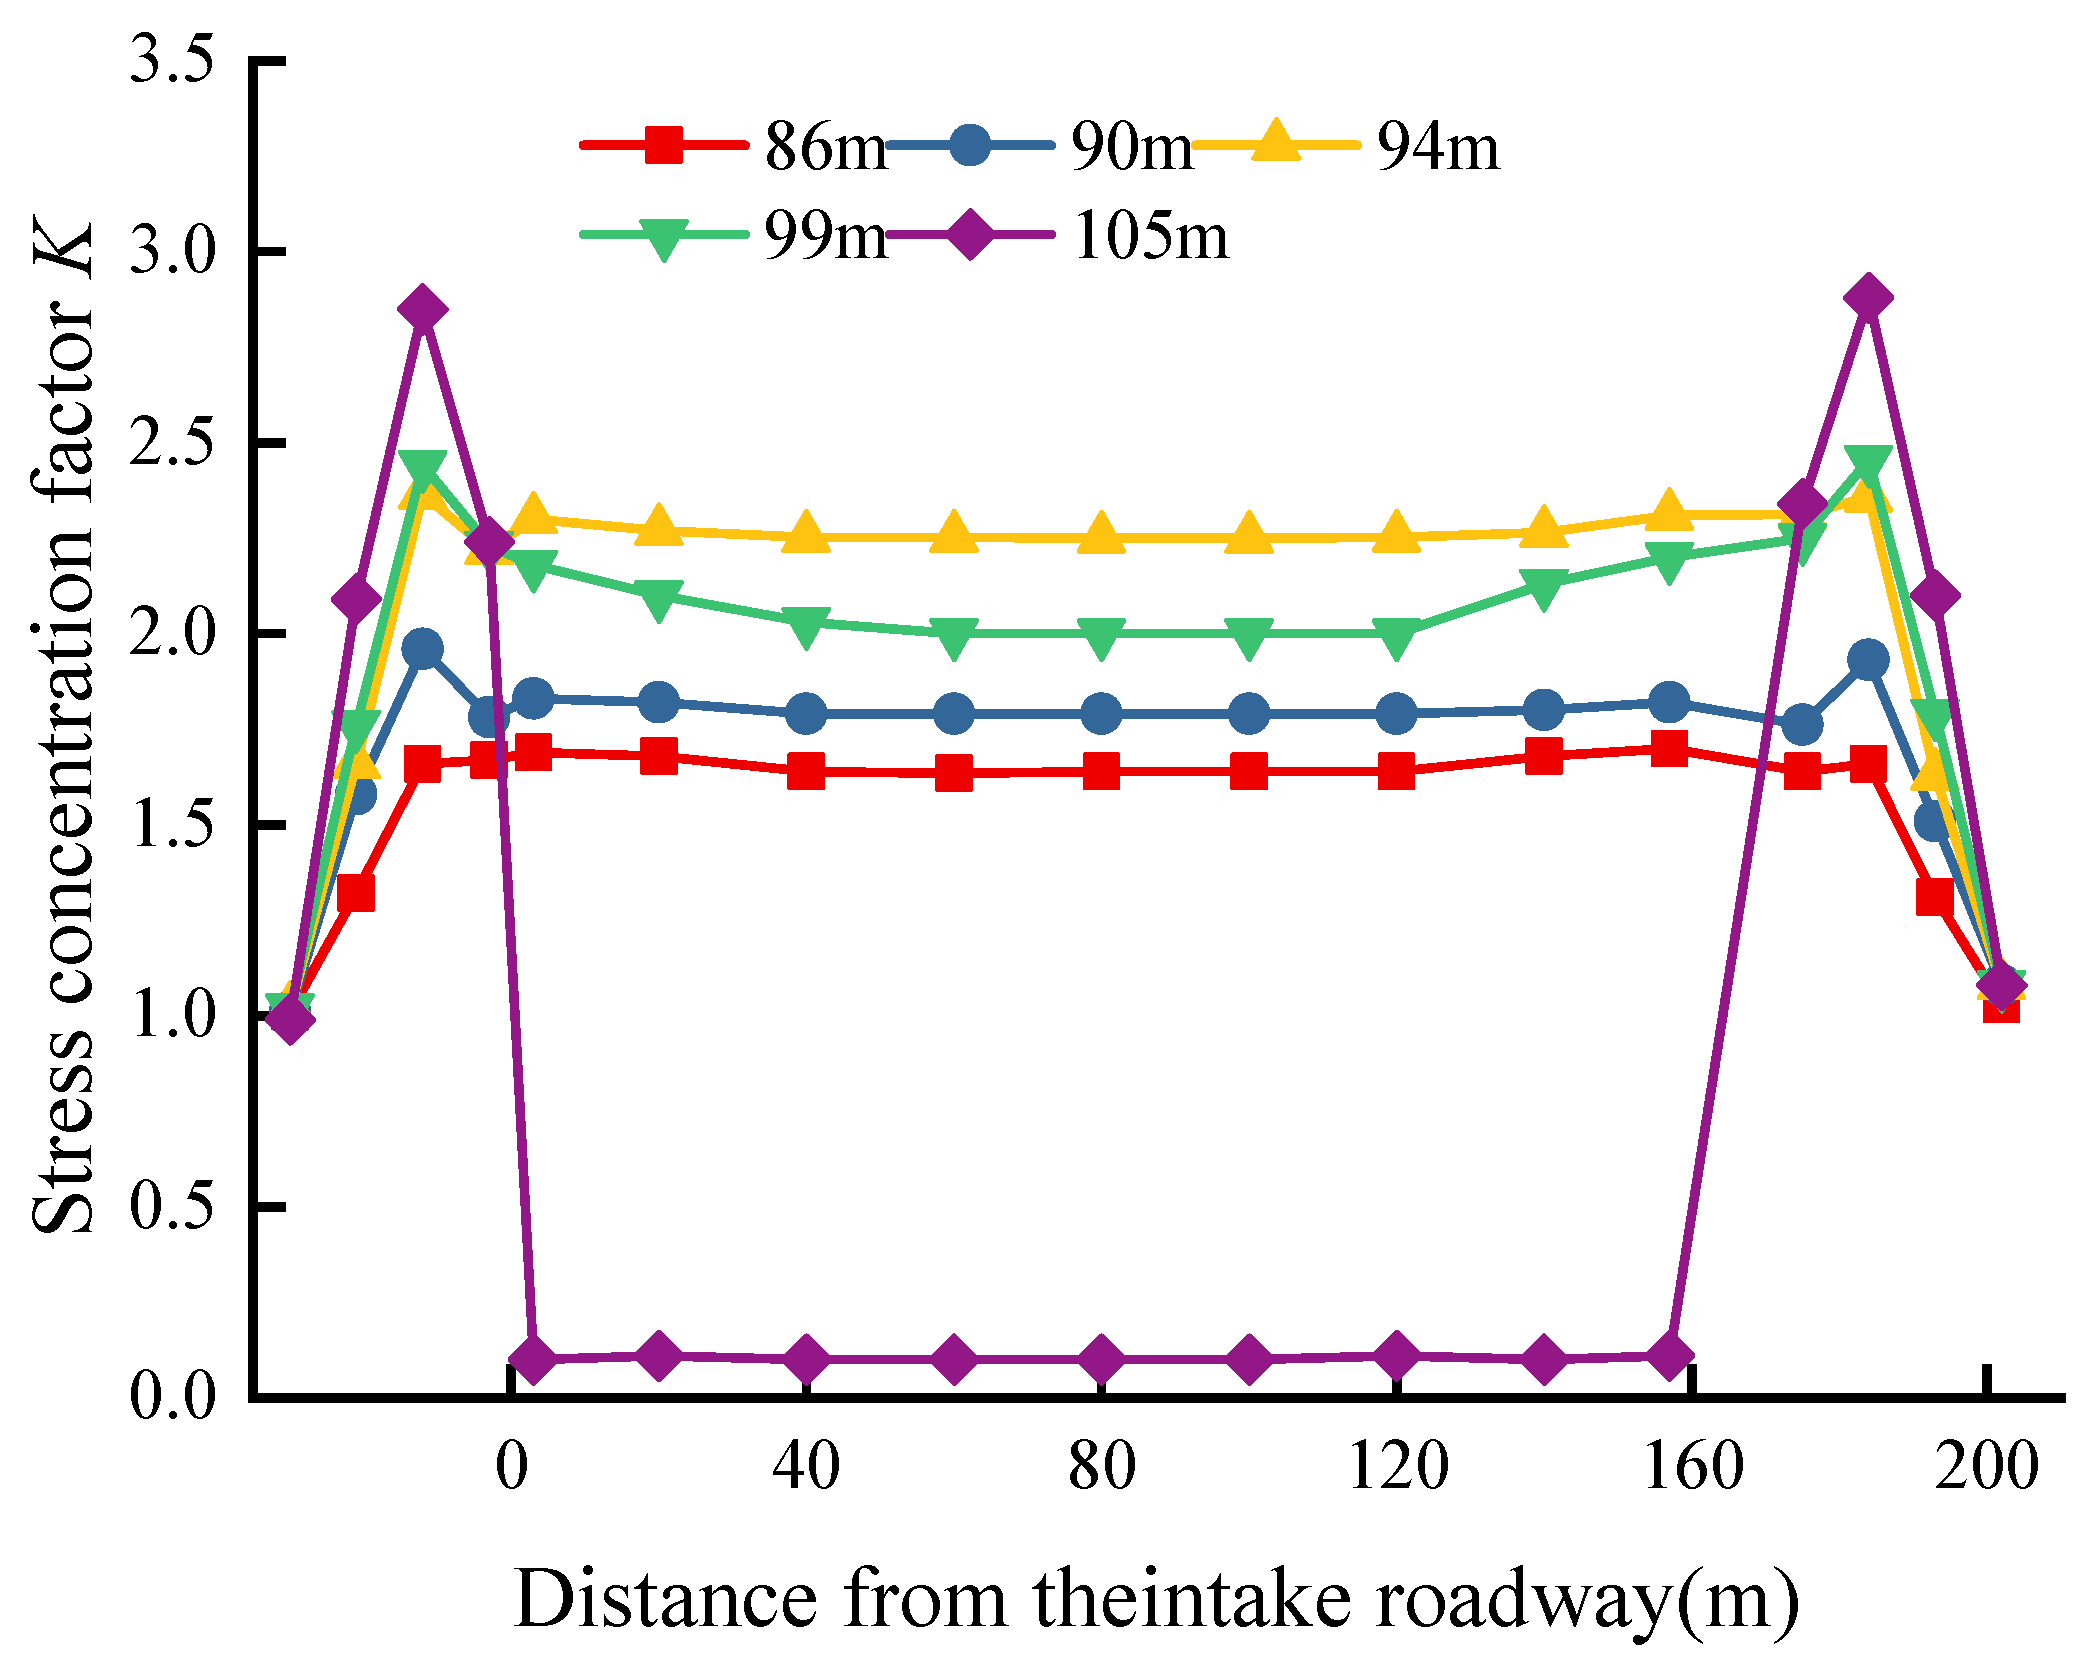
3.3.2. Tendency Direction Stress Distribution

Based on 17 sensors in two longitudinal columns (two longitudinal sensors are arranged 102 m from the open-off cut), the distribution of vertical stress in the inclined direction of the coal seam is analyzed when the working face advances from 86 m to 90 m, 94 m, 99 m, and 105 m. There is a longitudinal sensor on the air side of the coal wall to a depth of 30 m, and the interval is 9 m. The shallowest depth is 3 m from the coal wall, with a total of 4 sensors. In the coal seam in front of the working face at an interval of 20 m, there are a total of 9 sensors. On the return air side, the deepest coal wall is at a depth of 30 m, and the interval is 9 m. The shallowest distance from the coal wall is 3 m, with a total of 4 sensors. There are a total of 17 sensors in this column. Table 3 shows the stress concentration factor when the two longitudinal sensors are pushed 86–105 m from the working face.
The distribution of the stress concentration coefficient when the two longitudinal sensors are pushed 86–105 m away from the working face is shown in Figure 11.
According to Figure 11, in the stress unloading area, stress critical area, and stress concentration area along the coal seam, the bottom plate stress is high at both ends and low in the middle, and stress concentration is found in a certain area of the inlet and return airway. The stress concentration along the tendency direction exhibits a saddle shape. As can be seen from the above figure, the sensor buried in the coal wall 9 m away from the air inlet and return airway is located in the peak position. When the working face advances to 86 m, the region 102 m ahead of the longitudinal column of sensors is affected by the mining process. In the middle of the working face, the stress concentration coefficient is 1.64. The maximum stress concentration coefficient of the coal wall of the air inlet lane is 1.66. Moreover, the return airway in the coal wall has a stress concentration coefficient of 1.66. The stress peaks at the two ends are equal.
The working face advances to 90 m, the stress concentration coefficient in the middle of the working face increases to 1.79, the maximum stress concentration coefficient in the coal wall on the side of the inlet lane rises to 1.96, and the stress concentration coefficient on the side of the return air increases to 1.93. The stresses in the two ends of the working face show a trend of growth due to the superposition effect of the excavation of the roadway and the advancing work face. With the advancing of the working face, the peak of the stress in the coal wall shows a trend of gradual growth. With the advancement of the working face, the peak stress in the coal wall is gradually increasing, the stresses in the middle of the working face and at the two ends of the working face are also gradually increasing, and the stresses in the two ends of the working face are larger than that in the middle of the working face. The stresses in the two ends of the working face are greater than that in the center. Until the working face advances 105 m, sensors No. 4–13, which are arranged on the bars, are all unpressurized, and the stress concentration coefficient in the coal wall reaches the maximal peak value of 2.85/2.88. At this time, the stress is in a symmetric bimodal shape in the direction of the tendency. The sensitivity of the porosity of the coal rock body to the stress change in a high-stress state is low. In addition, the change in the permeability of the fissure is small, and the fissure is basically closed in a high-stress state. Therefore, in the stress concentration area, the gas in the coal rock is in a locked state; in the stress reduction area, it belongs to the active area of gas.

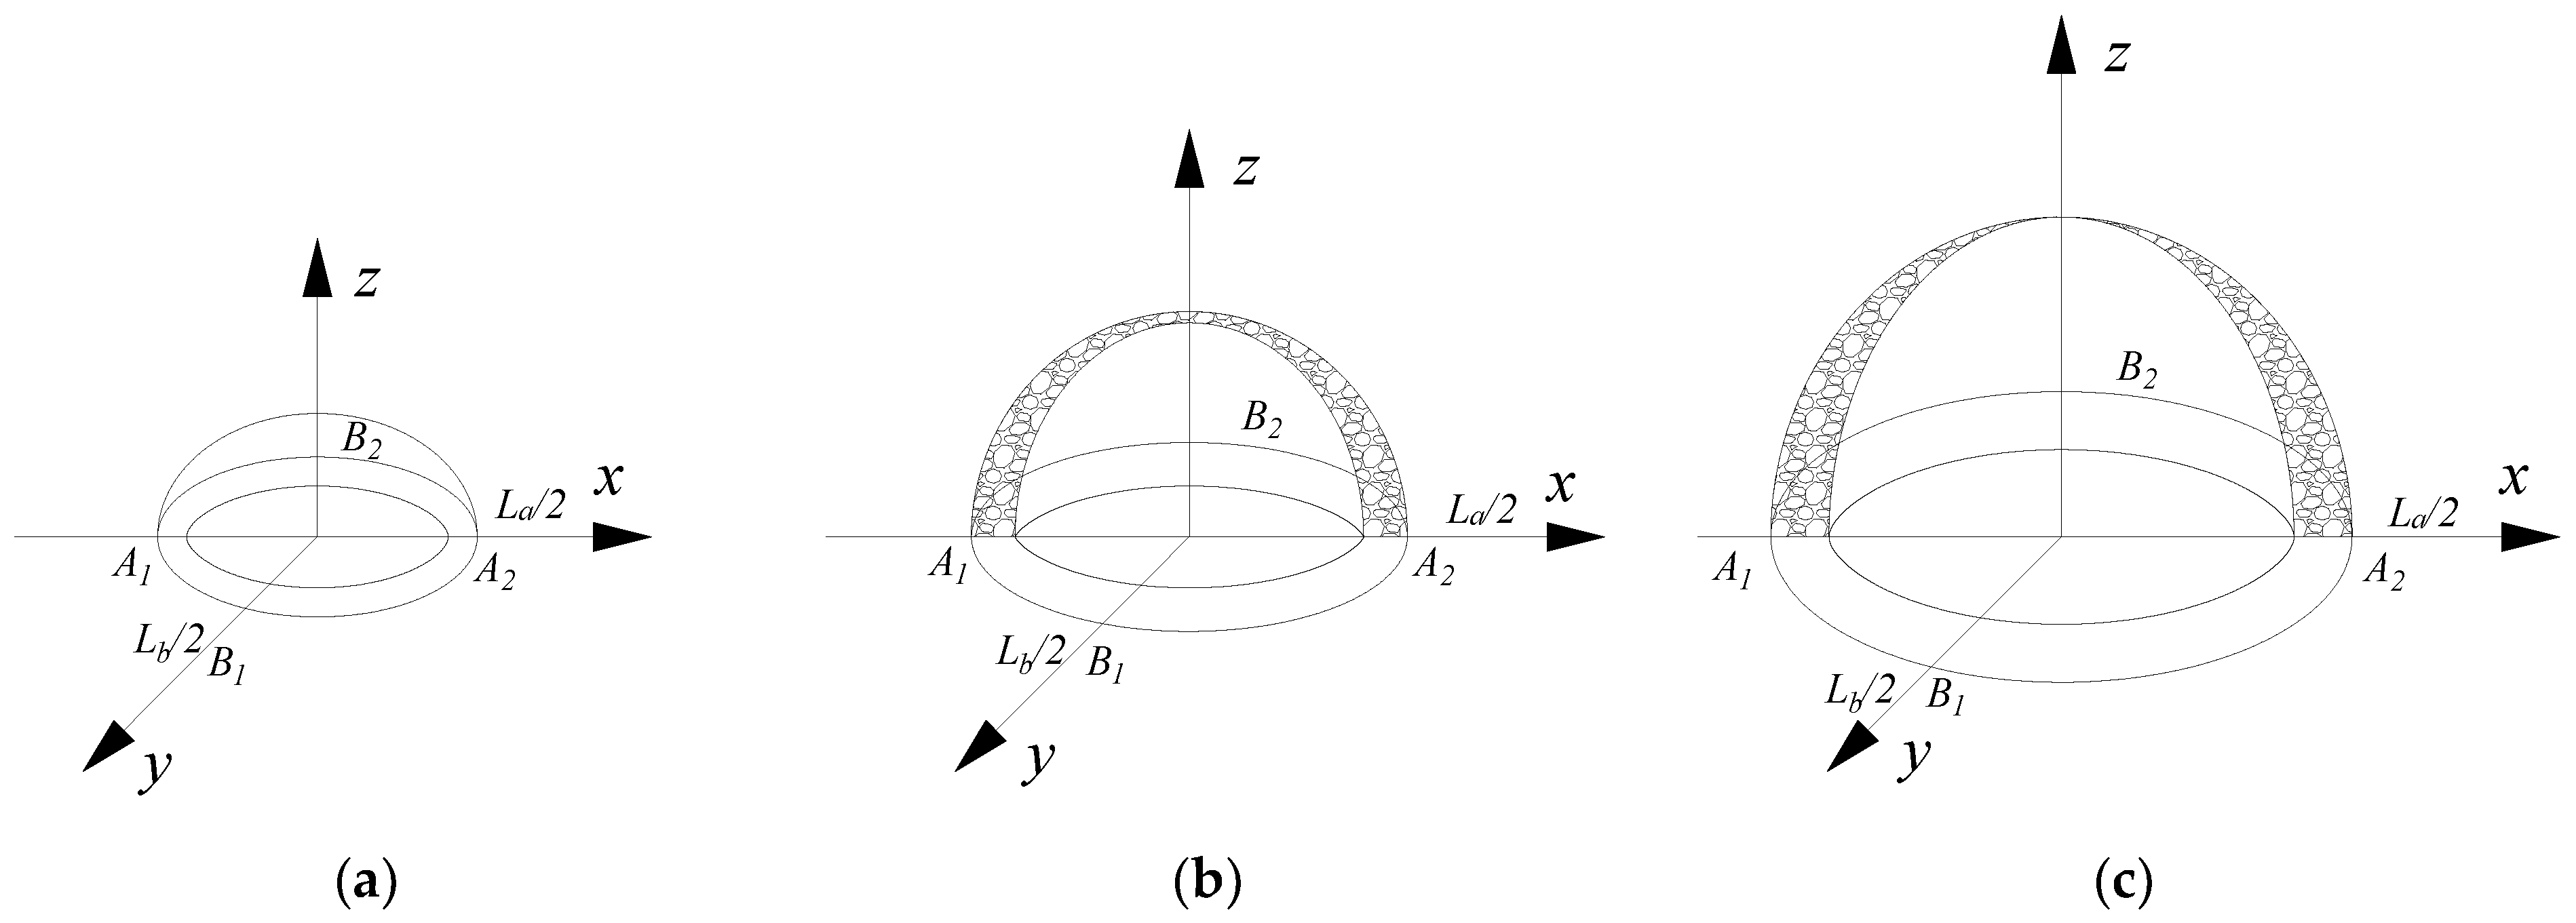
3.4. Morphological Model of the Gas Transport and Storage Channel

In the three-dimensional space of the quarry, the rock layer breaks through the fracture, and the rock layer level is separated from the layer to imprint each other. This process forms an external boundary similar to an elliptic paraboloid in the three-dimensional fracture network space; this is the external ellipsoid. When the working face is pushed a certain distance, the broken rock body in the middle of the air-mining zone is re-compacted, and the internal boundary basically presents an elliptic paraboloid shape, which is the inner ellipsoid. Thus, in the overlying rock layer of the whole mining zone, the mining fissure zone formed between the inner and outer ellipsoidal surfaces is called the ellipsoidal paraboloid zone, and it is also referred to as the ellipsoidal zone [40,41,42]. The formation morphologies of mining overburden rock fissures are affected by many factors, such as the formation process and the results of mining fissures in three-dimensional large-scale physical similarity simulation experiments. A mathematical model of the development of the advantageous channel for unpressurized gas transport and storage is established as shown in Figure 12.
In Figure 12, x represents the coal seam tendency, y represents the coal seam strike, and z represents the height of the overlying rock layer, thereby establishing the mathematical control model of the dominant channel for the transport of gas (Equation (1)).
( 2 x L a ) 2 L a 2 + 4 y 2 L b 2 = z m · F 1 Kc 1 · m · F 1 ( 2 L b y L a L b 2     ( A 1     A 2 ) 2     L b B 1 + L b B 2 + L a L b ) 2 ( L a L b 2     ( A 1 A 2 ) 2 L b B 1   L b B 2 ) 2 + 2 x L b A 1 + A 2 L b A 1   A 2 = z m · F 2 Kc 2 · m · F 2
where La is the width of the coal mining face, m; Lb is the distance of the coal mining face, m; Kc1 and Kc2 are the rock breakage and expansion coefficients of the outer and inner ellipsoidal surface; A1 and A2 are the width of the upper ellipsoidal zone of the cutting eye and the upper ellipsoidal zone of the working face, m; B1 and B2 are the width of the ellipsoidal zone in the inlet lane of the coal mining face and the return lane, m; m is the height of the working face, m; and F1 and F2 are the ratio of the height of the inner and outer ellipsoidal face to the mining height influenced by the mining height.
The fracture expansion coefficient is the property in which the volume of the rock increases after crushing relative to the whole state. The fracture expansion coefficient can be expressed as follows.
K 0 = V 1 V 0
where V1 is the volume of rock after crushing, m3, and V0 is the volume of rock without mining to destroy the original rock state, m3.
The ratio of the height of the inner/outer ellipsoids under the influence of the mining height to the mining height can be determined by Equation (3).
F 1 = P ln m + Q   F 2 = V ln m + W
where P is the pressure gradient, Q is the gas flow rate, V represents the volume of the fissure or storage channel, and W denotes the width or permeability of the channel.

4. Conclusions

In this paper, we utilized an advanced, independently developed, three-dimensional, large-scale physical simulation experiment platform to investigate gas transport and storage in a large-height comprehensive mining face of the Tianchi coal mine in Shanxi. The experiment platform was equipped with automated systems, and it allowed for the simultaneous simulation of coal seam mining, ventilation, stress distribution, fissure evolution, and gas migration. By constructing a geological prototype and employing a similarity ratio, we built a 3D physical similarity model and conducted a series of experiments to explore the complex behaviors of the overburden rock during mining operations. Through microseismic monitoring and physical model cutting, we analyzed both the evolution of fissures and the key parameters related to gas transport and storage. The main conclusions are as follows:
(1)
After model cutting about 65 m from the bottom of the coal seam, there is an off-layer, which is the top of the overburden rock fissure zone and the bottom of the bending and sinking zone. At 25 m from the bottom of the coal seam, the rock layer is more fragmented as the collapse zone, which is 4.8 times the mining height. At 25–65 m from the bottom of the coal seam, there is a fissure zone, which is 12.5 times the mining height, and the range of off-layer fissure is abundant at the top of the fissure zone.
(2)
When the coal face advances to 45 m, a large number of microseismic events occur, the concentration of microseismic events is more significant, and the distribution range of microseismic events in the direction of the coal seam strike and height is expanded. For every 20 m of face advancement, there is a large-scale concentration of microseismic events. When the face advances to 200 m, the concentration of microseismic events is about 65 m in height, and the maximum height distribution is about 113 m.
(3)
The overburden subsidence expands progressively from the top to the bottom of the rock layers. The subsidence slope area widens, while the central compaction zone remains relatively flat, forming an irregular elliptical shape. There is an uplift phenomenon at the periphery of the subsidence area. At 39 m from the coal seam base, the maximum subsidence measured is 4.0 m, with the subsidence decreasing higher up along the rock strata. The fissure density forms a double-hump pattern, with the highest density (up to 5 fissures per meter) occurring on both sides of the subsidence zone. In contrast, the compaction area has a lower fissure density, ranging from 1 to 2 fissures per meter.
(4)
Coal seam mining causes the redistribution of stress in the rock layer around the mining space. In front of the work face (0~5 m), a stress reduction zone is formed. Moreover, 20 m in front of the work face is the range of the dynamic impact area, 20~70 m in front of the work face is the range of the mining impact area, and 70 m in front of the work is the area outside the zone that is unaffected by mining. The coal rock porosity in the high-stress state has a lower sensitivity to stress changes. In high-stress zones, the coal–rock porosity exhibits lower sensitivity to stress changes, with minimal variations in fissure permeability.

Author Contributions

Conceptualization, S.L. and H.L.; methodology, P.X.; software, Y.D.; formal analysis, H.L.; data curation, Y.Y.; writing—original draft preparation, B.L.; writing—review and editing, Z.W; and funding acquisition, Z.W. All authors have read and agreed to the published version of the manuscript.

Funding

This research was funded by the National Natural Science Foundation of China (Grant Nos. 51704228 and 51704227).

Data Availability Statement

Data are contained within the article.

Conflicts of Interest

The authors declare no conflicts of interest.

References

  1. Lu, Y.Y.; Zhang, H.D.; Zhou, Z.; Ge, Z.L.; Chen, C.J.; Hou, Y.D.; Ye, M.L. Current Status and Effective Suggestions for Efficient Exploitation of Coalbed Methane in China: A Review. Energy Fuels 2021, 35, 9102–9123. [Google Scholar] [CrossRef]
  2. Yuan, L.; Zhang, P. Development status and prospect of geological guarantee technology for precise coal mining. Meitan Xuebao/J. China Coal Soc. 2019, 44, 2277–2284. [Google Scholar] [CrossRef]
  3. Li, S.; Zhang, J.; Lin, H.; Ding, Y.; Bai, Y.; Zhou, Y.; Zhu, B.; Dai, Z. Thoughts on the development path of coal and gas co-mining technology in dual carbon strategy. Meitan Kexue Jishu/Coal Sci. Technol. 2024, 52, 138–153. [Google Scholar] [CrossRef]
  4. Noack, K. Control of gas emissions in underground coal mines. Int. J. Coal Geol. 1998, 35, 57–82. [Google Scholar] [CrossRef]
  5. Lunarzewski, L.W. Gas emission prediction and recovery in underground coal mines. Int. J. Coal Geol. 1998, 35, 117–145. [Google Scholar] [CrossRef]
  6. Wang, S.; Liu, K.; Wang, S.; Liang, Y.; Tian, F. Three-dimensional stochastic distribution characteristics of void fraction in longwall mining-disturbed overburden. Bull. Eng. Geol. Environ. 2022, 81, 414. [Google Scholar] [CrossRef]
  7. Xia, B.; Luo, Y.; Pan, C.; Gong, T.; Hu, H.; Ji, K. Coalbed methane flow characteristics based on fractal geometry and stochastic rough fracture network. Energy Sources Part A Recover. Util. Environ. Eff. 2021, 1–19. [Google Scholar] [CrossRef]
  8. Biały, W.; Prostański, D.; Bołoz, Ł. Selection of longwall shearers based on the results of research on the mechanical properties of coal. Sci. Rep. 2024, 14, 18606. [Google Scholar] [CrossRef]
  9. Szlązak, N.; Borowski, M.; Obracaj, D.; Swolkień, J.; Korzec, M. Comparison of methane drainage methods used in polish coal mines. Arch. Min. Sci. 2014, 59, 655–675. [Google Scholar] [CrossRef]
  10. Feng, G.; Wang, S.; Guo, Y.; Zhang, Y.; Bai, J.; Niu, L.; Du, Y. Optimum position of roadway in the middle residual coal seam between the upper and lower longwall gobs. Energy Sources Part A Recover. Util. Environ. Eff. 2021, 1–17. [Google Scholar] [CrossRef]
  11. Jia, H.; Wang, K.; Xu, C.; Fu, Q. Permeability distribution characteristics of underlying coal seam disturbed by mining activity. Energy Sources Part A Recover. Util. Environ. Eff. 2022, 44, 5032–5047. [Google Scholar] [CrossRef]
  12. Zhuo, R.; Zhao, P.; Li, S.; Liu, H.; Lu, W.; Lin, H.; Jin, S.; Jin, Q.; Lei, W.; Wu, J. Experimental study on the determination method of pressure relief gas transportation and storage channel under multiple factors. Environ. Earth Sci. 2024, 83, 386. [Google Scholar] [CrossRef]
  13. Li, X.; Yin, G. Gas migration model based on overburden strata fracture evolution law in three dimensional mine-induced stress conditions. IOP Conf. Ser. Earth Environ. Sci. 2017, 61, 012005. [Google Scholar] [CrossRef]
  14. Krishnamurthy, N.S.; Rao, V.A.; Kumar, D.; Singh, K.K.K.; Ahmed, S. Electrical Resistivity Imaging technique to delineate coal seam barrier thickness and demarcate water filled voids. J. Geol. Soc. India 2009, 73, 639–650. [Google Scholar] [CrossRef]
  15. Karacan, C.Ö.; Esterhuizen, G.S.; Schatzel, S.J.; Diamond, W.P. Reservoir simulation-based modeling for characterizing longwall methane emissions and gob gas venthole production. Int. J. Coal Geol. 2007, 71, 225–245. [Google Scholar] [CrossRef]
  16. Khodot, V.V. Role of methane in the stress state of a coal seam. Sov. Min. Sci. 1980, 16, 460–466. [Google Scholar] [CrossRef]
  17. Majdi, A.; Hassani, F.P.; Nasiri, M.Y. Prediction of the height of destressed zone above the mined panel roof in longwall coal mining. Int. J. Coal Geol. 2012, 98, 62–72. [Google Scholar] [CrossRef]
  18. Sobczyk, J. A comparison of the influence of adsorbed gases on gas stresses leading to coal and gas outburst. Fuel 2014, 115, 288–294. [Google Scholar] [CrossRef]
  19. Karacan, C.Ö.; Ruiz, F.A.; Cotè, M.; Phipps, S. Coal mine methane: A review of capture and utilization practices with benefits to mining safety and to greenhouse gas reduction. Int. J. Coal Geol. 2011, 86, 121–156. [Google Scholar] [CrossRef]
  20. Cheng, Y.; Pan, Z. Reservoir properties of Chinese tectonic coal: A review. Fuel 2020, 260, 116350. [Google Scholar] [CrossRef]
  21. Zhou, S. Mechanism of gas flow in coal seams. Mei T’an Hsueh Pao (J. China Coal Soc.) 1990, 15, 15–24. [Google Scholar]
  22. Somerton, W.H.; Söylemezoglu, I.M.; Dudley, R.C. Effect of stress on permeability of coal. Int. J. Rock Mech. Min. Sci. 1975, 12, 129–145. [Google Scholar] [CrossRef]
  23. Changwu, L.; Jian, Y. Research on main design parameters of three- dimensional mining physical simulation test equipment. Rock Soil Mech. 2003, 24, 325–328. [Google Scholar] [CrossRef]
  24. Yin, G.; Li, X.; Lu, J.; Li, M. Disaster-causing mechanism of compound dynamic disaster in deep mining under static and dynamic load conditions. Meitan Xuebao/J. China Coal Soc. 2017, 42, 2316–2326. [Google Scholar] [CrossRef]
  25. Yin, G.Z.; Li, X.; Han, P.B.; Li, M.H.; Li, W.P.; Deng, B.Z. Experimental study on overburden strata fracture evolution law in three dimensional mine-induced stress conditions. Meitan Xuebao/J. China Coal Soc. 2016, 41, 406–413. [Google Scholar] [CrossRef]
  26. Vu, T.T. Solutions to prevent face spall and roof falling in fully mechanized longwall at underground mines, Vietnam. Min. Miner. Depos. 2022, 16, 127–134. [Google Scholar] [CrossRef]
  27. Vu, T.T.; Pham, H.D. Influence of Underground Mining Activities on the Topographic Surface, Case Study of Nui Beo Coal Mine (Vietnam). Nauk. Visn. Nat. Hirn. Univ. 2023, 33–39. [Google Scholar] [CrossRef]
  28. Jiang, Y.; Liu, W.; Zhao, Y. Design and development of a new type of triaxial system for roadway model test. Yanshilixue Yu Gongcheng Xuebao/Chin. J. Rock Mech. Eng. 2004, 23, 3727–3731. [Google Scholar]
  29. Kang, J.; Wang, J. Analysis of dynamic subsidence of mining overburden strata. J. Taiyuan Univ. Technol. 2000, 31, 364–366. [Google Scholar]
  30. Shi, P.W.; Zhang, Y.Z. Structural analysis of arch of spanning strata of top coal caving in steep seam. Yanshilixue Yu Gongcheng Xuebao/Chin. J. Rock Mech. Eng. 2006, 25, 79–82. [Google Scholar]
  31. Lai, X.P.; Wu, Y.P.; Cao, J.T.; Fan, Y.N.; Zhang, Y.L.; Cui, F. Experiment on rock-mass deformation of large scale 3D-simulation in complex environment. Meitan Xuebao/J. China Coal Soc. 2010, 35, 31–36. [Google Scholar]
  32. Yang, K.; Liu, W.J.; Jiao, B.; Zhang, Q.H.; Liu, S.; Zhang, Z.N. Three-dimensional physical simulation of overburden migration in deep thick hard roof fully-mechanized caving mining. Yantu Gongcheng Xuebao/Chin. J. Geotech. Eng. 2021, 43, 85–93. [Google Scholar] [CrossRef]
  33. Ye, Q.; Wang, G.; Jia, Z.; Zheng, C.; Wang, W. Similarity simulation of mining-crack-evolution characteristics of overburden strata in deep coal mining with large dip. J. Pet. Sci. Eng. 2018, 165, 477–487. [Google Scholar] [CrossRef]
  34. Li, X.; He, W.; Xu, Z. Study on Law of Overlying Strata Breakage and Migration in Downward Mining of Extremely Close Coal Seams by Physical Similarity Simulation. Adv. Civ. Eng. 2020, 2020, 2898971. [Google Scholar] [CrossRef]
  35. Wen, Z.; Xing, E.; Shi, S.; Jiang, Y. Overlying strata structural modeling and support applicability analysis for large mining-height stopes. J. Loss Prev. Process Ind. 2019, 57, 94–100. [Google Scholar] [CrossRef]
  36. Li, S.; Wei, Z.; Lin, H.; Zhao, P.; Xiao, P.; Hao, Y. Research and development of 3D large-scale physical simulation experimental system for coal and gas co-extraction and its application. Meitan Xuebao/J. China Coal Soc. 2019, 44, 236–245. [Google Scholar] [CrossRef]
  37. Wei, Z.; Li, S.; Lin, H. Three-dimensional experimental study on evolution characteristics of overburden fractures in fully mechanized mining with large mining height. Xi’an Univ. Sci. Technol. 2020, 40, 589–598. [Google Scholar]
  38. Li, S.; Yang, E.; Lin, H.; Zhao, P. Construction and practice of precise gas drainage system for pressure relief gas in deep mining. Meitan Kexue Jishu/Coal Sci. Technol. 2021, 49, 1–10. [Google Scholar] [CrossRef]
  39. Lin, H.; Yang, E.; Xia, B.; Li, S.; Zhao, P.; Kong, X.; Qin, L. Directional drilling replacing tailgate gas drainage technology in gassy fully-mechanized coal mining face. Meitan Kexue Jishu/Coal Sci. Technol. 2020, 48, 136–143. [Google Scholar] [CrossRef]
  40. Li, S.; Ding, Y.; An, Z.; Li, H.; Wei, X. Experimental research on the shape and dynamic evolution of repeated mining-induced fractures in short-distance coal seams. Caikuang Yu Anquan Gongcheng Xuebao/J. Min. Saf. Eng. 2016, 33, 904–910. [Google Scholar] [CrossRef]
  41. Lin, H.F.; Li, S.G.; Cheng, L.H.; Wang, H.S. Experimental analysis of dynamic evolution model of mining-induced fissure zone in overlying strata. Caikuang Yu Anquan Gongcheng Xuebao/J. Min. Saf. Eng. 2011, 28, 298–303. [Google Scholar]
  42. Ding, Y.; Zhu, B.; Li, S.; Lin, H.; Wei, Z.; Li, L.; Long, H.; Yi, Y. Accurate identification and efficient drainage of relieved methane in goaf of high outburst mine. Meitan Xuebao/J. China Coal Soc. 2021, 46, 3565–3577. [Google Scholar] [CrossRef]
Figure 1. 302 working face layout diagram.
Processes 12 02087 g001
Figure 2. Model-making process.
Processes 12 02087 g002
Figure 3. Layout of stress sensor.
Processes 12 02087 g003
Figure 4. Arrangement of high-frequency microseismic sensors. (a) Three-dimensional space layout of microseismic sensor. (b) Top view of microseismic sensor layout. (c) Microseismic sensor coal seam strike layout diagram. (d) Microseismic sensor coal seam tendency.
Processes 12 02087 g004aProcesses 12 02087 g004b
Figure 5. Three-zone morphology distribution of overburden fissure. (a) Three-dimensional overburden; (b) Strike overburden.
Processes 12 02087 g005
Figure 6. Spatial distribution of microseismic events within 200 m of working face advancing: (a) 21 m; (b) 45 m; (c) 64 m; (d) 81 m; and (e) 200 m.
Processes 12 02087 g006
Figure 7. Coal seam mining overlying strata subsidence range and subsidence amount: (a) 150 m; (b) 130 m; (c) 120 m; (d) 88 m; (e) 72 m; (f) 64 m; (g) 60 m; (h) 53 m; and (i) 39 m.
Processes 12 02087 g007aProcesses 12 02087 g007b
Figure 8. Coal seam mining of overlying strata subsidence. (a) Inclined strata subsidence. (b) Sinking amount of strike rock stratum.
Processes 12 02087 g008
Figure 9. Distribution of fracture density in mining strata. (a) Trend of fracture density distribution and (b) tendency of fracture density distribution.
Processes 12 02087 g009
Figure 10. Vertical stresses under different propulsion distances: (a) 0–30 m; (b) 34–60 m; (c) 64–90 m; (d) 94–120 m; (e) 124–150 m; (f) 154–180 m; and (g) 180–200 m.
Processes 12 02087 g010aProcesses 12 02087 g010b
Figure 11. Stress distribution in the inclined direction of the working face.
Processes 12 02087 g011
Figure 12. Mathematical model of the gas transport and storage channel shape. (a) Initial formation. (b) Evolutionary process. (c) Late state.
Processes 12 02087 g012
Table 1. Ratios of similar materials of each lithology in the experimental model.
Serial NumberRock Stratum NameMatchingContent (%)
CementStarchSandCementStarch
1Coal50:11094.8711.9031.613
2Aluminum mudstone50:13089.0911.8194.545
3Mudstone40:12091.4832.2673.125
4Sandy mudstone20:13086.5924.3184.545
5Silt sandstone20:15081.6434.0717.143
6Fine sandstone10:13082.6528.2584.545
7Limestone (key stratum)10:15077.9287.7867.143
Table 2. Stress concentration factor along the strike direction.
NumberFace Advanced Distance (L/m)Influence Range of the
Advance Abutment Pressure (m)
Distance Between the Peak Stress and the Working Face (Lk/m)Peak Stress
Concentration Factor (Kmax)
1344782.1
2564962.16
3757192.3
4947192.26
51166862.43
61356562.35
71596382.45
817165112.63
Kmax is the peak value of stress concentration coefficient. Lk is the distance between the stress concentration factor and the coal wall, m.
Table 3. Stress concentration factor of two longitudinal sensors.
Sensor
Station
Sensor
Serial
Number
Distance to Air Inlet (m)Stress Concentration Factor K
Advancing
86 m
Advancing
90 m
Advancing
94 m
Advancing
99 m
Advancing
105 m
Inlet side of the coal wall1−301.011.011.0191.0190.99
2−211.321.581.661.762.09
3−121.661.962.3652.4412.85
4−31.671.7822.222.232.24
Working face end531.691.832.32.180.1
Working face middle9801.641.792.2520.1
Working face end131571.71.822.312.20.11
Return air side of the coal wall141751.641.7622.3122.252.34
151841.661.9322.3572.4552.88
161931.311.511.631.792.1
172021.031.081.081.081.08
Disclaimer/Publisher’s Note: The statements, opinions and data contained in all publications are solely those of the individual author(s) and contributor(s) and not of MDPI and/or the editor(s). MDPI and/or the editor(s) disclaim responsibility for any injury to people or property resulting from any ideas, methods, instructions or products referred to in the content.

