Article

Study on the Accumulation Model of the Cretaceous Reservoir in AHDEB Oilfield, Iraq

Geologic Exploration & Development Research Institute of Chuanqing Drilling Engineering Co., Ltd., CNPC, Chengdu 610051, China
*
Authors to whom correspondence should be addressed.
Processes 2024, 12(10), 2135; https://doi.org/10.3390/pr12102135
Submission received: 6 June 2024 / Revised: 16 July 2024 / Accepted: 1 August 2024 / Published: 1 October 2024

Abstract

:
The Ahdeb oil field is located in the southwestern part of the Zagros fold deformation zone. The study of the model of the formation of the oil reservoir in this field will be helpful to deepen the pattern of hydrocarbon distribution in this zone. In this paper, we use the seismic data of the Ahdeb oil field to recover the tectonic evolution history of the field. Under neotectonic movement, the oil field formed in the early stage, migrated to the high point in the late stage, and finally entered the present formation. From here, for the oil-bearing inclusions within the reservoir, the photometric absorption values of the organic matter groups were measured by infrared spectroscopy. Their ratios were used to evaluate the maturity, thus discovering two phases of oil charging. Finally, using the hydrocarbon generation history and tectonic evolution history, combined with the oil and gas transportation periods in the reservoir, we deduce that the reservoir formation mode in the area is a two-phase gathering and final adjustment formation mode. This understanding of the hydrocarbon formation patterns will promote oil and gas exploration in this zone.

1. Introduction

The AHDEB field is located in the southwestern part of the Zagros fold-deformation zone, tectonically located in the Mesopotamian belt [1]. The target formations are mainly Cretaceous and Tertiary reservoirs with the deepest burials, large sediment thickness, and relative tectonic stability. The stratigraphy and sedimentation throughout the Cretaceous were determined by rift drift, uplift stages and structures associated with the Indo-Madagascar Seychelles-Australian Antarctica, Indo-Madagascar Seychelles-Africa, and Indo-Seychelles-Madagascar separation, northward movement of India, hot spot volcanism, and the initial partial collision between India and the Kohisan Island Arc. The study area is located in the northwestern part of the Pakistan Block, that was subjected to sedimentation of lithostratigraphic units to non-deposition of Cretaceous sediments, in the SR, and/or missing from the Kawagarh formation, in the SG and KT [2,3,4]. The burial depth of the Ahdeb reservoir is about 2500~2800 m, the ground temperature gradient is 2.26 °C/100 m, which is slightly lower than the normal formation temperature gradient, and the reservoir pressure coefficient is 1.12~1.14, which is a normal pressure reservoir system.
The specific gravity of the surface crude oil in the reservoir is distributed from 0.867 to 0.981 g/cm3, and the main body is 0.884 to 0.94 g/cm3, which is a medium quality crude oil. The average density is 0.931 g/cm3 at the southeast high point, 0.919 g/cm3 at the central high point, and 0.895 g/cm3 at the northwest high point. The viscosity variation also has similar characteristics, i.e., the average viscosity of the southeastern crude oil at 80 °C is 38.37 cP, that of the central crude oil is 9.91 cP, and that of the northwestern crude oil is 5.97 cP. The asphaltene content also reflects a high content in the southeast, with the asphaltene content mainly distributed in the range of 5.3% to 10.7%, with an average of 7.2%; the central crude oil is the next highest, with the asphaltene content distributed around 1.21. The asphaltene content in the northwest was the lowest, ranging from 0.39% to 2.89%, with an average of 2.6%. The Mesopotamian belt is the main reservoir distribution zone in Iraq [5]. The burial rate in the central and southern part of Iraq was relatively slow during most of the geological periods and began to enter a rapid burial period at around 18 Ma. The Early Cretaceous strata were buried until around 15 Ma of the Middle Miocene, and the TTI index reached more than 15, while the TTI index of the Middle Cretaceous strata reached 15 only at around 10 Ma.
The main hydrocarbon source rocks in the Mesopotamian belt of central Iraq are the type III caseagenic hydrocarbon source rocks of the Zubair Formation, the type III caseagenic hydrocarbon source rocks of the Ratawi Formation, the type II caseagenic hydrocarbon source rocks of the Yamama Formation, and the type II caseagenic hydrocarbon source rocks of the Sulaiy/Chia Gara Formation. It is shown that neither the Zubair Formation nor the Ratawi Formation had entered the peak hydrocarbon production stage, and the hydrocarbon production capacity is not strong, only localized. The Yamama Formation and the Sulaiy/Chia Gara Formation have entered the hydrocarbon production stage. The Sulaiy/Chia Gara Formation is more evolved and has entered the high maturity stage. By using the distribution characteristics of source rock extracts, the distribution of C27, C28, and C29 cholestanes in biomarker compounds, and the comparative study of geochemical parameters such as the content of pregnane, it can be found that the crude oil of Ahdeb oil field mainly came from the hydrocarbon source rocks of the Upper Jurassic Chia Gara Formation. According to the thermal history diagram of the East Baghdad Oilfield reported by Al-Ameri, it can be known that the paleotemperature of the Chia Gara Formation in this area had reached 100–120 °C in the Late Cretaceous, and entered the rapid burial period at around 18 Ma of the Middle Miocene. The paleotemperature of the Chia Gara Formation could reach 120–140 °C, and the organic matter also rapidly entered the hydrocarbon generation peak period from the early low-maturity state [4,5,6].
In this paper, a detailed analysis of the reservoir formation process is presented in the Ahdeb oil field in the central region based on previous studies and the reservoir formation model of the Ahdeb oil field is established [7,8]. This paper deepens the understanding of the hydrocarbon distribution pattern of this zone. The results of this study will be effective in promoting the deepening of exploration and evaluation studies in this area (Figure 1).

2. Materials and Methods

2.1. Horizon-Flattening Technique in Seismic Interpretation

The strata flattening method for paleogeomorphic restoration has developed based on the theory of sequence stratigraphy on the premise of the continuous improvement of current geophysical exploration technologies and data [10,11]. Its basic principle is that the distribution of sedimentary systems is doubly controlled by the paleogeomorphic morphology and the rise and fall of the base level. The strata flattening method assumes that the sedimentary thickness of the original stratum does not change due to compaction. Then, in the three-dimensional seismic data volume, the sedimentary base level or the maximum flooding surface is regarded as the reference datum to select the top and bottom surfaces of the studied sequence and to calculate the time difference of the top and bottom surfaces. That is to flatten the top surface. The flattened top surface is the sea plane during the original sedimentation, and the morphology of the bottom surface is the relative paleogeomorphology of the sedimentation of this sequence stratum. The main method is to flatten the seismic reflection horizon corresponding to a certain sedimentary marker bed and use the underlying strata to examine the paleotectonic morphology of the strata to reflect the paleogeomorphic characteristics of a certain period.
The specific method is to use a certain pick-up horizon as a fixed datum surface, and vertical displacement of seismic data, to generate new interpretation data [9]. The original data is set as input function f (x, y, t), and the sample points of the data body are vertically shifted and reordered, and the new data body generated is
g (x, y, T) = f [x, y, t − t0].
where x is the horizontal direction coordinate of the original time-domain data; Y is the ordinate of the original time-domain data; t is the bidirectional propagation time of the original time-domain data volume; T is the fixed value of the selected benchmark for horizontal flattening when the time-domain data body moves in two directions; and t0 is the fixed value for horizontal flattening.

2.2. Analysis of Fluid Inclusion Properties

In this study, through fluorescence observation of liquid hydrocarbon inclusions, Fourier infrared spectroscopy detection of oil inclusions, homogenization temperature measurement of inclusions, and asphalt observation, the oil–gas charging periods of Khasib, Mishrif, Rumaila, and Mauddud groups in Ahdab area were studied.
Fluid inclusions record the properties, components, physicochemical conditions and geodynamic conditions of hydrocarbon fluids and pore water. Comparative studies on the characteristics, types, components, and abundance of fluid inclusions in reservoirs can determine the time, depth, migration phase, direction, and channel of hydrocarbons, which can be seen in the history of oil and gas migration [12,13]. The study of hydrocarbon accumulation history provides the most direct and reliable geological information. In recent years, inclusion homogenization temperature is an important basis for studying the time and stage of oil–gas accumulation. Usually, the homogenization temperature of reservoir fluid inclusions in the study area is determined first, and then the time of oil and gas migration and the period of accumulation are determined comprehensively by combining the analysis of burial history and thermal evolution history [14,15].
The fluorescence characteristics of liquid organic inclusions reflect the composition characteristics and thermal evolution degree of organic matter [16]. Liquid hydrocarbons are mainly composed of saturated hydrocarbons and aromatic hydrocarbons, and the generation of fluorescence mainly depends on the conjugated π bond system of aromatic hydrocarbons and the C=O functional group in liquid hydrocarbons, so the fluorescence characteristics of liquid hydrocarbons are related to the composition and structure of aromatic hydrocarbons, but not to saturated hydrocarbons [17,18,19]. Traditional experimental results suggest that the fluorescence color of liquid hydrocarbons can reflect the evolution degree of organic matter, that is, with the evolution of organic matter from low maturity to high maturity, its fluorescence color changes from fiery red to yellow to orange to blue to blue-white [19,20,21]; It is believed that as oil quality changes from heavy to light, the fluorescence color of oil inclusions changes from brown to orange-yellow to light yellow to blue to blue-white [22]. This method of maturity division based solely on the color of oil inclusions has great limitations, and a large number of studies have reported that the division of maturity by color is not reliable [23,24,25].

3. Results

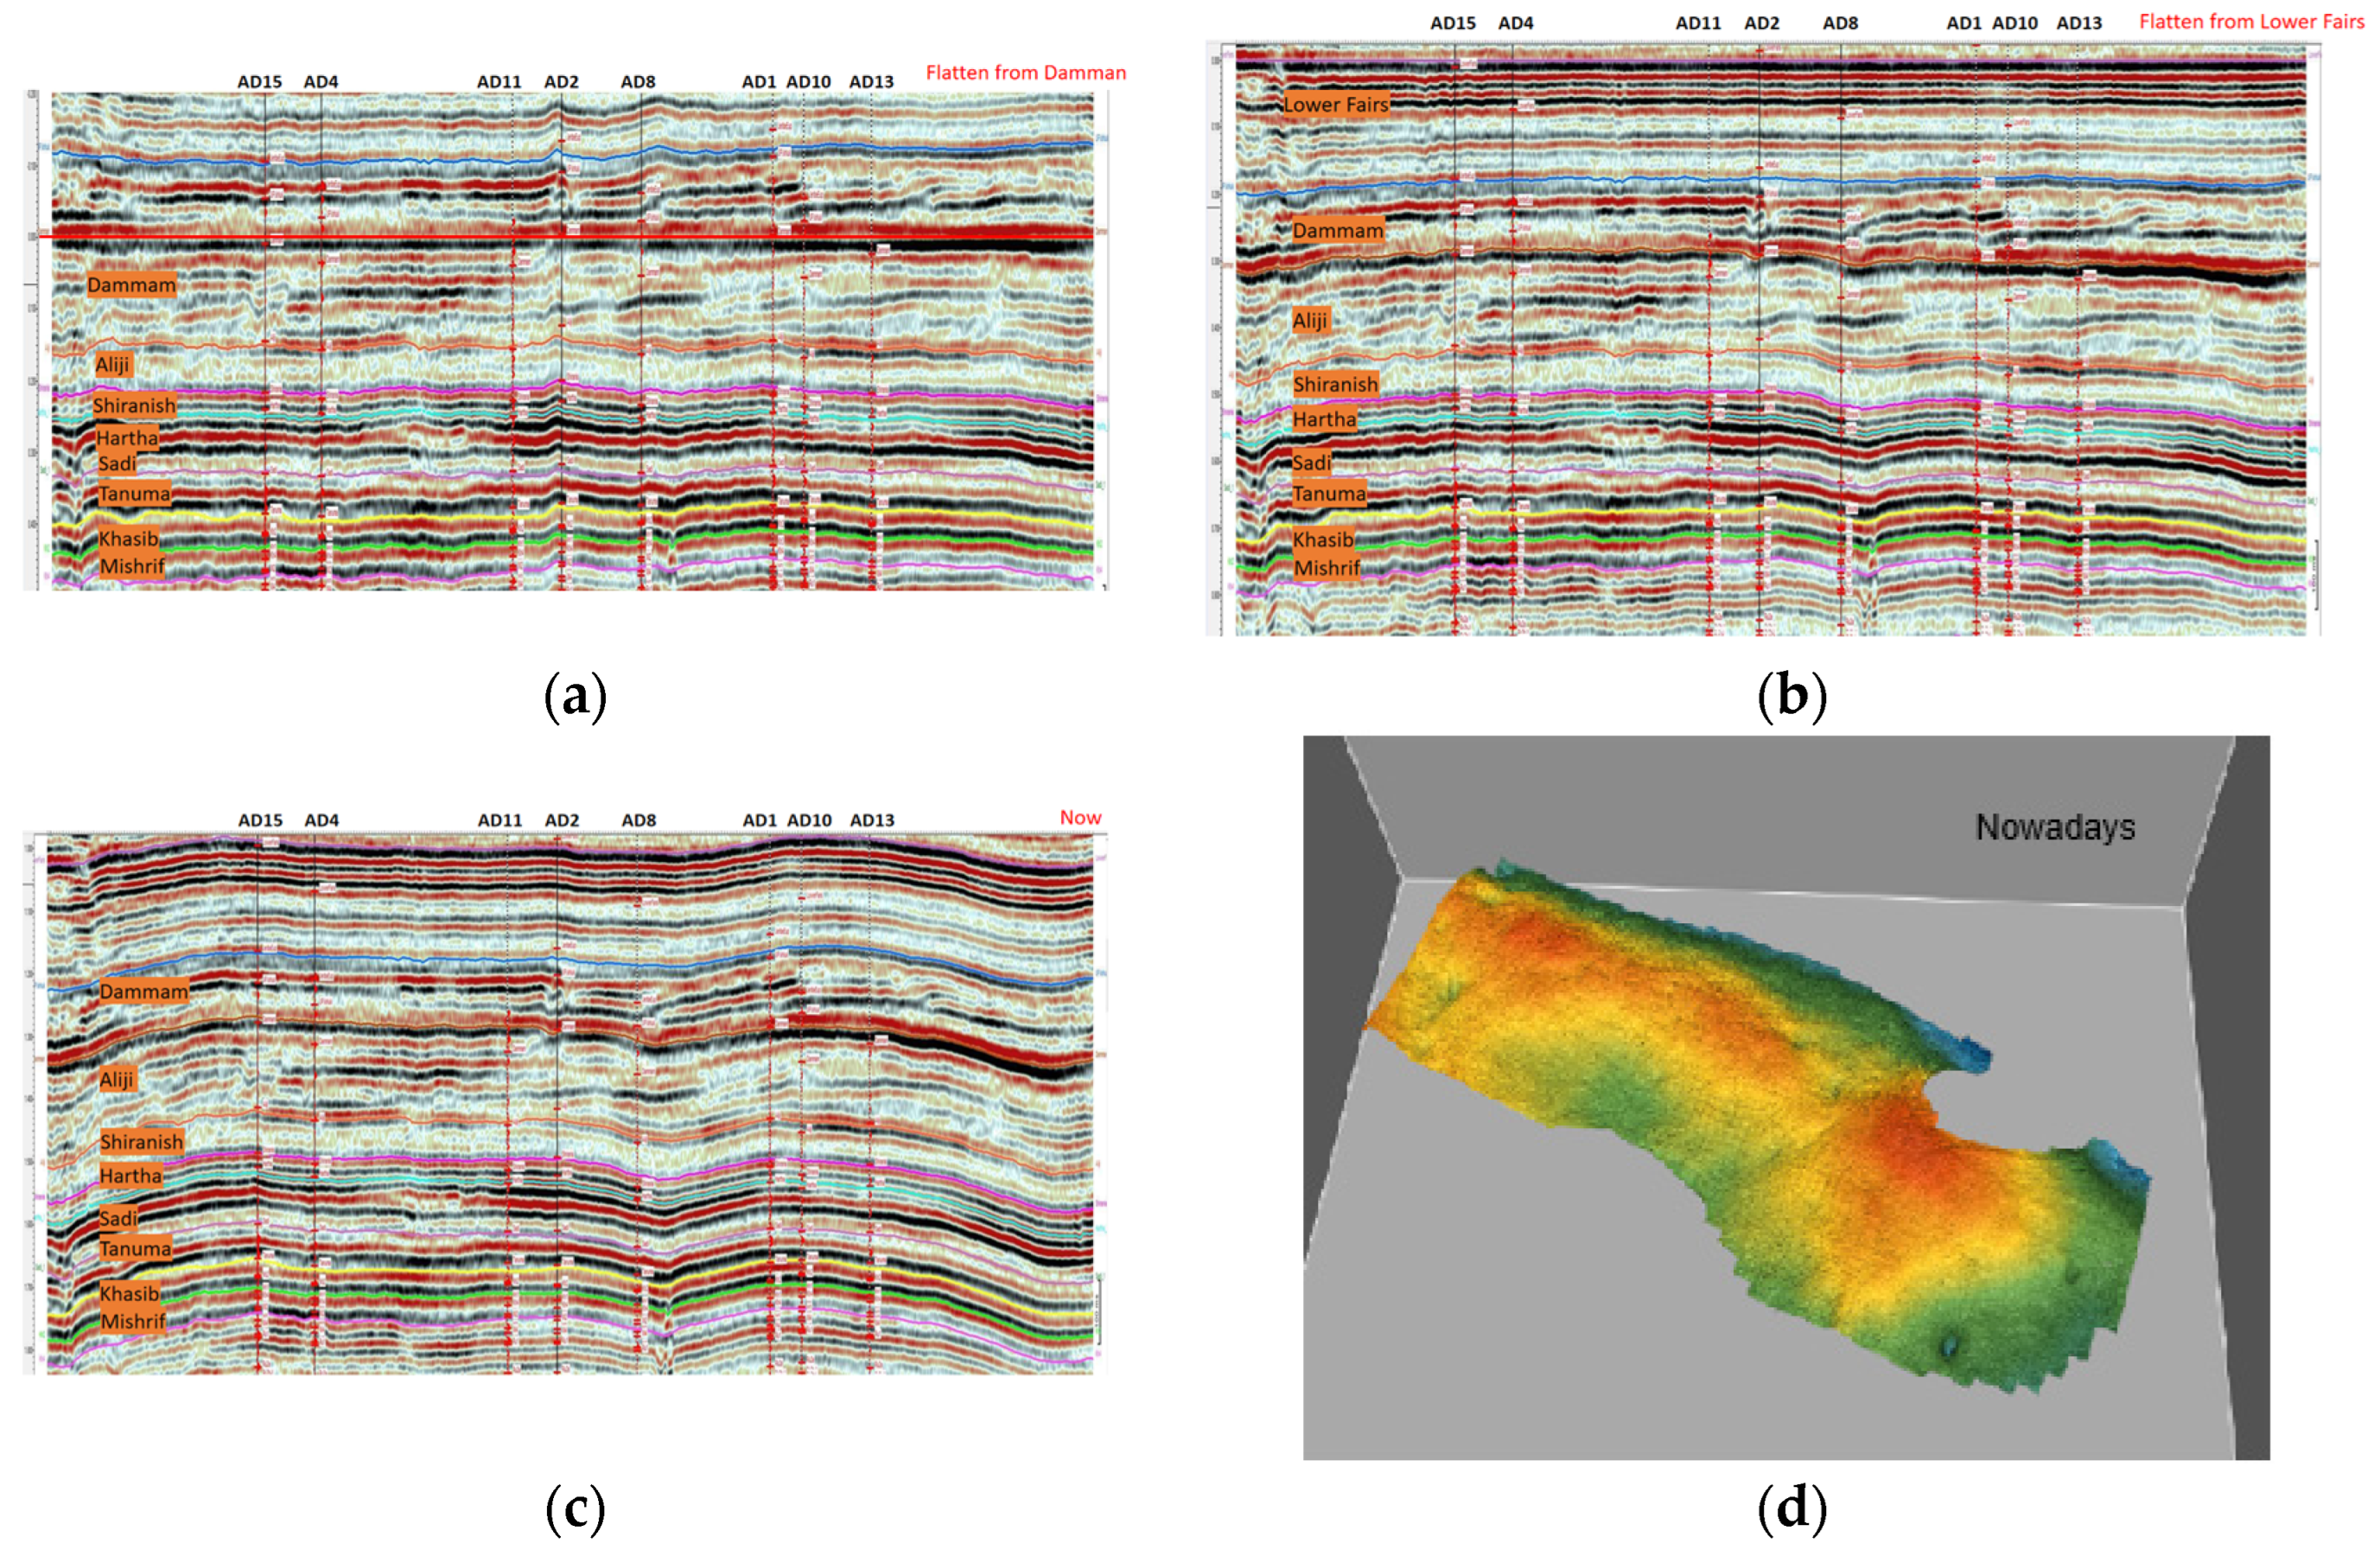
3.1. Evolution of Sedimentation and Tectonic Traps

Ahdeb oil field is located in the central part of the Mesopotamia basin in the northern stable shelf area of Persian Gulf basin on the northern edge of the ancient Gondwana continent. During the Cretaceous period, the Mesopotamian Basin was dominated by carbonate deposits. The Cretaceous carbonate rocks of the Ahdeb oil field were deposited in a medium-low energy gentle slope environment. Three main types of sedimentary subfacies can be identified based on lithological characteristics and lithological assemblages: outer gentle slope, beach, and gentle inner slope [26].
After the deposition of the target layer Khasib, the strata continued to settle steadily. By flattening the top of the Daman layer, it can be found that the shear compression of the Indian plate and the Arabian Plate gradually formed the paleo-uplift in the central and eastern part of the study area at the end of the Cretaceous. With the continuation of extrusion, the tectonic extrusion further intensified, the tectonics further evolved, and a tectonic trap was formed in the east-central area when the Dammam layer began to be deposited (Figure 2a).
At the beginning of the Neotectonic movement, the north-east–south-west extrusion occurred by touching the Eurasian plate with the Arabian plate(Figure 2b). The New Tethys Sea was closed, and the tectonic features in the study area were modified again, forming a back-sloping structure with the central part of the work area as the high point. As shown in Figure 2c,d, in the middle Miocene and later, under the strong effect of neotectonic movement, the tectonic transformation continued and finally settled into a long-axis backslope along the north-west–south-east direction, with tectonic high points in the southeast, central, and northwest of it. The highest point of the backslope is the southeast high point. The entire backslope is gently tectonic, with a stratigraphic dip of less than 2° and two asymmetrical flanks, with the north-east flank having a slightly steeper dip than the southwest flank. The closure height is about 60 m, and the closure area is 160 km2.

3.2. Inclusion Color Analysis

A large number of dark brown oil inclusions were found in the samples taken from the Ahdeb oil field in a band-like distribution, and two different types of color fluorescence, light yellow and blue-green, could be found under blue light excitation. Based on the color classification of maturity, it is thought that these colors may indicate two types of oil with different maturity [27]. The blue-green color has the highest maturity, and the light yellow color has a low maturity (Figure 3). Therefore, the block is inferred to be filled with two phases of oil of different maturity by the fluorescence color of liquid hydrocarbon inclusions.

3.3. Inclusion Homogenization Temperature

In this study, through the determination of the homogenization temperature and freezing point temperature of saline inclusions, it was found that the homogenization temperature distribution also had the characteristics of two stages, and the corresponding freezing point temperatures could also be divided into two stages: the peak homogenization temperature of inclusions in the first period is concentrated in 60~100 °C, and the peak homogenization temperature of inclusions in the second period is concentrated in 120~140 °C (Figure 4). The freezing point temperature was measured as −15.4 to −24.8 °C, according to the calculation equation:
Salinity = 0 + 1.78*t − 0.042*t2 + 0.000557t3
Here, t = freezing point temperature. After calculation according to the formula, the salinity ranges from 18.9 to 25.4 wt.% NaCl. The formula is applicable for salinity <23 wt.% NaCl. However, it can roughly reflect two different salinity environments. In inclusions with a freezing point close to −21 °C, the salinity of brine may tend to be higher than that of early seawater. During the period of massive hydrocarbon charging in the later stage, the coarsely crystalline calcite that underwent recrystallization captured late-stage saline inclusions. At this time, the reservoir had completely disengaged from the early sedimentary water body. A large number of alkaline ions in the pore water gradually separated through precipitation, and therefore the pore water gradually desalinated, resulting in the formation of saline inclusions with lower salinity.
The characteristics of the brine inclusions captured in the two phases are pronounced through the rendezvous of homogeneous temperature and freezing point temperature (Figure 5). The first phase inclusions are caught in early diagenesis, with low temperature, 60~80 °C, and high salinity, i.e., pristine seawater, averaging 22.56 wt.% NaCl. The second phase inclusions are captured in the burial phase, with higher temperature hydrocarbon-rich fluids brought in by hydrocarbon discharge from hydrocarbon source rocks with higher paleogeotherm, thus forming brine inclusions with temperatures 100~140 °C and lower salinity, averaging 20 wt.% NaCl (Figure 6).

3.4. Inclusion Infrared Absorption Spectra

The test results can divide the hydrocarbon inclusions in the area into two oil transport phases. In the first stage, oil maturity is lower; CH2a/CH3a is 3.5~5.2, Xinc > 30, and Xstd > 12. In the second stage, oil maturity is higher; CH2a/CH3a is 2.53~3.5, Xinc is 19.25~30, and Xstd is 9.75~12 (Table 1). Therefore, the infrared absorption spectra of oil inclusions in the Ahdeb oil reservoir also reflect the existence of two-phase transport characteristics within the reservoir [28]. It is shown that the infrared absorption spectra of oil inclusions of different maturities can also reflect the characteristics of the two phases of oil (Figure 7).

3.5. Lumpy Asphalt Observation

According to the results of inclusion homogenization temperature and freezing point temperature, fluorescence color observation, infrared spectrum determination, combined with the discovery of massive asphalt, it is concluded that the oil in the middle Upper Cretaceous limestone reservoir in the Ahardab oilfield experienced two phases of charging [29]. In this study, it was also found that soft bitumen is common in the pores of the core or karst caves. Bitumen samples from the Kh2 layer and Ru3 layer were collected. Through the analysis of biomarker compounds by GC-MS, it was indicated that the composition of the bitumen was close to that of crude oil, which might be the result of hydrocarbon expulsion from adjacent low-maturity source rocks (Table 2).

4. Discussion

At the end of Cretaceous, the hydrocarbon source rocks entered the hydrocarbon generation stage of unripe–low-ripe oil and started to enter the hydrocarbon discharge stage, at which time a paleo-uplift was formed by shearing and extrusion in the central-eastern part of the work area. At this time, the unripe–low-ripe oil generated from the hydrocarbon source rocks moved into the reservoir along the fault and gathered to form the reservoir. The reservoir gathered at this stage had high colloidal asphaltene content and a high density of crude oil (Figure 8a).
With the settlement and burial depth of the formation, the hydrocarbon source rock enters the hydrocarbon generation window. It starts the main hydrocarbon generation and discharge period, while, at this time, the tectonic evolution and tectonic trap closures expand. These normal crude oils accumulate throughout the trap closure while diluting the high asphaltene crude oils that were gathered earlier. Since the east-central area is the early high asphaltene enrichment area, the asphaltene content of the diluted crude oils still retains relatively high values in these areas. Therefore, the crude oil in the southeastern part of the work zone shows high asphaltene content and high density. The central part is the medium. The northwestern part has the lowest asphaltene content and low density (Figure 8b).
Neotectonic movement continues to modify the whole structure further. The magnitude of confinement has increased to a certain extent. However, the overall pattern has not changed, so the distribution characteristics of high asphaltene content and density in the southeast and low asphaltene content and density in the northwest of the block are still maintained (Figure 8c).

5. Conclusions

  • The data on research and oil and gas characteristics show that the crude oil of Ahdeb oil field in Iraq mainly comes from the hydrocarbon source rocks of the Upper Jurassic Chia Gara Formation. This set of hydrocarbon source rocks entered the unripe–low-ripe oil generation period in the middle Late Cretaceous, the main generation period of low-ripe oil in the late Late Cretaceous, and the peak hydrocarbon generation and discharge period of the source rocks in the Paleocene.
  • Tectonic evolution shows that the Ahdeb oil field formed a palaeohigh in the east-central area when the Dammam layer was deposited in the late Cretaceous, and a complete tectonic trap was formed in the work area before the Fars deposition.
  • The fluorescence of liquid organic inclusions shows the highest blue-green maturity and slightly lower bright yellow maturity, which indicates that at least two phases of oil and gas filling occurred in the block. The uniform temperature and salinity of brine inclusions simultaneously with organic inclusions also obviously have two phases: The first peak temperature was concentrated in the range of 60~100 °C, and the average salinity was 22.56wt.%NaCl. The peak temperature of the second phase was 120~140 °C, and the average salinity was 20 wt.%NaCl. It was proved that there are two phases of oil charging in this area.
  • The formation process of Ahdeb oil field is as follows: at the end of Cretaceous, the hydrocarbon source rocks of Yamama entered the hydrocarbon generation window, and the crude oil produced at this time was uncooked and low-cooked oil with high asphaltene content, and these uncooked and low cooked oils moved to the reservoir and gathered in the southeastern trap, and at the end of the Paleocene and early Neoproterozoic, the hydrocarbon source rocks continued to be buried deeply and entered the peak hydrocarbon generation period, producing a large amount of normal crude oil. These crude oils were transported into the traps formed by neotectonic movements and mixed with the unripe and low-ripe oils gathered in the early period to form the paleosol. Then the tectonics continued to evolve and adjust to form the present-day tectonics. The oil and gas also adjusted again to form the present-day oil and gas distribution pattern.

Author Contributions

Conceptualization, methodology, writing—original draft preparation, Q.W.; investigation—B.W.; writing—review and editing, T.W., B.L., J.X. and M.T. All authors have read and agreed to the published version of the manuscript.

Funding

This research received no external funding.

Data Availability Statement

The original contributions presented in the study are included in the article; further inquiries can be directed to the corresponding author.

Conflicts of Interest

Authors Qiang Wang, Tao Wen, Bo Li, Jun Xin, Meng Tian and Baiyi Wu are employed by the company Geologic Exploration & Development Research Institute of Chuanqing Drilling Engineering Co., Ltd. The remaining authors declare that the research was conducted in the absence of any commercial or financial relationships that could be construed as a potential conflict of interest.

References

  1. Duan, G.; Zhou, Q.; Zhang, C. The plays character of the abundant hydrocarbon area in the Middle East and their exploration potential. Earth Sci. Front. 2014, 21, 118–126. [Google Scholar]
  2. Zhou, Q.; Zhang, C.; Yang, G. Main controlling factors of hydrocarbon accumulation in Mesopotamia Basin. Pet. Geol. Exp. 2013, 35, 296–301. [Google Scholar]
  3. Pitman, J.K.; Steinshouer, D.; Lewan, M.D. Petroleum generation and migration in the Mesopotamian Basin and Zagros fold Belt of Iraq, Result from a basin–modeling study. GeoArabia 2004, 9, 41–72. [Google Scholar] [CrossRef]
  4. Umar, K.; Akhtar, J.; Muhammad, K.; Aimal, A. Cretaceous stratigraphic framework and sedimentary architecture, Pakistan: Signatures of rift-drift tectonics and submarine volcanism along the western continental margin of the Indian Plate. In Geological Society; Special Publications: London, UK, 2023; Volume 545, p. 101144. [Google Scholar]
  5. Jan, J.; Shah, M.; Rahim, H.; Iqbal, S.; Jahandad, S.; Jamil, M.; Khalil, R.; Amin, Y. Depositional and diagenetic studies of clastic reservoirs zone in the Cretaceous Lower Goru Formation, Sindh Monocline, South Pakistan. J. Earth Syst. Sci. Eng. 2024, 133, 115. [Google Scholar] [CrossRef]
  6. Khaiwka, M.H. Structural evolution of the East Baghdad oilfield, central Iraq. In Proceedings of the C. Baghdad Proc. 5th Sci. Conf; Scientific Research Council: Kingston, Jamaica, 1989; pp. 17–27. [Google Scholar]
  7. Al-Ameri, T.K. Khasib and Tannuma oil sources, East Baghdad oil field, Iraq. Mar. Pet. Geol. 2011, 28, 880–894. [Google Scholar] [CrossRef]
  8. Dunnington, H.V. Generation, migration, accumulation, and dissipation of oil in northern Iraq. In Habitite of Oil, Symposium; Weeks, L.G., Ed.; American Association of Petroleum Geologists: Tulsa, OK, USA, 1958; pp. 1194–1251. [Google Scholar]
  9. Du, Y.; Cui, Y.; Zheng, D.; Wang, J.; Xin, J.; Wang, M.; Wang, F.; Huang, T. Oil source and migration characteristics of Cretaceous reservoirs in central Iraq. Pet. Geol. Exp. 2016, 38, 76–83. [Google Scholar]
  10. Lee, R.F. Pitfalls in seismic data flattening. Lead. Edge 2001, 20, 160–164. [Google Scholar] [CrossRef]
  11. Guo, W.; Liu, T.; Zhao, F.; Wang, Z.; Zhao, G.; Ding, F. The deepening application layer flattening technique in seismic interpretation. J. Pet. Geophys. Prospect. 2020, 55, 1110–1120. [Google Scholar]
  12. Al-Ameri, T.K.; Batten, D.J. Palynomorph and palynofacies indications of age, depositional environments and source potential for hydrocarbons: Lower Cretaceous Zubair Formation, southern Iraq. Cretac. Res. 1997, 18, 789–797. [Google Scholar] [CrossRef]
  13. Abeed, Q.; Leythaeuser, D.; Littke, R. Origin and correlation of crude oils in Lower Cretaceous sedimentary sequences of the southern Mesopotamian Basin, southern Iraq. Org. Geochem. 2012, 46, 113–126. [Google Scholar] [CrossRef]
  14. Xu, L.; Wang, Y.; Li, Z. Geochemical characteristics of crude oil in Qom Basin, Iran. Pet. Geol. Exp. 2006, 28, 168–172. [Google Scholar]
  15. Lu, Z. Fluid immiscibility and fluid inclusions. Acta Petrol. Sin. 2011, 27, 1253–1261. [Google Scholar]
  16. Bai, H.; Zhang, G.; Mi, R. Oil and gas accumulation elements and model, central Iraq. Geol. Sci. Technol. Inf. 2019, 38, 8–15. [Google Scholar]
  17. Lu, Z.; Shan, Q. Composition of ore forming fluids in metal deposits and fluid inclusion. Acta Petrol. Sin. 2015, 31, 1108–1116. [Google Scholar]
  18. Fu, Y.; Liu, X.; Deng, C.; Huang, T.; Wang, H. Hydrocarbon charging period of Cretaceous reservoirs in AHDEB oil field: Evidence from fluid inclusion. Earth Sci. 2015, 40, 1187–1196. [Google Scholar]
  19. Munz, I.A. Petroleum inclusions in sedimentary basins: Systematics, analytical methods and applications. Lithos 2001, 55, 195–212. [Google Scholar] [CrossRef]
  20. Stasiuk, L.D.; Lockhart, G.D.; Nassichuk, W.W.; Carlson, J.A. Thermal maturity evaluation of dispersed organic matter inclusions from kimberlite pipes, Lac de Gras, Northwest Territories, Canada. Int. J. Coal Geol. 1999, 40, 1–25. [Google Scholar] [CrossRef]
  21. Yao, P.; Zhang, J.J.; Lv, D.W.; Vandeginste, V.; Chang, X.C. Effect of water occurrence in coal reservoirs on the production capacity of coalbed methane by using NMR simulation technology and production capacity simulation. Geoenergy Sci. Eng. 2024, 243, 213353. [Google Scholar] [CrossRef]
  22. Pierre, N. Salinity of oceanic hydrothermal fluids: A fluid inclusion study. Earth Planet. Sci. Lett. 1991, 102, 3–4. [Google Scholar]
  23. Yunus, W.M.M.; Fen, Y.W.; Yee, L.M. Refractive Index and Fourier Transform Infrared Spectra of Virgin Coconut Oil and Virgin Olive Oil. Am. J. Appl. Sci. 2009, 6, 328–331. [Google Scholar] [CrossRef]
  24. Abbas, O.; Dupuy, N.; Rebufa, C.; Vrielynck, L.; Kister, J.; Permanyer, A. Prediction of Source Rock Origin by Chemometric Analysis of Fourier Transform Infrared—Attenuated Total Reflectance Spectra of Oil Petroleum: Evaluation of Aliphatic and Aromatic Fractions by Self-Modeling Mixture Analysis. Appl. Spectrosc. 2006, 60, 304–314. [Google Scholar] [CrossRef]
  25. Wang, Q.; Wang, Z.; Zeng, X.Y. Research on Reservoir Characteristics and Main Controlling Factors of Longwangmiao Formation of Cambrian in Sichuan Basin. Front. Earth Sci. 2022, 10, 885637. [Google Scholar] [CrossRef]
  26. Wang, Q.; Wen, T.; Li, H.X. Influence of heterogeneity on fluid property variations in carbonate reservoirs with multistage hydrocarbon accumulation: A case study of the Khasib formation, Cretaceous, AB oilfield, southern Iraq. Open Geosci. 2022, 14, 663–674. [Google Scholar] [CrossRef]
  27. Wang, Q. Types and Distribution Characteristics of Callovian-Oxfordian Reservoir on the Right Bank of Amu Darya River in Turkmenistan. Geofluids 2023, 6754915. [Google Scholar] [CrossRef]
  28. Lu, H.; Tang, H.M.; Wang, M.; Li, X.; Zhang, L.H.; Wang, Q. Pore Structure Characteristics and Permeability Prediction Model in a Cretaceous Carbonate Reservoir, North Persian Gulf Basin. Geofluids 2021, 19, 8876679. [Google Scholar] [CrossRef]
  29. Zhao, L.M. The Reservoir Characteristics of the Cretaceous Carbonate Rocks and the Differential Enrichment of Hydrocarbons in the Ahdeb Oilfield, Central Iraq. Master’s Thesis, Chengdu University of Technology, Chengdu, China, 2021. [Google Scholar]
Figure 1. Burial history and hydrocarbon generation history of Ahdeb field formation [9].
Processes 12 02135 g001
Figure 2. (a) Seismic section with Dammon layer flattening; (b) seismic section with Lower Fairs layer flattening; (c) present seismic profile; (d) present tectonic form.
Processes 12 02135 g002
Figure 3. Fluorescence photos of oil inclusions with different maturity.
Processes 12 02135 g003
Figure 4. Homogeneous temperature profile of brine inclusions contemporaneous with oil.
Processes 12 02135 g004
Figure 5. Cross plot of homogenization temperature and salinity of saline inclusions coincident with oil.
Processes 12 02135 g005
Figure 6. Laser Raman spectrogram of saline inclusions.
Processes 12 02135 g006
Figure 7. Infrared absorption spectra of oil inclusions with different maturities.
Processes 12 02135 g007
Figure 8. (a) Hydrocarbon accumulation before deposition in Dammam; (b) Hydrocarbon accumulation before deposition in Lower Fars; (c) Hydrocarbon accumulation adjustment in the middle and late neostructure.
Processes 12 02135 g008
Table 1. Hydrocarbon inclusion characteristics.
WellHorizonDepthAREA[∑CH2]/AREA [∑CH3]XincXstd
Well-13Ru2a2915.852.77221.91310.638
Ru2a2915.853.0825.33211.777
Ru2a2915.854.17137.45315.818
Ru32990.662.53219.2499.75
Ru32990.663.99835.53115.177
Ru32990.663.77633.06714.356
Ma13086.43.66331.81213.937
Ru2b2960.322.86922.99110.997
Ru2b2960.324.48440.9316.977
Ru2b2960.325.21149.00619.669
Table 2. Comparison table of bitumen and crude oil maturity parameters.
WellHorizonSampleDepth (m)Ts/(Ts + Tm)αααC29 Cholestane
20S/(20S + 20R)
αββ/(αββ + ααα) C29 Cholestane (20R + 20S)C27/C29
Cholestane
ααα-20R
C28/C29
Cholestane
ααα-20R
C27/C28
Cholestane
ααα-20R
Well-13Kh2Crude oil2636.560.210.420.531.080.651.74
Asphalt2627.990.20.420.571.130.571.99
Ru3Crude oil2986.840.170.430.561.060.591.81
Crude oil2991.660.160.460.561.140.591.95
Asphalt2986.490.150.430.561.080.551.97
Asphalt2990.880.160.440.551.240.631.97
Disclaimer/Publisher’s Note: The statements, opinions and data contained in all publications are solely those of the individual author(s) and contributor(s) and not of MDPI and/or the editor(s). MDPI and/or the editor(s) disclaim responsibility for any injury to people or property resulting from any ideas, methods, instructions or products referred to in the content.

