Article

Fracture Properties of Nitrogen–Slick Water Composite Fracturing in Coal Reservoir

by
Menglong Wang
1,
Lin Tian
1,2,3,*,
Jinghao Wu
1,
Yunxing Cao
1,2,3,*,
Li Wang
4,
Bin Shi
1,2,3,
Mingyue Sun
1,
Shimin Liu
5 and
Yunbing Hu
1
1
School of Resources and Environment, Henan Polytechnic University, Jiaozuo 454000, China
2
Collaborative Innovation Center of Coal Work Safety and Clean High Efficiency Utilization, Henan Polytechnic University, Jiaozuo 454000, China
3
Henan International Joint Laboratory for Unconventional Energy Geology and Development, Henan Polytechnic University, Jiaozuo 454000, China
4
School of Civil Engineering, Henan Polytechnic University, Jiaozuo 454000, China
5
Department of Energy and Mineral Engineering, G3 Center and Energy Institute, Pennsylvania State University, University Park, PA 16802, USA
*
Authors to whom correspondence should be addressed.
Processes 2024, 12(9), 1949; https://doi.org/10.3390/pr12091949
Submission received: 22 August 2024 / Revised: 2 September 2024 / Accepted: 9 September 2024 / Published: 11 September 2024

Abstract

:
Nitrogen–slick water composite fracturing is a novel, recently developed fracturing technology. Due to its impact on increasing permeability, this technology outperforms hydraulic fracturing. This study adopted the horizontal well XJ-1L, Xinjing coal mine, Qinshui Basin, China, as a study area to statistically analyze the fracture properties, stress drop, and b-value distribution characteristics of 1217 effective micro-seismic events generated during nitrogen–water composite fracturing. The results show that: (1) gradually reducing the proportion of gas in fracturing fluid reduced the proportion of tensile fractures at a ratio of between 15.6% and 0.8%, whereas the proportion of strike-slip fractures gradually increased by between 1.6% and 15.2%; (2) the stress drop and b-values in the nitrogen fracturing (NF) stage, representative of stress disturbance, exceeded those in the hydraulic fracturing (HF) stage, consistent with greater numbers of tensile fractures formed in the NF stage; (3) the greater number of tensile fractures and their increasing permeability could be explained based on the influences of gas compressibility and pore pressure on coal fractures. This study provides a theoretical and practical basis for optimizing the exploitation of low-permeability coal reservoirs.

1. Introduction

Coal reservoir fracturing is an important method used to increase the productivity of coalbed methane [1,2,3]. The fracturing process produces cracks, which increase the connections between the coalbed and the shaft, with fractures formed during sedimentary processes including structural, artificial, and primary fractures [4,5]. The fracturing process is achieved through the large quantity of energy generated by the fracturing equipment being transmitted to the reservoir through the fracturing fluid [6].
Slick water is currently the dominant fracturing fluid used for coalbed methane production [7]. This is because of the good results achieved by slick water fracturing in higher permeability reservoirs, such as in the San Juan Basin, United States of America (USA), the Bowen Basin, Australia, and the southern Qinshui Basin, China [8,9,10]. However, the use of slick water for low-permeability reservoirs requires further optimization.
Traditional hydraulic fracturing technology needs to consume a lot of water resources when mining coalbed methane, which is particularly difficult to implement in arid areas [11,12]. At the same time, the accidental leakage of fluid during hydraulic fracturing may also cause pollution to the underground aquifer and the surrounding environment. Traditional hydraulic fracturing technology may also cause damage to the formation, which in turn affects mining efficiency [13]. Therefore, from the perspective of ecological and environmental protection, it is particularly urgent and important to explore and apply anhydrous fracturing technology. Oil-based and CO2 energized oil fracturing, propellant and explosive fracturing, gas fracturing, gelled alcohol and liquefied petroleum gas fracturing, liquid/supercritical CO2 fracturing [14,15], and LN2 fracturing are possible alternatives [16,17,18].
Nitrogen fracturing and nitrogen–slick water composite fracturing represent novel and recently developed fracturing techniques. Applications of these technologies to low- permeability reservoirs have achieved good results, such as to the Appalachian Basin, USA and the central-eastern Qinshui Basin, China [19,20,21,22].
The stimulation mechanism of nitrogen–water composite fracturing in a low-permeability coal seam may be caused by its multi-fracture fracturing effect. Its multi-slit characteristics on the microscopic scale were explained by scanning electron microscopy and nuclear magnetic resonance, which were in the scale of microscopic [23]. The fracture ellipsoid formed by the nitrogen fracturing stage achieved a smaller difference between the long and short axes, with the fracture more evenly distributed in the plane.
Recent studies have shown that nitrogen has a high compression coefficient, low viscosity, weak adsorption capacity, and rapid migration speed in coal seams compared to slick water [21,24]. These characteristics of nitrogen facilitate the formation of regular pulse pressure in a coal seam, thereby reopening the original cleats [25,26,27]. These reopened fractures generally have tensile mechanical properties, whereas those formed by hydraulic fracturing have mainly strike-slip properties [28]. This represents one of the most important differences between nitrogen fracturing and slick water fracturing. This manuscript verifies the mechanical properties of crack reopening under the action of gas, and reveals the mechanical mechanism by which crack reopening is more likely to produce tensile cracks based on gas compressibility.
The aim of the present study was to analyze the characteristics of micro-seismic events recorded during nitrogen-slick water fracturing, using well XJ-1L, Xinjing coal mine, Qinshui Basin as a study area. The objectives of this study were to: (1) characterize the stress responses of the coal reservoir in the different fracturing stages based on the seismic source parameters, including the b-value; and (2) characterize the mechanical mechanism of fracture formation. The results of the present study can act as a reference for the optimization of nitrogen–water composite fracturing engineering.

2. Geological Setting and Composite Fracturing Experiments

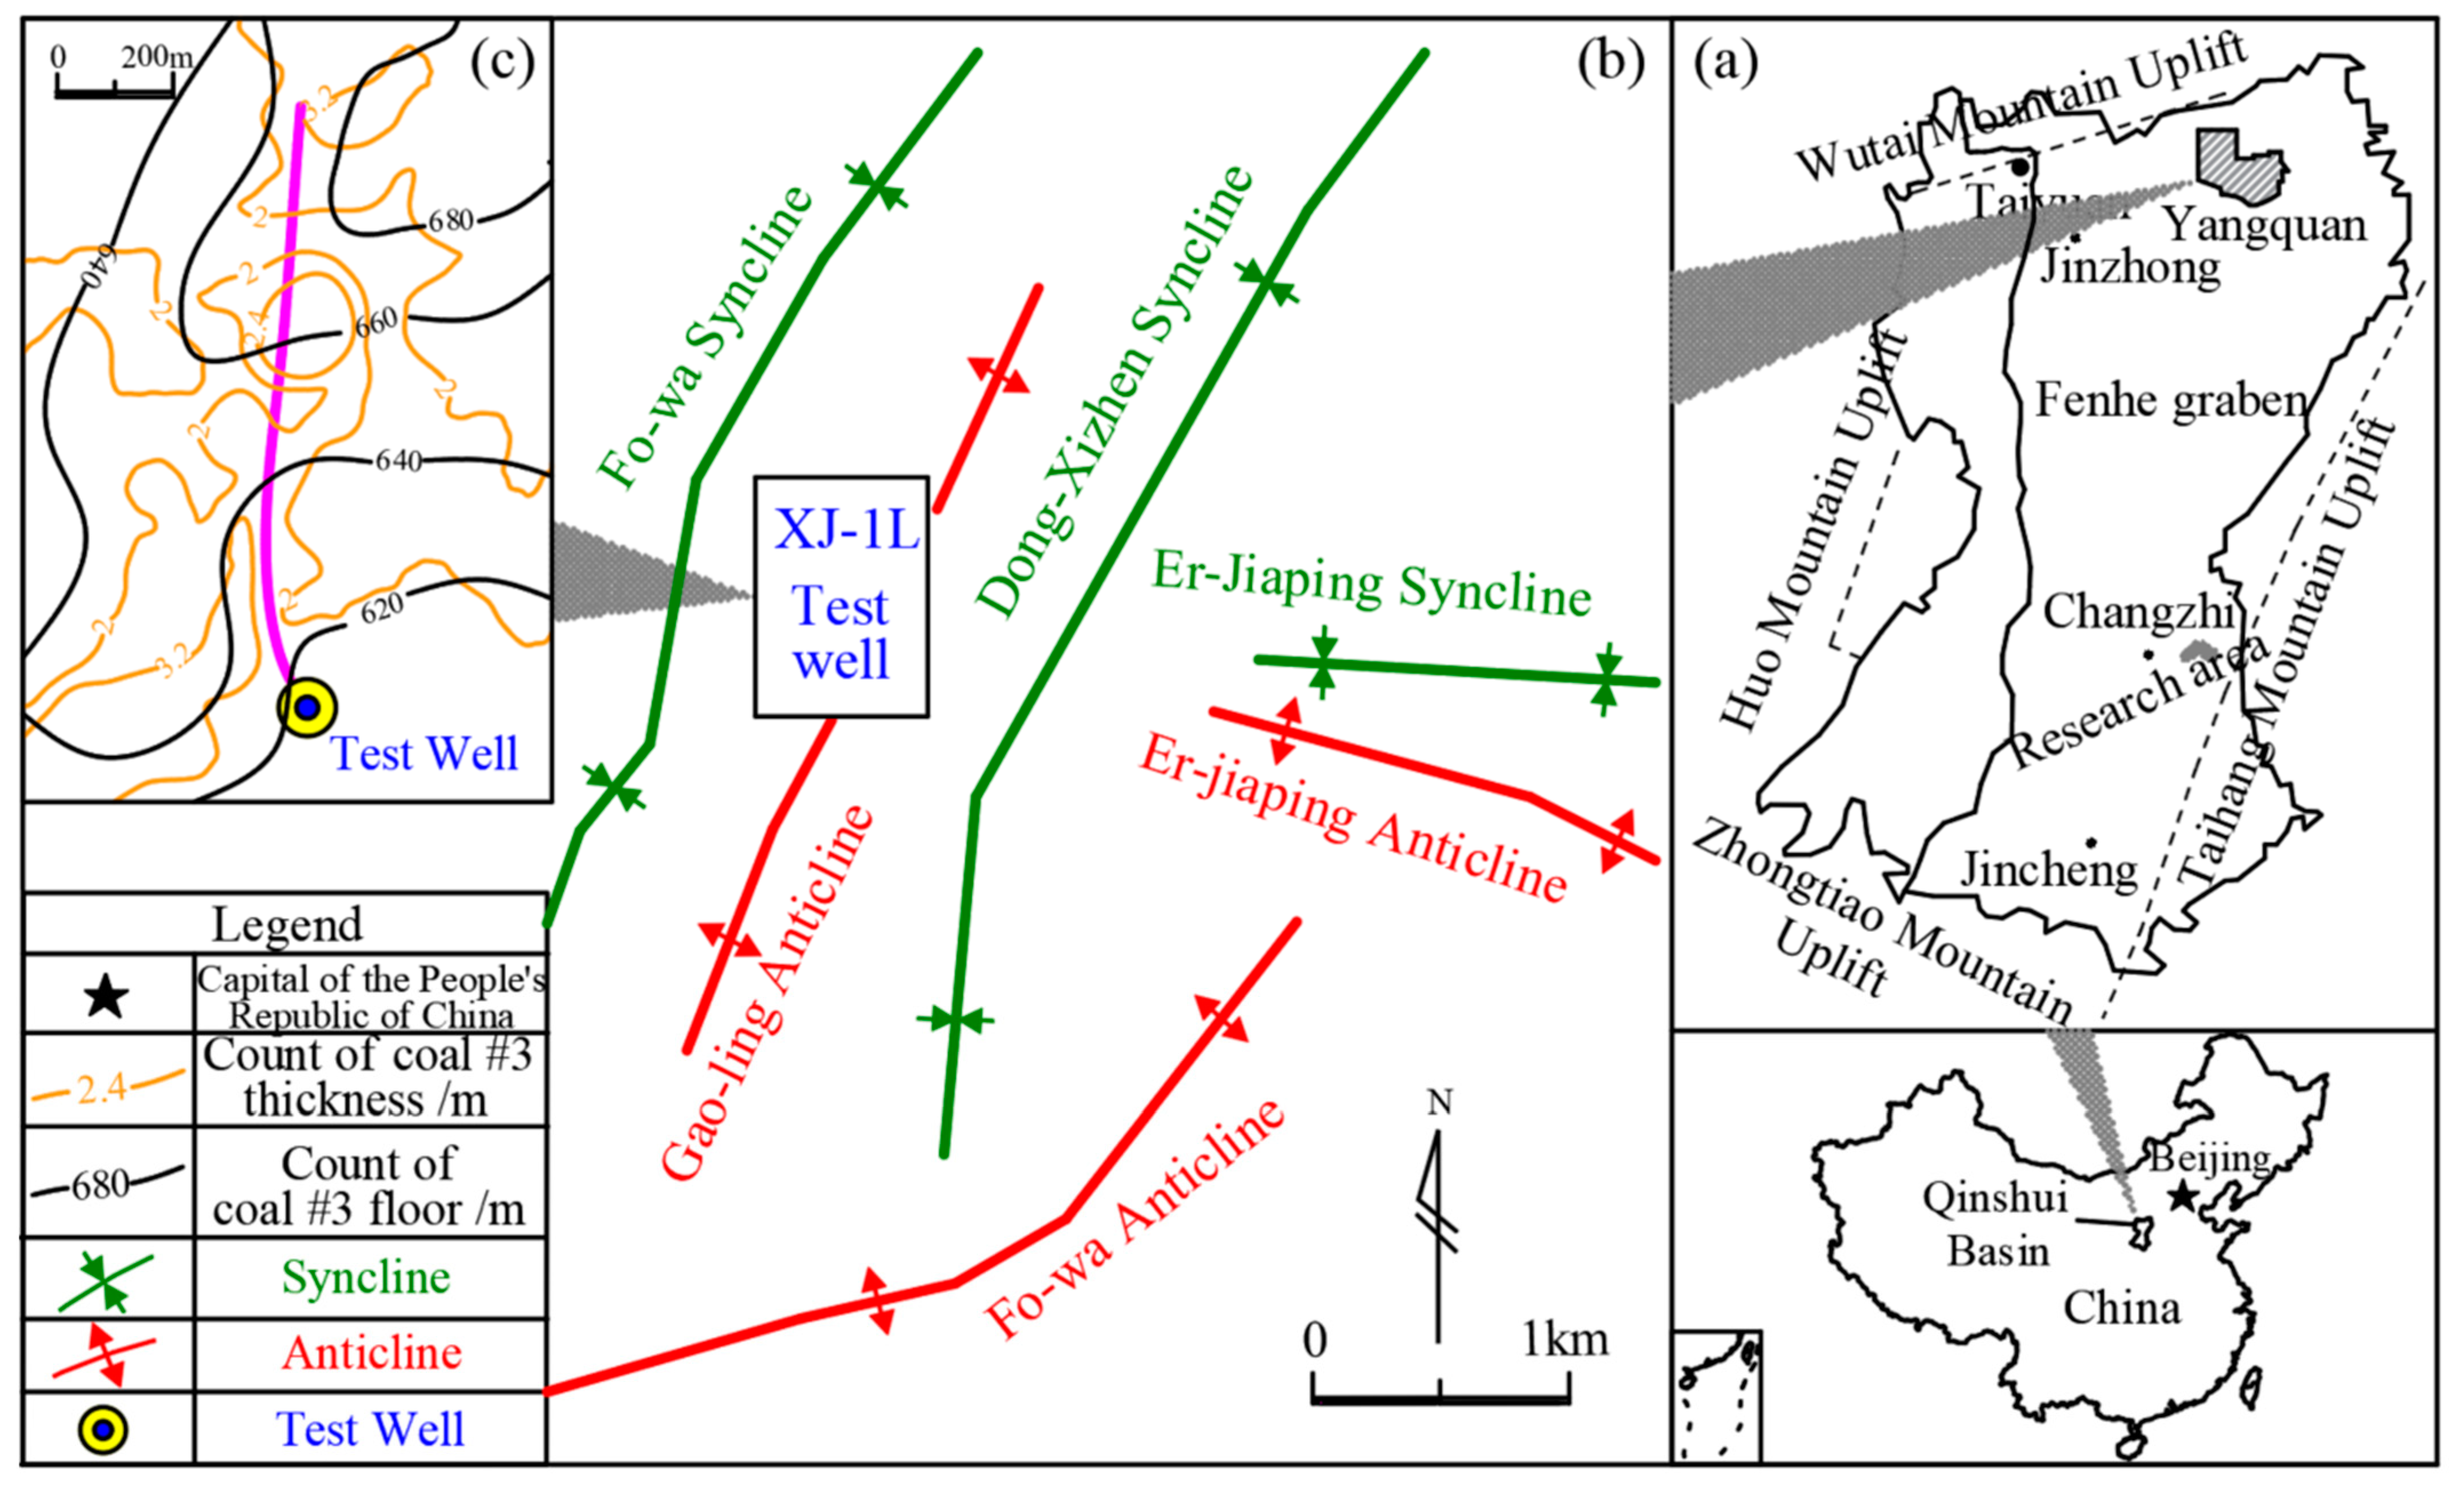
2.1. Geologic Setting

The present study was conducted in the Xinjing coal mine, Yangquan City, Shanxi Province, China. The Xinjing coal mine falls along the northern edge of Qinshui Basin, west of the Taihang Mountain uplift and east of the Fenhe Graben (Figure 1a).
The area of the coal mine investigated in the present study is on the northern edge in which the basic structural morphology is regulated by a NE–NNE-trending fold [29,30,31,32]. Since the NW-trending fold in this area is generally small in scale and has little influence on structural morphology, faults in the study area are not developed (Figure 1b).
The present study targeted the coal seam in the lower part of the Permian Shanxi Formation at a burial depth of 500–650 m and with an average thickness of 2.40 m (Figure 1c). The coal seam is dominated by pulverized and mylonitized coals with a firmness coefficient and reservoir permeability of 0.3 and 0.01 mD, respectively. The roof and floor of the coal seam are composed of fine-grained sandstone and mudstone, respectively [33].

2.2. Nitrogen–Slick Water Composite Fracturing

Nitrogen–slick water composite fracturing applies regional stimulation to form a complex fracture network while limiting reservoir damage [34,35]. During the application of this method, nitrogen gas and slick water are concurrently or successively injected [36,37,38]. Nitrogen–slick water composite fracturing is a form of gas fracturing characterized by high formation energy, reduced reservoir damage, the formation of complex fractures, and the opening of micro-fractures. However, the application of this method can increase the sand carrying ratio and stimulation reservoir volume through hydraulic fracturing [39,40,41].
This manuscript takes XJ-1L, which carried out a typical nitrogen–slick water composite fracturing as a case study, according to the proportion of nitrogen in the fracturing fluid. The fracturing process is divided into three stages, which are nitrogen fracturing (NF) in the first stage, nitrogen–slick water composite fracturing (CF) in the second stage, and hydraulic fracturing (HF) in the third stage. XJ-1L well involved seven fracturing stages. Each section spans a length of between 55 and 99 m and is perforated by three to four clusters. The distance between clusters ranges from 16 to 24 m, with an average cluster spacing of 26 m. Table 1 displays the specific parameters for segmentation clustering.
The NF used ~24,000 Nm3 of gaseous nitrogen in the first stage and injection durations of 75–91 min. The second stage of CF persisted for 45–63 min, and, after a 30 min pause, the third stage of HF persisted for 36–55 min and used ~500 m3 of slick water. Table 2 shows a detailed description of the fracturing times.

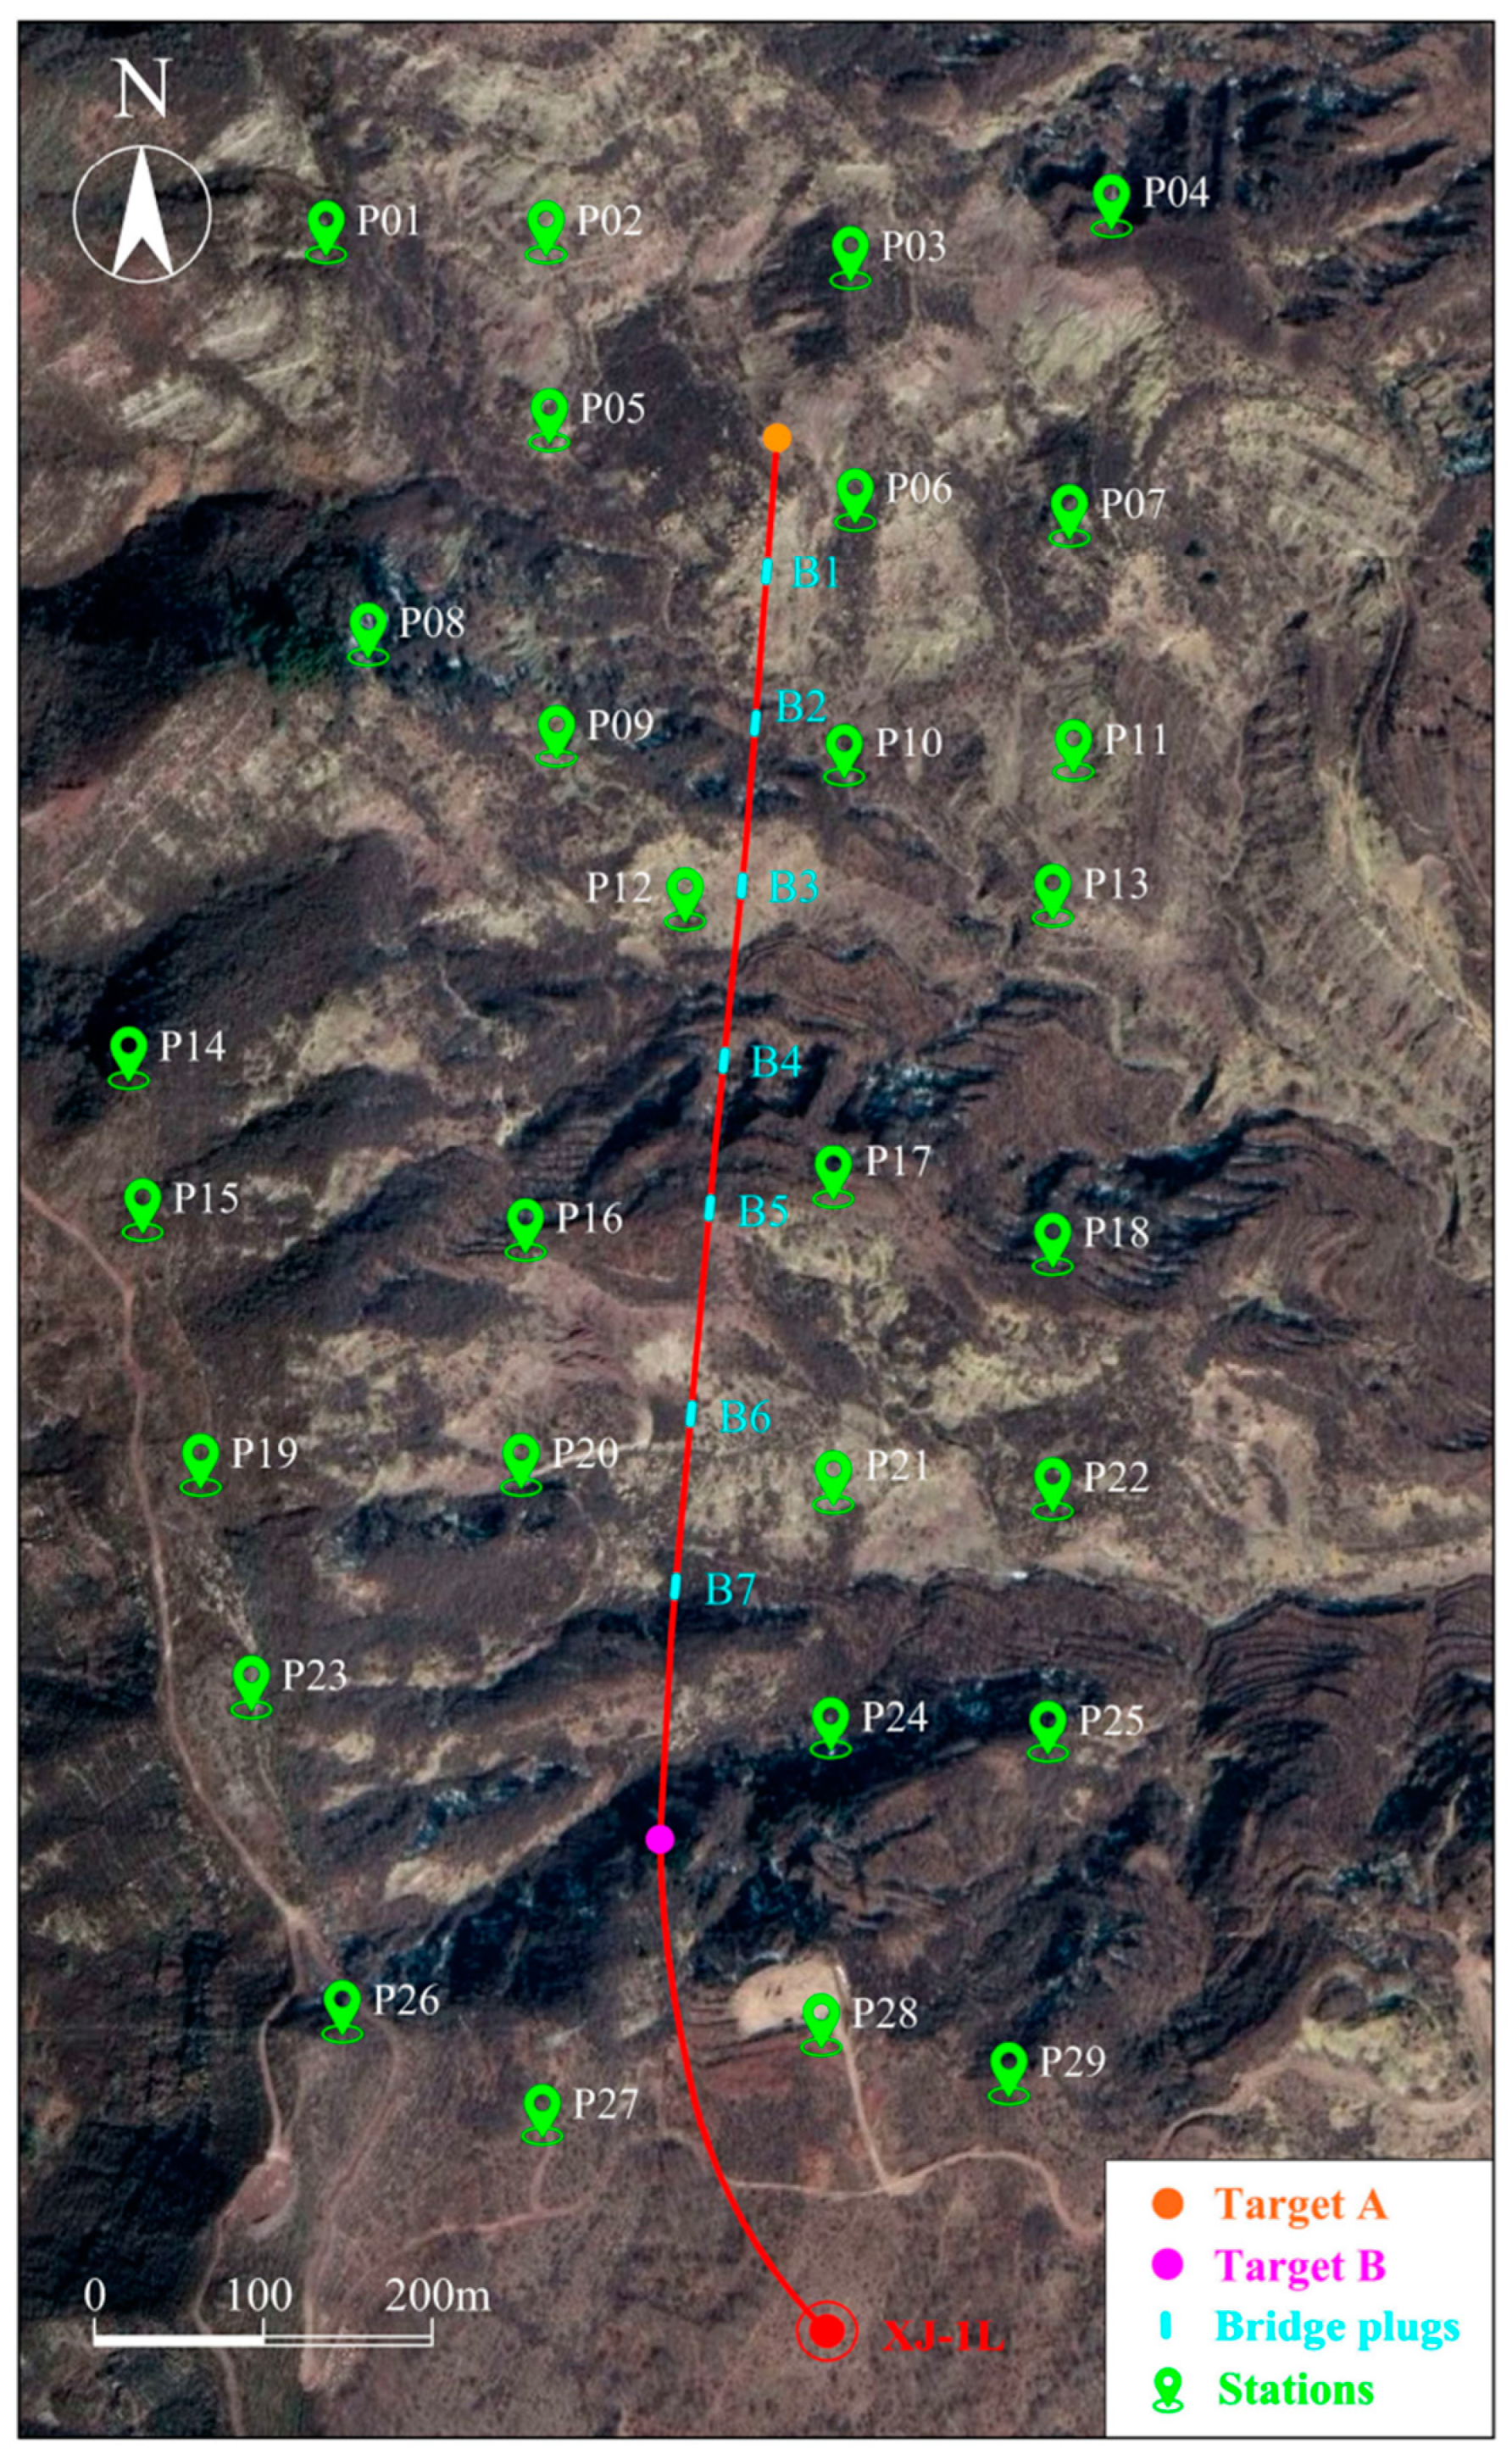
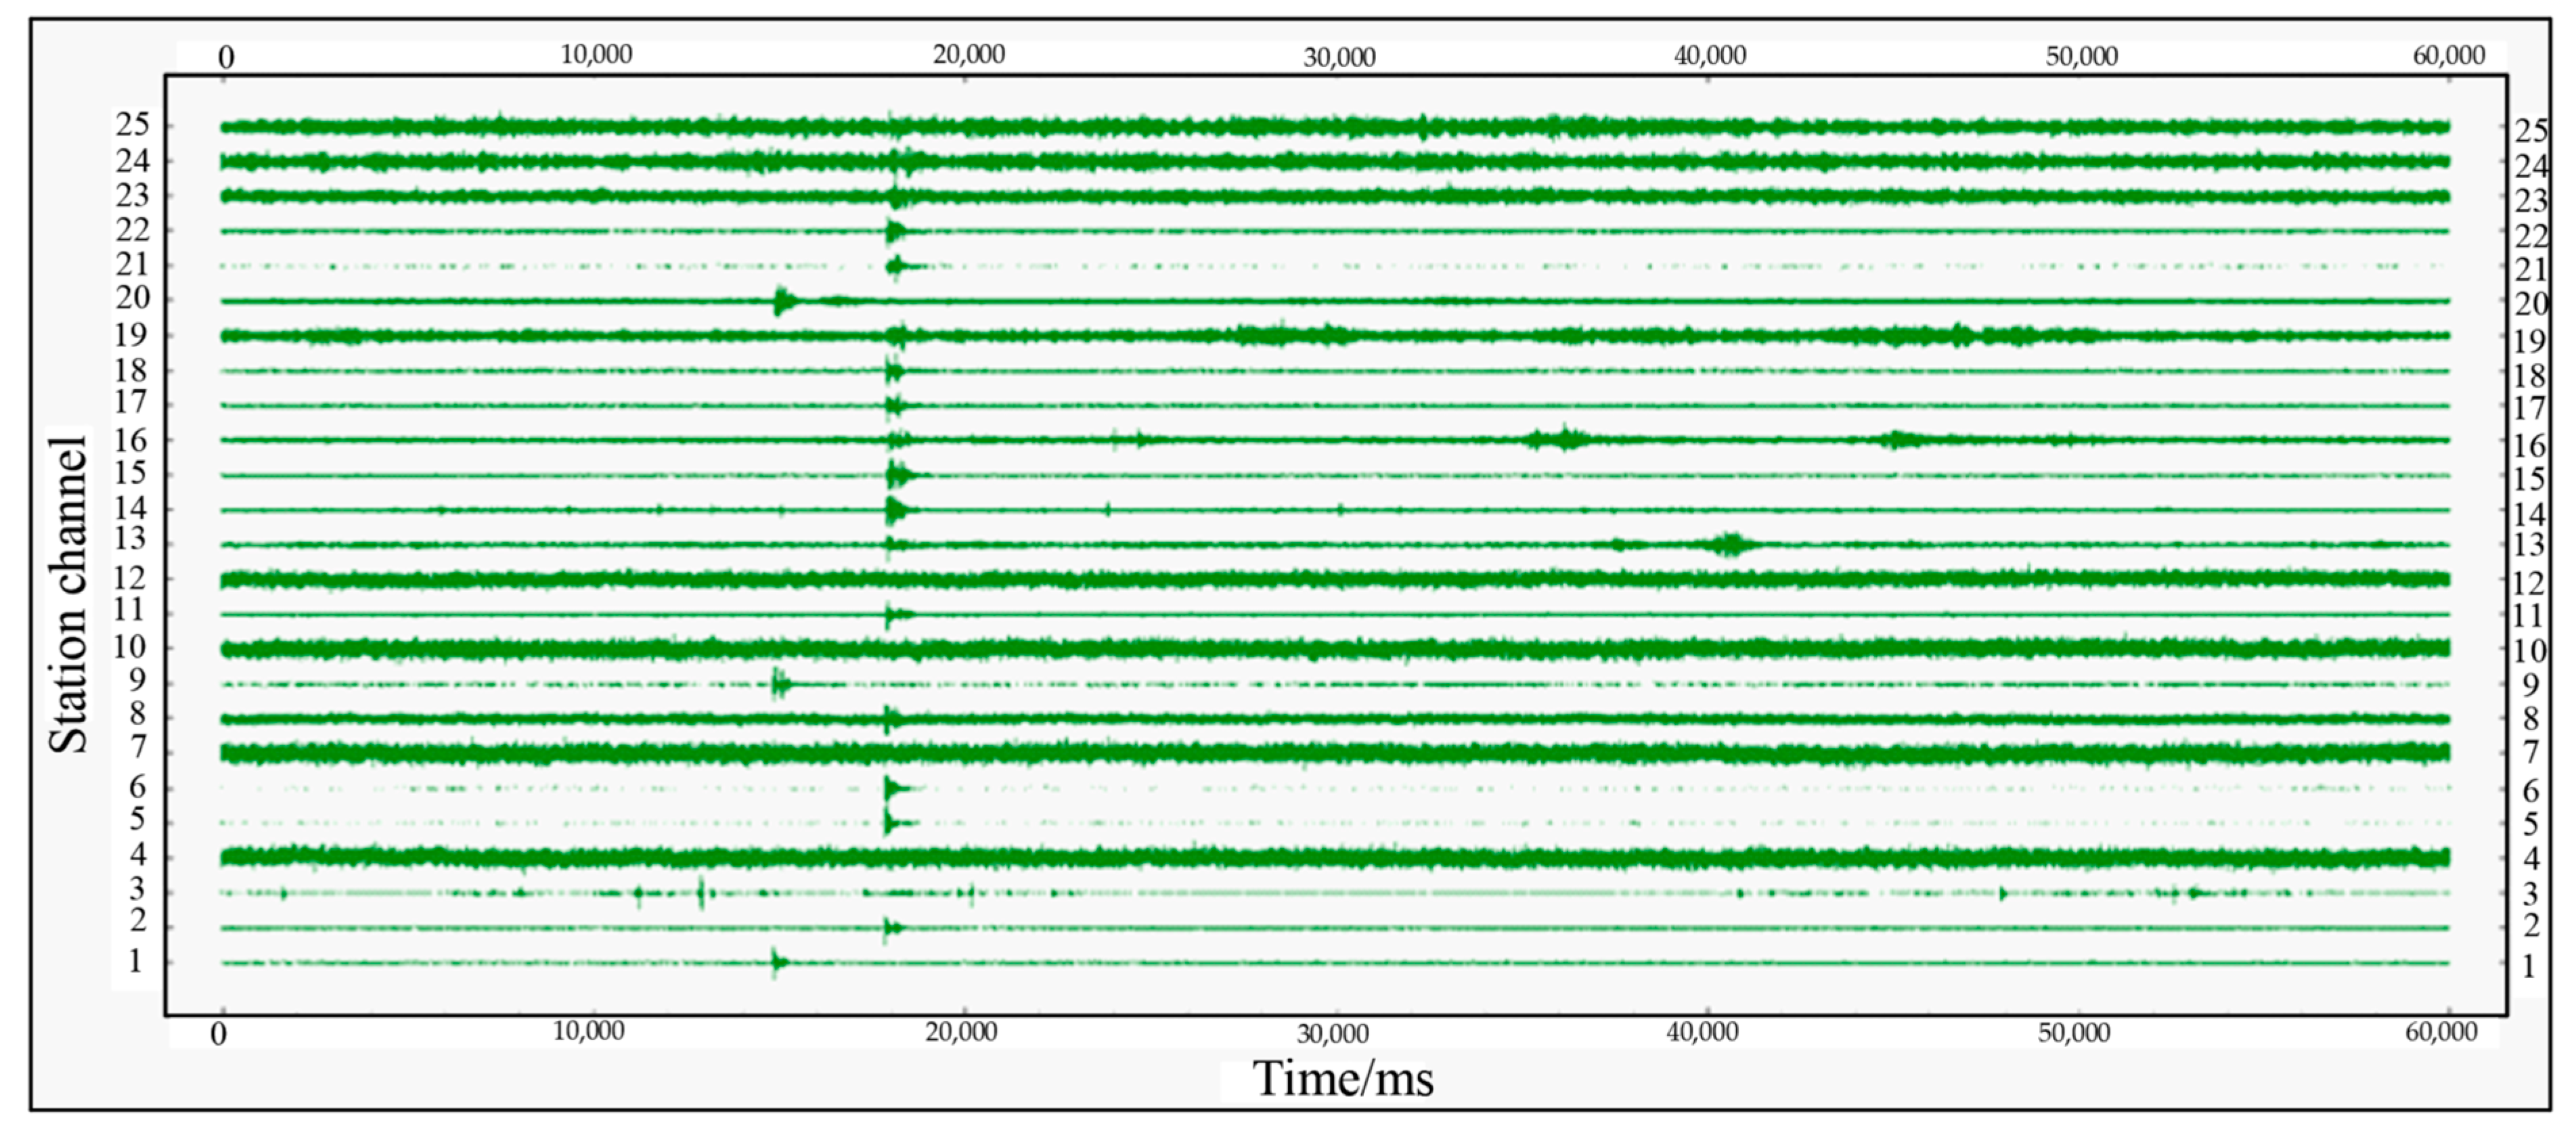
2.3. Micro-Seismic Monitoring

Micro-seismic waves are weak seismic waves generated by the rupture of rock resulting from changes in the stress field in a rock mass [42,43,44,45]. The micro-seismic source parameters obtained through signal acquisition, velocity model optimization, de-noising processing, initial pick-up, and source mechanism inversion processes provide an important basis for the evaluation of the effect of fracturing engineering in oil and gas development [46,47,48].
The present study monitored the fracturing process in well XJ-1L using 29 surface micro-seismic monitoring stations. These monitoring stations covered an area of 1300 × 660 m2, with an average distance between each station of ~250 m (Figure 2).
Micro-seismic monitoring conducted in the present study was through the OMNI2400 system (Geospace Technologies, Houston, TX, USA). These monitoring stations have a sensitivity and stationary frequency of 52 VS/m and 15–1500 Hz, respectively. During monitoring, sampling frequency was set to 1000 Hz and earthquake monitoring had a lower limit of −3, which satisfied the Nyquist sampling law [49,50]. Verification of the monitoring methods showed clear waveforms, and seismic arrival time could be accurately distinguished (Figure 3).

3. Methodology and Result

The present study recorded 1217 effective micro-seismic events for well XJ-1L, with an average of 173 events per stage. Furthermore, 525, 383, and 309 effective events were recorded in the NF, CF, and HF stages, respectively (Table 3).
Figure 4 shows the spatial distribution of all events, in which fractures were distributed in the N50°E direction.

3.1. Methodology

3.1.1. Ratio of Fracture Ellipsoid

Fracture morphology is an important indicator of the range of influence and complexity of reservoir fractures. The ratio of fracture ellipsoid (λ) is a characteristic parameter of fracture morphology [51]. We use the density clustering algorithm to calculate the λ values in the NF and HF stages. From the fracture development morphology of the previous section, the micro-seismic event points of XJ-1L well all appear in the range of 600 m × 600 m around the fracturing section, which is used as the grid boundary of the kernel density map. The grid is divided according to the number of 60 × 60, and each grid is 10 m long. Combined with the actual situation of the study area, the boundary value of the clustering factor is determined to be 1.5 × 10⁻⁵ (Figure 5).

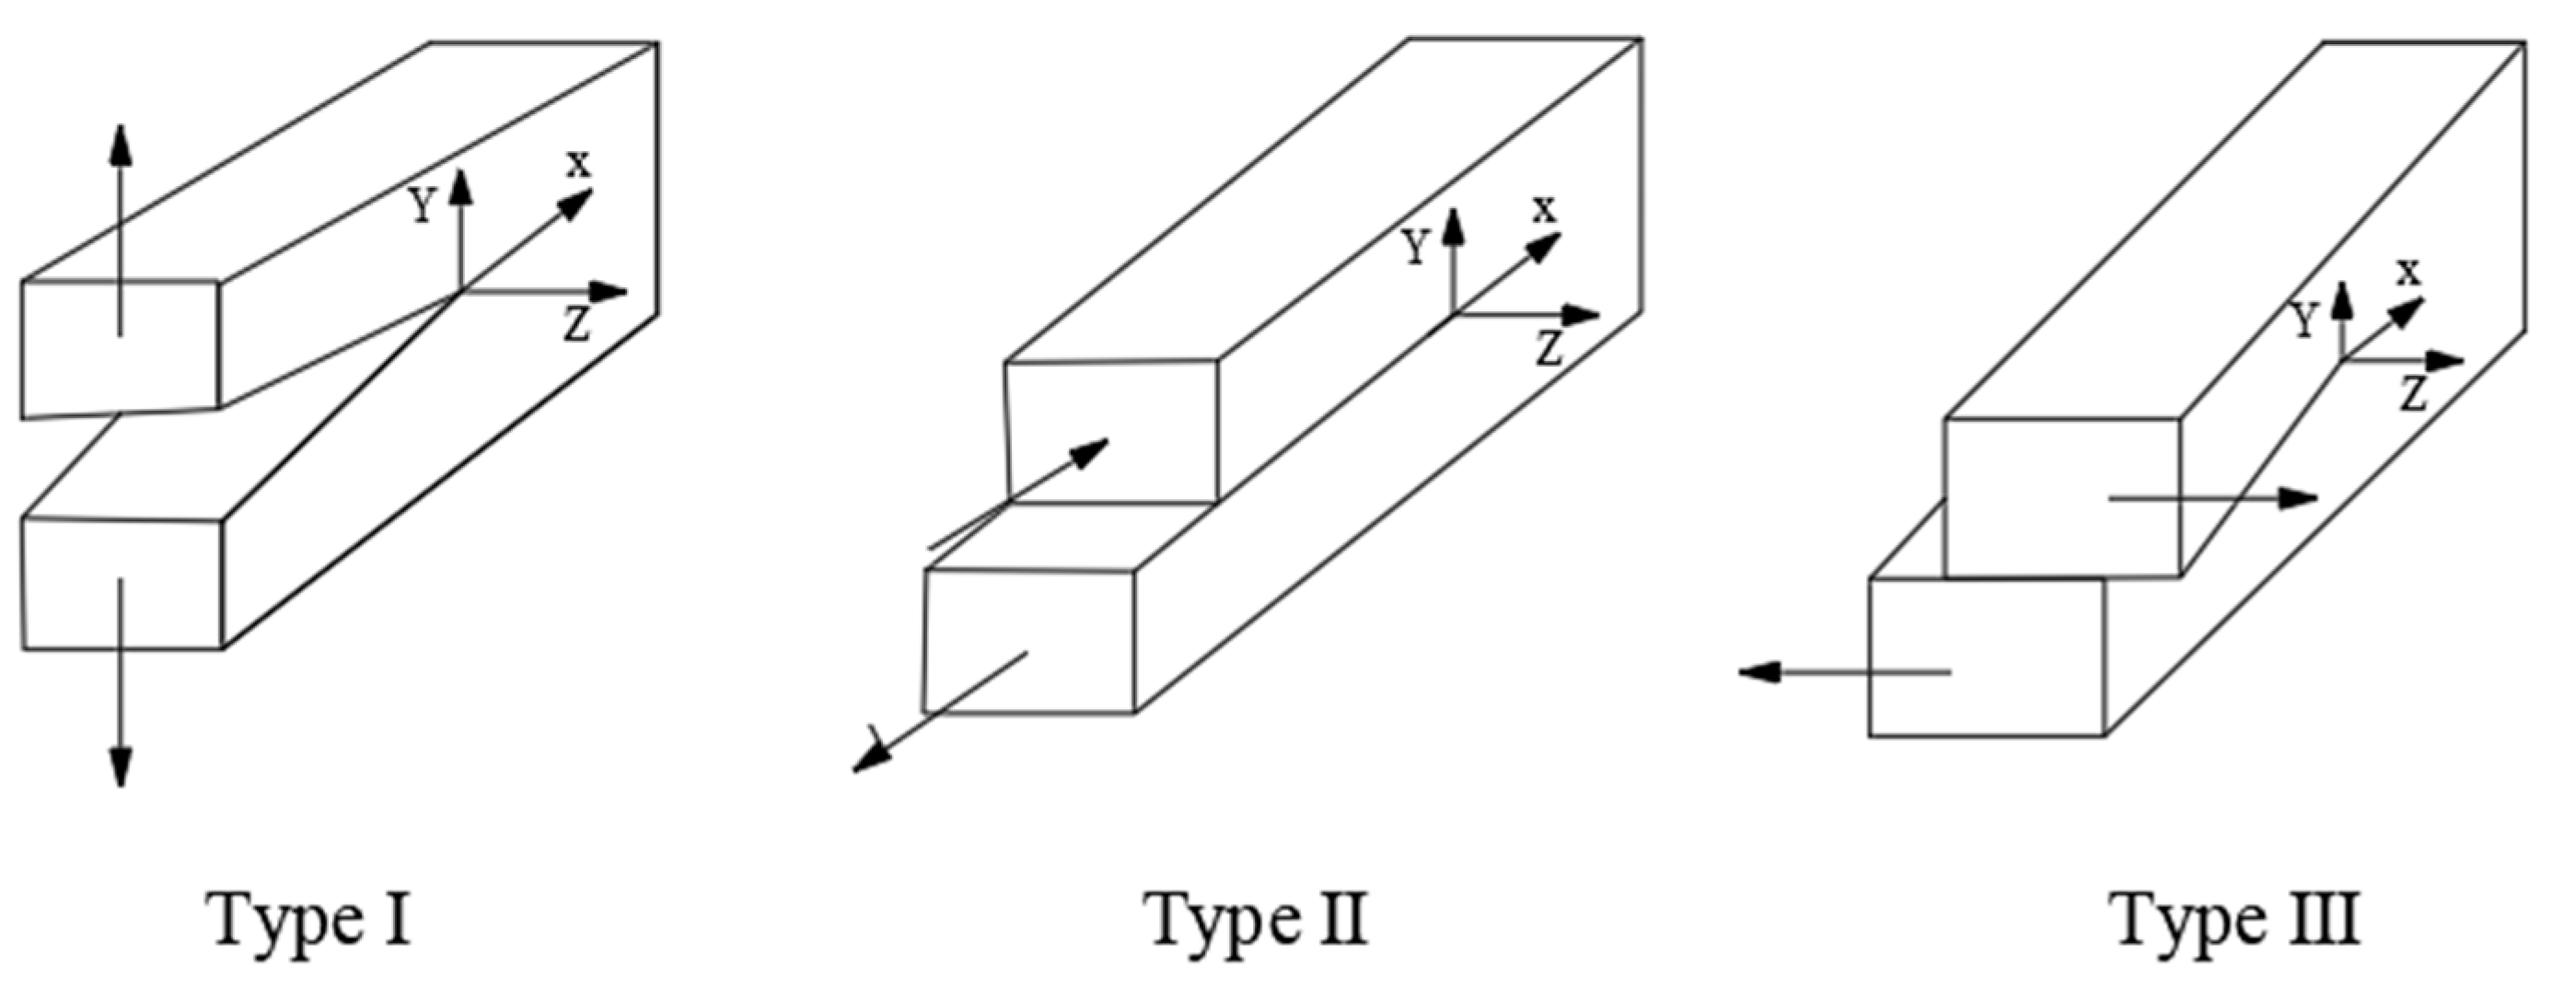
3.1.2. Micro-Seismic Focal Mechanism

The present study identified the source mechanism according to the waveform symbol received by the terrestrial geophone. Micro-seismic monitoring stations were used to record the direction of the initial vibration of the p-wave in a vertical direction as positive upward and negative downward directions. The direction of the crack and the characteristics of the source were determined based on the plane distribution of these initial vibration symbols [52]. Based on the distribution of stations’ initial vibration symbols, we can divide the crack into three types according to the fracture mechanics. If the area near the testing well is a symbol, and the area far from the testing well is another symbol, this phenomenon indicates the existence of a tensile fracture (Type I, opening cracks). If the symbols in two diagonal spaces are the same, and in the adjacent spaces are opposite, it is a strike-slip fracture (Type III, tearing cracks). If the symbols on both sides of the straight line are different, it is a dip-slip fracture (Type II, sliding cracks) (Figure 6).

3.1.3. Seismological Source Parameters

The b-value is an important source parameter reflecting the state of formation stress during an earthquake [53]. The present study applied the Gutenberg–Richter empirical formula to calculate b-values for different stages and phases:
l g N = b M + a ,
where M is the magnitude, N is the frequency of the effective micro-seismic events, and a reflects the average level of seismic activity [54,55,56].
The stress drop σ represents the difference in stress before and after the rupturing of a point on a fault during an earthquake. The Brune model is typically used to characterize σ for micro-seismic events [57]:
σ = 7 M 0 16 r 3 ,
where σ is the stress drop (MPa), M 0 is the seismic moment (N·m), and r is the fracture scale (m).

3.2. Results

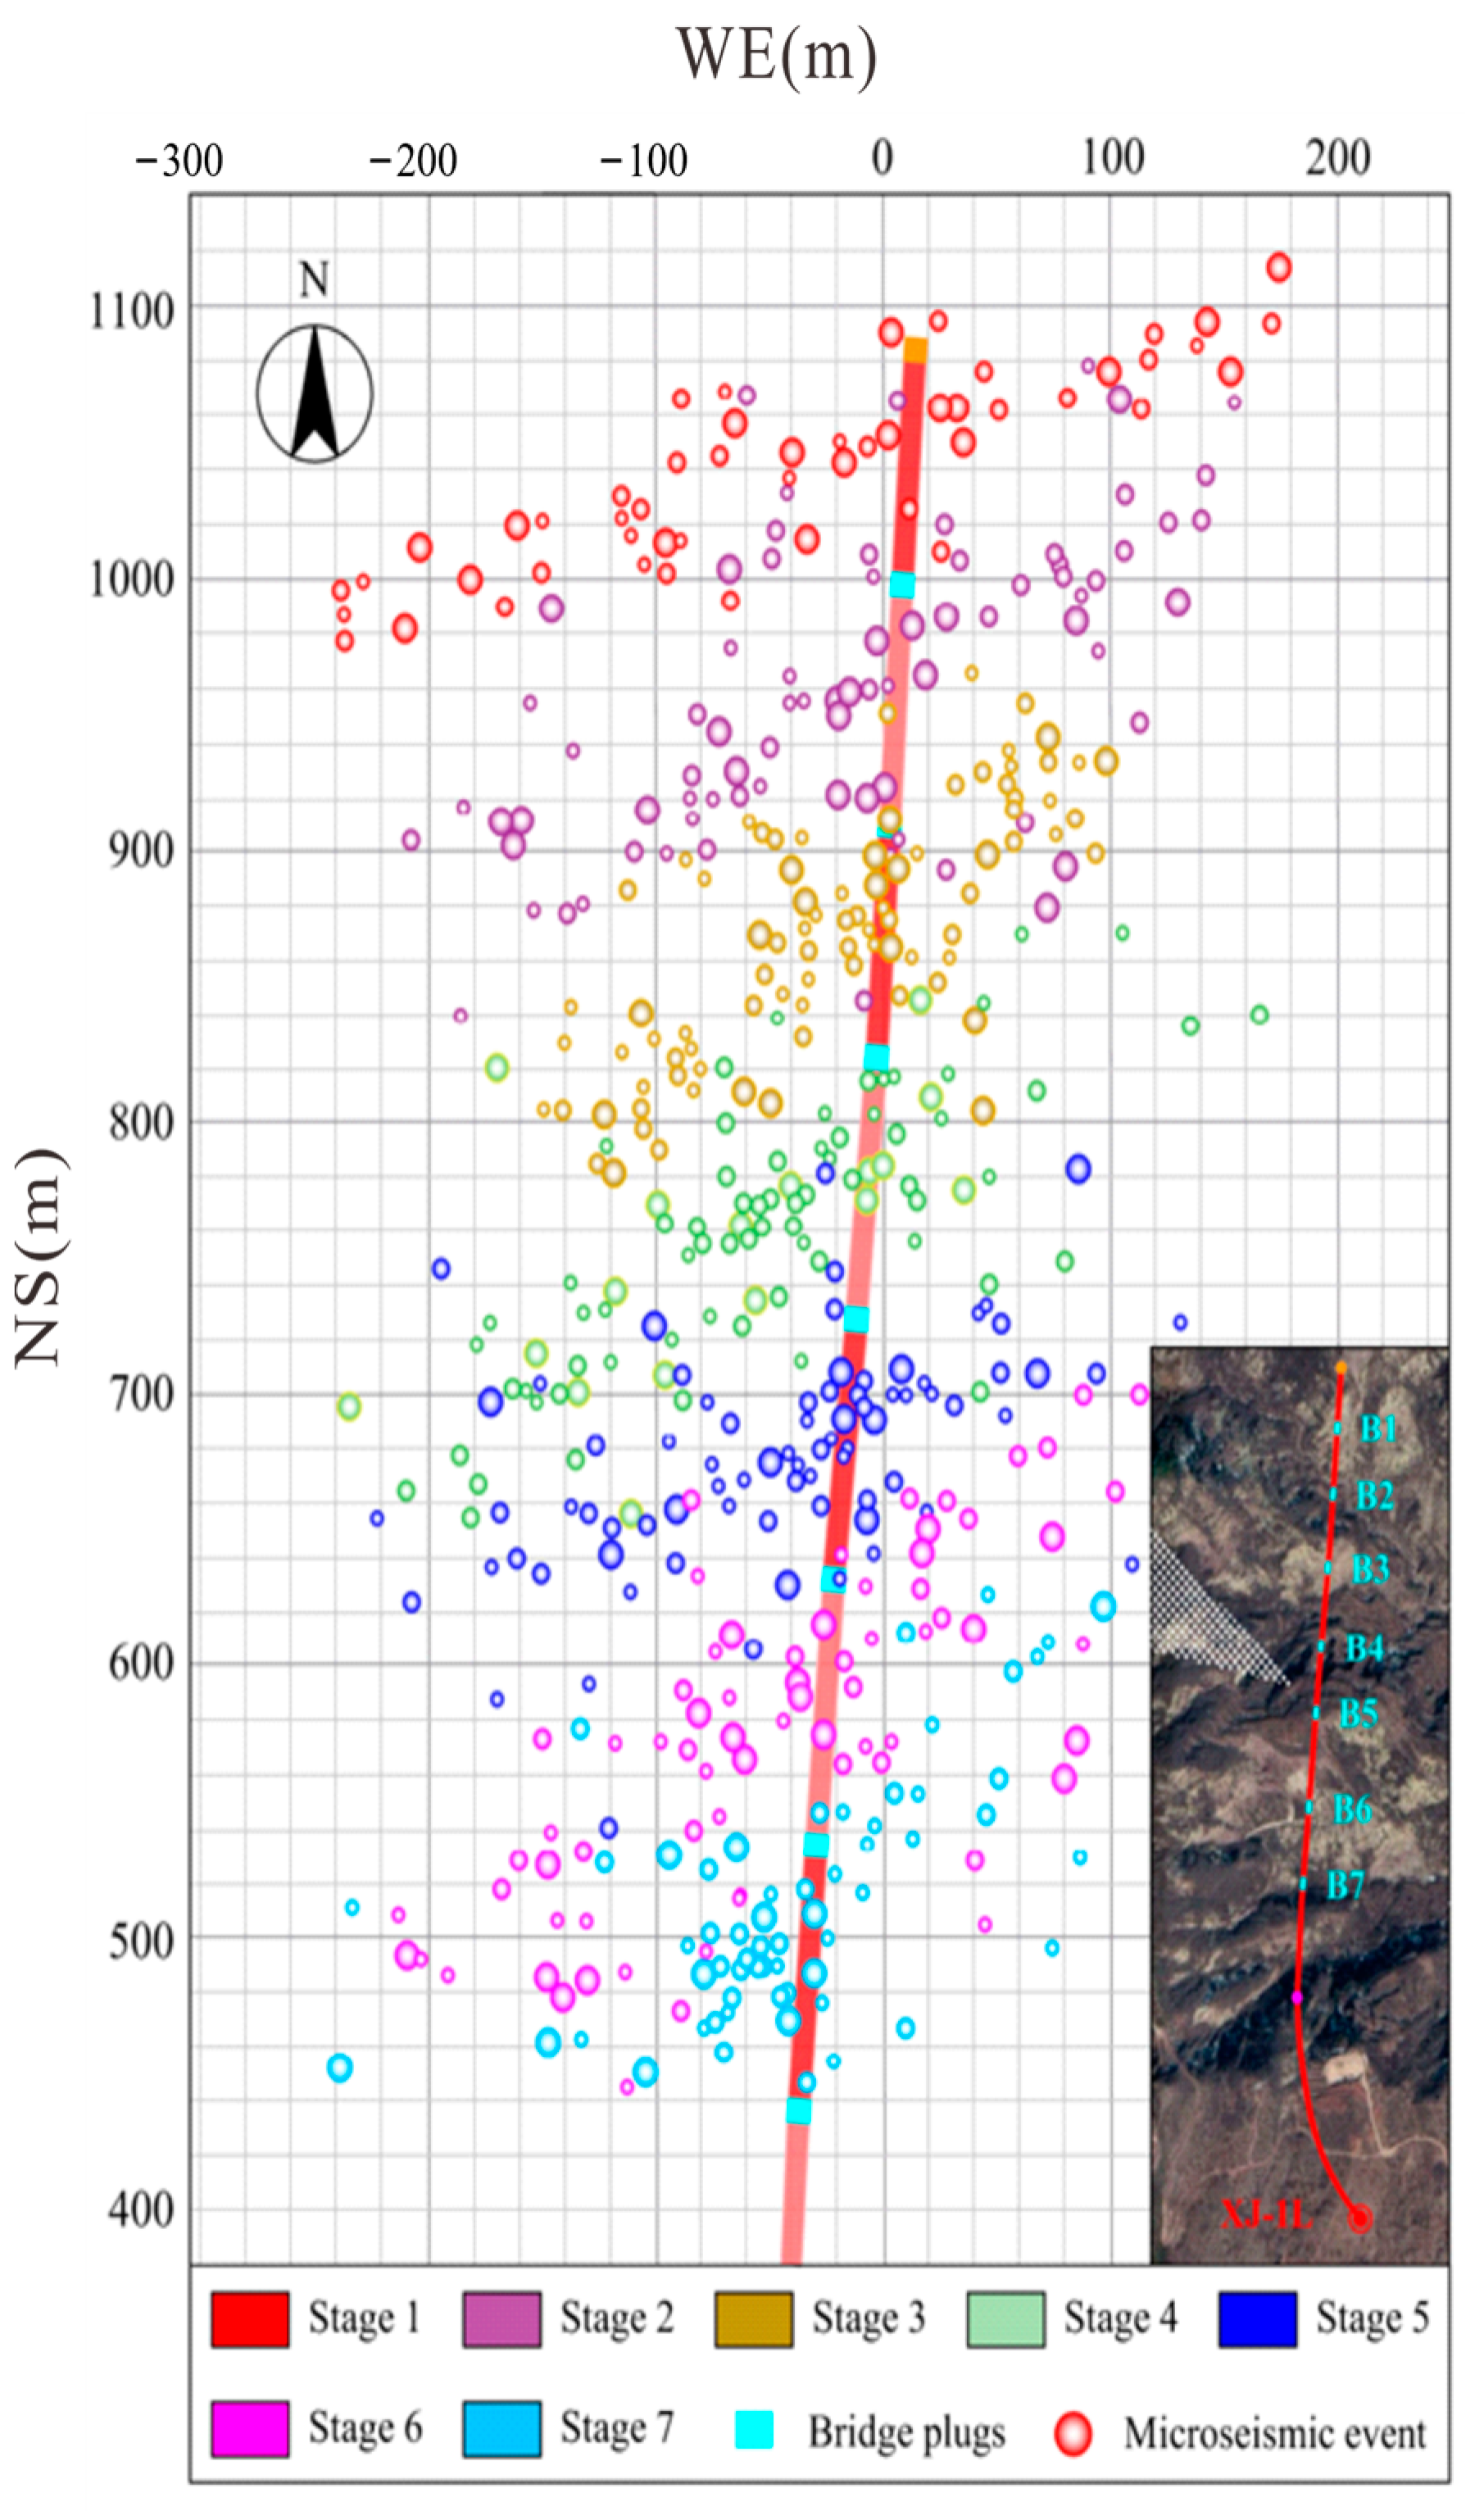
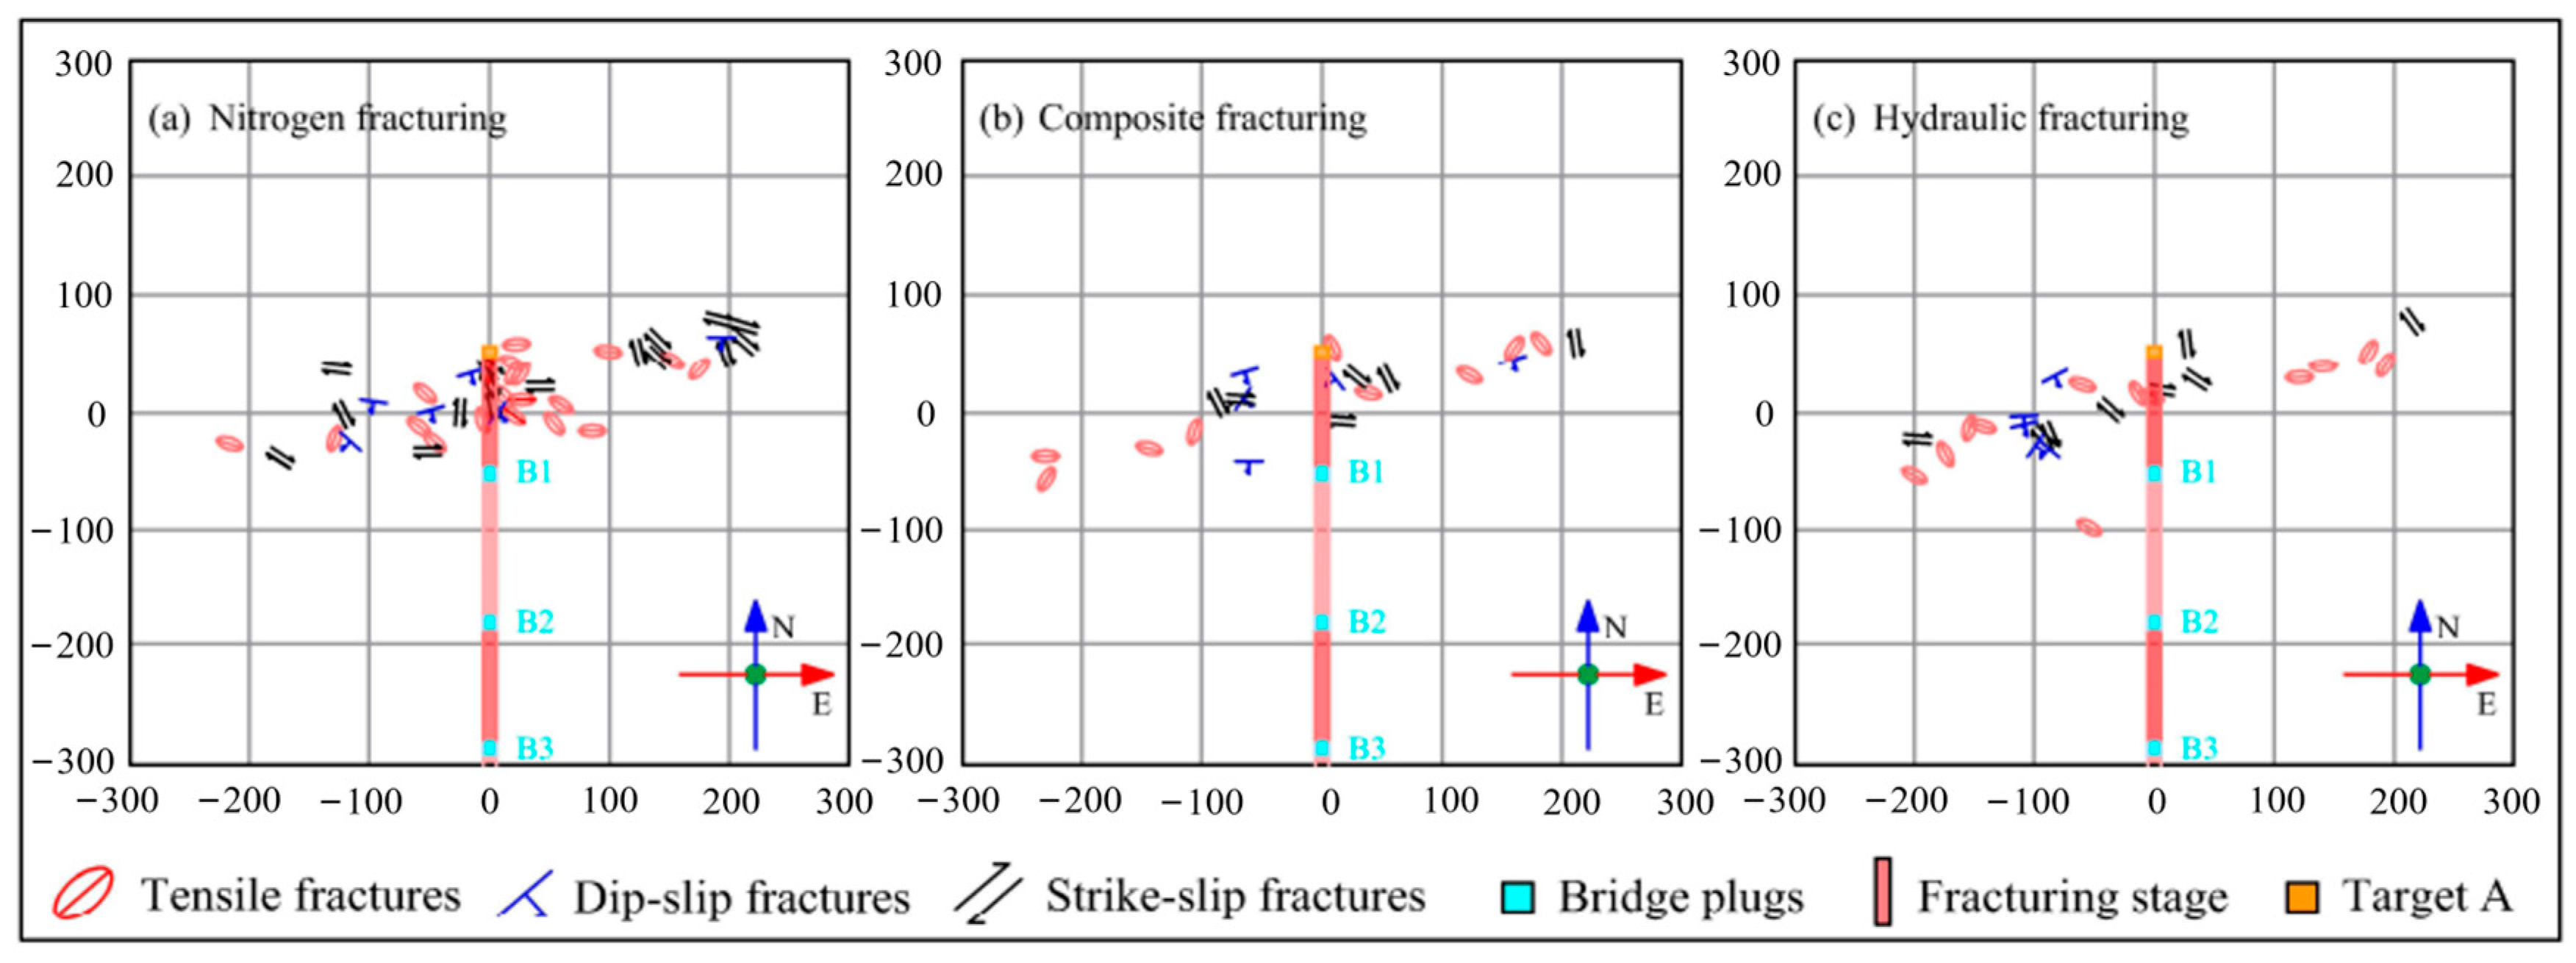
3.2.1. Fracture Morphology

Based on the method at Section 3.1.1, the λ distribution of seven fracturing sections at different injection stages is calculated respectively. As shown in Table 4, among the seven fracture stages, the λ values of the NF and HF stages were 4.08–1.32 (average of 1.99) and 5.12–1.52 (average of 2.35), respectively, with the latter stage characterized by larger λ and more evenly distributed fractures in the plane.

3.2.2. Mechanical Properties of Fractures
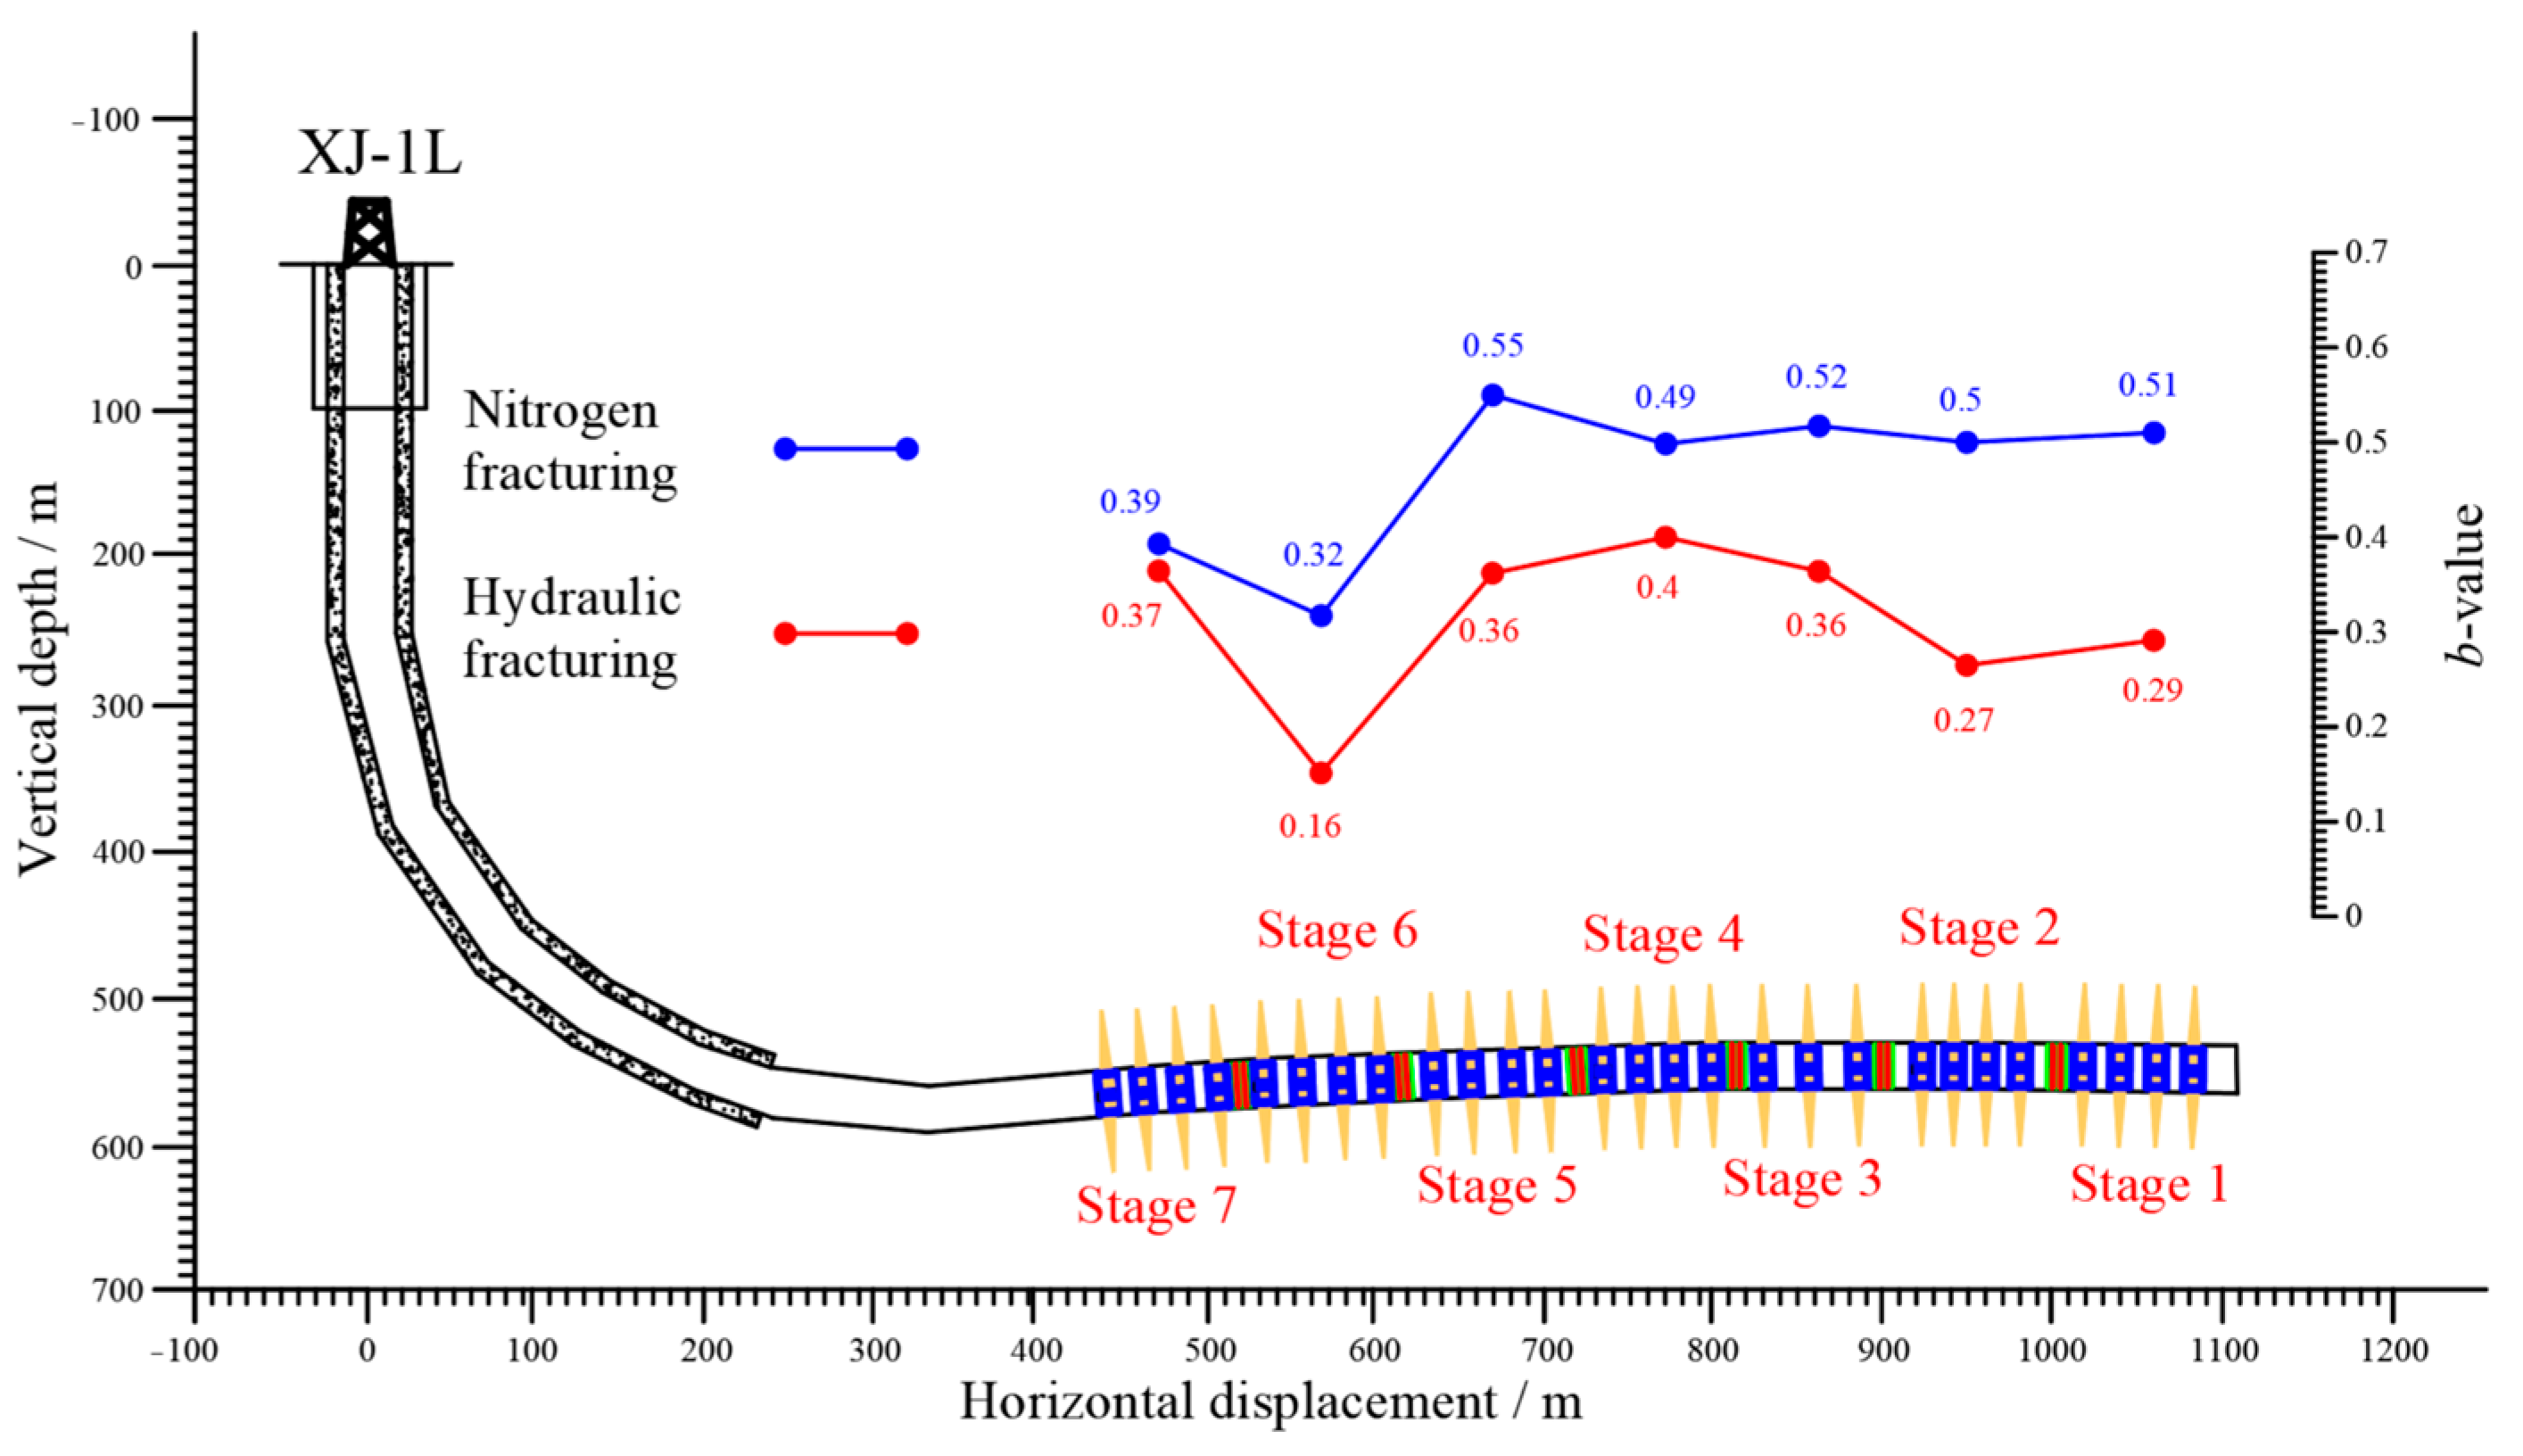
Based on the method of micro-seismic focal mechanism, we divided all the micro-seismic dots into three types. Figure 7 illustrates the characteristics of the source, as well as the location and orientation of the fractures generated during the initial fracturing process.
As presented in Table 5, the proportion of tensile fractures is highest in the third fracturing stage, including NF, CF and HF. In addition, the decrease in the proportions of tension fractures were different among the different fracturing stages as the process gradually changed from NF to HF. While the proportions of tensile fractures (Type I) decreased by 1.3%, 1.9%, 8.8%, 7.4%, 15.6%, 0.8%, and −13.1% in stages 1 to 7, those of strike-slip fractures (Type II) increased by −12.8%, 1.6%, 15.2%, 6.9%, 11.1%, 8.5%, and −0.7%, respectively.

3.2.3. b-Value

The present study calculated the distribution of b-values during the fracturing process in well XJ-1L using Equation (1). The b-values during the nitrogen fracturing stage ranged from 0.32 to 0.55, whereas those in the hydraulic fracturing stage ranged from 0.16 to 0.4 (Table 6).
Recent studies have shown that b-values of micro-seismic variations have an inverse relationship with crustal stress, with b-values decreasing with increasing stress and increasing sharply with a sudden decrease in stress during crack propagation [48]. The results of the present study showed that the b-values of the NF stage generally exceeded those of the HF stage, with these b-values indicative of in situ stress (Figure 8).
Variations in b-values were mainly dependent on the source mechanism, with rocks subjected to tensile damage typically showing higher b-values [58]. The results described in Table 5 show that the proportion of fractures resulting from tensile failure in the NF stage exceeded those in the HF stage, with corresponding differences in b-values.

3.2.4. Stress Drop

Table 7 shows a summary of calculated σ in the NF and HF stages. σ in the NF and HF stages varied between 0.037–0.178 MPa and 0.013–0.129 MPa, respectively. σ in the NF stage generally exceeded that in the HF stage, which was indicative of stress disturbance, consistent with the variation in b-values described in Table 6.

4. Discussion

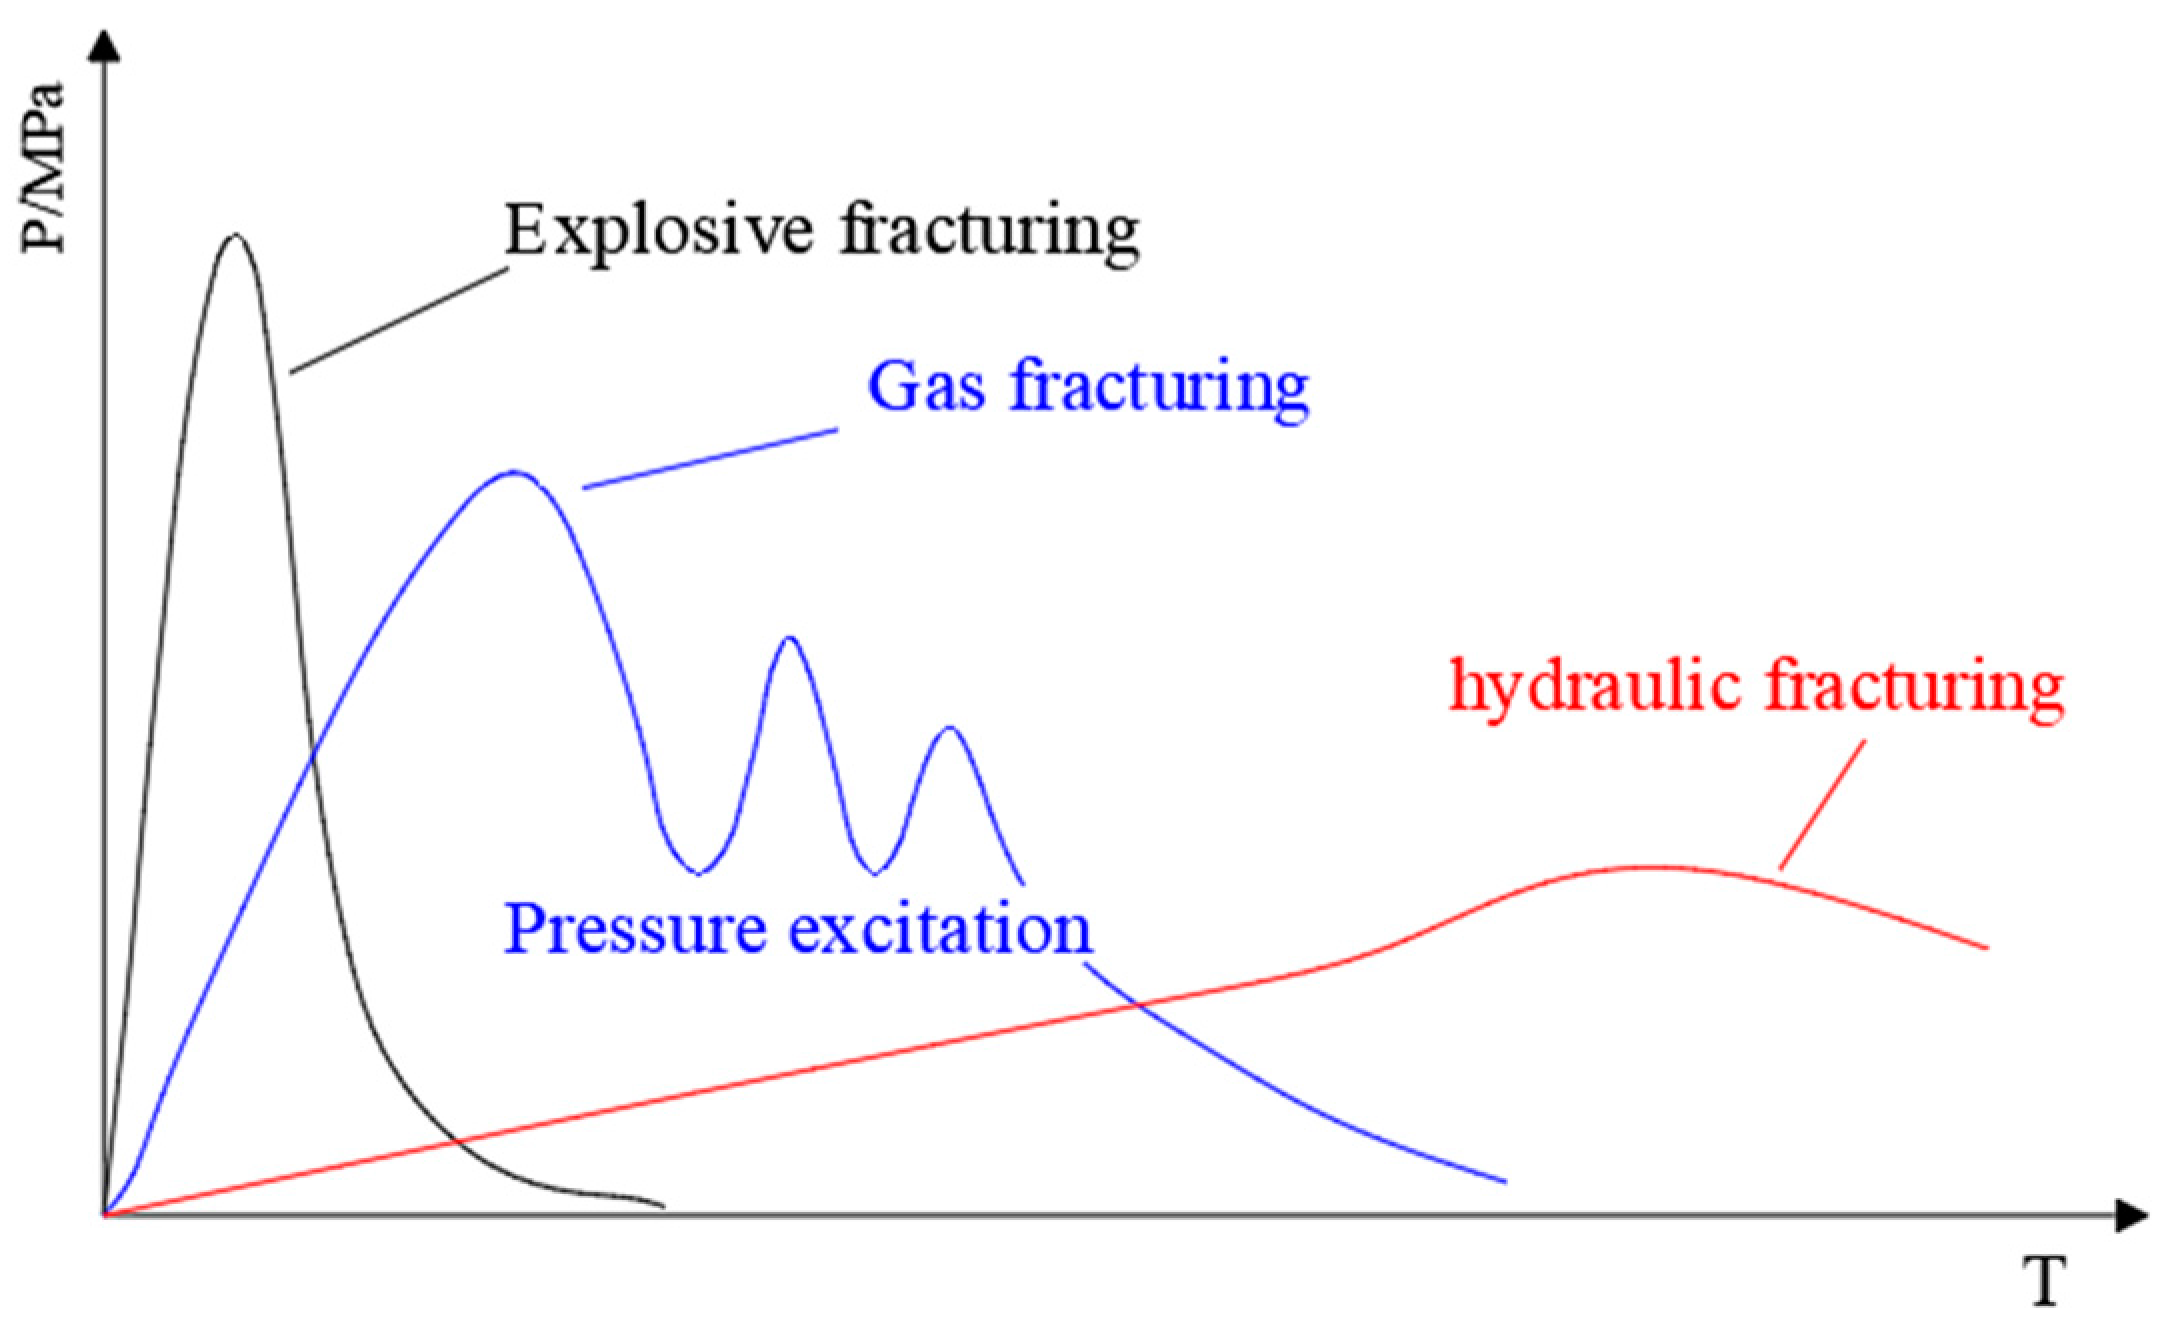
4.1. Mechanism of Gas–Water Composite Fracturing

During fracturing, the pressure of the fracturing medium shows an inverse relationship with the distance from the wellbore. A new fracture is formed when the pressure of the fracture tip exceeds the fracturing pressure of the target layer. Repeating the above process represents the development of multiple fractures. The major difference between gas fracturing and hydraulic fracturing relates to their different fracturing mediums, with gas medium generally having a stronger compressibility than water-based fracturing fluid.
In unconventional reservoirs, K is typically applied to represent the ratio of minimum horizontal effective stress to vertical effective stress [59]:
K = σ h P p σ V P p ,
which can be represented in a transformation form as:
σ h = K σ V + ( 1 K ) P p ,
where K describes the development of stress anisotropy. K typically ranges between 0 and 1 and can be used to graphically depict the change in the path of reservoir stress during fracturing.
The maximum ( σ H ), minimum ( σ h ), and vertical ( σ V ) stresses in coal #3 in the Xinjing coal mine were 11.45 MPa, 6.35 MPa, and 14.88 MPa, respectively, with the rank of these stresses by a magnitude of σ V > σ H > σ h representing normal fault stress mechanisms. Vertical stress is not affected by pore pressure under these stress conditions:
σ h P = 1 K .
During the different fracturing processes, σ h changes with changing pore pressure. For nitrogen–water composite fracturing, the above formula can be written as:
σ h H 2 o P H 2 o = σ h N 2 P N 2 .
The compressibility of gas contributes to the sensitivity of variation in gas pressure to changes in bottom-hole pressure, which facilitates excitation of bottom-hole pressure (Figure 9).
The pressure kick during NF results in changes in pore pressure and minimum horizontal stress that exceeds those during HF:
σ h N 2 > σ h H 2 o .
Injection of the fracturing fluid results in continual increases and decreases in fluid pressure and effective closing stress on the fracture surface, respectively. During this process, the Mohr circle gradually shifts to the left, with a weakening of its resistance to shear failure. At the point at which the Mohr circle is tangent to the envelope at point E, the shear slip of the natural cracks overcomes the resistance provided by effective normal stress, resulting in shear failure of the natural cracks. With further increases in fluid pressure, effective normal stress gradually decreases to zero, the Mohr circle moves to the position of the dotted line, and the fracture envelope intersects at F, at which time the natural fracture surface begins to open normally and tensile failure occurs (Figure 10a).
Consequently, the NF stage facilitates the formation of a small difference in stress on the fracture surface, during which vertical effective stress and horizontal stress are smaller than those during the HF. This results in the Mohr circle contacting the fracture envelope in the negative semi-axis, leading to tensile shear fracturing (Figure 10b).
The results of micro-seismic monitoring in the field showed that the proportions of tensile fractures formed in the NF and CF stages were 33.5% and 33.1%, respectively, whereas that in the HF stage was 30.3%, 3% lower than that in the CF stage. This result can be attributed to excitation of bottom-hole pressure due to the compressibility of nitrogen, which can result in higher reservoir pore pressure during gas fracturing, translating to an increased number of tensile fractures.

4.2. Mechanism under Which Permeability Increases during Gas–Water Composite Fracturing

As shown in Figure 11, cracks can be divided into three categories according to fracture mechanics: Type I (opening) cracks, Type II (sliding) cracks, and Type III (tearing) cracks.
Type I cracks are opening cracks formed through tensile stress applied perpendicularly to the crack surface; Type II and type III fractures are shear fractures formed by mutual sliding of the fracture surfaces under shearing stress. The fracturing of coal reservoirs increases the permeability of the coal reservoir. It is generally believed that Type I fractures are the main contributors to coal reservoir permeability, followed by Type II and III fractures. This ranking can be related to the larger fracture width of Type I fractures among the three fracture categories, which facilitates gas migration.
In situ stress can act as a sensitive index of reservoir permeability since the release of in situ stress increases reservoir permeability. The results of micro-seismic monitoring showed an average stress drop during HF of 0.06 MPa, whereas that under NF was 50% higher at 0.09 MPa. Since the results of field monitoring were in good agreement with the results of theoretical analysis, the underlying mechanism of gas fracturing and gas–water composite fracturing proposed in the present study is reasonable.

5. Conclusions

The present study evaluated the mechanism under which composite fracturing decreases the permeability of a coalbed by conducting micro-seismic monitoring of well XJ-1L and analysis of source parameters, including the mechanical properties of fractures, b-values, and stress drop. A theoretical basis for the increased production of tensile fractures through gas fracturing was proposed based on gas compressibility and its fracture characteristics. The following conclusions were reached.
(1)
The NF, CF, and HF stages were characterized by different mechanical properties of the produced fractures. The proportion of tensile fractures decreased from 33.5% to 30.3%, with an increased proportion in the fracturing fluid, whereas the proportion of strike-slip fractures increased from 50.4% to 54.6%.
(2)
The stress drop σ and b-value in the NF stages exceeded those in the HF stages, with an average of twice as large, which represented higher stress disturbance. This result further supports the assertion of a more significant number of tensile fractures being formed in the NF stage.
(3)
The theoretical basis for the formation of a more significant number of tensile fractures through gas fracturing and the higher permeability of NF was proposed based on the influence of gas compressibility and pore pressure on coal fractures.
The research results of this study can provide a theoretical and practical basis for the optimal exploitation of low-permeability coal reservoirs.

Author Contributions

M.W.: methodology, investigation, data analysis, writing—original draft and editing. L.T.: methodology, experimental guidance, writing—review and editing. J.W.: methodology, investigation, data analysis. Y.C.: conceptualization, project administration, funding acquisition, supervision, writing—review and editing. L.W.: conceptualization, methodology, data analysis. B.S.: investigation, data analysis. M.S., S.L. and Y.H.: conceptualization, methodology, writing and editing. All authors have read and agreed to the published version of the manuscript.

Funding

This work was funded by the National Natural Science Foundation of China (grant no. 42230814, grant no. 12272126) and the Scientific and Technological Project in Henan Province (grant no. 222102320090).

Data Availability Statement

The datasets used and/or analyzed during the current study are available from the corresponding author on reasonable request.

Conflicts of Interest

The authors declare no conflicts of interest.

References

  1. Jeffrey, R. Hydraulic Fracturing for Coal Seam Gas (CSG) Stimulation in NSW; Report EP122949; CSIRO Earth Science and Resource Engineering: Canberra, ACT, Australia, 2012. [Google Scholar]
  2. Lei, Q.; Xu, Y.; Cai, B.; Guan, B.; Wang, X.; Bi, G.; Li, H.; Li, S.; Ding, B.; Fu, F.; et al. Progress and prospects of horizontal well fracturing technology for shale oil and gas reservoirs. Pet. Explor. Dev. 2022, 49, 191–199. [Google Scholar] [CrossRef]
  3. Liang, W.; Yan, J.; Zhang, B.; Hou, D. Review on coal bed methane recovery theory and technology: Recent progress and perspectives. Energy Fuels. 2021, 35, 4633–4643. [Google Scholar] [CrossRef]
  4. Hu, Q.; Liu, L.; Li, Q.; Wu, Y.; Wang, X.; Jiang, Z.; Wu, X. Experimental investigation on crack competitive extension during hydraulic fracturing in coal measures strata. Fuel 2020, 265, 117003. [Google Scholar] [CrossRef]
  5. Mou, P.; Pan, J.; Wang, K.; Wei, J.; Yang, Y.; Wang, X. Influences of hydraulic fracturing on microfractures of high-rank coal under different in-situ stress conditions. Fuel 2021, 287, 119566. [Google Scholar] [CrossRef]
  6. Detournay, E. Slickwater hydraulic fracturing of shales. J. Fluid Mech. 2020, 886, F1. [Google Scholar] [CrossRef]
  7. Su, X.; Li, F.; Su, L.; Wang, Q. The experimental study on integrated hydraulic fracturing of coal measures gas reservoirs. Fuel 2020, 270, 117527. [Google Scholar] [CrossRef]
  8. Zhao, J.; Liu, P.; Li, J.; Chen, Z.; Li, Y.; Li, F. Fracture propagation induced by hydraulic fracturing using microseismic monitoring technology: Field test in CBM wells in Zhengzhuang region, Southern Qinshui Basin, China. Front. Earth Sci. 2023, 11, 1130280. [Google Scholar] [CrossRef]
  9. Scott, M.P.; Johnson, J.R.; Spilsbury-Schakel, J.; Garnett, A. Technology review of the Northern Bowen and Galilee basins. APPEA J. 2023, 63, 90–109. [Google Scholar] [CrossRef]
  10. McCarthy, C.; Garcia, M. Hydraulic Fracturing Placement Issues on Horizontal Wells in the Mancos Shale, San Juan Basin: Case Study of Possible Causes, Solutions, and Results. In Proceedings of the SPE Rocky Mountain Petroleum Technology Conference/Low-Permeability Reservoirs Symposium 2016, Denver, CO, USA, 14–16 April 2016; p. SPE-180252. [Google Scholar]
  11. Freyman, M. Hydraulic Fracturing & Water Stress: Water Demand by the Numbers; Ceres: Boston, MA, USA, 2014; p. 85. [Google Scholar]
  12. Chen, H.; Carter, K.E. Water usage for natural gas production through hydraulic fracturing in the United States from 2008 to 2014. J. Environ. Manag. 2016, 170, 152–159. [Google Scholar] [CrossRef]
  13. Tian, L.; Cao, Y.; Chai, X.; Liu, T.; Feng, P.; Feng, H.; Rodvelt, G. Best practices for the determination of low-pressure/permeability coalbed methane reservoirs, Yuwu Coal Mine, Luan mining area, China. Fuel 2015, 160, 100–107. [Google Scholar] [CrossRef]
  14. Cao, Y.; Zhang, J.; Zhai, H.; Fu, G.; Tian, L.; Liu, S. CO2 gas fracturing: A novel reservoir stimulation technology in low permeability gassy coal seams. Fuel 2017, 203, 197–207. [Google Scholar] [CrossRef]
  15. Cao, Y.; Shi, B.; Tian, L.; LI, F.; CAO, Y.; Dong, S.; Zhou, D. Development and application of dense multi-cluster fracturing in horizontal wells for low permeability and low-pressure coal reservoir. J. China Coal Soc. 2020, 45, 3512–3521. [Google Scholar]
  16. Longinos, S.N.; Dillinger, A.; Wang, L.; Hazlett, R. Uniaxial compressive strength (UCS) and SEM study of liquid nitrogen for waterless hydraulic fracturing in coalbed methane reservoirs of Karaganda Basin in Kazakhstan. Gas Sci. Eng. 2023, 115, 204998. [Google Scholar] [CrossRef]
  17. Longinos, S.N.; Abbas, A.H.; Bolatov, A.; Skrzypacz, P.; Hazlett, R. Application of Image Processing in Evaluation of Hydraulic Fracturing with Liquid Nitrogen: A Case Study of Coal Samples from Karaganda Basin. Appl. Sci. 2023, 13, 7861. [Google Scholar] [CrossRef]
  18. Longinos, S.N.; Serik, A.; Bayramov, E.; Junussov, M.; Begaliyev, D.; Hazlett, R. Laboratory Study of Liquid Nitrogen Cryo-Fracturing as an Environmentally Friendly Approach for Coalbed Methane (CBM) Reservoirs. Energies 2024, 17, 2359. [Google Scholar] [CrossRef]
  19. Huang, Z.; Zhang, S.; Yang, R.; Wu, X.; Li, R.; Zhang, H.; Hung, P. A review of liquid nitrogen fracturing technology. Fuel 2020, 266, 117040. [Google Scholar] [CrossRef]
  20. Qin, L.; Zhang, X.; Zhai, C.; Lin, H.; Lin, S.; Wang, P.; Li, S. Advances in liquid nitrogen fracturing for unconventional oil and gas development: A review. Energy Fuels 2022, 36, 2971–2992. [Google Scholar] [CrossRef]
  21. Cao, Y.; Shi, F.; Zhou, D.; Wu, H.; Liu, T.; Tian, L. Study and application of stimulation technology for low production CBM well through high pressure N2 Injection-soak. J. China Coal Soc. 2019, 44, 2556–2565. [Google Scholar]
  22. Ni, X. Study on improving coal-bed gas recovery rate by hydraulic fracturing and nitrogen injection of borehole. Min. Saf. Environ. Prot. 2012, 39, 1–5. [Google Scholar]
  23. Shi, B. Study on the Permeability Enhancement Mechanism of Nitrogen-Hydraulic Composite Fracturing in Coal Reservoirs; Henan Polytechnic University: Jiaozuo, China, 2022. [Google Scholar]
  24. Zhang, L.; Chen, S.; Zhang, C.; Fang, X.; Li, S. The characterization of bituminous coal microstructure and permeability by liquid nitrogen fracturing based on μCT technology. Fuel 2020, 262, 116635. [Google Scholar] [CrossRef]
  25. Xue, Y.; Liu, J.; Ranjith, P.G.; Gao, F.; Xie, H.; Wang, J. Changes in microstructure and mechanical properties of low-permeability coal induced by pulsating nitrogen fatigue fracturing tests. Rock Mech. Rock Eng. 2022, 55, 7469–7488. [Google Scholar] [CrossRef]
  26. Qin, L.; Ma, C.; Li, S.; Lin, H.; Wang, P.; Long, H.; Yan, D. Mechanical damage mechanism of frozen coal subjected to liquid nitrogen freezing. Fuel 2022, 309, 122124. [Google Scholar] [CrossRef]
  27. Liang, X.; Hou, P.; Xue, Y.; Yang, X.; Gao, F.; Liu, J. A fractal perspective on fracture initiation and propagation of reservoir rocks under water and nitrogen fracturing. Fractals 2021, 29, 2150189. [Google Scholar] [CrossRef]
  28. Detournay, E. Mechanics of hydraulic fractures. Annu. Rev. Fluid Mech. 2016, 48, 311–339. [Google Scholar] [CrossRef]
  29. Cao, T.; Yang, Z.; Qin, Y.; Yan, Z.; Chen, Z.; Li, C. Characteristics of modern geostress and removability of No. 15 coal reservoir, Yangquan mining area, China. Nat. Resour. Res. 2021, 30, 2211–2223. [Google Scholar] [CrossRef]
  30. Jia, Y.; Xie, X.; Lu, A. Geological and gas-content features of coalbed methane system in Qinshui Basin, Shanxi. Appl. Mech. Mater. 2012, 170, 1187–1191. [Google Scholar] [CrossRef]
  31. Liu, B.; Chang, S.; Zhang, S.; Li, Y.; Yang, Z.; Liu, Z.; Chen, Q. Seismic-Geological Integrated Study on Sedimentary Evolution and Peat Accumulation Regularity of the Shanxi Formation in Xinjing Mining Area, Qinshui Basin. Energies 2022, 15, 1851. [Google Scholar] [CrossRef]
  32. Li, L.; Jiang, B.; Li, M.; Liu, J.; Ren, J. Tectonic characteristics and evolution analysis of Xinjing coal mine in Yangquan. Coal Technol. 2014, 33, 84–86. [Google Scholar]
  33. Chang, S.; Liu, J.; Zhang, S.; Shi, X.; Liu, Z.; Yang, Z. Geological control of tectonic coal distribution and its integrated seismic geological prediction method: A case study of No.3 coal seam in Xinjing mine, Yangquan, Qinshui Basin. Geophys. Prospect. Pet. 2023, 62, 43–55. [Google Scholar]
  34. Longinos, S.N.; Wang, L.; Hazlett, R. Advances in cryogenic fracturing of coalbed methane reservoirs with LN2. Energies 2022, 15, 9464. [Google Scholar] [CrossRef]
  35. Longinos, S.N.; Serik, A.; Zhang, D.; Wang, L.; Hazlett, R. Experimental Evaluation of Liquid Nitrogen Fracturing on the Coal Rocks in Karaganda Basin, Kazakhstan. Arab. J. Sci. Eng. 2023, 48, 16623–16638. [Google Scholar] [CrossRef]
  36. Wang, Q.; Su, X.; Feng, Y.; Wang, H.; Song, J. Experimental study of gas-water two-phase flow patterns in fracture: Implication for enhancing coalbed methane production. J. Pet. Sci. Eng. 2021, 207, 109168. [Google Scholar] [CrossRef]
  37. Li, X.; Cheng, Y.; Tao, W.; Sarulicaoketi, S.; Ji, X.; Yin, C. Experimental Study on Enhanced Oil Recovery by Nitrogen-Water Alternative Injection in Reservoir with Natural Fractures. Geofluids 2021, 2021, 1–9. [Google Scholar] [CrossRef]
  38. Feng, Y.; Haugen, K.; Firoozabadi, A. Phase-field simulation of hydraulic fracturing by CO2, water and nitrogen in 2D and comparison with laboratory data. J. Geophys. Res. Solid Earth 2021, 126, e2021JB022509. [Google Scholar] [CrossRef]
  39. Hou, P. Fracturing Mechanism and Permeability Enhancements Effect Induced by Gas Fracturing in Low Permeability Reservoir Rocks; China University of Mining & Technology: Beijing, China, 2018. [Google Scholar]
  40. Xu, D. Analysis on production increasing mechanism and crack extension law of compound fracturing. Petrochem. Ind. Appl. 2015, 34, 17–19. [Google Scholar]
  41. Sun, Q. Research and Application of the Technology of Liquid Powder-High Energy Gas and Hydraulic Composite Fracturing. Sino-Glob. Energy 2010, 15, 60–62. [Google Scholar]
  42. Li, L.; Tan, J.; Wood, D.A.; Zhao, Z.; Becker, D.; Lyu, Q.; Chen, H. A review of the current status of induced seismicity monitoring for hydraulic fracturing in unconventional tight oil and gas reservoirs. Fuel 2019, 242, 195–210. [Google Scholar] [CrossRef]
  43. Tian, L.; Cao, Y.; Liu, S.; Shi, B.; Liu, J.; Elsworth, D. Coalbed methane reservoir fracture evaluation through the novel passive microseismic survey and its implications on permeable and gas production. J. Nat. Gas Sci. Eng. 2020, 76, 103181. [Google Scholar] [CrossRef]
  44. Schultz, R.; Skoumal, R.J.; Brudzinski, M.R.; Eaton, D.; Baptie, B.; Ellsworth, W. Hydraulic fracturing-induced seismicity. Rev. Geophys. 2020, 58, e2019RG000695. [Google Scholar] [CrossRef]
  45. Li, L.; Tan, J.; Tan, Y.; Pan, X.; Zhao, Z. Microseismic analysis to aid gas reservoir characterization. In Sustainable Geoscience for Natural Gas Subsurface Systems; Elsevier: Amsterdam, The Netherlands, 2022; pp. 219–242. [Google Scholar]
  46. Atkinson, G.M.; Eaton, D.W.; Igonin, N. Developments in understanding seismicity triggered by hydraulic fracturing. Nat. Rev. Earth Environ. 2020, 1, 264–277. [Google Scholar] [CrossRef]
  47. Wessels, S.A.; De La Peña, A.; Kratz, M.; Williams-Stroud, S.; Jbeili, T. Identifying faults and fractures in unconventional reservoirs through microseismic monitoring. First Break 2011, 29, 99–104. [Google Scholar] [CrossRef]
  48. Tian, L.; Li, Z.; Cao, Y.; Liu, S.; Song, Y. In situ stress distribution and variation monitored by microseismic tracking on a fractured horizontal well: A case study from the Qinshui basin. ACS Omega 2022, 7, 14363–14370. [Google Scholar] [CrossRef]
  49. Mishali, M.; Eldar, Y.C. Sub-nyquist sampling. IEEE Signal Process. Mag. 2011, 28, 98–124. [Google Scholar] [CrossRef]
  50. Romanov, E.; Ordentlich, O. Above the Nyquist rate, modulo folding does not hurt. IEEE Signal Process. Lett. 2019, 26, 1167–1171. [Google Scholar] [CrossRef]
  51. Xiong, Q.; Hampton, J.C. Semi-Empirical Error Ellipsoid Clustering for Identifying the Second-Order Structural Features from a Laboratory AE Source Location Cloud: Method, Validation, and Application to a Hydraulic Fracturing Test. Earth Space Sci. 2022, 9, e2022EA002349. [Google Scholar] [CrossRef]
  52. Liu, J. A Method for Analyzing the Source Mechanism Using Microseismic. China Patent CN103076634B, 8 July 2015. [Google Scholar]
  53. El-Isa, Z.H.; Eaton, D.W. Spatiotemporal variations in the b-value of earthquake magnitude–frequency distributions: Classification and causes. Tectonophysics 2014, 615, 1–11. [Google Scholar] [CrossRef]
  54. Li, B.; Ding, Q.; Xu, N.; Dai, F.; Xu, Y.; Qu, H.L. Characteristics of microseismic b-value associated with rock mass large deformation in underground powerhouse caverns at different stress levels. J. Cent. South Univ. 2022, 29, 693–711. [Google Scholar] [CrossRef]
  55. Feng, R.; Luo, H.; Chen, Z.; Zhang, F. Integrated microseismic and geomechanical analysis of hydraulic fracturing induced fault reactivation: A case study in Sichuan Basin, Southwest China. Geomech. Geophys. Geo-Energy Geo-Resour. 2023, 9, 48. [Google Scholar] [CrossRef]
  56. Arroyo-Solórzano, M.; Linkimer, L. Spatial variability of the b-value and seismic potential in Costa Rica. Tectonophysics 2021, 814, 228951. [Google Scholar] [CrossRef]
  57. Brune, J.N. Tectonic stress and the spectra of seismic shear waves from earthquake. J. Geophys. Res. 1970, 75, 4997–5009. [Google Scholar] [CrossRef]
  58. Xu, N.; Dai, F.; Zhou, Z.; Sha, C.; Tang, C. Study of characteristics of b value for microseismic events in high rock slope. Chin. J. Rock Mech. Eng. 2014, 33, 3368–3374. [Google Scholar]
  59. Hillis, R.R. Coupled changes in pore pressure and stress in oil fields and sedimentary basins. Pet. Geosci. 2001, 7, 419–425. [Google Scholar] [CrossRef]
Figure 1. Maps of the study area, showing (a) its location; (b) a structural outline of the Xinjing coal mine; and (c) The contours of #3 floor around XJ-1 well.
Processes 12 01949 g001
Figure 2. Layout and well trajectory of microseismic monitoring stations in this study.
Processes 12 01949 g002
Figure 3. Typical micro-seismic recording for the first fracturing section of well XJ-1L.
Processes 12 01949 g003
Figure 4. Distribution of micro-seismic events in the study area. The different colors of the circles represent the effective events in the different stages, whereas their diameters represent the quantity of energy released during the rock/coal rupture. The coordinate axis represents the relative positions of the events from the wellhead (m).
Processes 12 01949 g004
Figure 5. Fracture morphology during nitrogen fracturing (NF) and hydraulic fracturing (HF) in stage 1. The λ values of the NF and HF stages were 4.08 and 5.12, respectively, with the latter higher by 25%. The coordinate axis represents the relative position to the center of the fracturing section (m).
Processes 12 01949 g005
Figure 6. Method used to analyze the seismic source mechanism.
Processes 12 01949 g006
Figure 7. Distribution of fracture properties in the first section of well XJ-1L. The coordinate axis represents the relative position to the center of the fracturing section (m). From NF to HF, the proportion of nitrogen in fracturing fluid is decreased, the proportion of tensile fractures is decreased, and the proportion of strike-slip fractures is increased.
Processes 12 01949 g007
Figure 8. The distribution of b-values during hydraulic and nitrogen fracturing.
Processes 12 01949 g008
Figure 9. The relationships between pressure and temperature during nitrogen fracturing and hydraulic fracturing.
Processes 12 01949 g009
Figure 10. The states of the Mohr circle during (a) tensile failure and (b) shear failure. The blue Mohr circle represents the stress state of the Mohr circle at the time of a shear crack during hydraulic fracturing, whereas the red Mohr circle represents the trigger of a tensile shear crack during nitrogen fracturing.
Processes 12 01949 g010
Figure 11. Crack classification according to fracture mechanics.
Processes 12 01949 g011
Table 1. Segmented clustering parameter statistics.
Fracturing TypeLength/mCluster NumberSpacing/mBridge Plug Position/m
Stage 11435–1521864///
Stage 21346–14358941414–1451371435
Stage 31260–13468631328–1361331346
Stage 41163–12609741239–1281421260
Stage 51068–11639541149–1180311163
Stage 6969–10689941052–1083311068
Stage 7870–969994948–98436969
Table 2. The detailed fracturing time for each stage.
Fracturing TypeStage 1Stage 2Stage 3Stage 4Stage 5Stage 6Stage 7
NF (min)89758989918587
CF (min)49624856634548
HF (min)49455539404636
Abbreviations: CF—composite fracturing; HF—hydraulic fracturing; NF—nitrogen fracturing.
Table 3. Statistical summary of the number of micro-seismic events among the different fracturing stages and phases.
Fracturing StageStage 1Stage 2Stage 3Stage 4Stage 5Stage 6Stage 7
NF46729394866767
CF26705666685047
HF28386649513740
Total100180215209205154154
Abbreviations: CF—composite fracturing; HF—hydraulic fracturing; NF—nitrogen fracturing.
Table 4. Statistics of the λ value distribution in the different stages and phases.
Fracturing StageStage 1Stage 2Stage 3Stage 4Stage 5Stage 6Stage 7
NF4.081.322.211.821.461.511.52
HF5.122.282.281.981.691.521.57
Abbreviations: HF—hydraulic fracturing; NF—nitrogen fracturing.
Table 5. A summary of fracture properties in the present study.
Fracturing
Section
Fracturing StageFracturesTensile
Fracture
Dip-Slip FractureStrike-Slip Fracture
Stage 1NF461737.0%510.9%2452.1%
CF26934.6%415.4%1350.0%
HF281035.7%725.0%1139.3%
Stage 2NF722636.1%1318.1%3345.8%
CF701217.1%2028.6%3854.3%
HF381334.2%718.4%1847.4%
Stage 3NF934245.2%1314.0%3840.9%
CF562137.5%35.4%3257.1%
HF662436.4%57.6%3756.1%
Stage 4NF942829.8%1819.1%5154.3%
CF661928.8%1218.2%3553.0%
HF491122.4%816.3%3061.2%
Stage 5NF863237.2%1315.1%4147.7%
CF682130.9%1725.0%3044.1%
HF511121.6%1019.6%3058.8%
Stage 6NF671522.4%1623.9%3653.7%
CF501938.0%48.0%2754.0%
HF37821.6%616.2%2362.2%
Stage7NF671826.9%1014.9%3958.2%
CF472144.7%612.8%2042.6%
HF401640.0%12.5%2357.5%
Abbreviations: CF—composite fracturing; HF—hydraulic fracturing; NF—nitrogen fracturing.
Table 6. Ranges of b-value during the nitrogen fracturing (NF) and hydraulic fracturing (HF) fracturing stages.
Fracturing StageStage 1Stage 2Stage 3Stage 4Stage 5Stage 6Stage 7
NF0.510.50.520.490.550.320.39
R (variance)0.9670.9110.8740.8910.860.9270.909
HF0.290.270.360.40.360.160.37
R (variance)0.8060.8160.8540.9020.9070.8220.843
Table 7. Calculated stress drop σ (MP) during nitrogen fracturing (NF) and hydraulic fracturing (HF).
Fracturing TypeStage 1Stage 2Stage 3Stage 4Stage 5Stage 6Stage 7
NF0.0990.0460.1780.0430.0370.1270.101
HF0.0680.0250.1290.0130.0150.0990.071
Disclaimer/Publisher’s Note: The statements, opinions and data contained in all publications are solely those of the individual author(s) and contributor(s) and not of MDPI and/or the editor(s). MDPI and/or the editor(s) disclaim responsibility for any injury to people or property resulting from any ideas, methods, instructions or products referred to in the content.

