Abstract
Intermediate-volatility organic compounds (IVOCs) serve as pivotal precursors to secondary organic aerosol (SOA). They are highly susceptible to substantial wall losses both in indoor environments and within smog chambers even with Teflon walls. Accurately characterizing the wall loss effects of IVOCs is thus essential for simulation studies aiming to replicate their atmospheric behaviors in smog chambers to ensure precise modeling of their physical and chemical processes, including SOA formation, yet a comprehensive understanding of the wall loss behavior of IVOCs remains elusive. In this study, we conducted a thorough characterization of wall losses for typical intermediate-volatility hydrocarbon compounds, including eight normal alkanes (n-alkanes) and eight polycyclic aromatic hydrocarbons (PAHs), using the smog chamber with a 30 m3 Teflon reactor. Changes in the concentrations of gaseous IVOCs with the chamber were observed under dark conditions, and the experimental data were fitted to the reversible gas–wall mass transfer theory to determine the key parameters such as the wall accommodation coefficient (αw) and the equivalent organic aerosol concentration (Cw) for different species. Our results reveal that Cw values for these hydrocarbon IVOCs range from 0.02 to 5.41 mg/m3, which increase with volatility for the PAHs but are relative stable for alkanes with an average of 3.82 ± 0.92 mg/m3. αw span from 1.24 × 10⁻⁷ to 1.01 × 10⁻⁶, with the values for n-alkanes initially showing an increase followed by a decrease as carbon numbers rise and volatility decreases. The average αw for n-alkanes and PAHs are 3.34 × 10⁻⁷ and 6.53 × 10⁻⁷, respectively. Our study shows that IVOCs exhibit different loss rates onto clean chamber walls under dry and dark conditions, with increasing rate as the volatility decreases. This study demonstrates how parameters can be acquired to address wall losses when conducting smog chamber simulation on atmospheric processes of IVOCs.
1. Introduction
Smog chambers are important tools for investigating chemical and physical processes in the atmosphere by controlling specific compounds, emission sources, and environmental conditions [1,2,3,4,5,6,7,8]. Teflon film has been widely used as a reactor material in such simulation studies because of its chemically inert properties and light transmittance. It has been noted that both gases and particulate matters can be deposited on the surface of the chamber wall, which may have an effect on both gas-phase reactivity and aerosol-phase reaction, resulting in an underestimated formation of particles and reaction products, as well as an overestimated consumption of reaction precursors [9,10,11,12,13,14,15,16].
The wall effect of chemicals is challenging during all chamber experiments. For particulate matters, the rate of concentration decay in a closed container varies with particle size and is affected by the shape of the chamber, the state of mixing, the nature of the particulate itself, and the electrostatic state of the wall [8,17,18,19,20,21,22]. A number of particle wall loss correction methods have been developed as a function of particle concentration and size distribution by determining the first-order particle wall loss rate constant, k [1,10,23,24,25,26,27]. For gases, losses on the chamber wall can be dominated by either the diffusion process to the wall surface or the molecules’ adsorption on the wall, which depends on the mass accommodation coefficient (αw) [28]. While volatile organic compounds (VOCs), such as n-butane, n-pentane, toluene, and methyl nitrate, have shown no or negligible wall effects [29], studies have indicated that intermediate- and low-volatility compounds can be lost substantially to the chamber wall surfaces [30,31,32,33,34,35,36]. In comparison to low-volatility compounds, which have near zeroth-order and quasi-irreversible wall loss rates, IVOCs have reversible and more complicated dynamic processes [33,35].
Intermediate-volatility organic compounds (IVOCs) are a group of organic compounds with effective saturation concentrations between 103 and 106 μg/m3, corresponding roughly to the volatility range from C12 to C22 n-alkanes [37,38,39,40]. In this volatility range, several species, including C12–C22 n-alkanes, naphthalene, methylnaphthalene, acenaphthylene, acenaphthene, fluorene, phenanthrene, anthracene, alkylcyclohexane, and certain phenolic compounds such as cresol, catechol, guaiacol, syringol and so on, have been observed in numerous field campaigns [41,42,43,44,45,46] and showed higher potential to form secondary organic aerosols (SOAs) [47,48,49,50,51,52,53,54,55]. For example, SOA yield from the reaction of n-octane with an OH radical in the presence of NOx is 0.5%, while the yield of n-tetradecane is 55.3% [52]. To better understand the potential for SOA production from IVOCs, numerous chamber experiments have been employed to study oxidation processes and product compositions [51,52,56,57,58,59,60,61]. Due to the relatively low volatility, IVOCs could be adsorbed significantly on Teflon walls according to the theory of gas/particle partition [62]. Neglecting the impact of wall loss of IVOCs may lead to an underestimation of yields for secondary products and an inaccurate representation of aging processes [14,15,63,64]. Previously, we performed a series of experiments to evaluate the wall loss rates of both particle and VOC species inside the smog chamber at the Guangzhou Institute of Geochemistry, Chinese Academy Sciences (GIG-CAS) [65,66,67,68,69,70]. However, the loss of IVOC species on the GIG-CAS smog chamber walls is not yet well characterized. In this study, we selected typical intermediate volatile hydrocarbon compounds such as n-alkanes and PAHs to investigate their wall loss behavior in the smog chamber, which will lay a solid basis for subsequent chamber simulation work on IVOCs and provide valuable implications for the indoor behavior of IVOCs as well.
2. Materials and Methods
2.1. Experimental Setup
Experiments were carried out in the GIG-CAS smog chamber with a 30 m3 Teflon reactor, utilizing two fans installed inside for active mixing. The reactor is surrounded by temperature-controlled enclosure equipment with a series of sensors and monitors, which measure and show the evolution of temperature, pressure, and relative humidity during the experiments. The fans are coated with inert Teflon material, ensuring that the chemicals introduced are well mixed for 120 s. Further detailed information regarding the chamber setup can be found in previous studies [65,66,67,68,69,70]. Prior to wall loss experiments, the chamber was flushed for at least 24 h and filled with clean, dry air at approximately 298 K to ensure that the background levels of potential oxidants are sufficiently low. The relative humidity was kept below 10% and particle concentrations were virtually negligible (particle number concentration below 1 particle cm−3) throughout the wall loss experiment of IVOCs, thus mitigating the influence of the water layer on the Teflon surface and minimizing mass transfer from gas to particles. The chamber was maintained in a light-free environment during the experiment to prevent potential oxidation of light-absorbing PAHs as well as the generation of OH radicals resulting from Teflon wall exposure to irradiation, effectively minimizing any additional chemical losses that could occur. About 2.3 ppm of CO was introduced into the chamber and monitored continuously to test for dilution effects (Figure S1).
2.2. Reagents and Instrumentation
The purchased standards were as follows: ammonium sulfate (99% purity, Aladdin, Shanghai, China); eight n-alkanes (all above 99% in purity, Sigma Aldrich, St. Louis, MO, USA) including n-dodecane, n-tridecane, n-tetradecane, n-pentadecane, n-hexadecane, n-heptadecane, n-octadecane, and n-nonadecane; and eight PAHs (all above 99% in purity, Sigma Aldrich, St. Louis, MO, USA) including naphthalene, 1-methyl-naphthalene, 2-methyl-naphthalene, acenaphthylene, acenaphthene, fluorene, phenanthrene, and anthracene.
For the particle wall loss experiment, the ammonium sulfate was dissolved in ultrapure water at a concentration of 0.36 mol/L. The solution was then transferred to an atomizer (AMT 220, Topas GmbH, Dresden, Germany), and aerosols were generated and introduced into the chamber with dry air. The purge gas was halted once the particle concentration in the chamber reached 1 × 10⁴ particles cm−3. The concentration and size distribution of particles was measured by a scanning mobility particle sizer (SMPS, Model 3081 classifier, Model 3775 CPC, TSI Inc., Shoreview, MN, USA).
2.3. Analysis of IVOCs
For the IVOC wall loss experiment, n-alkanes and PAHs were flushed with a stream of clean air using an injector, which utilized a 12 cm long × 0.375 cm O.D. stainless steel tube extending into the chamber while controlling the internal temperature of the injector at 473 K. This relatively short tube length and elevated temperature were employed to minimize the loss of organic compounds (OCs) to the tube’s inner wall and to facilitate evaporation. The sampling gas stream was conveyed through a 100 cm long × 0.375 cm O.D. stainless steel tube, which was maintained at a temperature of ~40 °C [71]. Sorbent tubes (Tenax TA/Carbograph 5TD, Marks International Ltd., Bridgend, UK) were used to collect samples at a flow rate of 200 sccm for 5 min every 30 min during the experiments. Prior to each sampling event, 20 L of air was drawn from the chamber using the same sampling line to ensure that equilibrium was reached between the gas phase and the tube’s inner wall, thereby minimizing the impact of sorption loss on the tube [35]. The detailed description of tube sample analysis has been described in our previous studies [44,45,72]. Briefly, sample tubes were desorbed using a thermal desorber (TD-100, Marks International Ltd., Bridgend, UK) at 320 °C for 20 min. All desorbed compounds were cryogenically trapped at −10°C and then rapidly desorbed again at 325 °C to transfer the IVOCs into the gas chromatography/mass selective detector (7890 GC/5975 MSD, Agilent Technologies, Santa Clara, CA, USA) equipped with a capillary column (HP-5MS, 30 m × 0.25 mm × 0.25 µm, Agilent Technologies, Santa Clara, CA, USA). The GC oven temperature was initially at 40 °C for 3 min, then raised at 5 °C min−1 to 290 °C and held for 10 min. The MSD was operated in the scan mode with electron impact (EI) ionization at an ionization energy of 70 eV.
2.4. Gas–Wall Transfer
The fundamental framework of the mass transfer of organic vapor between gas and wall includes two processes: deposition from gas to wall and desorption from wall to gas. The rates of these reversible processes can be expressed with Equations (1) and (2), respectively [28,35,73,74]:
where rg2w is the transfer rate of OC from bulk gas to the wall, while rw2g is the transfer rate from the wall to bulk gas. Both kg2w and kw2g denote the first-order rate constant (s−1), which can be calculated from a range of parameters. OCg represents the concentration of OC in the bulk gas, while OCs denotes the concentration of OC on the surface of the wall. A (m2) is the surface area of the chamber, and V (m3) is the volume of the chamber. ke (s−1) is the eddy diffusion coefficient, which will be addressed in detail in Section 3.1 in order to determine its value in this study. Dg (m2 s−1) is gas molecular diffusivity, and for simplicity of the calculation, its value was set to 5 × 10⁻⁶ m2 s−1, which corresponds to the diffusion coefficients of n-dodecane and anthracene in air at 298 K and 1 atmosphere [75], without taking into account the effect of the temperature and compound properties on Dg. αw (dimensionless) is the wall accommodation coefficient, which expresses the efficiency of the Teflon wall in trapping OC and determines that the concentration decrease rate is due to wall losses. ω (m s−1) is the mean thermal speed of the gas molecules [40]. Kw is the ratio of kg2w to kw2g, which determines the magnitude of wall loss at equilibrium. According to gas–particle partitioning theory, Kw can be expressed as Equation (3) [32,74]:
where R is the gas constant (8.314 Pa m3 mol−1 K−1). T is the temperature in Kelvin (K). In this study, the Teflon wall is regarded as an organic aerosol with a certain mass concentration of Cw, thereby facilitating the calculation of the desorption rate of OC from the wall to the bulk gas. Therefore, Cw is the equivalent organic aerosol concentration (g/m3). Mw is the molecular mass of the Teflon wall and is assumed to be 200 g/mol in previous studies [76]. P° (Pa) is the saturation vapor pressure. In our study, the vapor pressure values of n-alkanes are obtained using the EVAPORATION model [77], and the values of PAHs are obtained using the modified grain method [78]. γw is the activity coefficient of OCs in the surface layer of Teflon, and it is assumed to be 1 [35,73]. Direct measurement of the γw is challenging since γw is typically a function of the mole fractions of all substances in aerosol, as well as temperature and pressure [40]. For wall loss characterization of organic vapor, several studies have already calculated compound-dependent Cw values [34,35,36,73], while there are also researchers using the thickness of the Teflon surface layer, density, and chamber size to estimate a constant Cw for a specific chamber and fitting γw as an indicator of wall loss magnitude [32,74]. Whichever method is employed, the effect of the interaction between specific organic compounds and the Teflon “solution” on the degree of wall loss must be taken into account. In our study, we have acquired Cw for various compounds, in consideration of the inherent physical meaning of γw and the discrepancy of Teflon material between chambers. For obtaining Cw and αw, Equations (1) and (2) will be converted into integral form to facilitate fitting, and they are shown in Section 3.2 in detail.
3. Results and Discussion
3.1. Fitting of ke
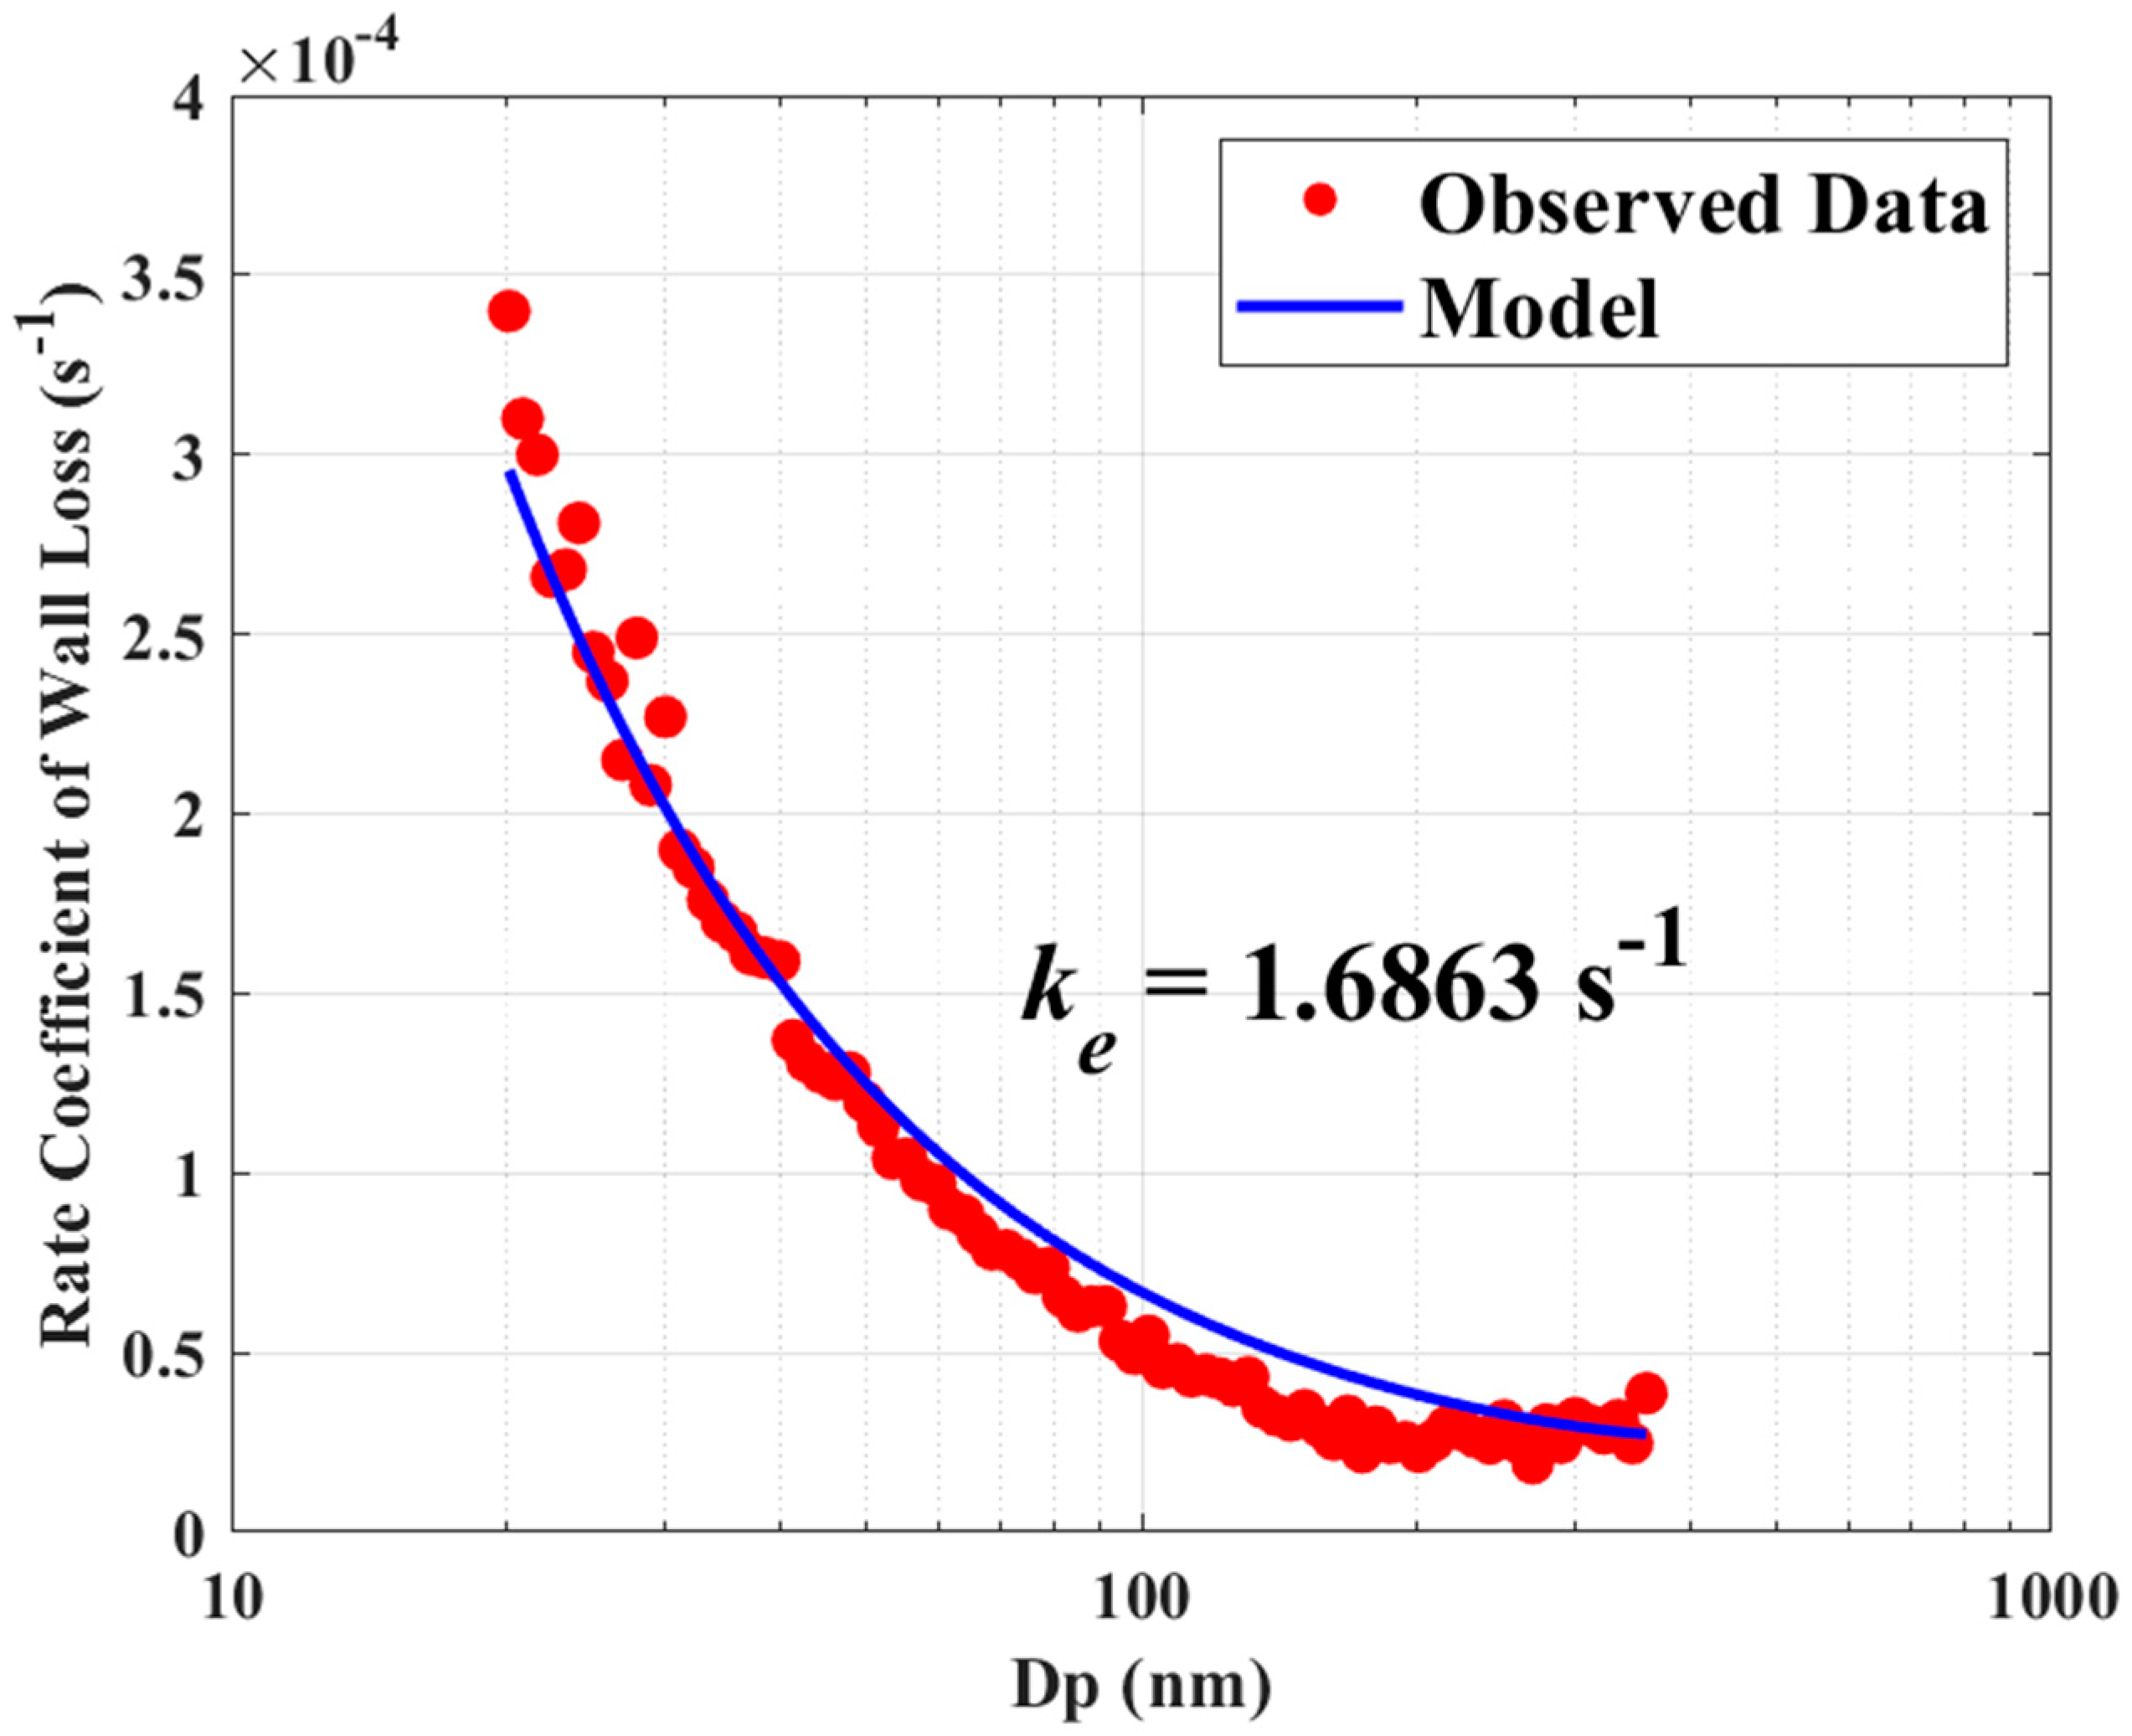
The values of ke are various in different chambers and can be estimated from measured particle size deposition rates [14,28,34]. In our chamber, we assume that the Teflon wall resembles organic aerosols, and therefore, ke was determined by minimizing the difference between the measured and theoretical distributions of particle loss rate constants with respect to particle sizes, as illustrated in Figure 1. The theoretical loss rate is widely recognized to be primarily influenced by three processes: eddy diffusion, electrostatic force, and gravitational settling. The impact of electrostatic force mainly arises from the interaction between the charge carried by the surface of particles and the electric field generated by the Teflon wall, particularly within the particle size range of 100–1000 nm [28,79]. However, given that the measured data focus on smaller particles and we do not observe a significant effect from the electrostatic force in this study, we do not consider their influence here [80]. Equation (4) below is used for quantifying the particles’ loss rate coefficient in the chamber [17,18]:
where α (s−1) represents the particles’ loss rate coefficient describing the first-order process. L (m) represents the side length of the chamber. D (m2 s−1) represents the Brownian diffusion coefficient, and Vs (m s−1) represents the terminal settling velocity of the particles. Detailed calculation methods for both D and Vs can be found in Seinfeld and Pandis [40]. In order to obtain the optimal value of ke, a customized variable J can be constructed with Equation (5), where α(Dp,i) (s−1) represents the particles’ loss rate coefficient of a specific size bin i [19]:

Figure 1.
Comparison of theoretical and observed loss rate constants of (NH4)2SO4 particles.
The MATLAB (v9.13.0(R2022b), The MathWorks Inc., Natick, MA, USA) function fminsearch is utilized to calculate the minimum value of the unconstrained function J using the derivative-free method. The best-fitting curve and the observed particle loss rate constants are compared in Figure 1 for the smallest value of J with the ke = 1.6863 s−1.
3.2. Fitting of Cw and αw
The deposition and desorption of OC on the wall surface are mainly controlled by the processes represented by Equations (1) and (2), which are reversible one-order processes. Therefore, Equations (1) and (2) can be transformed into an integral form of Equation (6), which represents the concentration of OC in the gas phase as a function of time [8]. Using Equation (6) to fit the temporal concentration of measured IVOCs, we can determine the optimal values for intermediate parameters (i.e., kg2w, kw2g, and OC∞,g). Consequently, we can then derive the final values of Cw and αw:
where OC(t) represents the vapor concentration of OC at time point t, OC0 indicates the initial vapor concentration, and OC∞,g refers to the equilibrium OC concentration in bulk gas. In this manner, the optimal values of the parameters kg2w + kw2g and OC∞,g in Equation (6) can be derived. Consequently, OC∞,w, as OC concentration on the wall at equilibrium can be found in Equation (7):
In practice, the Kw shown in Equation (3) is equivalent to the equilibrium ratio of OC between the wall phase and the bulk phase, as indicated in Equation (8). kg2w and kw2g can be calculated using Equations (3) and (6), Cw can be calculated using Equation (3), and αw can be derived from kg2w or kw2g on the basis of Equations (1) and (2).
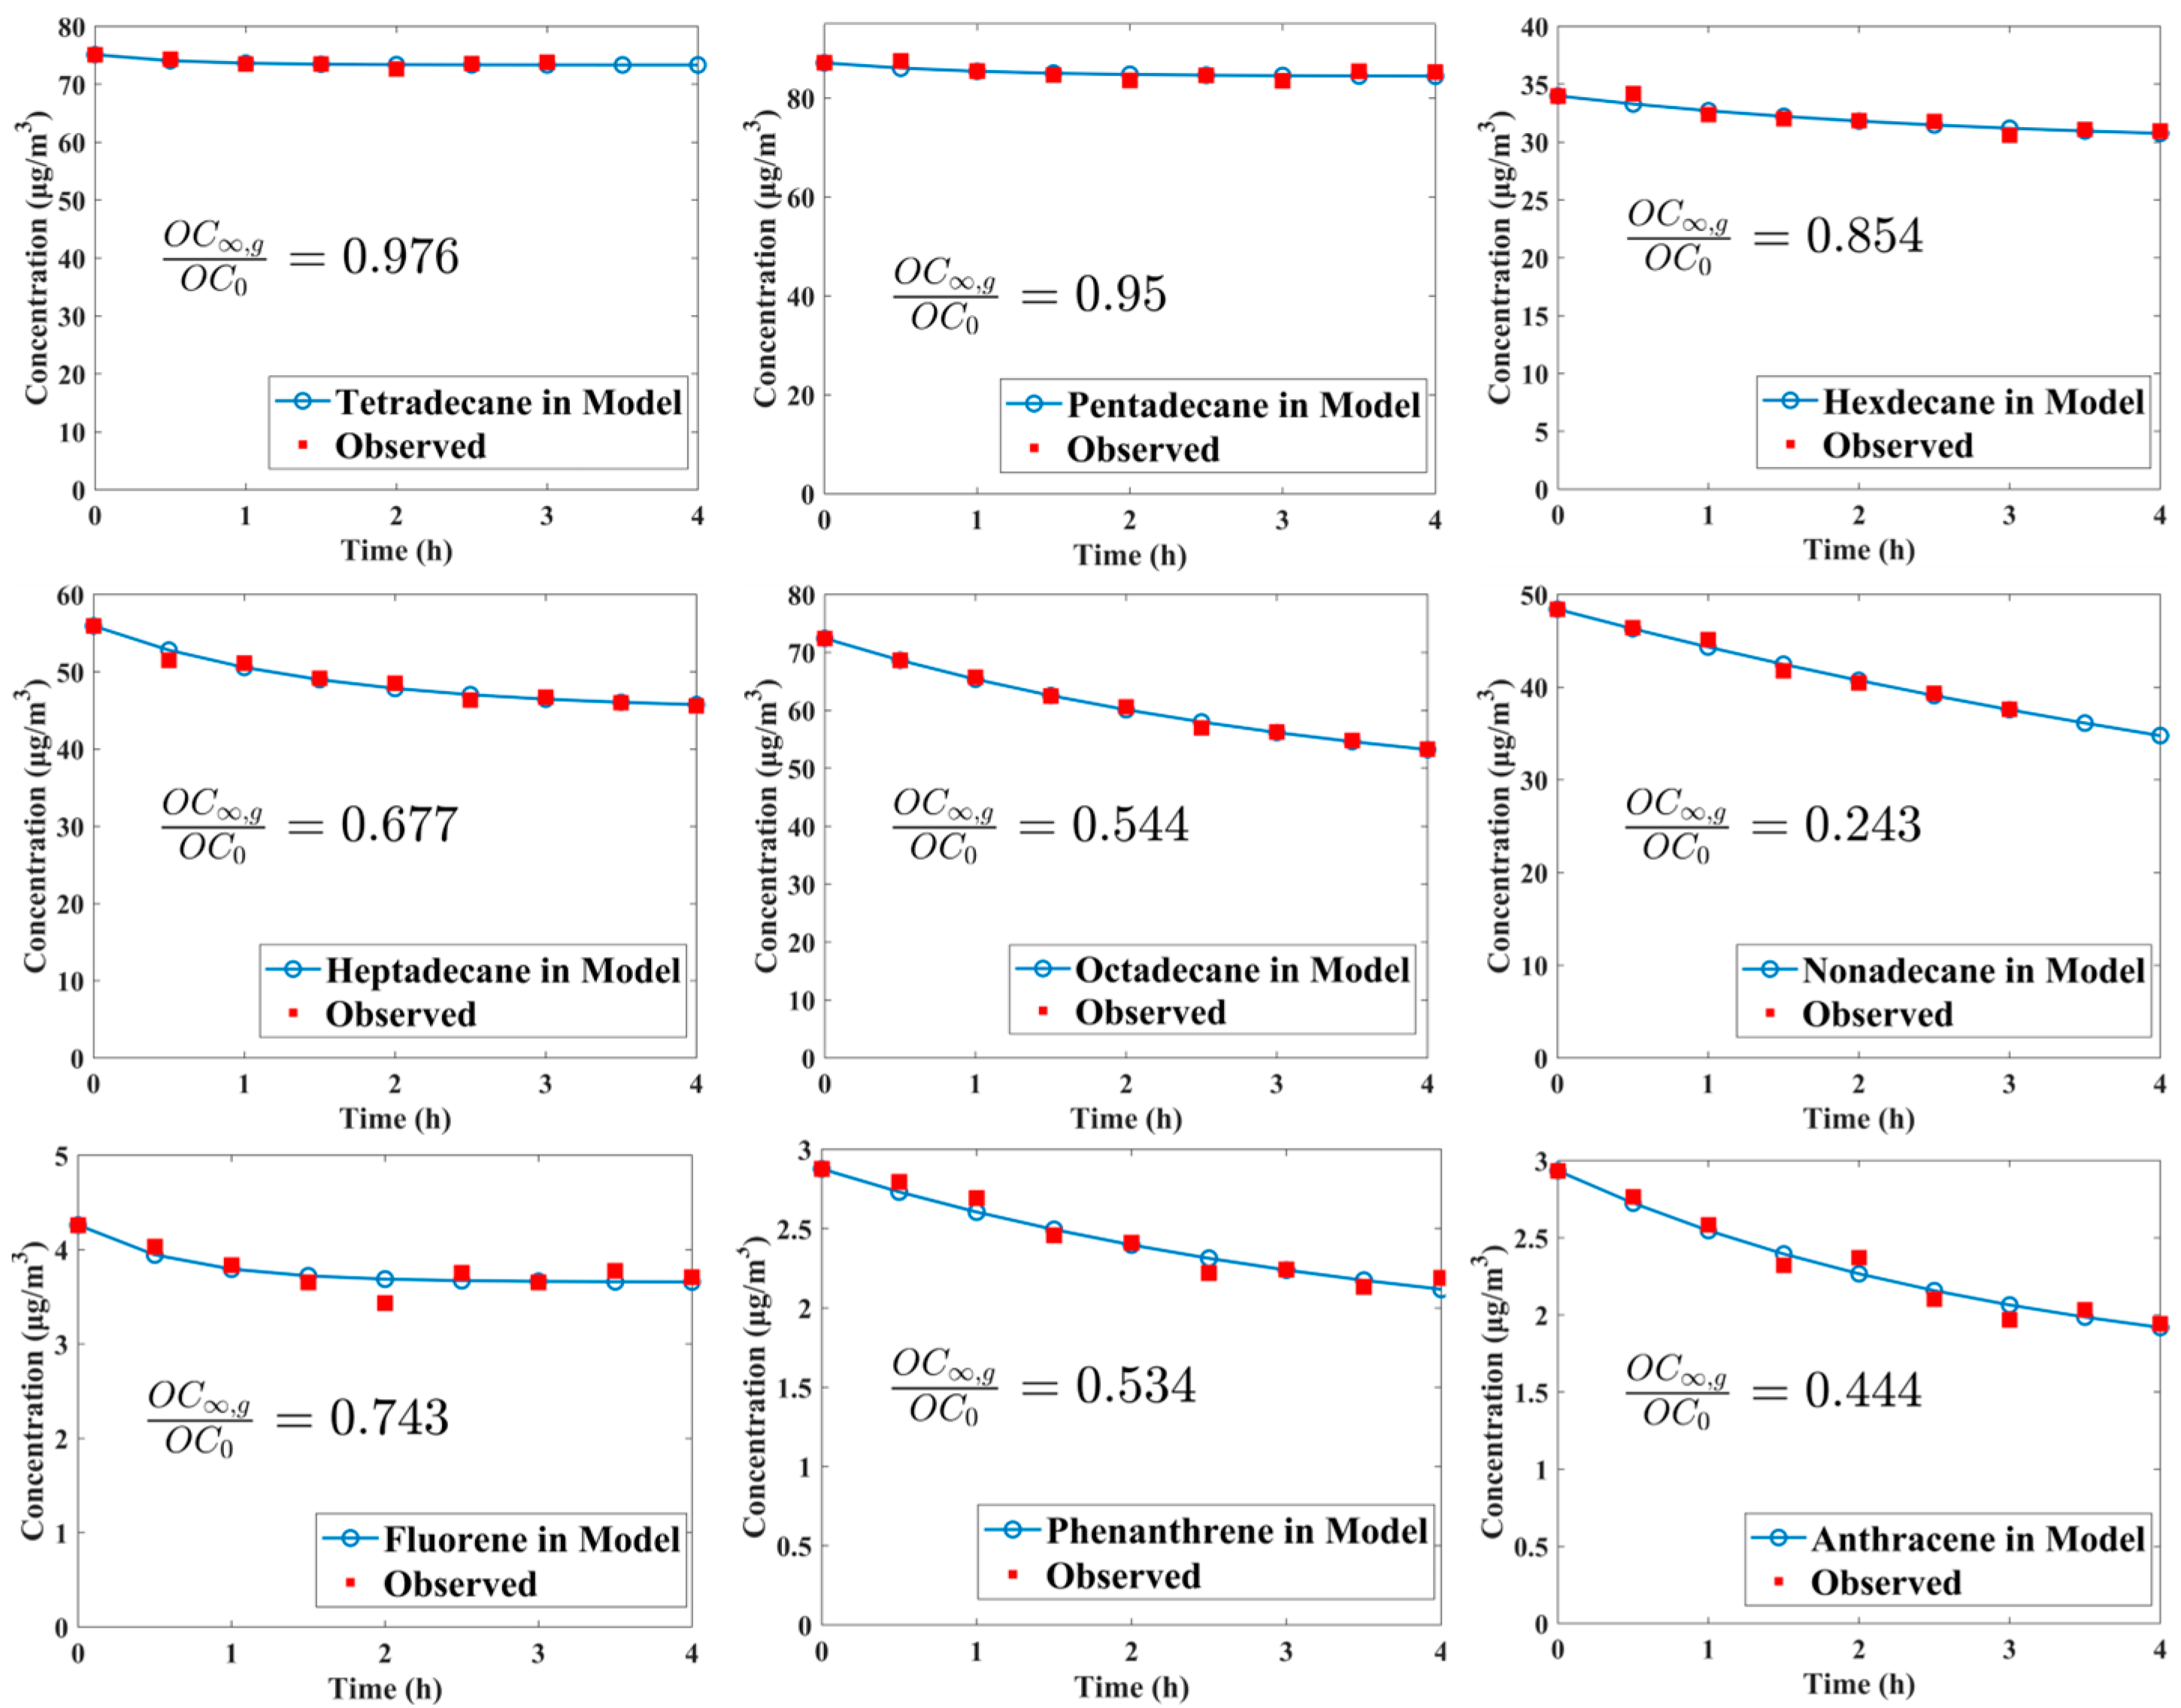
Figure 2 illustrates the concentration variations and fitting curves of some studied species, spanning from n-tetradecane to n-nonadecane, along with three PAHs, such as fluorene, phenanthrene, and anthracene. It is noteworthy that n-dodecane, n-tridecane, naphthalene, 1-methyl-naphthalene, 2-methyl-naphthalene, acenaphthene, and acenaphthylene do not exhibit a clear decreasing trend due to their relatively high volatility. Wall loss for other species selected in our study was too small to observe (see Figure S2 in the Supporting Information); thus, fittings could not be carried out for these compounds to obtain reasonable curves and parameters. The ratios of OC∞,g to OC0 indicate the fraction of OC remaining in the gas phase at equilibrium, and its value significantly decreases with the reduced volatility in the n-alkane or PAH class. For n-nonadecane, the loss of its organic vapor to the wall can reach up to 75.7% upon achieving gas–wall partition equilibrium. Despite the higher extent of wall loss observed for n-nonadecane, achieving equilibrium between the gas phase and wall phase requires a significantly longer time, with a characteristic timescale τgw (equal to 1/(kg2w + kg2w)) reaching up to 7.88 h. In contrast, n-tetradecane, which exhibits minimal wall loss, has a τgw value of only 34.35 min.
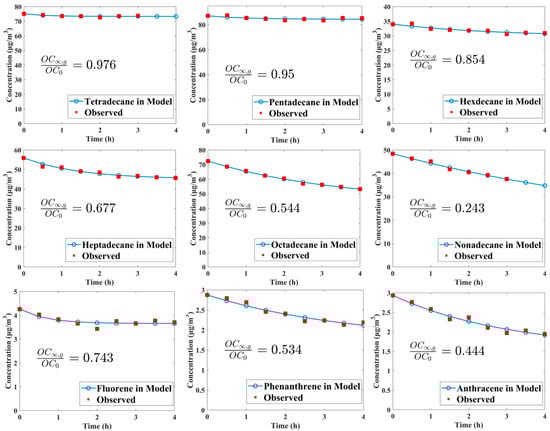
Figure 2.
Observed concentration variations of several IVOCs exhibiting clear decreasing trends and their fitting curves.
Wall loss parameters calculated for these compounds are present in Table 1. Typically, the values of Cw for most n-alkanes are close to 2 mg/m3, which are close to the values reported by Matsunaga and Ziemann [35], but they exhibit a decreasing trend with decreasing volatility for three PAHs with an average of 0.55 mg/m3. As for αw, their values for C14–C17 n-alkanes increase with decreasing volatility, consistent with findings by Matsunaga and Ziemann [35], as well as Huang et al. [74]. However, a downward trend in αw is observed with further decreases in volatility within other n-alkanes. The average αw for alkanes and PAHs are 3.34 × 10⁻⁷ and 6.53 × 10⁻⁷, respectively. Based on the functional relationship between volatility and αw proposed by Zhang et al. [73] and Huang et al. [74], we could calculate the n-alkanes’ accommodation coefficient in our experiments, denoted as αw1 and αw2, respectively. The range of αw/αw1 is 0.09–0.33, with an average of 0.25. The range of αw/αw2 is 4.45 to 48.62, with an average of 16.29.

Table 1.
The wall loss parameters and volatility for IVOC species. Cw and αw are determined by fitting based on measurements conducted in this study. αw1 and αw2 are calculated with equations proposed by Zhang et al. [73] and Huang et al. [74], respectively. Saturation mass concentration is an indicator of the volatility of different species, where the C° of n-alkanes is predicted from the EVAPORATION model [77], while the C° of PAHs is predicted by the modified grain method provided by EPI Suite™ software (v4.11, United States Environmental Protection Agency, Washington, DC, USA).
Table 1 lists the volatility and accommodation coefficients of the organic compounds investigated in this study. The relationship between volatility and wall loss behavior is obvious within each OC class. For n-alkanes with higher volatility than n-tetradecane, and PAHs with higher volatility than fluorene, their wall loss can be negligible in the GIG-CAS chamber. Similar findings were reported by Matsunaga and Ziemann, who did not observe a significant decrease (a fraction of the concentration in the gas phase, OCg/OC0, decreased by <5%) in gas-phase concentration for n-alkanes, 1-alkenes, 2-alcohols, and 2-ketones with higher volatility than n-tetradecane, 1-tetradecene, 2-decanol, and 2-decanone, respectively. It can serve as a threshold to determine whether significant wall loss of a specific kind of organic vapor exists in our chamber. However, predicting the presence of significant wall loss based solely on volatility may be insufficient without considering the class difference in compounds. For instance, although n-heptadecane and acenaphthylene exhibit similar volatility, n-heptadecane can experience up to 32.3% loss of its total concentration to the Teflon wall, whereas acenaphthylene shows no significant trend in wall loss.
3.3. Comparison of Cw and Kw in Different Studies
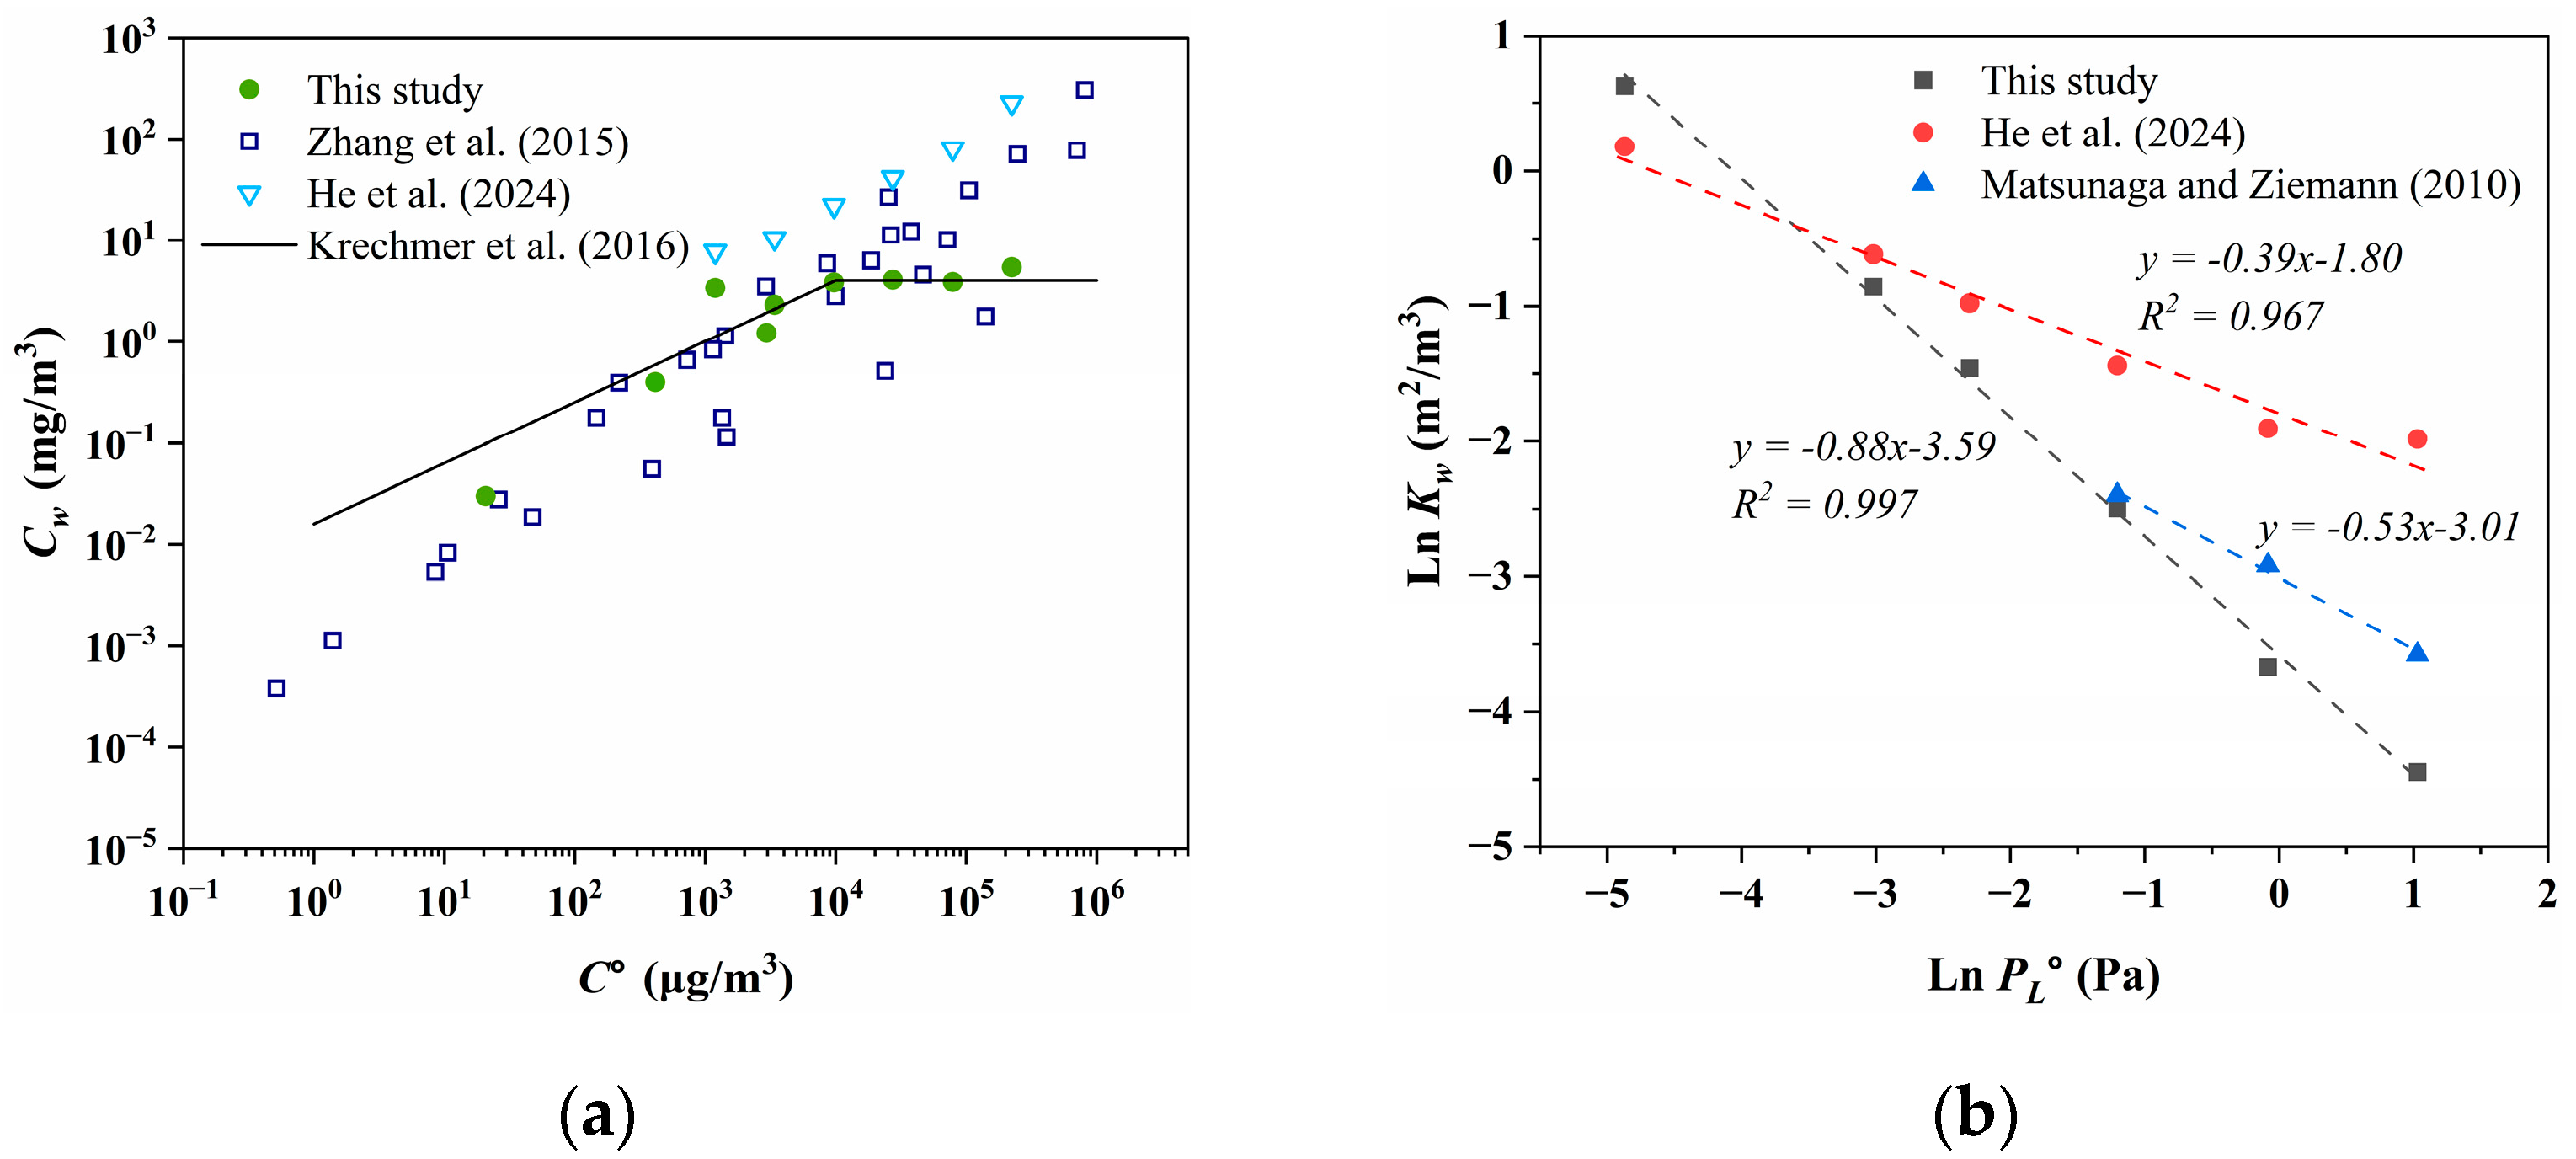
The comparison of Cw within different studies is depicted in Figure 3a. Zhang et al. [73] and Kretchmer et al. [34] demonstrated that the Cw of oxidized products (with C° ranging from 100 to 106 μg/m3) from toluene, n-dodecane, α-pinene, isoprene, and C6–C12 1-alcohol significantly increased with elevated volatility under both high and low NOx conditions. Similar trends were observed for PAHs in our study and for C14–C19 alkanes in the research by He et al. [32]. However, there is no significant trend for C14–C19 alkanes in our study, with an average Cw of 3.82 ± 0.92 mg/m3, despite n-tetradecane exhibiting the highest volatility and Cw value. Furthermore, discrepancies in Cw for the same compound persist across different studies. The Cw values measured by He et al. [32] for C14–C19 alkanes are higher than those obtained from Matsunaga and Ziemann [35] and our work. This discrepancy may be attributed to the surface area concentration of the chamber (defined as the ratio of surface area to volume, m2/m3) used by He et al. [32], which is 7.26 m2/m3. While for other chambers, the ratio of surface area to volume was approximately 2 to 3 m2/m3. At equivalent levels of volatility, there are also discrepancies in Cw. As shown in Figure 3a, in the lower volatility range (C° < 102 μg/m3), Krechmer et al. [34] reported higher Cw compared to those obtained by Zhang et al. [73], whereas in the higher volatility range (C° > 104 μg/m3), the Cw measured from the Ziemann Group and our work are lower than those of most compounds reported by Zhang et al. [73]. It suggests that structural differences among compounds may contribute to various degrees of wall loss even when volatility is consistent.
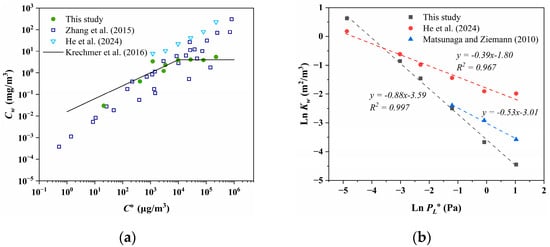
Figure 3.
(a) Comparison of Cw between different studies [32,34,73]. The black line comes from Krechmer et al. [34] fitted for organic nitrates, and experimental data come from the Ziemann Group, with a functional expression of Cw = 0.016 × (C°)0.6 in the oblique line and approximately 4 mg/m3 in the horizontal line. (b) The relationship between the saturation vapor pressure of the subcooled liquid (PL°) and the gas–wall partition coefficient (Kw) after normalizing with the surface area concentration of the chamber. Because n-alkanes from n-tetradecane to n-heptadecane are liquid at 298 K, the saturation vapor pressure of the subcooled liquid is the same as the normal liquid. The AEROWIN V1.00 module in EPI Suite™ software (v4.11, United States Environmental Protection Agency, Washington, DC, USA) was used to estimate the PL° of n-octadecane and n-nonadecane, which are solid at 298 K [81].
The relationships between the logarithm of gas–particle partitioning coefficient (ln Kp) and that of subcooled saturation vapor pressure (ln PL°) are frequently utilized to assess the partitioning behavior of organic contaminants in field studies in the atmosphere [82,83]. Goss et al. [84] proposed that when the slope between ln Kp and ln PL° of the pollutant exceeds −0.6, the gas–particle partitioning process is predominantly governed by chemical adsorption, indicating involvement with a “solvent” possessing high cohesive energy. Conversely, when the slope falls below −1, the partitioning process is primarily governed by physical adsorption. As depicted in Figure 3b, the slope of n-alkanes is between −0.6 and −1 in our study. The slopes obtained from fitting the data of Matsunaga and Zieman [35] and He et al. [32] exceed −0.6, suggesting that the depletion of n-alkanes to the Teflon wall is primarily governed by adsorption and adheres to Raoult’s law, thus aligning with the conclusions drawn by Matsunaga. The deviation of the ln Kw–ln PL° slope from the ideal value of −1 towards shallower slopes is attributed to the relationship between activity coefficients and volatility, representing changes in molecular structure [84]. Particularly, the presence of polar or low-polar molecules like water or fluorinated ethylene propylene (FEP) as the solvent renders non-polar alkane molecules “uncomfortable”, resulting in an increase in their activity coefficients with longer alkane chains, leading to decreased solubility. Hence, the diminished slope of ln K–ln PL° observed in this study could stem from the retention of non-polar molecules within the Teflon film over the chamber’s historical usage, thereby attenuating the overall polarity of FEP and shifting the slope between ln Kw and ln PL° in a “steeper” direction.
4. Conclusions
We investigated the wall loss behavior of eight n-alkanes and eight PAHs that are classified as IVOCs within an indoor chamber situated at GIG-CAS, and we procured pivotal parameters suitable for this chamber that delineate the wall loss of these species, encompassing the eddy diffusion coefficient, wall accommodation coefficient, and equivalent organic aerosol concentration. In addition, the findings revealed that αw spanned from 1.24 × 10⁻⁷ to 1.01 × 10⁻⁶, and Cw varied from 0.02 to 5.41 mg/m3 for C14 to C19 n-alkanes and three PAHs (fluorene, phenanthrene, and anthracene). It was noteworthy that the Cw of PAHs demonstrated a distinct escalation with elevated volatility. Nevertheless, the Cw of C14–C19 n-alkanes remained relatively stable. The αw for C14–C17 increases with decreasing volatility, but a downward trend is observed with further decreases in volatility within the other n-alkanes. The relationship between Kw and PL° suggested that the gas–wall partitioning mechanism in this study might diverge from the previous literature, but the deviation of the slope may originate from the influence of non-polar compounds within the Teflon film on “solution” activity. Here, we only focused on hydrocarbon–IVOC studies at dry conditions, for other IVOC species with different structures; their wall loss properties may be more complex due to the presence of different groups and a higher number of oxygen atoms. It is worth noting that, apart from the nature of IVOCs, the wall losses of IVOCs are impacted by factors such as temperature, RH, and the chamber’s wall material, as well as the continued use of the chamber. Consequently, parameters obtained for one chamber may not apply to another, and those derived under specific environmental conditions may not be applicable to others. In this study, we demonstrate the method of obtaining these parameters through experiments. The parameters presented in this study, derived at ~25C and RH < 10%, are not necessarily suitable for simulations under different conditions. Therefore, parameters should be determined under identical conditions to those intended for real chamber simulation. Once the conditions for the chamber simulation are defined, repeating the wall loss experiments under those conditions would enable a more accurate assessment of the parameter uncertainties.
Supplementary Materials
The following supporting information can be downloaded at https://www.mdpi.com/article/10.3390/pr12102141/s1: Figure S1: Time series of CO concentration measured with online analyzers (Model 48i, Thermo Electron Inc., USA) after it was introduced into the chamber; Figure S2: Concentrations of uncharacterized IVOCs at different time points.
Author Contributions
Methodology, Z.R., W.S. and X.W.; validation, Z.R.; data curation, Z.R., X.P., C.L., Y.Z. (Yanli Zhang) and Y.Z. (Yongbo Zhang); writing—original draft preparation, Z.R.; writing—review and editing, W.S. and X.W.; supervision, X.W. All authors have read and agreed to the published version of the manuscript.
Funding
The authors gratefully acknowledge the financial support provided by the National Natural Science Foundation of China (42321003), the Guangdong Foundation for Program of Science and Technology Research (2023B1212060049), and the Guangzhou Municipal Science and Technology Bureau (202206010057).
Data Availability Statement
The data presented in this study are available upon request from the corresponding author. The data are not publicly available due to the internal policy of the university.
Acknowledgments
The authors would like to thank Yuanlong Huang at the Eastern Institute of Technology, Ningbo, for his insights on the wall loss theory. In addition, the authors would like to thank Yuchen Wang at Hunan University and Longkun He at Peking University for their assistance in obtaining the volatility data of the organic compounds.
Conflicts of Interest
The authors declare no conflicts of interest. The funders had no role in the design of this study; in the collection, analyses, or interpretation of the data; in the writing of the manuscript; or in the decision to publish the results.
References
- Carter, W.P.L.; Cocker, D.R.; Fitz, D.R.; Malkina, I.L.; Bumiller, K.; Sauer, C.G.; Pisano, J.T.; Bufalino, C.; Song, C. A new environmental chamber for evaluation of gas-phase chemical mechanisms and secondary aerosol formation. Atmos. Environ. 2005, 39, 7768–7788. [Google Scholar] [CrossRef]
- Kirkby, J.; Curtius, J.; Almeida, J.; Dunne, E.; Duplissy, J.; Ehrhart, S.; Franchin, A.; Gagné, S.; Ickes, L.; Kürten, A.; et al. Role of sulphuric acid, ammonia and galactic cosmic rays in atmospheric aerosol nucleation. Nature 2011, 476, 429–433. [Google Scholar] [CrossRef]
- Li, J.L.; Li, H.; Wang, X.Z.; Wang, W.G.; Ge, M.F.; Zhang, H.; Zhang, X.; Li, K.; Chen, Y.; Wu, Z.H.; et al. A large-scale outdoor atmospheric simulation smog chamber for studying atmospheric photochemical processes: Characterization and preliminary application. J. Environ. Sci. 2021, 102, 185–197. [Google Scholar] [CrossRef] [PubMed]
- Li, K.; Lin, C.; Geng, C.; White, S.; Chen, L.; Bao, Z.; Zhang, X.; Zhao, Y.; Han, L.; Yang, W.; et al. Characterization of a new smog chamber for evaluating SAPRC gas-phase chemical mechanism. J. Environ. Sci. 2020, 95, 14–22. [Google Scholar] [CrossRef] [PubMed]
- Wagner, R.; Linke, C.; Naumann, K.H.; Schnaiter, M.; Vragel, M.; Gangl, M.; Horvath, H. A review of optical measurements at the aerosol and cloud chamber AIDA. J. Quant. Spectrosc. Radiat. Transf. 2009, 110, 930–949. [Google Scholar] [CrossRef]
- Wang, J.; Doussin, J.F.; Perrier, S.; Perraudin, E.; Katrib, Y.; Pangui, E.; Picquet-Varrault, B. Design of a new multi-phase experimental simulation chamber for atmospheric photosmog, aerosol and cloud chemistry research. Atmos. Meas. Tech. 2011, 4, 2465–2494. [Google Scholar] [CrossRef]
- White, S.; Angove, D.; Li, K.; Campbell, I.; Element, A.; Halliburton, B.; Lavrencic, S.; Cameron, D.; Jamie, I.; Azzi, M. Development of a new smog chamber for studying the impact of different UV lamps on SAPRC chemical mechanism predictions and aerosol formation. Environ. Chem. 2018, 15, 171–182. [Google Scholar] [CrossRef]
- Doussin, J.-F.; Fuchs, H.; Kiendler-Scharr, A.; Seakins, P.; Wenger, J. (Eds.) A Practical Guide to Atmospheric Simulation Chambers; Springer Nature: Cham, Switzerland, 2023. [Google Scholar]
- Bertrand, A.; Stefenelli, G.; Pieber, S.M.; Bruns, E.A.; Temime-Roussel, B.; Slowik, J.G.; Wortham, H.; Prévôt, A.S.H.; El Haddad, I.; Marchand, N. Influence of the vapor wall loss on the degradation rate constants in chamber experiments of levoglucosan and other biomass burning markers. Atmos. Chem. Phys. 2018, 18, 10915–10930. [Google Scholar] [CrossRef]
- Hildebrandt, L.; Donahue, N.M.; Pandis, S.N. High formation of secondary organic aerosol from the photo-oxidation of toluene. Atmos. Chem. Phys. 2009, 9, 2973–2986. [Google Scholar] [CrossRef]
- La, Y.S.; Camredon, M.; Ziemann, P.J.; Valorso, R.; Matsunaga, A.; Lannuque, V.; Lee-Taylor, J.; Hodzic, A.; Madronich, S.; Aumont, B. Impact of chamber wall loss of gaseous organic compounds on secondary organic aerosol formation: Explicit modeling of SOA formation from alkane and alkene oxidation. Atmos. Chem. Phys. 2016, 16, 1417–1431. [Google Scholar] [CrossRef]
- Loza, C.L.; Chan, A.W.H.; Galloway, M.M.; Keutsch, F.N.; Flagan, R.C.; Seinfeld, J.H. Characterization of Vapor Wall Loss in Laboratory Chambers. Environ. Sci. Technol. 2010, 44, 5074–5078. [Google Scholar] [CrossRef] [PubMed]
- Weitkamp, E.A.; Sage, A.M.; Pierce, J.R.; Donahue, N.M.; Robinson, A.L. Organic aerosol formation from photochemical oxidation of diesel exhaust in a smog chamber. Environ. Sci. Technol. 2007, 41, 6969–6975. [Google Scholar] [CrossRef] [PubMed]
- Zhang, X.; Cappa, C.D.; Jathar, S.H.; McVay, R.C.; Ensberg, J.J.; Kleeman, M.J.; Seinfeld, J.H. Influence of vapor wall loss in laboratory chambers on yields of secondary organic aerosol. Proc. Natl. Acad. Sci. USA 2014, 111, 5802–5807. [Google Scholar] [CrossRef]
- Bilsback, K.R.; He, Y.; Cappa, C.D.; Chang, R.Y.-W.; Croft, B.; Martin, R.V.; Ng, N.L.; Seinfeld, J.H.; Pierce, J.R.; Jathar, S.H. Vapors Are Lost to Walls, Not to Particles on the Wall: Artifact-Corrected Parameters from Chamber Experiments and Implications for Global Secondary Organic Aerosol. Environ. Sci. Technol. 2023, 57, 53–63. [Google Scholar] [CrossRef] [PubMed]
- Bian, Q.; May, A.A.; Kreidenweis, S.M.; Pierce, J.R. Investigation of particle and vapor wall-loss effects on controlled wood-smoke smog-chamber experiments. Atmos. Chem. Phys. 2015, 15, 11027–11045. [Google Scholar] [CrossRef]
- Corner, J.; Pendlebury, E.D. The Coagulation and Deposition of a Stirred Aerosol. Proc. Phys. Soc. Sect. B 1951, 64, 645–654. [Google Scholar] [CrossRef]
- Crump, J.G.; Seinfeld, J.H. Turbulent Deposition and Gravitational Sedimentation of an Aerosol in a Vessel of Arbitrary Shape. J. Aerosol Sci. 1981, 12, 405–415. [Google Scholar] [CrossRef]
- Charan, S.M.; Kong, W.M.; Flagan, R.C.; Seinfeld, J.H. Effect of particle charge on aerosol dynamics in Teflon environmental chambers. Aerosol Sci. Technol. 2018, 52, 854–871. [Google Scholar] [CrossRef]
- Park, S.H.; Kim, H.O.; Han, Y.T.; Kwon, S.B.; Lee, K.W. Wall loss rate of polydispersed aerosols. Aerosol Sci. Technol. 2001, 35, 710–717. [Google Scholar] [CrossRef]
- Nakagawa, A.; Bates, K.H.; Nguyen, T.B. Size-dependent depositional loss of inorganic, organic, and mixed composition particles to Teflon chamber walls under various environmental and chemical conditions. Aerosol Sci. Technol. 2024, 58, 170–180. [Google Scholar] [CrossRef]
- Pierce, J.R.; Engelhart, G.J.; Hildebrandt, L.; Weitkamp, E.A.; Pathak, R.K.; Donahue, N.M.; Robinson, A.L.; Adams, P.J.; Pandis, S.N. Constraining Particle Evolution from Wall Losses, Coagulation, and Condensation-Evaporation in Smog-Chamber Experiments: Optimal Estimation Based on Size Distribution Measurements. Aerosol Sci. Technol. 2008, 42, 1001–1015. [Google Scholar] [CrossRef]
- Benes, M.; Holub, R.F. Aerosol wall deposition in enclosures investigated by means of a stagnant layer. Environ. Int. 1996, 22, S883–S889. [Google Scholar] [CrossRef]
- Takekawa, H.; Minoura, H.; Yamazaki, S. Temperature dependence of secondary organic aerosol formation by photo-oxidation of hydrocarbons. Atmos. Environ. 2003, 37, 3413–3424. [Google Scholar] [CrossRef]
- Nah, T.; McVay, R.C.; Pierce, J.R.; Seinfeld, J.H.; Ng, N.L. Constraining uncertainties in particle-wall deposition correction during SOA formation in chamber experiments. Atmos. Chem. Phys. 2017, 17, 2297–2310. [Google Scholar] [CrossRef]
- Wang, N.; Jorga, S.D.; Pierce, J.R.; Donahue, N.M.; Pandis, S.N. Particle wall-loss correction methods in smog chamber experiments. Atmos. Meas. Tech. 2018, 11, 6577–6588. [Google Scholar] [CrossRef]
- Pathak, R.K.; Stanier, C.O.; Donahue, N.M.; Pandis, S.N. Ozonolysis of α-pinene at atmospherically relevant concentrations: Temperature dependence of aerosol mass fractions (yields). J. Geophys. Res. Atmos. 2007, 112, D03201. [Google Scholar] [CrossRef]
- McMurry, P.H.; Grosjean, D. Gas and aerosol wall losses in Teflon film smog chambers. Environ. Sci. Technol. 1985, 19, 1176–1182. [Google Scholar] [CrossRef]
- Grosjean, D. Wall loss of gaseous pollutants in outdoor Teflon chambers. Environ. Sci. Technol. 1985, 19, 1059–1065. [Google Scholar] [CrossRef]
- Pratap, V.; Kiran, S.A.; Bian, Q.; Pierce, J.R.; Hopke, P.K.; Nakao, S. Observation of Vapor Wall Deposition in a Smog Chamber Using Size Evolution of Pure Organic Particles. Aerosol Air Qual. Res. 2020, 20, 2705–2714. [Google Scholar] [CrossRef]
- Yu, S.; Jia, L.; Xu, Y.; Zhang, H.; Zhang, Q.; Pan, Y. Wall losses of oxygenated volatile organic compounds from oxidation of toluene: Effects of chamber volume and relative humidity. J. Environ. Sci. 2022, 114, 475–484. [Google Scholar] [CrossRef] [PubMed]
- He, L.; Liu, W.; Li, Y.; Wang, J.; Kuwata, M.; Liu, Y. Wall loss of semi-volatile organic compounds in a Teflon bag chamber for the temperature range of 262–298 K: Mechanistic insight on temperature dependence. Atmos. Meas. Tech. 2024, 17, 755–764. [Google Scholar] [CrossRef]
- Ye, P.; Ding, X.; Hakala, J.; Hofbauer, V.; Robinson, E.S.; Donahue, N.M. Vapor wall loss of semi-volatile organic compounds in a Teflon chamber. Atmos. Meas. Tech. 2016, 50, 822–834. [Google Scholar] [CrossRef]
- Krechmer, J.E.; Pagonis, D.; Ziemann, P.J.; Jimenez, J.L. Quantification of Gas-Wall Partitioning in Teflon Environmental Chambers Using Rapid Bursts of Low-Volatility Oxidized Species Generated in Situ. Environ. Sci. Technol. 2016, 50, 5757–5765. [Google Scholar] [CrossRef] [PubMed]
- Matsunaga, A.; Ziemann, P.J. Gas-Wall Partitioning of Organic Compounds in a Teflon Film Chamber and Potential Effects on Reaction Product and Aerosol Yield Measurements. Atmos. Meas. Tech. 2010, 44, 881–892. [Google Scholar] [CrossRef]
- Yeh, G.K.; Ziemann, P.J. Gas-Wall Partitioning of Oxygenated Organic Compounds: Measurements, Structure–Activity Relationships, and Correlation with Gas Chromatographic Retention Factor. Atmos. Meas. Tech. 2015, 49, 727–738. [Google Scholar] [CrossRef]
- Donahue, N.M.; Robinson, A.L.; Stanier, C.O.; Pandis, S.N. Coupled Partitioning, Dilution, and Chemical Aging of Semivolatile Organics. Environ. Sci. Technol. 2006, 40, 2635–2643. [Google Scholar] [CrossRef]
- Zhao, Y.L.; Hennigan, C.J.; May, A.A.; Tkacik, D.S.; de Gouw, J.A.; Gilman, J.B.; Kuster, W.C.; Borbon, A.; Robinson, A.L. Intermediate-Volatility Organic Compounds: A Large Source of Secondary Organic Aerosol. Environ. Sci. Technol. 2014, 48, 13743–13750. [Google Scholar] [CrossRef]
- Donahue, N.M.; Robinson, A.L.; Pandis, S.N. Atmospheric organic particulate matter: From smoke to secondary organic aerosol. Atmos. Environ. 2009, 43, 94–106. [Google Scholar] [CrossRef]
- Seinfeld, J.H.; Pandis, S.N. Atmospheric Chemistry and Physics: From Air Pollution to Climate Change, 3rd ed.; Wiley: Hoboken, NJ, USA, 2016. [Google Scholar]
- Hawthorne, S.B.; Miller, D.J.; Langenfeld, J.J.; Krieger, M.S. PM-10 high-volume collection and quantitation of semivolatile and nonvolatile phenols, methoxylated phenols, alkanes, and polycyclic aromatic-hydrocarbons from winter urban air and their relationship to wood smoke emissions. Environ. Sci. Technol. 1992, 26, 2251–2262. [Google Scholar] [CrossRef]
- Li, M.; Wang, X.F.; Lu, C.Y.; Li, R.; Zhang, J.; Dong, S.W.; Yang, L.X.; Xue, L.K.; Chen, J.M.; Wang, W.X. Nitrated phenols and the phenolic precursors in the atmosphere in urban Jinan, China. Sci. Total Environ. 2020, 714, 136760. [Google Scholar] [CrossRef]
- Xu, R.; Alam, M.S.; Stark, C.; Harrison, R.M. Composition and emission factors of traffic- emitted intermediate volatility and semi-volatile hydrocarbons (C10–C36) at a street canyon and urban background sites in central London, UK. Atmos. Environ. 2020, 231, 117448. [Google Scholar] [CrossRef]
- Fang, H.; Huang, X.; Zhang, Y.; Pei, C.; Huang, Z.; Wang, Y.; Chen, Y.; Yan, J.; Zeng, J.; Xiao, S.; et al. Measurement report: Emissions of intermediate-volatility organic compounds from vehicles under real-world driving conditions in an urban tunnel. Atmos. Chem. Phys. 2021, 21, 10005–10013. [Google Scholar] [CrossRef]
- Fang, H.; Luo, S.; Huang, X.; Fu, X.; Xiao, S.; Zeng, J.; Wang, J.; Zhang, Y.; Wang, X. Ambient naphthalene and methylnaphthalenes observed at an urban site in the Pearl River Delta region: Sources and contributions to secondary organic aerosol. Atmos. Environ. 2021, 252, 118295. [Google Scholar] [CrossRef]
- Li, J.; Li, K.; Li, H.; Wang, X.; Wang, W.; Wang, K.; Ge, M. Long-chain alkanes in the atmosphere: A review. J. Environ. Sci. 2022, 114, 37–52. [Google Scholar] [CrossRef] [PubMed]
- Robinson, A.L.; Donahue, N.M.; Shrivastava, M.K.; Weitkamp, E.A.; Sage, A.M.; Grieshop, A.P.; Lane, T.E.; Pierce, J.R.; Pandis, S.N. Rethinking Organic Aerosols: Semivolatile Emissions and Photochemical Aging. Science 2007, 315, 1259–1262. [Google Scholar] [CrossRef]
- Hodzic, A.; Jimenez, J.L.; Madronich, S.; Canagaratna, M.R.; DeCarlo, P.F.; Kleinman, L.; Fast, J. Modeling organic aerosols in a megacity: Potential contribution of semi-volatile and intermediate volatility primary organic compounds to secondary organic aerosol formation. Atmos. Chem. Phys. 2010, 10, 5491–5514. [Google Scholar] [CrossRef]
- Lu, Q.; Murphy, B.N.; Qin, M.; Adams, P.J.; Zhao, Y.; Pye, H.O.T.; Efstathiou, C.; Allen, C.; Robinson, A.L. Simulation of organic aerosol formation during the CalNex study: Updated mobile emissions and secondary organic aerosol parameterization for intermediate-volatility organic compounds. Atmos. Chem. Phys. 2020, 20, 4313–4332. [Google Scholar] [CrossRef] [PubMed]
- Chang, X.; Zhao, B.; Zheng, H.; Wang, S.; Cai, S.; Guo, F.; Gui, P.; Huang, G.; Wu, D.; Han, L.; et al. Full-volatility emission framework corrects missing and underestimated secondary organic aerosol sources. One Earth 2022, 5, 403–412. [Google Scholar] [CrossRef]
- Tkacik, D.S.; Presto, A.A.; Donahue, N.M.; Robinson, A.L. Secondary Organic Aerosol Formation from Intermediate-Volatility Organic Compounds: Cyclic, Linear, and Branched Alkanes. Environ. Sci. Technol. 2012, 46, 8773–8781. [Google Scholar] [CrossRef]
- Lim, Y.B.; Ziemann, P.J. Products and mechanism of secondary organic aerosol formation from reactions of n-alkanes with OH radicals in the presence of NOx. Environ. Sci. Technol. 2005, 39, 9229–9236. [Google Scholar] [CrossRef] [PubMed]
- Li, K.; Zhang, J.; Bell, D.M.; Wang, T.; Lamkaddam, H.; Cui, T.; Qi, L.; Surdu, M.; Wang, D.; Du, L.; et al. Uncovering the dominant contribution of intermediate volatility compounds in secondary organic aerosol formation from biomass-burning emissions. Natl. Sci. Rev. 2024, 11, nwae014. [Google Scholar] [CrossRef] [PubMed]
- Ling, Z.H.; Wu, L.Q.; Wang, Y.H.; Shao, M.; Wang, X.M.; Huang, W.W. Roles of semivolatile and intermediate-volatility organic compounds in secondary organic aerosol formation and its implication: A review. J. Environ. Sci. 2022, 114, 259–285. [Google Scholar] [CrossRef] [PubMed]
- Chan, A.W.H.; Kautzman, K.E.; Chhabra, P.S.; Surratt, J.D.; Chan, M.N.; Crounse, J.D.; Kürten, A.; Wennberg, P.O.; Flagan, R.C.; Seinfeld, J.H. Secondary organic aerosol formation from photooxidation of naphthalene and alkylnaphthalenes: Implications for oxidation of intermediate volatility organic compounds (IVOCs). Atmos. Chem. Phys. 2009, 9, 3049–3060. [Google Scholar] [CrossRef]
- Lim, Y.B.; Ziemann, P.J. Effects of Molecular Structure on Aerosol Yields from OH Radical-Initiated Reactions of Linear, Branched, and Cyclic Alkanes in the Presence of NOx. Environ. Sci. Technol. 2009, 43, 2328–2334. [Google Scholar] [CrossRef]
- Shakya, K.M.; Griffin, R.J. Secondary Organic Aerosol from Photooxidation of Polycyclic Aromatic Hydrocarbons. Environ. Sci. Technol. 2010, 44, 8134–8139. [Google Scholar] [CrossRef] [PubMed]
- Presto, A.A.; Miracolo, M.A.; Donahue, N.M.; Robinson, A.L. Secondary Organic Aerosol Formation from High-NOx Photo-Oxidation of Low Volatility Precursors: N-Alkanes. Environ. Sci. Technol. 2010, 44, 2029–2034. [Google Scholar] [CrossRef] [PubMed]
- Riva, M.; Healy, R.M.; Faud, P.-M.; Perraudin, E.; Wenger, J.C.; Villenave, E. Gas- and Particle-Phase Products from the Chlorine-Initiated Oxidation of Polycyclic Aromatic Hydrocarbons. J. Phys. Chem. A 2015, 119, 11170–11181. [Google Scholar] [CrossRef]
- Shi, B.; Wang, W.; Zhou, L.; Li, J.; Wang, J.; Chen, Y.; Zhang, W.; Ge, M. Kinetics and mechanisms of the gas-phase reactions of OH radicals with three C15 alkanes. Atmos. Environ. 2019, 207, 75–81. [Google Scholar] [CrossRef]
- Wang, K.; Wang, W.; Fan, C.; Li, J.; Lei, T.; Zhang, W.; Shi, B.; Chen, Y.; Liu, M.; Lian, C.; et al. Reactions of C12−C14 n-Alkylcyclohexanes with Cl Atoms: Kinetics and Secondary Organic Aerosol Formation. Environ. Sci. Technol. 2022, 56, 4859–4870. [Google Scholar] [CrossRef] [PubMed]
- Pankow, J.F. An absorption-model of gas-particle partitioning of organic-compounds in the atmosphere. Atmos. Environ. 1994, 28, 185–188. [Google Scholar] [CrossRef]
- Chu, B.; Chen, T.; Liu, Y.; Ma, Q.; Mu, Y.; Wang, Y.; Ma, J.; Zhang, P.; Liu, J.; Liu, C.; et al. Application of smog chambers in atmospheric process studies. Natl. Sci. Rev. 2022, 9, nwab103. [Google Scholar] [CrossRef] [PubMed]
- Srivastava, D.; Vu, T.V.; Tong, S.; Shi, Z.; Harrison, R.M. Formation of secondary organic aerosols from anthropogenic precursors in laboratory studies. npj Clim. Atmos. Sci. 2022, 5, 22. [Google Scholar] [CrossRef]
- Deng, W.; Liu, T.Y.; Zhang, Y.L.; Situ, S.P.; Hu, Q.H.; He, Q.F.; Zhang, Z.; Lü, S.J.; Bi, X.H.; Wang, X.M.; et al. Secondary organic aerosol formation from photo-oxidation of toluene with NOx and SO2: Chamber simulation with purified air versus urban ambient air as matrix. Atmos. Environ. 2017, 150, 67–76. [Google Scholar] [CrossRef]
- Fang, Z.; Deng, W.; Zhang, Y.L.; Ding, X.; Tang, M.J.; Liu, T.Y.; Hu, Q.H.; Zhu, M.; Wang, Z.Y.; Yang, W.Q.; et al. Open burning of rice, corn and wheat straws: Primary emissions, photochemical aging, and secondary organic aerosol formation. Atmos. Chem. Phys. 2017, 17, 14821–14839. [Google Scholar] [CrossRef]
- Liu, T.Y.; Wang, Z.Y.; Wang, X.M.; Chan, C.K. Primary and secondary organic aerosol from heated cooking oil emissions. Atmos. Chem. Phys. 2018, 18, 11363–11374. [Google Scholar] [CrossRef]
- Li, X.; Ren, Z.; Zhang, X.; Pang, X.; Song, W.; Zhang, Y.; Wang, X. Differences in Secondary Organic Aerosol Formation from α-Pinene Photooxidation in a Chamber with Purified Air and Ambient Air as Matrices: Preliminary Results. Atmosphere 2024, 15, 204. [Google Scholar] [CrossRef]
- Fu, X.W.; Li, X.Y.; Zhang, F.; Ren, Z.Y.; Ge, A.Q.; Zhang, X.Y.; Fang, Z.; Song, W.; Deng, W.; Zhang, Y.L.; et al. Evolution of Light Absorption Enhancement of Black Carbon Aerosols from Biomass Burning in Atmospheric Photochemical Aging. J. Geophys. Res. Atmos. 2024, 129, e2024JD040756. [Google Scholar] [CrossRef]
- Wang, X.; Liu, T.; Bernard, F.; Ding, X.; Wen, S.; Zhang, Y.; Zhang, Z.; He, Q.; Lü, S.; Chen, J.; et al. Design and characterization of a smog chamber for studying gas-phase chemical mechanisms and aerosol formation. Atmos. Meas. Tech. 2014, 7, 301–313. [Google Scholar] [CrossRef]
- Riva, M.; Healy, R.M.; Flaud, P.-M.; Perraudin, E.; Wenger, J.C.; Villenave, E. Kinetics of the Gas-Phase Reactions of Chlorine Atoms with Naphthalene, Acenaphthene, and Acenaphthylene. J. Phys. Chem. A 2014, 118, 3535–3540. [Google Scholar] [CrossRef] [PubMed]
- Tong, M.; Zhang, Y.; Xiao, S.; Pei, C.; Wang, J.; Zhang, R.; Huang, X.; Song, W.; Wang, X. Role of Organic Vapor Precursors in Secondary Organic Aerosol Formation: Concurrent Observations of IVOCs and VOCs in Guangzhou. J. Geophys. Res. Atmos. 2024, 129, e2024JD041018. [Google Scholar] [CrossRef]
- Zhang, X.; Schwantes, R.H.; McVay, R.C.; Lignell, H.; Coggon, M.M.; Flagan, R.C.; Seinfeld, J.H. Vapor wall deposition in Teflon chambers. Atmos. Chem. Phys. 2015, 15, 4197–4214. [Google Scholar] [CrossRef]
- Huang, Y.; Zhao, R.; Charan, S.M.; Kenseth, C.M.; Zhang, X.; Seinfeld, J.H. Unified Theory of Vapor-Wall Mass Transport in Teflon-Walled Environmental Chambers. Environ. Sci. Technol. 2018, 52, 2134–2142. [Google Scholar] [CrossRef]
- Tang, M.J.; Shiraiwa, M.; Pöschl, U.; Cox, R.A.; Kalberer, M. Compilation and evaluation of gas phase diffusion coefficients of reactive trace gases in the atmosphere: Volume 2. Diffusivities of organic compounds, pressure-normalised mean free paths, and average Knudsen numbers for gas uptake calculations. Atmos. Chem. Phys. 2015, 15, 5585–5598. [Google Scholar] [CrossRef]
- Seinfeld, J.H.; Erdakos, G.B.; Asher, W.E.; Pankow, J.F. Modeling the formation of secondary organic aerosol (SOA). 2. The predicted effects of relative humidity on aerosol formation in the α-pinene-, β-pinene-, sabinene-, Δ3-Carene-, and cyclohexene-ozone systems. Environ. Sci. Technol. 2001, 35, 1806–1817. [Google Scholar] [CrossRef] [PubMed]
- Compernolle, S.; Ceulemans, K.; Müller, J.F. Evaporation: A new vapour pressure estimation methodfor organic molecules including non-additivity and intramolecular interactions. Atmos. Chem. Phys. 2011, 11, 9431–9450. [Google Scholar] [CrossRef]
- Lyman, W.J. Environmental Exposure From Chemicals, 1st ed.; CRC Press: Boca Raton, FL, USA, 1985; pp. 13–48. [Google Scholar]
- Charan, S.M.; Huang, Y.; Seinfeld, J.H. Computational Simulation of Secondary Organic Aerosol Formation in Laboratory Chambers. Chem. Rev. 2019, 119, 11912–11944. [Google Scholar] [CrossRef] [PubMed]
- Le, C.; Xu, N.; Li, Q.; Collins, D.R.; Cocker, D.R., III. Experimental characterization of particle wall-loss behaviors in UCR dual-903 Teflon chambers. Aerosol Sci. Technol. 2024, 58, 288–300. [Google Scholar] [CrossRef]
- US EPA. Estimation Programs Interface Suite™ for Microsoft® Windows, v 4.11; United States Environmental Protection Agency: Washington, DC, USA, 2012. [Google Scholar]
- Mandalakis, M.; Tsapakis, M.; Tsoga, A.; Stephanou, E.G. Gas–particle concentrations and distribution of aliphatic hydrocarbons, PAHs, PCBs and PCDD/Fs in the atmosphere of Athens (Greece). Atmos. Environ. 2002, 36, 4023–4035. [Google Scholar] [CrossRef]
- Esen, F.; Tasdemir, Y.; Bozkurt, Y.M. Assessments of seasonal trend, gas–particle partitioning and deposition flux of polycyclic aromatic hydrocarbons at a semi-rural site. J. Environ. Sci. Health Part A 2019, 54, 582–591. [Google Scholar] [CrossRef] [PubMed]
- Goss, K.-U.; Schwarzenbach, R.P. Gas/Solid and Gas/Liquid Partitioning of Organic Compounds: Critical Evaluation of the Interpretation of Equilibrium Constants. Environ. Sci. Technol. 1998, 32, 2025–2032. [Google Scholar] [CrossRef]
Disclaimer/Publisher’s Note: The statements, opinions and data contained in all publications are solely those of the individual author(s) and contributor(s) and not of MDPI and/or the editor(s). MDPI and/or the editor(s) disclaim responsibility for any injury to people or property resulting from any ideas, methods, instructions or products referred to in the content. |
© 2024 by the authors. Licensee MDPI, Basel, Switzerland. This article is an open access article distributed under the terms and conditions of the Creative Commons Attribution (CC BY) license (https://creativecommons.org/licenses/by/4.0/).