Article

Evaluation and Application of Wellbore Stability of Deep Oil Wells in the Southern Margin of Junggar Basin

1
Engineering Technology Research Institute, Xinjiang Oilfield Company, Karamay 834000, China
2
School of Petroleum Engineering, Chongqing University of Science and Technology, Chongqing 434000, China
3
State Key Laboratory of Oil and Gas Reservoir Geology and Exploitation, Southwest Petroleum University, Chengdu 610500, China
4
No.2 Oil Production Plant of PetroChina Changqing Oilfield Company, Qingyang 745100, China
*
Author to whom correspondence should be addressed.
Processes 2024, 12(10), 2145; https://doi.org/10.3390/pr12102145
Submission received: 1 September 2024 / Revised: 27 September 2024 / Accepted: 29 September 2024 / Published: 2 October 2024
(This article belongs to the Section Energy Systems)

Abstract

:
The stability of the oil well wellbore is a prerequisite for selecting the optimal completion method. In this paper, based on experimental testing and theoretical models of rock mechanics parameters in deep oil reservoirs, the in situ stress parameters of deep oil wells are accurately predicted. On this basis, a full life cycle assessment model for wellbore and perforation casing stability was established, and the effects of pressure depletion and changes in the production pressure differential on wellbore stability and casing stability were analyzed. The research results indicate that as the formation pressure decreases, the critical collapse pressure difference around the wellbore significantly decreases. The greater the production pressure difference, the more likely the wellbore is to become unstable. Under the original formation pressure coefficient, if there is no casing, the critical failure pressure difference of the wellbore wall is 55 MPa. After cementing and perforation, when the casing is uniformly stressed and the formation pressure drops to a coefficient of 0.83, the casing will not be damaged even when the wellbore is completely emptied. At this time, there is still a certain safety production pressure difference in the perforated formation. This study can effectively guide the optimization of well completion and safe development in deep oil reservoirs.

1. Introduction

Deep high-pressure sandstone reservoirs contain enormous reserves and have extremely high production [1,2]. The geological conditions of the Gaoquanbei sandstone reservoir in the southern margin are complex. Due to the long wellbore structure, high temperature and pressure gradients, and complex rock mechanics and geological factors in deep formations, the stability of the wellbore wall in deep wells faces great challenges [3,4,5]. The optimization design of well completion in the southern margin lacks theoretical guidance, and such wells face difficulties in safe completion and development [6,7]. Accurate evaluation and prediction of wellbore stability and casing stability play an important guiding role in selecting optimal completion methods.
A large number of on-site practices and theoretical analyses have been conducted both domestically and internationally for the application of typical deep well completion methods. The main reservoirs in China include the Changxing Formation reservoir in the Yuanba gas field of the Sichuan Basin, the ultra-tight gas reservoir in the Xujiahe Formation of western Sichuan, the tight reservoir in the Keshen block of Kuqa Mountain in the Tarim Oilfield, and the Silurian Kepingtage Formation in the Shun9 well area of the Tazhong Oilfield [8,9,10]. The Marnock high-temperature and high-pressure sandstone gas reservoir in the UK adopts an open hole completion design [11]. The selection of well completion methods needs to be demonstrated and optimized based on reservoir conditions and wellbore stability.
In the field of wellbore stability theory research, some scholars have derived mathematical models of elastic–plastic stress distribution around vertical and inclined wellbores based on elastic mechanics and elastic–plastic mechanics. Considering homogeneous reservoir rocks, these models have been applied to wellbore stability analysis [12,13,14,15]. Hikweon et al. established a wellbore collapse pressure model considering rock anisotropy. Research has shown that rock structure affects the failure mode of heterogeneous rocks and provides a method for determining the shear failure zone of shale under stress field changes [16]. Ma T et al. proposed a semi-analytical model for wellbore stability analysis based on the wellbore stress distribution model, the Mogi Coulomb failure criterion considering the influence of intermediate principal stress, and the leakage width model [17]. Behnoud et al. considered the wellbore trajectory during drilling and production, as well as the circumferential stress of the wellbore wall during reservoir attenuation. Combined with the Mogi–Coulomb failure criterion, they simulated the changes in pore pressure near the wellbore and designed the wellbore trajectory to maintain wellbore stability and optimize reservoir drilling and production operations [18]. Reisabdi et al. established an analytical model for predicting wellbore stability by coupling the effects of pressure depletion, matrix shrinkage, and wellbore trajectory in order to analyze the risk of wellbore stability during horizontal well production [19]. Ding et al. proposed a wellbore stability model considering the effects of stress unloading and hydration during drilling, taking into account the theory of transverse shale isotropy and weak plane criteria [2]. Mansourizadeh et al. used three shear failure criteria, namely Mohr–Coulomb, Mogi–Coulomb, and Hooke–Brown, to predict wellbore failure pressure profiles and studied the influence of inclination and azimuth angles on breakthrough pressure using stress conversion equations. The study found that the Hoek–Brown failure criterion has the best predictive effect on wellbore failure pressure [20]. Xu et al. analyzed the advantages and disadvantages of various intelligent prediction models for wellbore stability. The proposal of wellbore stability prediction based on neural network models and deep learning has great research potential [21].
Unlike analytical modeling methods, the finite element method can be used to establish complex finite element models of perforated casing. It can effectively analyze the influence of parameters such as perforation density, phase, and perforation diameter on the remaining strength of perforated casing. The degree of strength reduction of the perforated casing is mainly affected by the spacing between adjacent holes in the axial direction. The smaller the spacing, the greater the strength reduction [22,23,24]. The finite element analysis method can perform dynamic analysis considering multiple factors coupled together. In the study of wellbore stability, the most intuitive approach is to couple the stress on the wellbore with the influence of liquid-phase factors and obtain the distribution of seepage and stress fields in the wellbore and surrounding strata [22,23]. Yu et al. analyzed the influence of different material properties on the non-uniform load borne using spiral perforation casing in the open-hole completion of vertical and horizontal wells at different depths based on the finite element method, providing a theoretical basis for determining the perforation aperture, phase, and density of casing and selecting them reasonably to ensure the safety of casing use [25]. Abdollahapour A et al. proposed using maximum wellbore displacement as a stability factor to evaluate wellbore stability. The research results indicate that there are significant differences in the importance of parameters based on rock strength for wellbore stability [26]. Although previous researchers have conducted a lot of work on wellbore stability analysis, these methods mainly target ordinary deep oil reservoirs and have low adaptability to high-pressure, high-yield, and ultra-deep oil reservoirs [27,28,29]. The rock mechanics parameters and geostress parameters of deep reservoirs vary significantly, and the stability of the wellbore depends on reliable rock mechanics parameters and geostress predictions. There is still a lack of research on wellbore stability analysis under the conditions of pore pressure depletion throughout the entire life cycle and under different production pressure differences. The lack of stress variation has an impact on the stability of wellbore rock. It is necessary to analyze the impact of stress concentration from multiple perforations on casing stability under the conditions of a three-dimensional perforation casing model throughout the entire life cycle of perforation after cementing.
In this paper, based on shale-related experimental data obtained from experiments and combined with logging data, a rock mechanics experiment and geostress prediction model for the Qingshuihe Formation reservoir are established (Section 2). Stability assessment models for wellbore and perforated casing were established separately (Section 3). An analysis was conducted on the wellbore stability of a high-pressure and high-yield example well in the southern margin sandstone reservoir (Section 4). The research conducted for this project could also meet the needs of designing completion plans for horizontal wells in similar oil and gas reservoirs.

2. Reservoir Rock Mechanics Experiment and Stress Prediction

The target reservoir has a large well depth, high pressure and temperature, and a long vertical wellbore. Well G102 is a vertical well with a designed depth of 6120 m. The formation pressure is 135.52 MPa. The temperature is about 130–140 °C. Rock mechanics parameters and geostress are the basis for predicting wellbore stability. Therefore, static rock mechanics parameters of high-temperature and high-pressure reservoirs are obtained based on uniaxial and triaxial compression tests. Using the RTR-1000 three-axis rock mechanics servo-testing system manufactured by GCTS, the three-axis experimental samples were processed into cylindrical specimens with a diameter of 25 mm × 50 mm (Figure 1). The two ends of the cylindrical specimens were flattened and polished, and the non-parallelism of the two end surfaces was less than 0.015 mm.

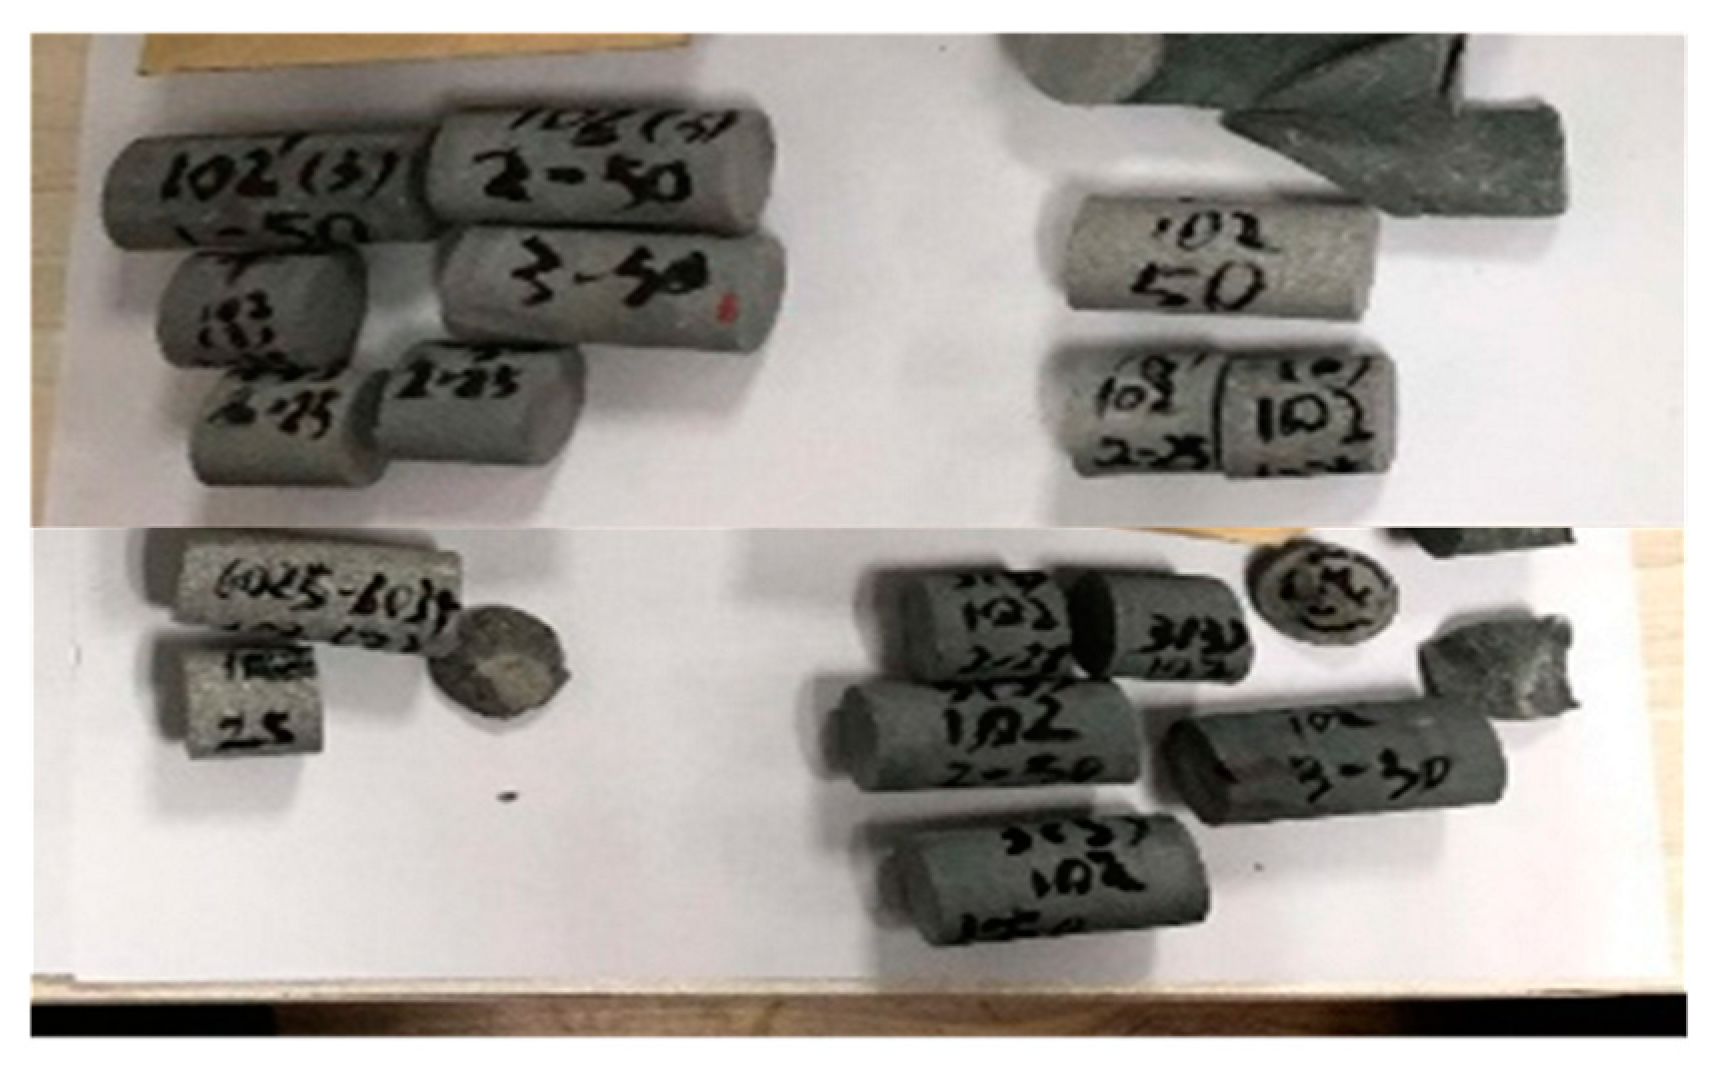
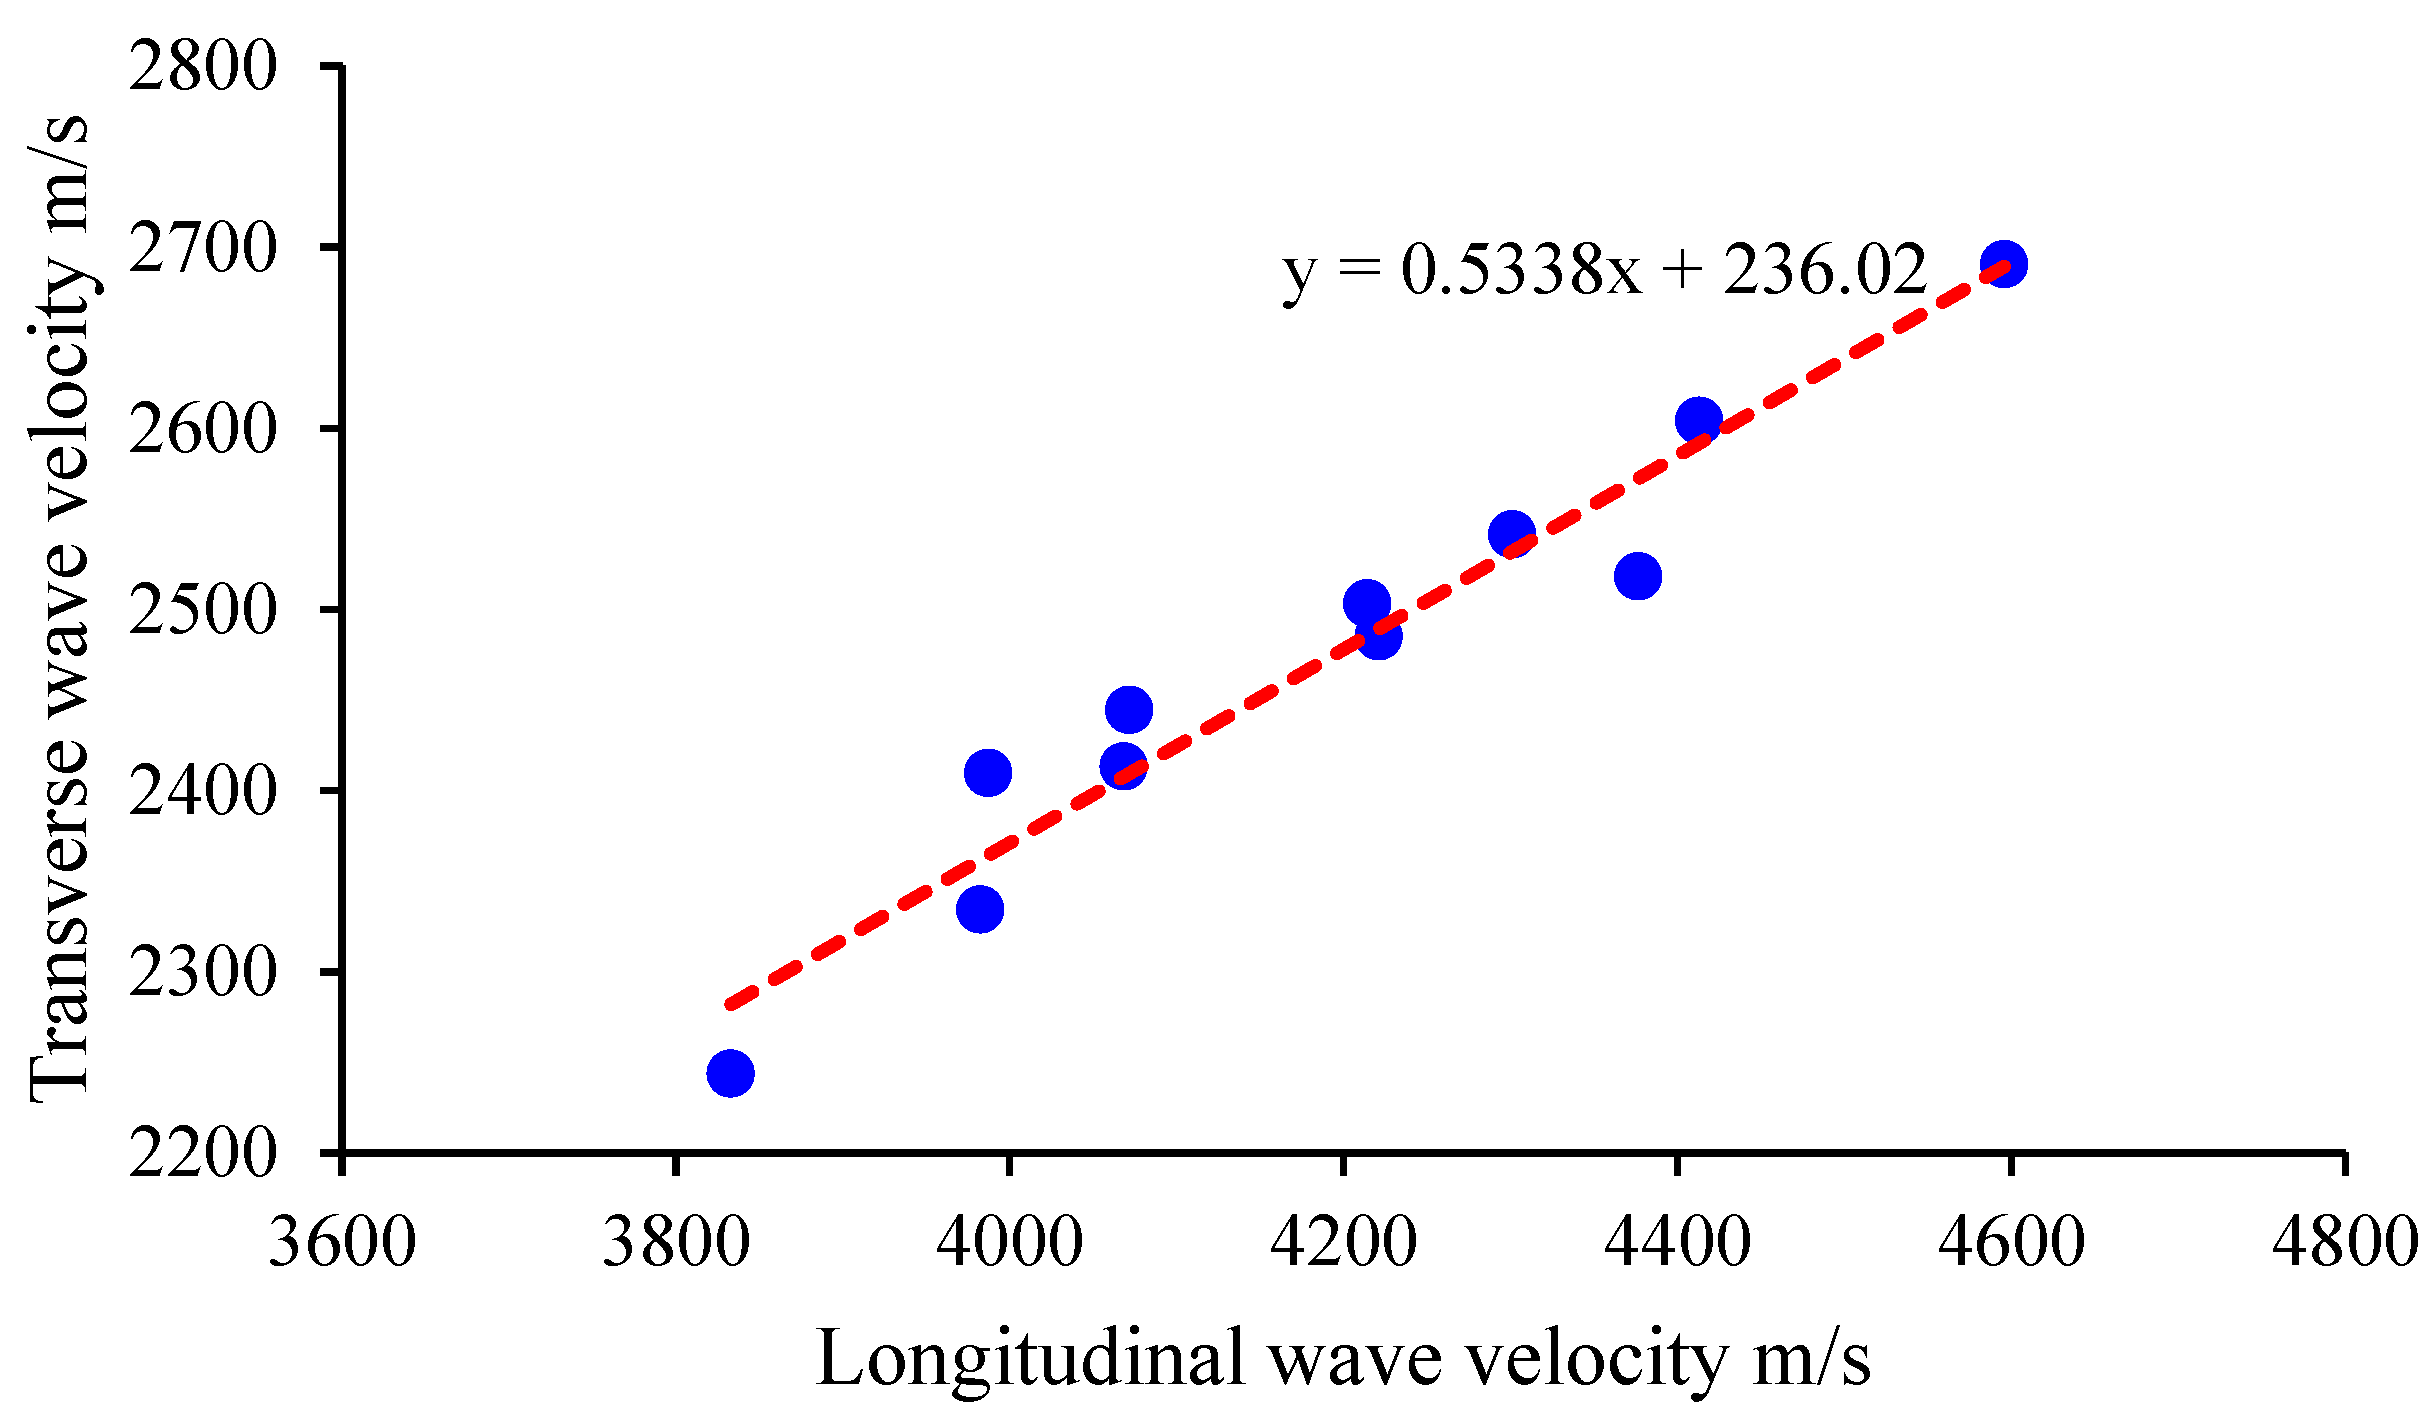
2.1. Acoustic Time Difference Measurement

Before conducting triaxial stress experiments, it is common to measure the acoustic time difference to obtain transverse and longitudinal waves. The experimental instrument used is the AUTOSCAN core automatic scanning system manufactured by NER Corporation (NJ, United States). AUTOSCAN is an integrated system used to scan the gas permeability, resistivity, and longitudinal and transverse wave velocities of rock cores or core plungers. In addition to probes for scanning complex resistivity and integrated probes for sound velocity and permeability, AUTOSCAN helps with core selection and screening, logging calibration, and the identification of rocks’ physical properties. This measurement can simulate on-site logging, and the measured parameters are dynamic parameters. According to the 11 experimental core samples of different sizes provided on site, basic data measurement is required first, including core size, length, diameter, weight, density data, etc. After applying axial and confining pressures, instrument testing was carried out to obtain P and S values. The fitting of the transverse and longitudinal wave relationship based on the data is shown in Figure 2.
The relationship between transverse and longitudinal waves fitted in indoor experiments can be expressed as follows:
V s = 0.5338 V p + 236.02
where Vs is the transverse wave velocity, m/s, and Vp is the longitudinal wave velocity, m/s.

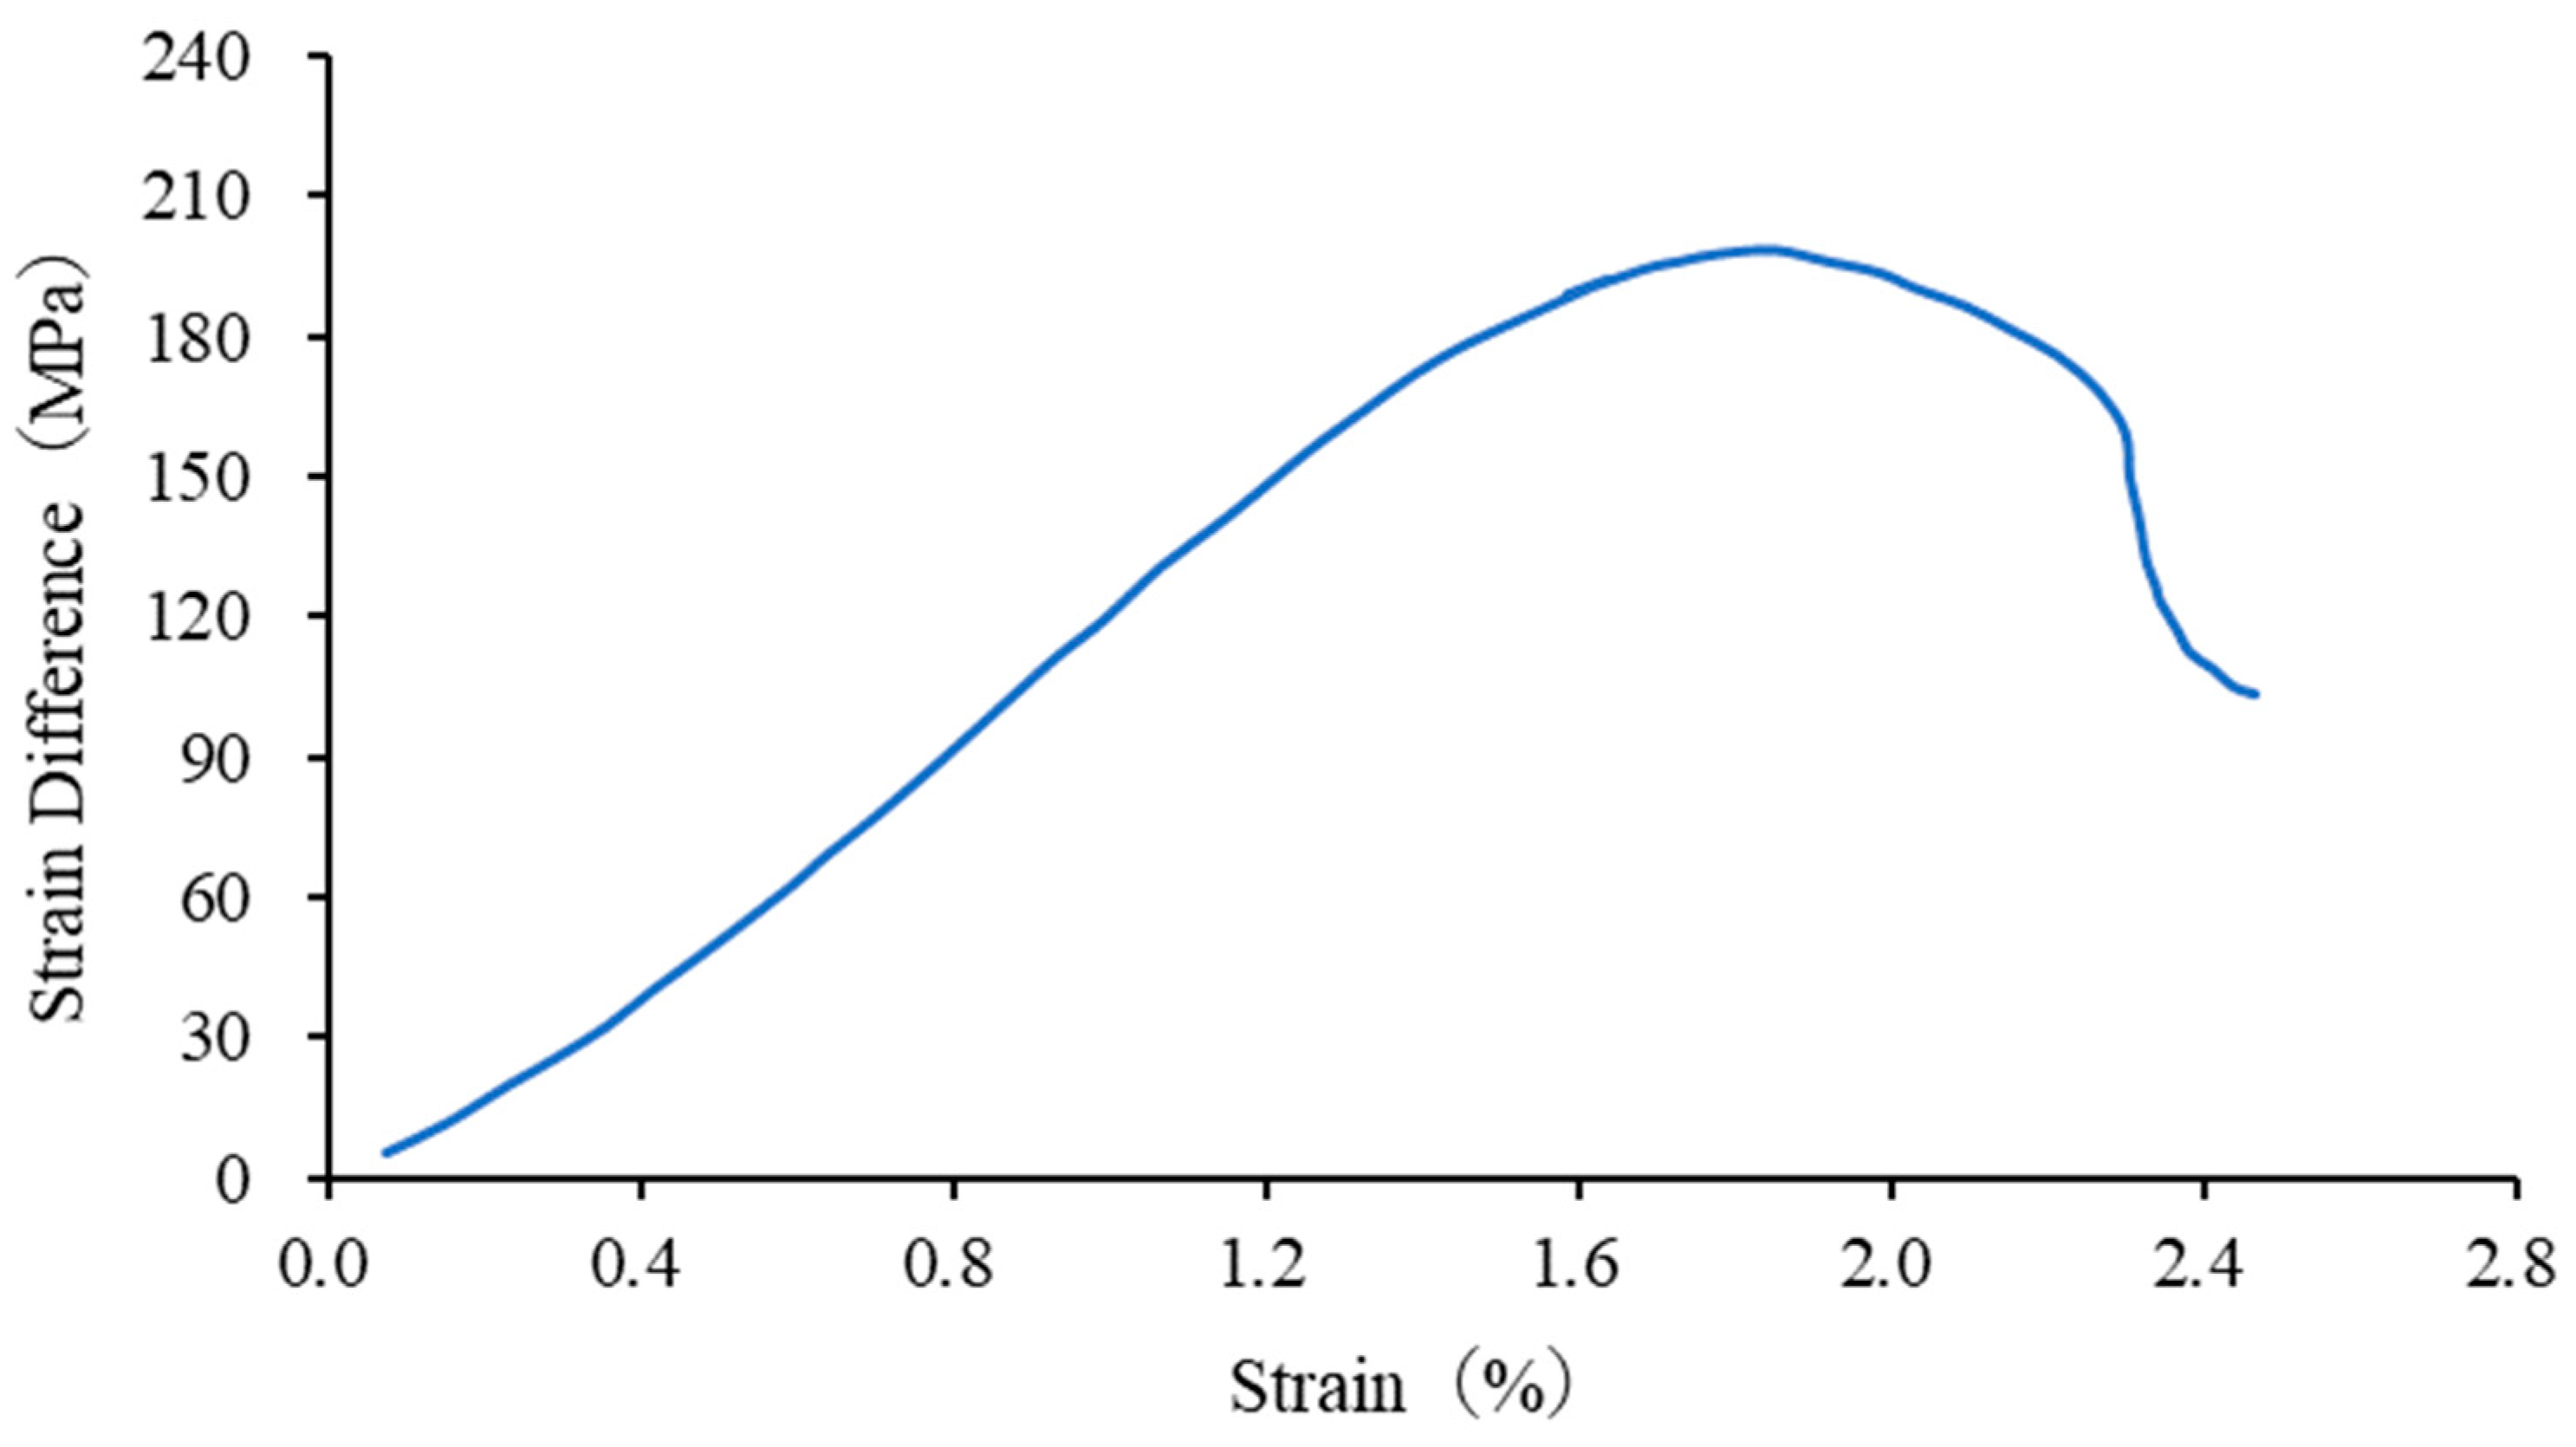
2.2. Triaxial Stress Experiment

In triaxial rock experiments, the compressive strength of rock specimens can be expressed by the differential stress (Sd) as follows [29]:
S d = σ 1 σ 2
where σ1 is the axial pressure (MPa), and P c = σ 2 = σ 3 (confining pressure) (MPa).
The testing of the static elastic parameters of rocks was carried out to measure the longitudinal and transverse deformation of the specimen under longitudinal pressure and calculate the elastic modulus and Poisson’s ratio of the rock based on this.
The elastic modulus and Poisson’s ratio can be expressed by the following [29]:
E = Δ P × H A × Δ H
μ = H d L π D H a x i s
where E and μ are, respectively, represented as the elastic modulus and Poisson’s ratio of the rock sample; ΔP is the load increment; H is the height of the specimen; A is the sample area; ΔH is the incremental of axial deformation; DL is the circumferential deformation; and Haxis is the axial deformation.
In order to simplify calculations, envelope lines in the form of straight lines are mostly used in rock mechanics. The linear Mohr–Coulomb equation can be expressed as follows [3]:
τ = σ t a n ψ + C
where C is the cohesion of the rock, MPa, and ψ is the internal friction angle of the rock, °.
The triaxial compression test results of GT-102-1 are shown in Figure 3. As shown in Figure 4, the envelope of the Mohr–Coulomb circle is plotted based on experimental data, and the cohesive force and internal friction angle are calculated through triaxial stress testing. The results of triaxial compression experiments and cohesive forces, as well as internal friction angles, for multiple samples are shown in Table 1 and Table 2.

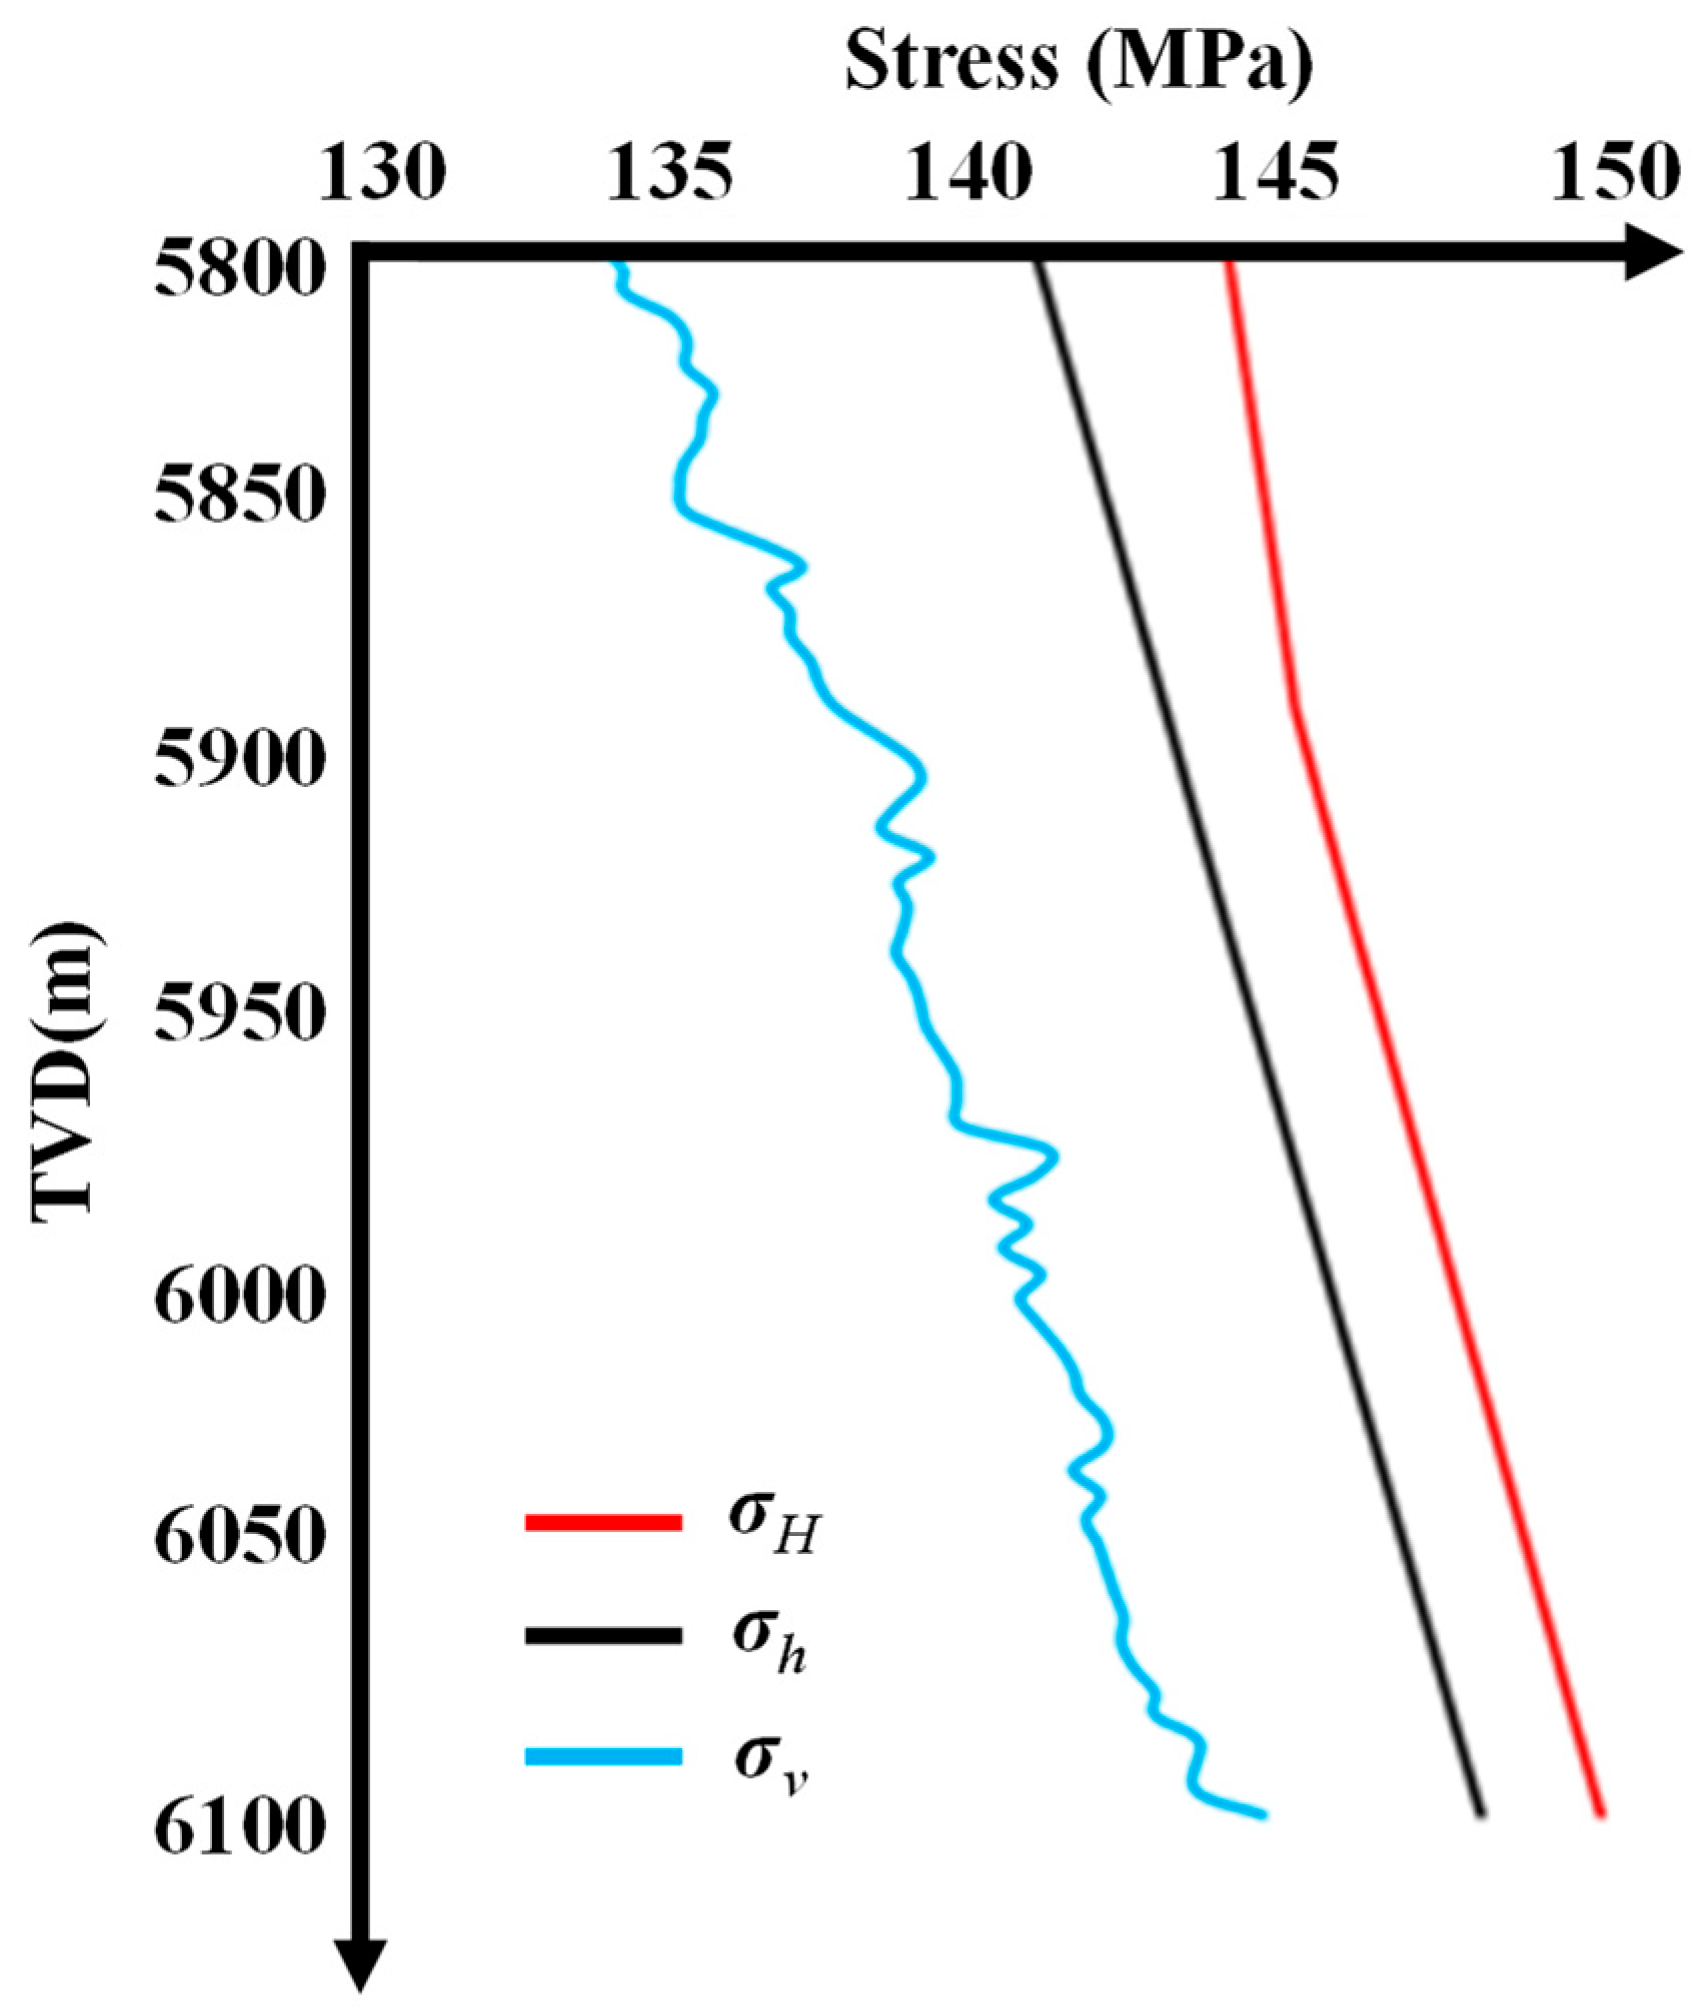
2.3. Geostress Parameter Profile

The determination of geostress is a fundamental task for studying wellbore mechanical stability and analyzing various types of wellbore failures. The vertical stress can generally be determined by integrating the density logging curve. The formula for calculating vertical stress using density logging data can be expressed as follows [6]:
σ v = g 0 D T V ρ b ( h ) d h
where σ v is the vertical stress, D T V is the true vertical depth, g is the gravity acceleration, and ρ b is the volume density.
The calculation of the maximum and minimum principal stress profiles can be directly obtained through logging parameters [13]:
σ H α p s = ν 1 ν ( σ v α p s ) + β 1 ( σ v α p s )
σ h α p s = ν 1 ν ( σ v α p s ) + β 2 ( σ v α p s )
where v is the Poisson’s ratio; E is the Young’s modulus; α is the Biot coefficient; Pp is the pore pressure of the formation, MPa; and β 1 and β 2 are the structural geostress coefficients.
The overlying rock stress, minimum horizontal principal stress, and maximum horizontal principal stress calculated through on-site data and logging curves are shown in the following figure, Figure 5. The formation pressure coefficient of the G102 well production interval is 2.33, and the average initial formation pressure is 135.52 MPa. The average vertical stress of the reservoir section is 143.2 MPa. The average minimum horizontal principal stress is 138.2 MPa. The maximum horizontal principal stress is 145.3 MPa. The static Young’s modulus of the reservoir rock is 24.91; the Poisson’s ratio is 0.17; and the internal friction angle is 48.22°. The three-dimensional stress distribution is relatively even, and the horizontal stress difference is small. The overall three-dimensional stress distribution of the target layer is relatively even, with a small horizontal stress difference, and it is a strike slip fault.

3. Evaluation Model for Wellbore Stability

When simulating the stability of wellbore rock, the compressive strength of the wellbore rock is compared with the compressive strength required to maintain the stability of the wellbore rock under stress conditions. Meanwhile, the stability of the perforated casing was analyzed by finite element software. The overlying rock pressure is jointly borne by the rock skeleton and pore fluid. With the continuous exploitation of oil and gas reservoirs, stress attenuation and formation pore pressure decrease, resulting in an increase in pressure applied to the rock skeleton. The change in stress can be expressed by the following equation [30]:
σ = σ + γ H × Δ P
γ H = α 1 2 ν 1 ν
Δ P = P c P i
where, σ is the original geostress, MPa; γ H is the coefficient of variation of geostress.; α is the Biot coefficient; ν is the Poisson’s ratio of rocks; P c is the current formation pore pressure, MPa; and Pi is the original formation pore pressure, MPa.
The use of von Mises stress to represent the stress distribution of materials is an equivalent stress based on shear strain energy. When the shape of the material undergoes a certain degree of change, the material begins to yield. This can clearly describe the changes in the results of the entire model, allowing us to quickly identify the most dangerous areas in the model. In this study, von Mises stress was used to analyze the stability of the perforated casing. This strength theory can be expressed as follows [24,25]:
1 2 σ 1 σ 2 2 + σ 2 σ 3 2 + σ 3 σ 1 2 σ

4. Evaluation of the Stability of the Wellbore

G102 is an evaluated vertical well, with the production layers being the Jurassic Toutunhe Formation and the Cretaceous Qingshuihe Formation and the completion layer being the Jurassic Xishanyao Formation (J2x). The completion method is casing perforation completion. The actual oil testing pressure coefficient of the target interval is 2.33. The Qingshuihe Formation reservoir has the characteristics of high temperature, high pressure, high yield, and ultra-depth. After the oil well is put into production, the output is high and the production pressure difference is large. With the attenuation of formation pressure, the wellbore is highly likely to experience instability and collapse. Therefore, when choosing a well completion method, the stability of the wellbore during production is the most important consideration factor. In order to study the wellbore stability of the target well during the production process, stability simulation analyses of the wellbore wall and perforation casing were carried out separately.

4.1. Stability of Wellbore under Original Formation Pressure

When the original formation pressure was 135.52 MPa, the geological mechanics GMI model was used to simulate the rock uniaxial compressive strength cloud map required to maintain the stability of the wellbore at different positions under production pressure differentials of 50 MPa, 55 MPa, 60 MPa, and 70 MPa. The cloud map of the required rock compressive strength around the well is shown in Figure 6. The production pressure difference is the difference between the formation pressure and the bottomhole flow pressure.
The blank area in the figure represents the wellbore (radius R), and the colored circular area represents the rocks around the wellbore (width 0.5R). The color bar corresponds to the rock compressive strength required to maintain stability around the wellbore. The larger the value, the greater the rock compressive strength required to maintain wellbore stability and the greater the applied stress. The black circle in the cloud map represents the uniaxial compressive strength limit of the formation rock, which is 52 MPa. The area within the black circle is the rock collapse zone. The larger this area, the more severe the wellbore collapse. The image shows that when the production pressure difference reaches 60 MPa, the wellbore rock begins to collapse slightly. When the production pressure difference reaches 70 MPa, the wellbore collapses significantly. When the production pressure drops to 55 MPa or even lower, the inherent strength of the rock can maintain the stability of the wellbore.

4.2. Impact of Formation Pressure Drop on Wellbore Stability

We used the GMI model to simulate and analyze the wellbore stability under different production pressure differentials during the various stages of formation pressure depletion. Starting from the original formation pressure, we set the gradient of formation pressure coefficient descent to 0.3, analyzed the wellbore stability at each stage of formation pressure depletion, and drew the relationship curve between the required rock compressive strength and production pressure difference for wellbore stability under different formation pressures. The red dashed line in Figure 7 represents the compressive strength of the formation rock. When the curve exceeds the red dashed line, it indicates that the production pressure difference is too large and the wellbore has entered a collapsed state. The green area below the red dashed line will keep the wellbore stable. The abscissa at the intersection of the curve and the red dashed line represents the critical pressure difference at which the wellbore rock fails. When the curve no longer rises with the increase in production pressure difference, it indicates that the wellbore has undergone serious collapse or that such a large production pressure difference cannot be achieved during the production process under the formation pressure. Under the same production pressure difference, the lower the pressure coefficient of the depleted formation, the greater the compressive strength of the reservoir rock required to maintain wellbore stability. Under the compressive strength of the target reservoir rock, the higher the formation pressure, the greater the value of the production pressure difference that ensures the wellbore is not damaged.
Taking ap1 = 2.333 as an example, as the production pressure difference increases from 30 MPa to 60 MPa, the required rock compressive strength to maintain wellbore stability increases from 0 to 60 MPa. When the production pressure difference exceeds 57 MPa, the wellbore begins to become unstable, and a pressure difference less than 57 MPa can ensure wellbore stability. As the reservoir pressure decreases, the smaller the formation pressure coefficient, the lower the formation pressure. The overlying rock pressure was originally jointly borne by the rock skeleton and rock fluid. As the reservoir pressure decays, when the overlying rock pressure remains constant, the pressure applied to the skeleton increases as the pore pressure decreases. Rocks buried at a specific depth have a certain compressive capacity, and when the effective stress exceeds the compressive capacity of the rock, the rock will be more prone to failure. Under the compressive strength conditions of the target reservoir, the smaller the corresponding critical collapse pressure difference, the easier it is for the wellbore to collapse. When the local formation pressure drops below about 1.1, no matter how much the production pressure difference is reduced, the bare hole wellbore will collapse (Table 3). When the original formation pressure is greatly depleted, an excessive production pressure difference can lead to the large-scale collapse of the wellbore and damage to the wellbore diameter expansion.

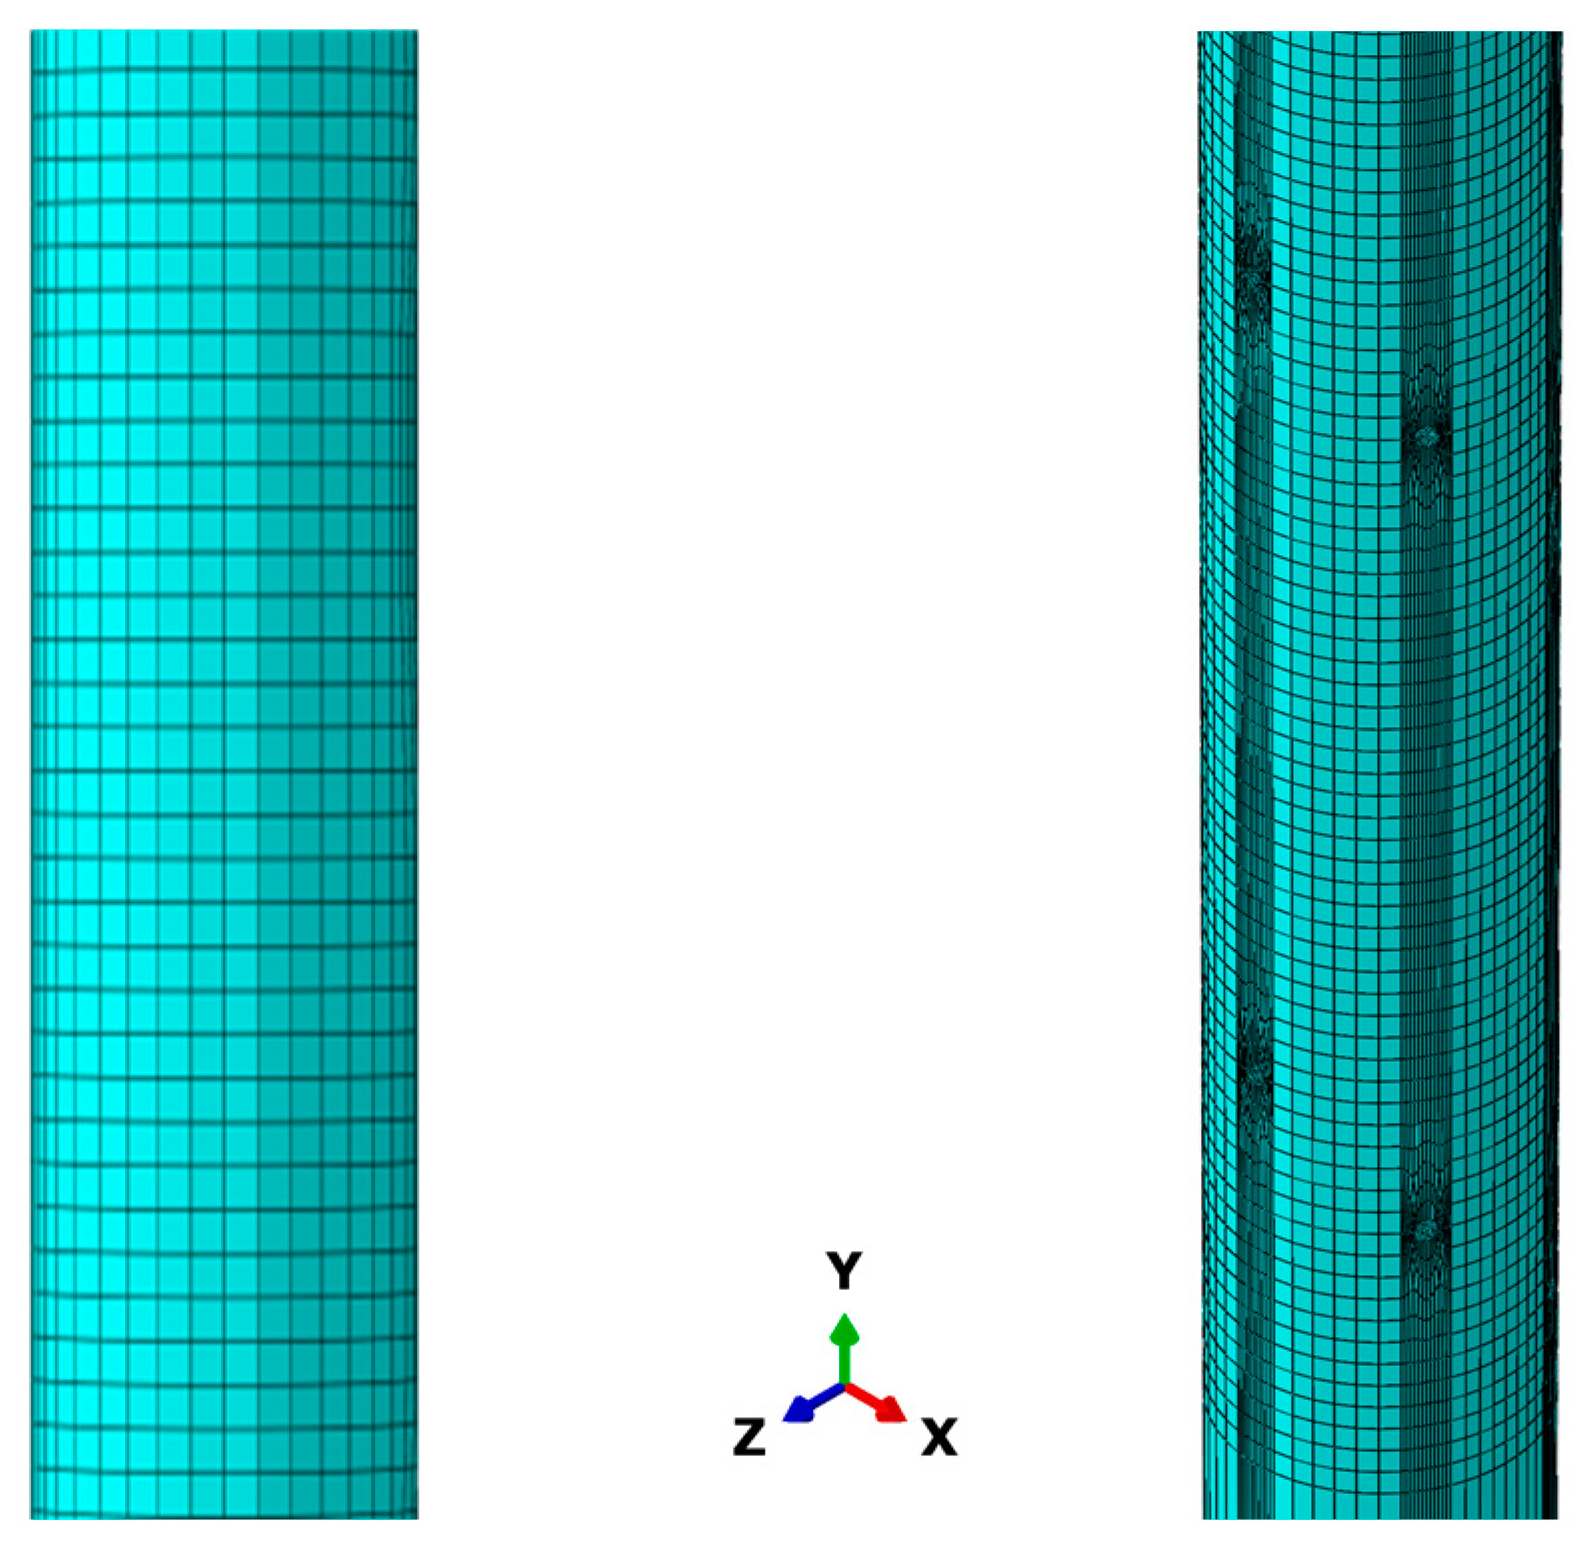
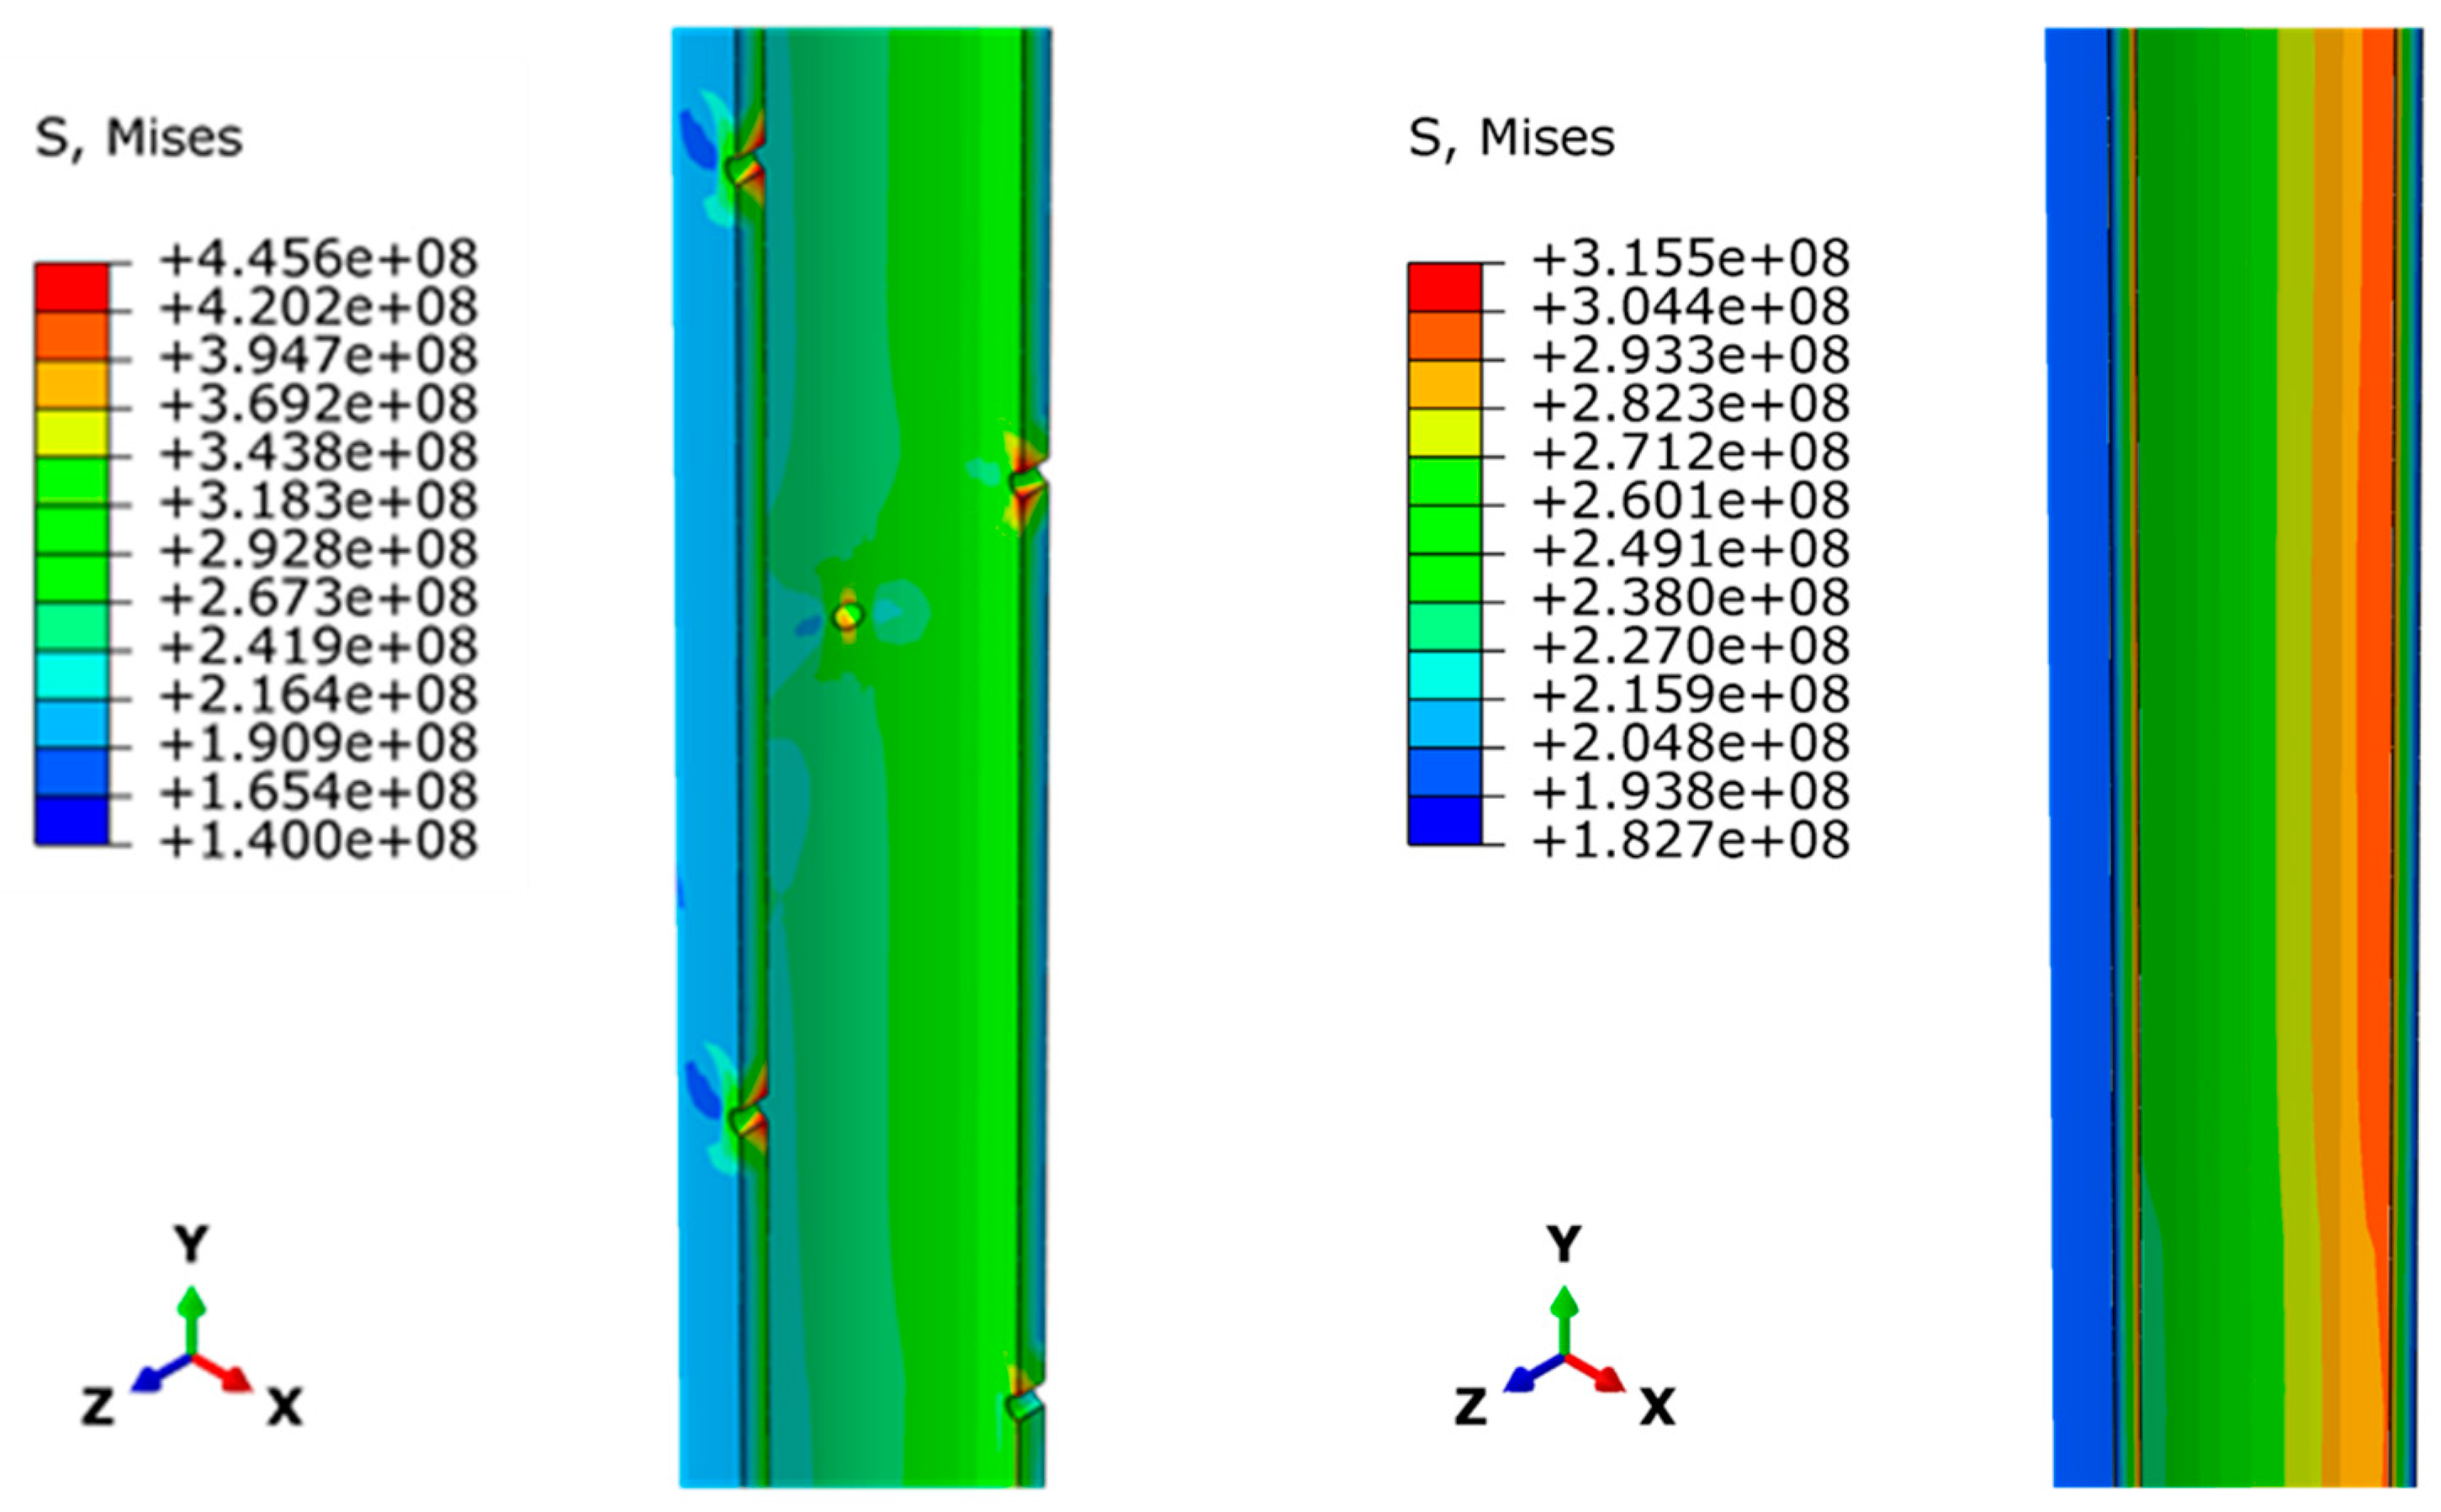
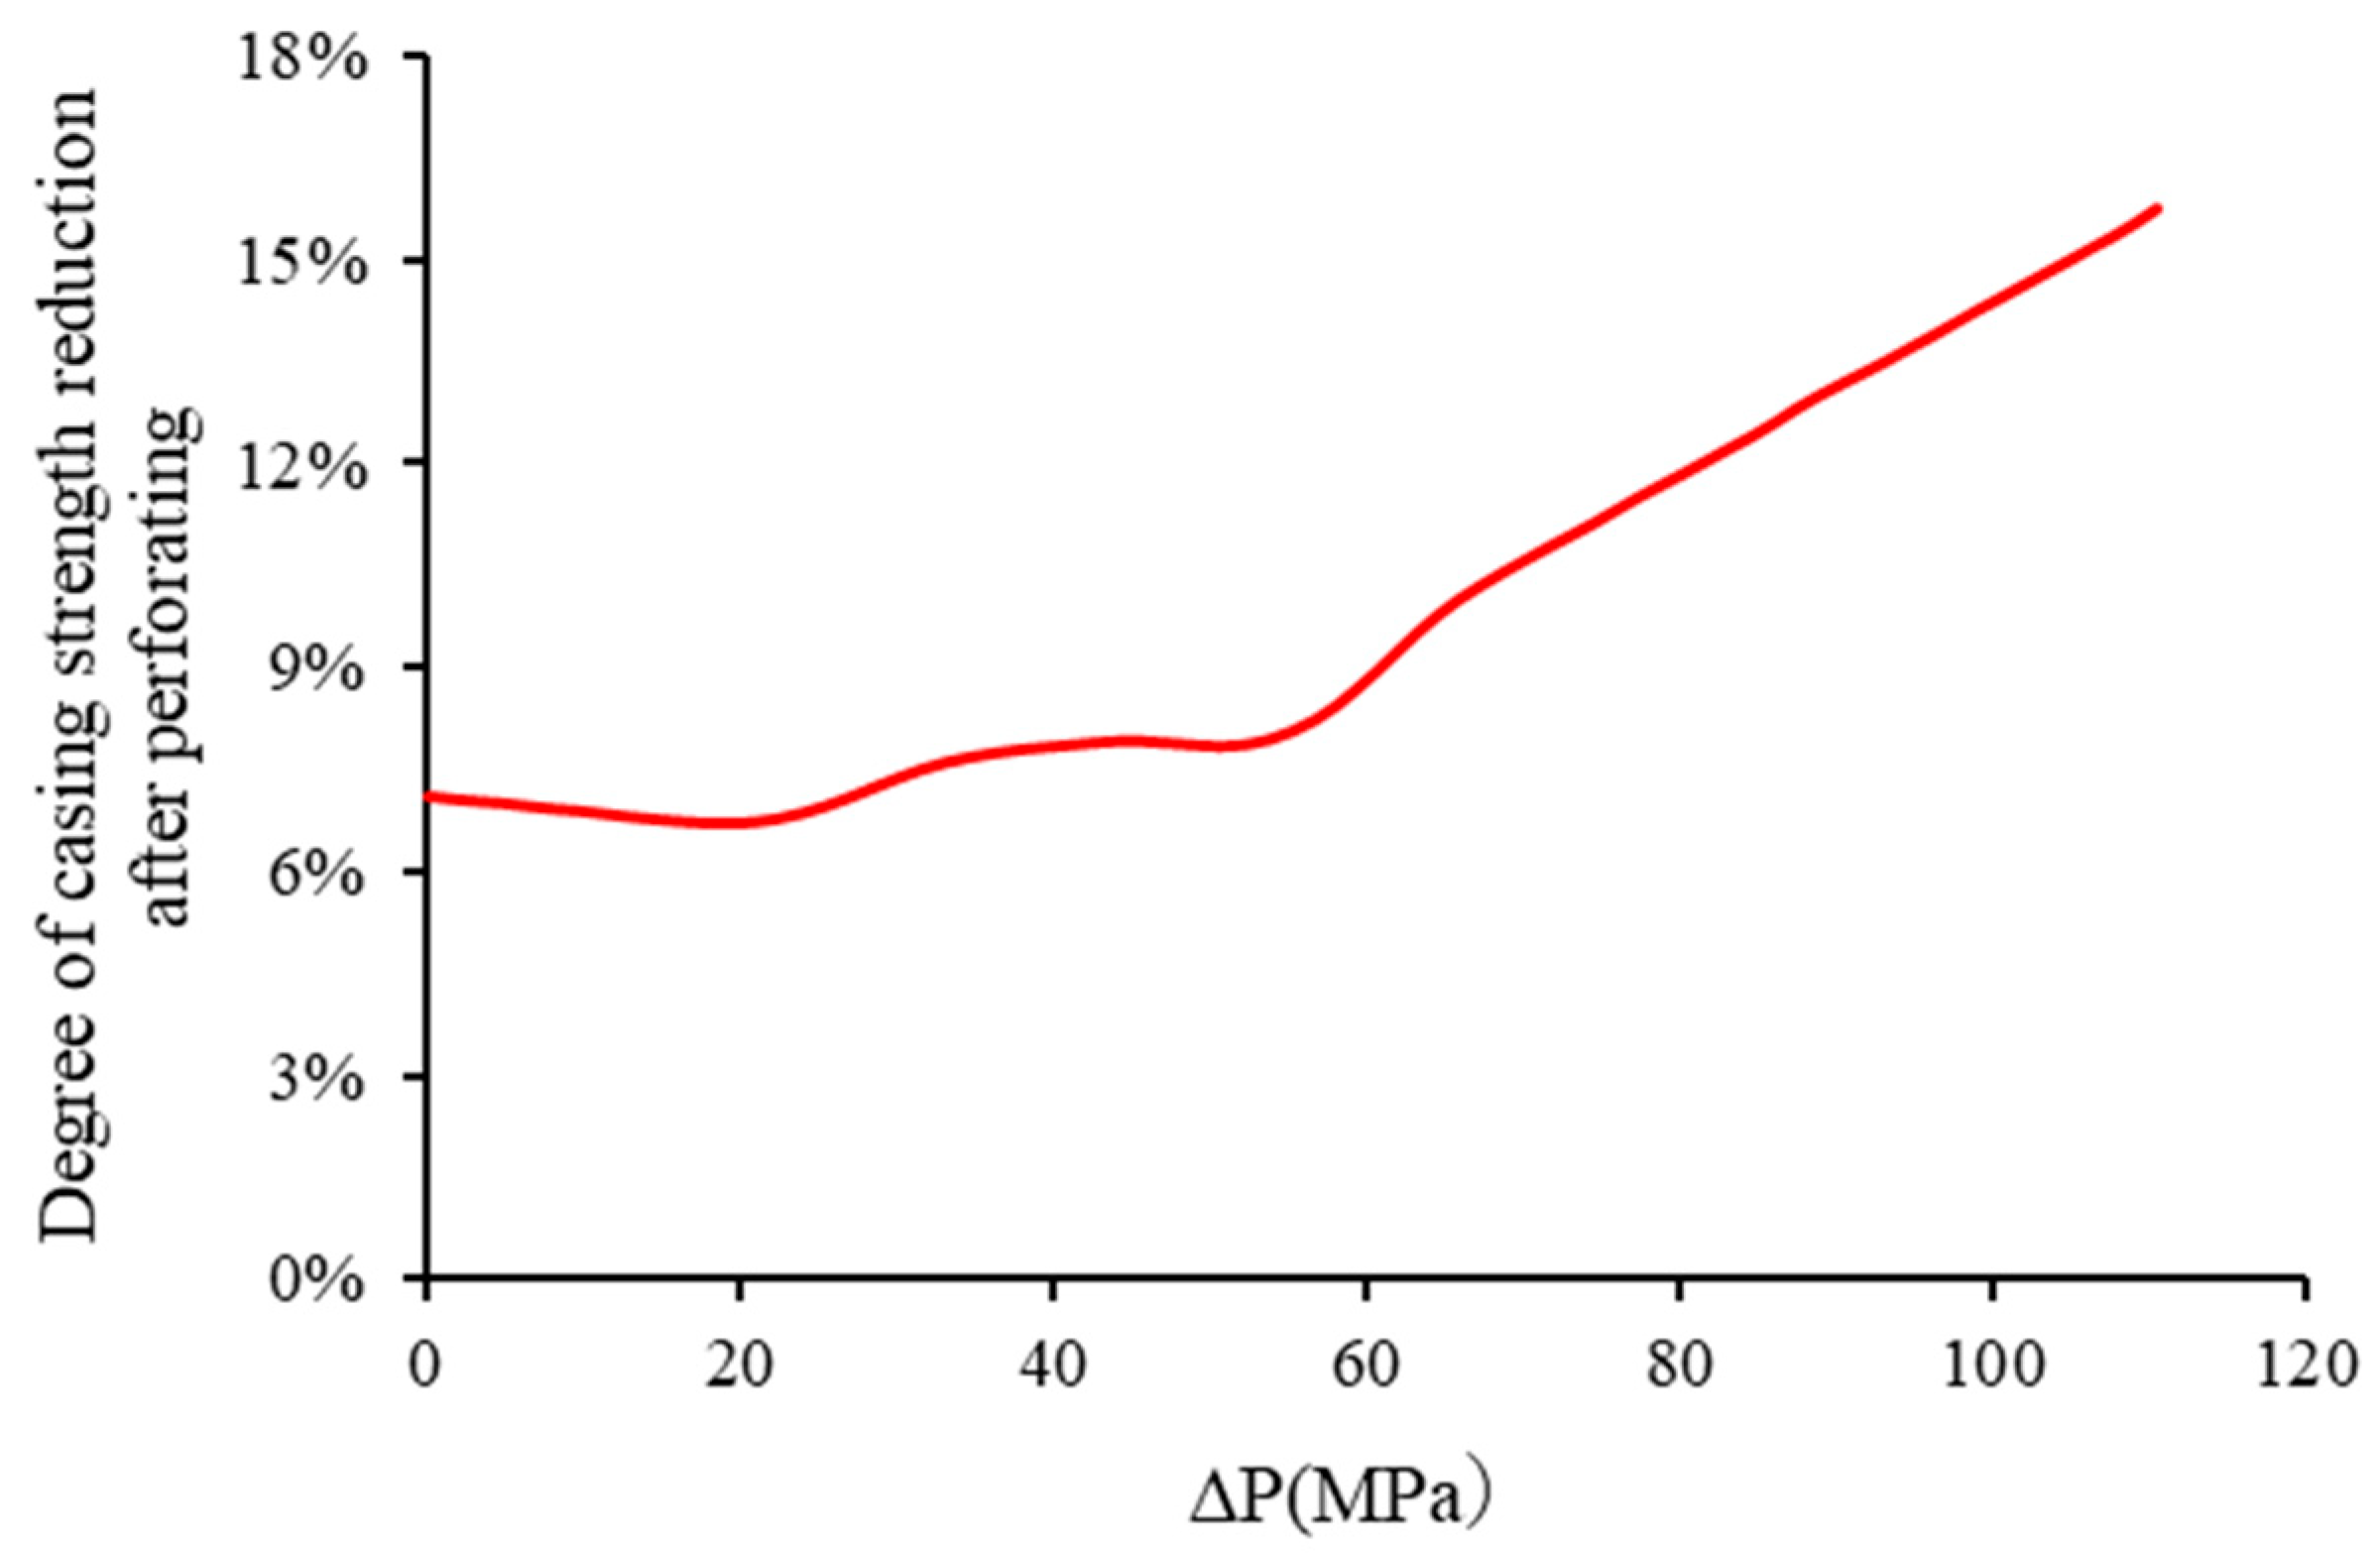
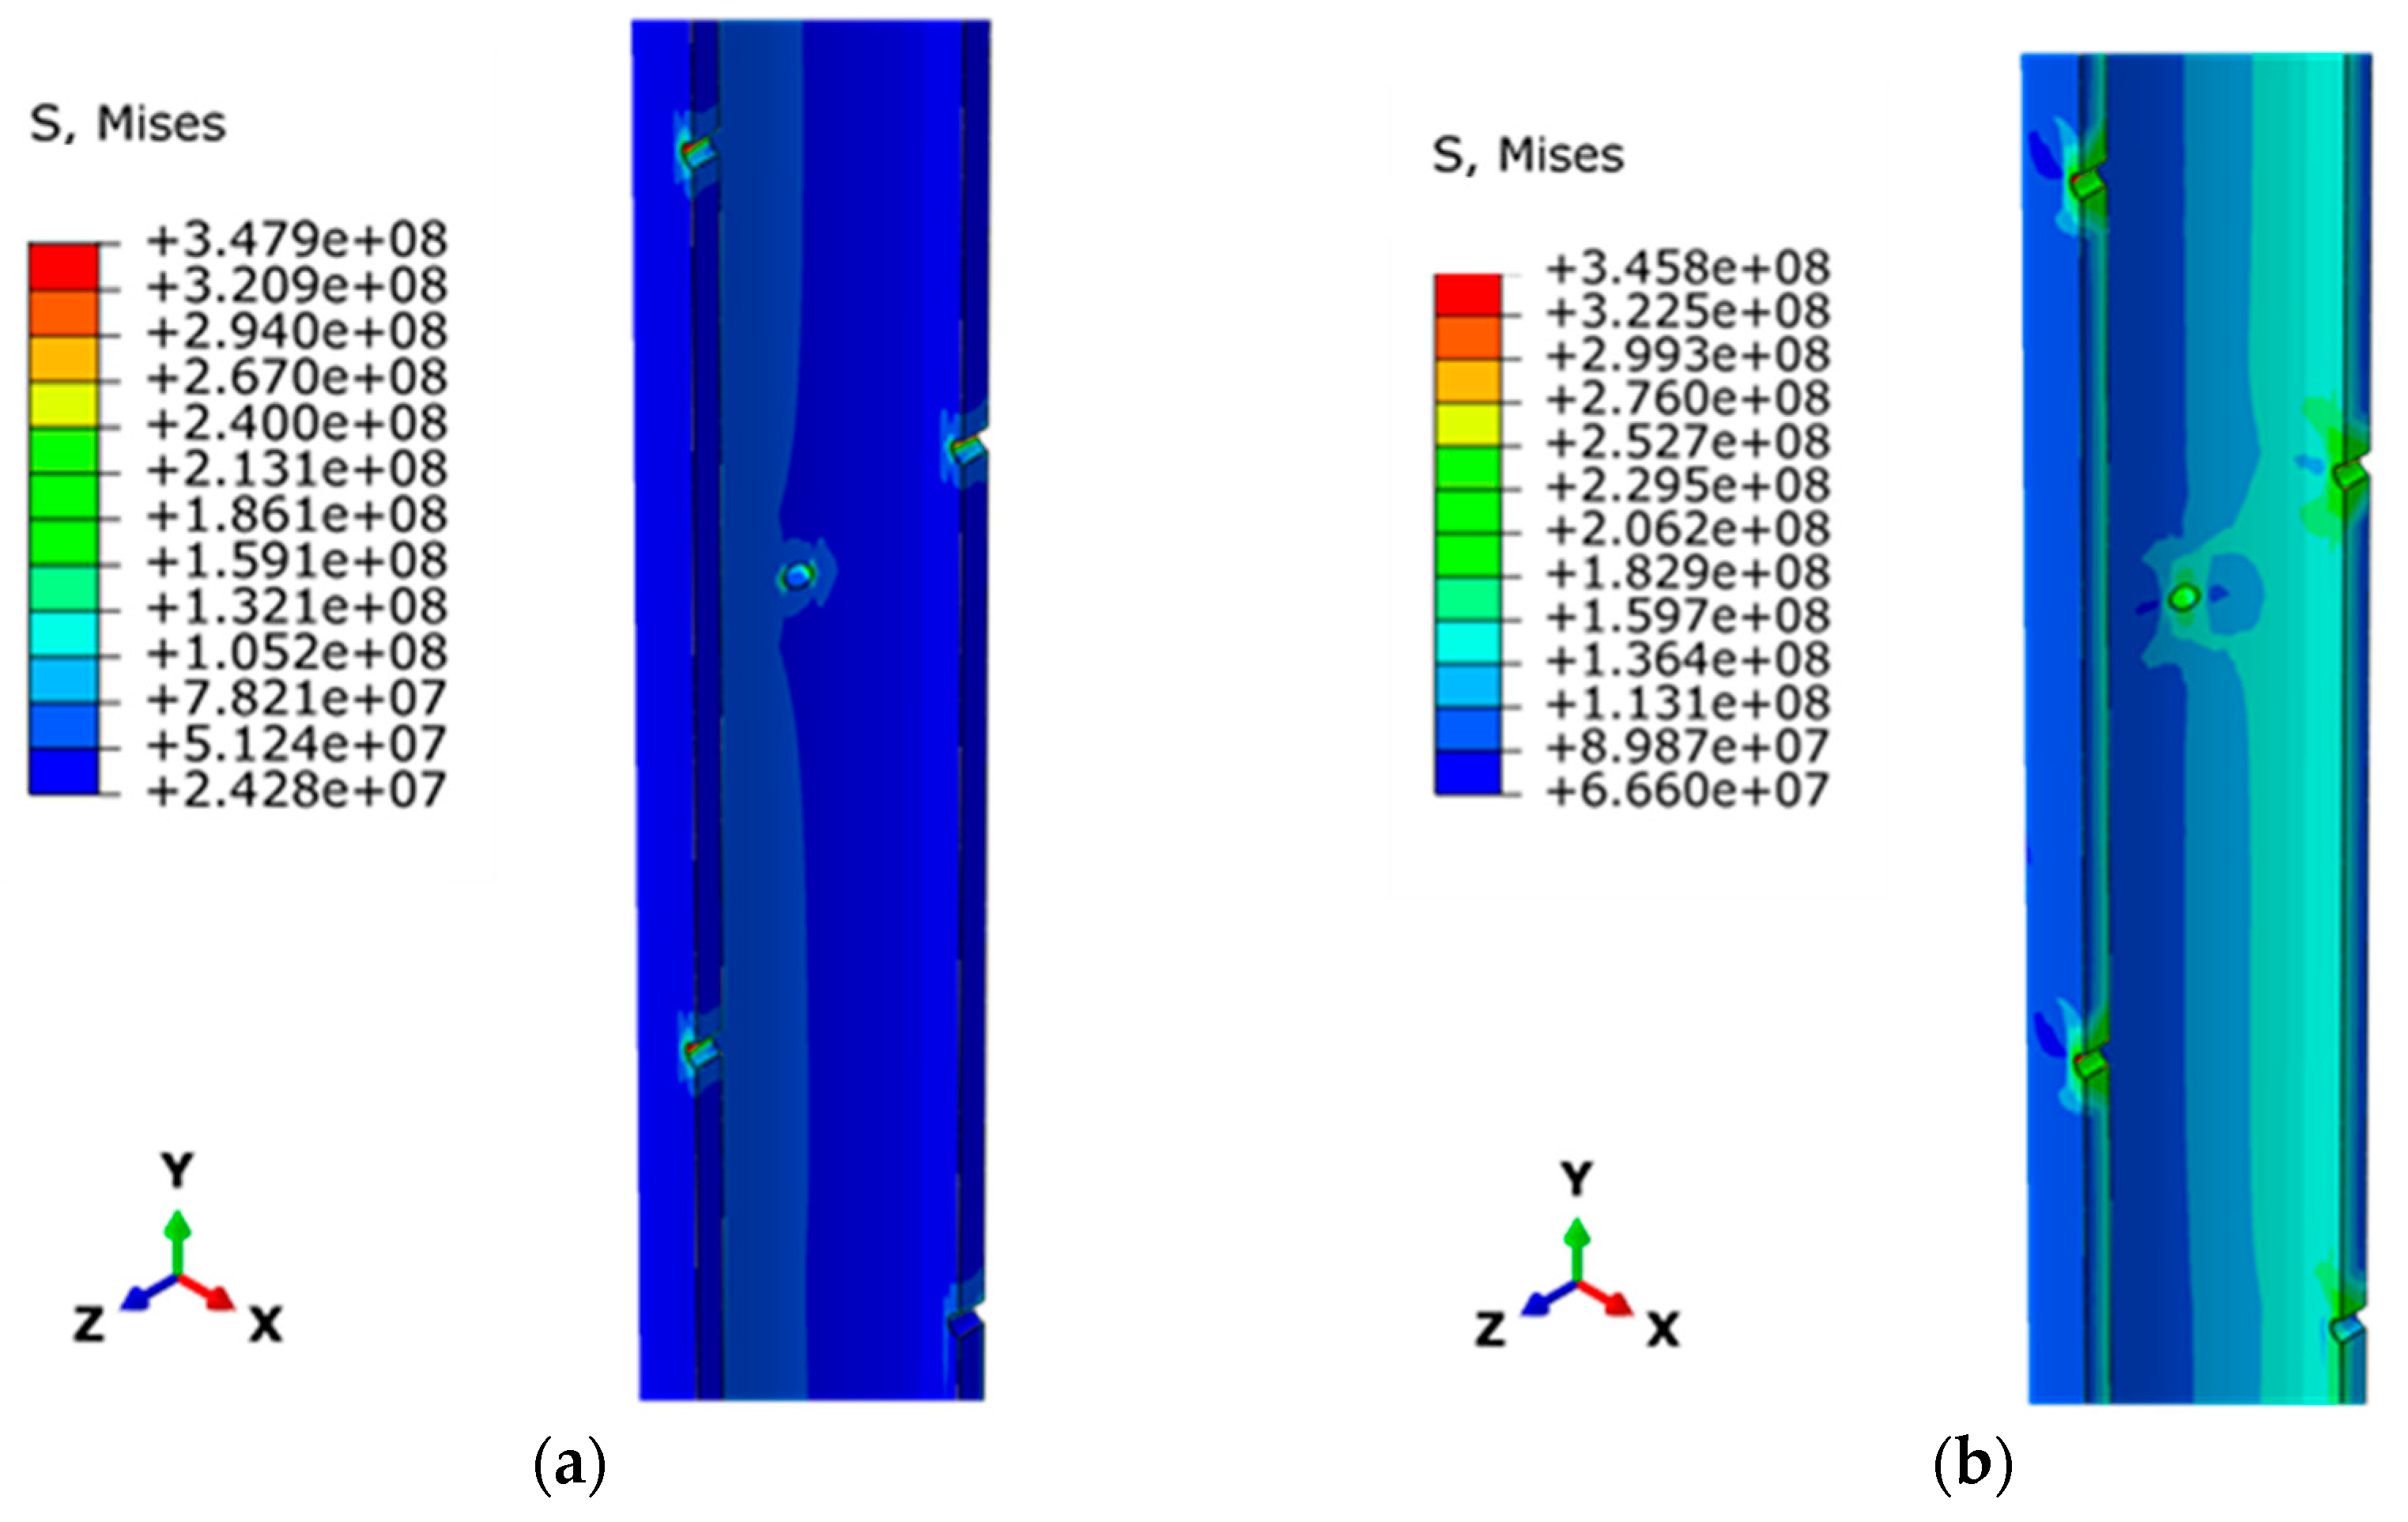
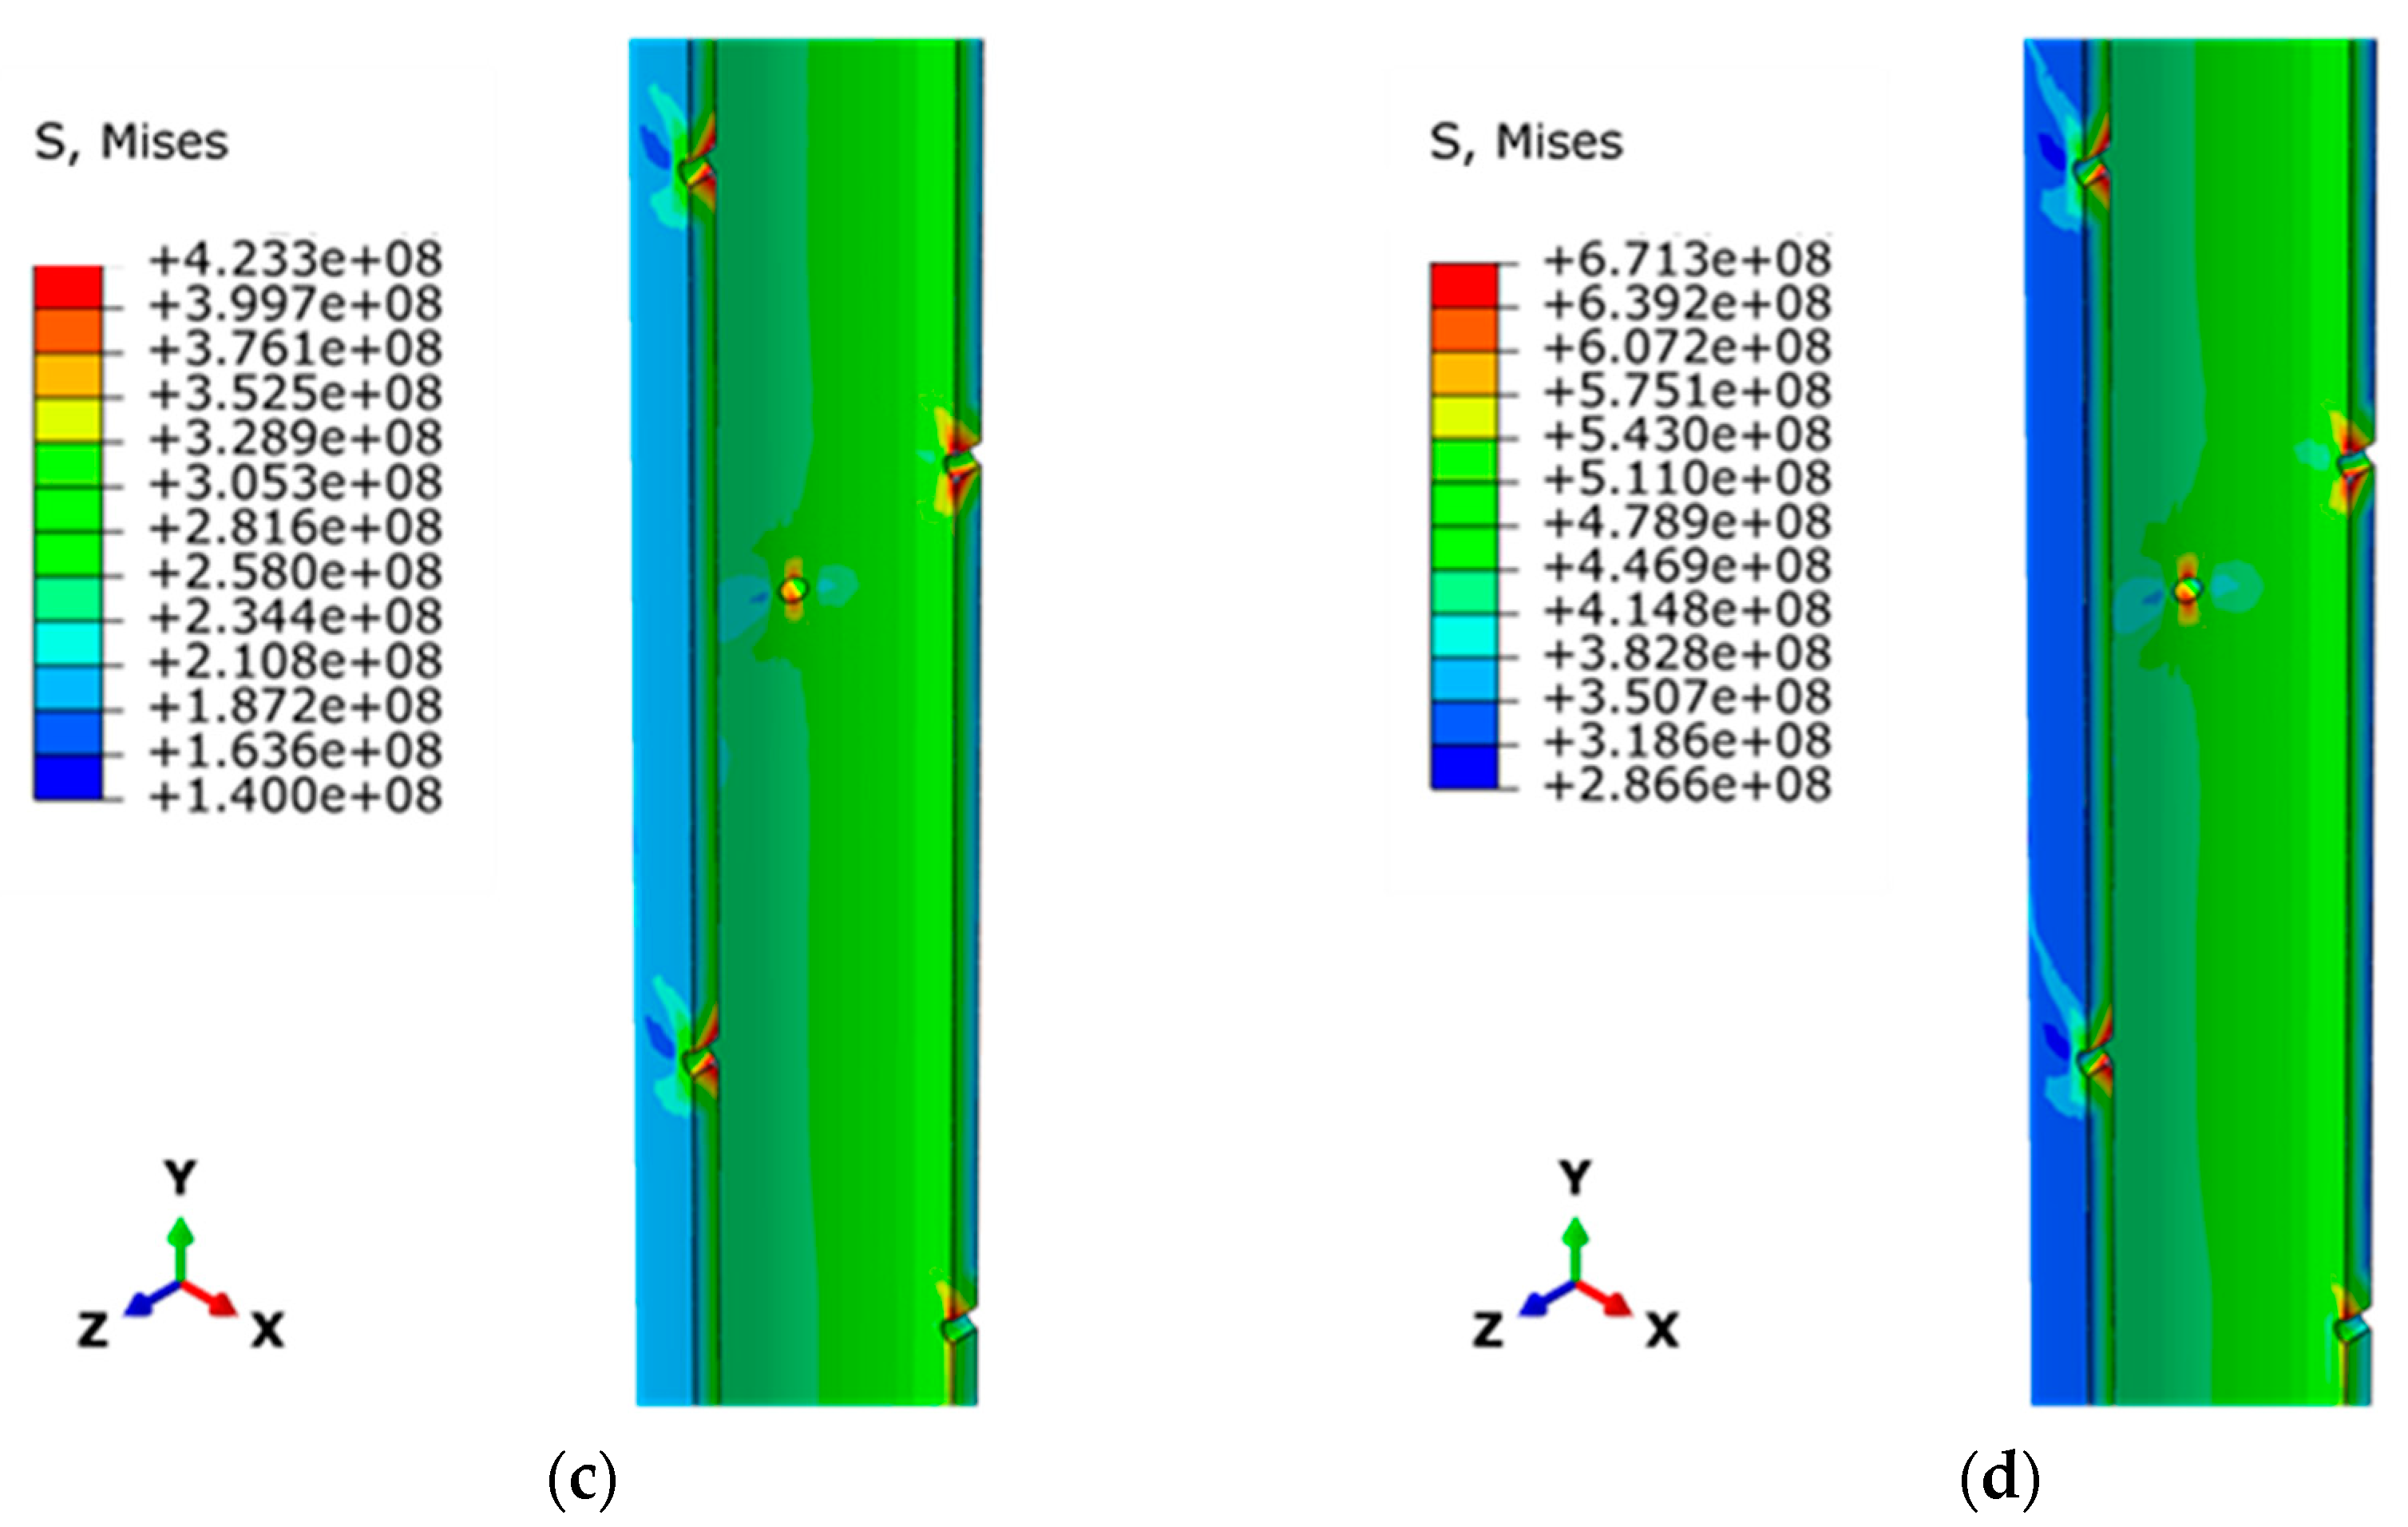
4.3. Effect of Perforation on Casing Strength

Based on reservoir data, the stability of the wellbore after casing perforation completion in the target interval of the G102 vertical well is simulated. The average physical parameters of the formation are shown in Table 4. The basic composition of the model is shown in Figure 8. The size of the finite element model is 4 m × 4 m × 4 m. The target well is a vertical well with an average inclination of less than 9° in the target section.
Treating it as a vertical well will not have a significant impact on the simulation results and is conducive to fine mesh division, improving simulation accuracy. Grid cells are the foundation of finite element model calculations, and the accuracy of partitioning has a significant impact on the results. Grid elements are the foundation of finite element model calculations, and the finer the grid and the more uniform the aspect ratio, the more reliable the calculation results. The casing perforation completion model of the target well adopts hexahedral-structure partitioning technology to encrypt the casing and surrounding formation grids, ensuring the accuracy of the calculation. In this model, we adopt the eight- hexahedral grids in this model, among which the casing and cement sheath use C3D8R three-dimensional stress elements, and the formation uses C3D8P pore fluid elements. Using the same materials and geological stress conditions, we simulated the stress distribution of a perforated and unperforated casing separately in order to obtain the influence of perforation on casing strength parameters. The two types of grid division of casing before and after perforation are shown in Figure 9.
The casing steel grade used for the completion of the target is TP140V, and its stress–strain data are shown in Table 5. The stress–strain curve is an inherent property of materials that does not vary with changes in the structure of the object. The stress concentration near the perforation is the main factor affecting the strength of the casing, mainly considering the degree of decrease in the strength of the casing before and after perforation under the same formation stress conditions. That is, we analyze how much the von Mises equivalent stress of the casing increases after perforation compared to before perforation. If the increase is greater, it indicates a greater degree of decrease, as shown in the following equation:
R = S a S b S m a x
where Sa is the von Mises equivalent stress value of the casing after perforation; Sb is the von Mises equivalent stress value of the casing before perforation; Smax is the maximum strength of the material; and R is the degree of reduction in material strength.
As shown in Figure 10 and Figure 11, the stress distribution of the perforated casing and non-perforated casing under different wellbore pressures was simulated as follows. As the production pressure difference increases, the wellbore pressure decreases. Due to the buffering effect of the cement sheath, the maximum stress of the casing does not increase monotonically but decreases in the initial stage and increases continuously in the later stage, and the descending section of the perforated casing is longer. According to the formula for calculating the degree of strength reduction, the degree of strength reduction of perforated casing varies with the production pressure difference as follows. As shown in Figure 12, the degree of strength reduction caused by perforation increases with the increase in the production pressure difference before the casing yields. After the yielding of the casing, the degree of strength reduction caused by perforation decreases with the increase in the production pressure difference. When the production pressure difference is 60 MPa, perforation reduces the strength of the casing by 9%.

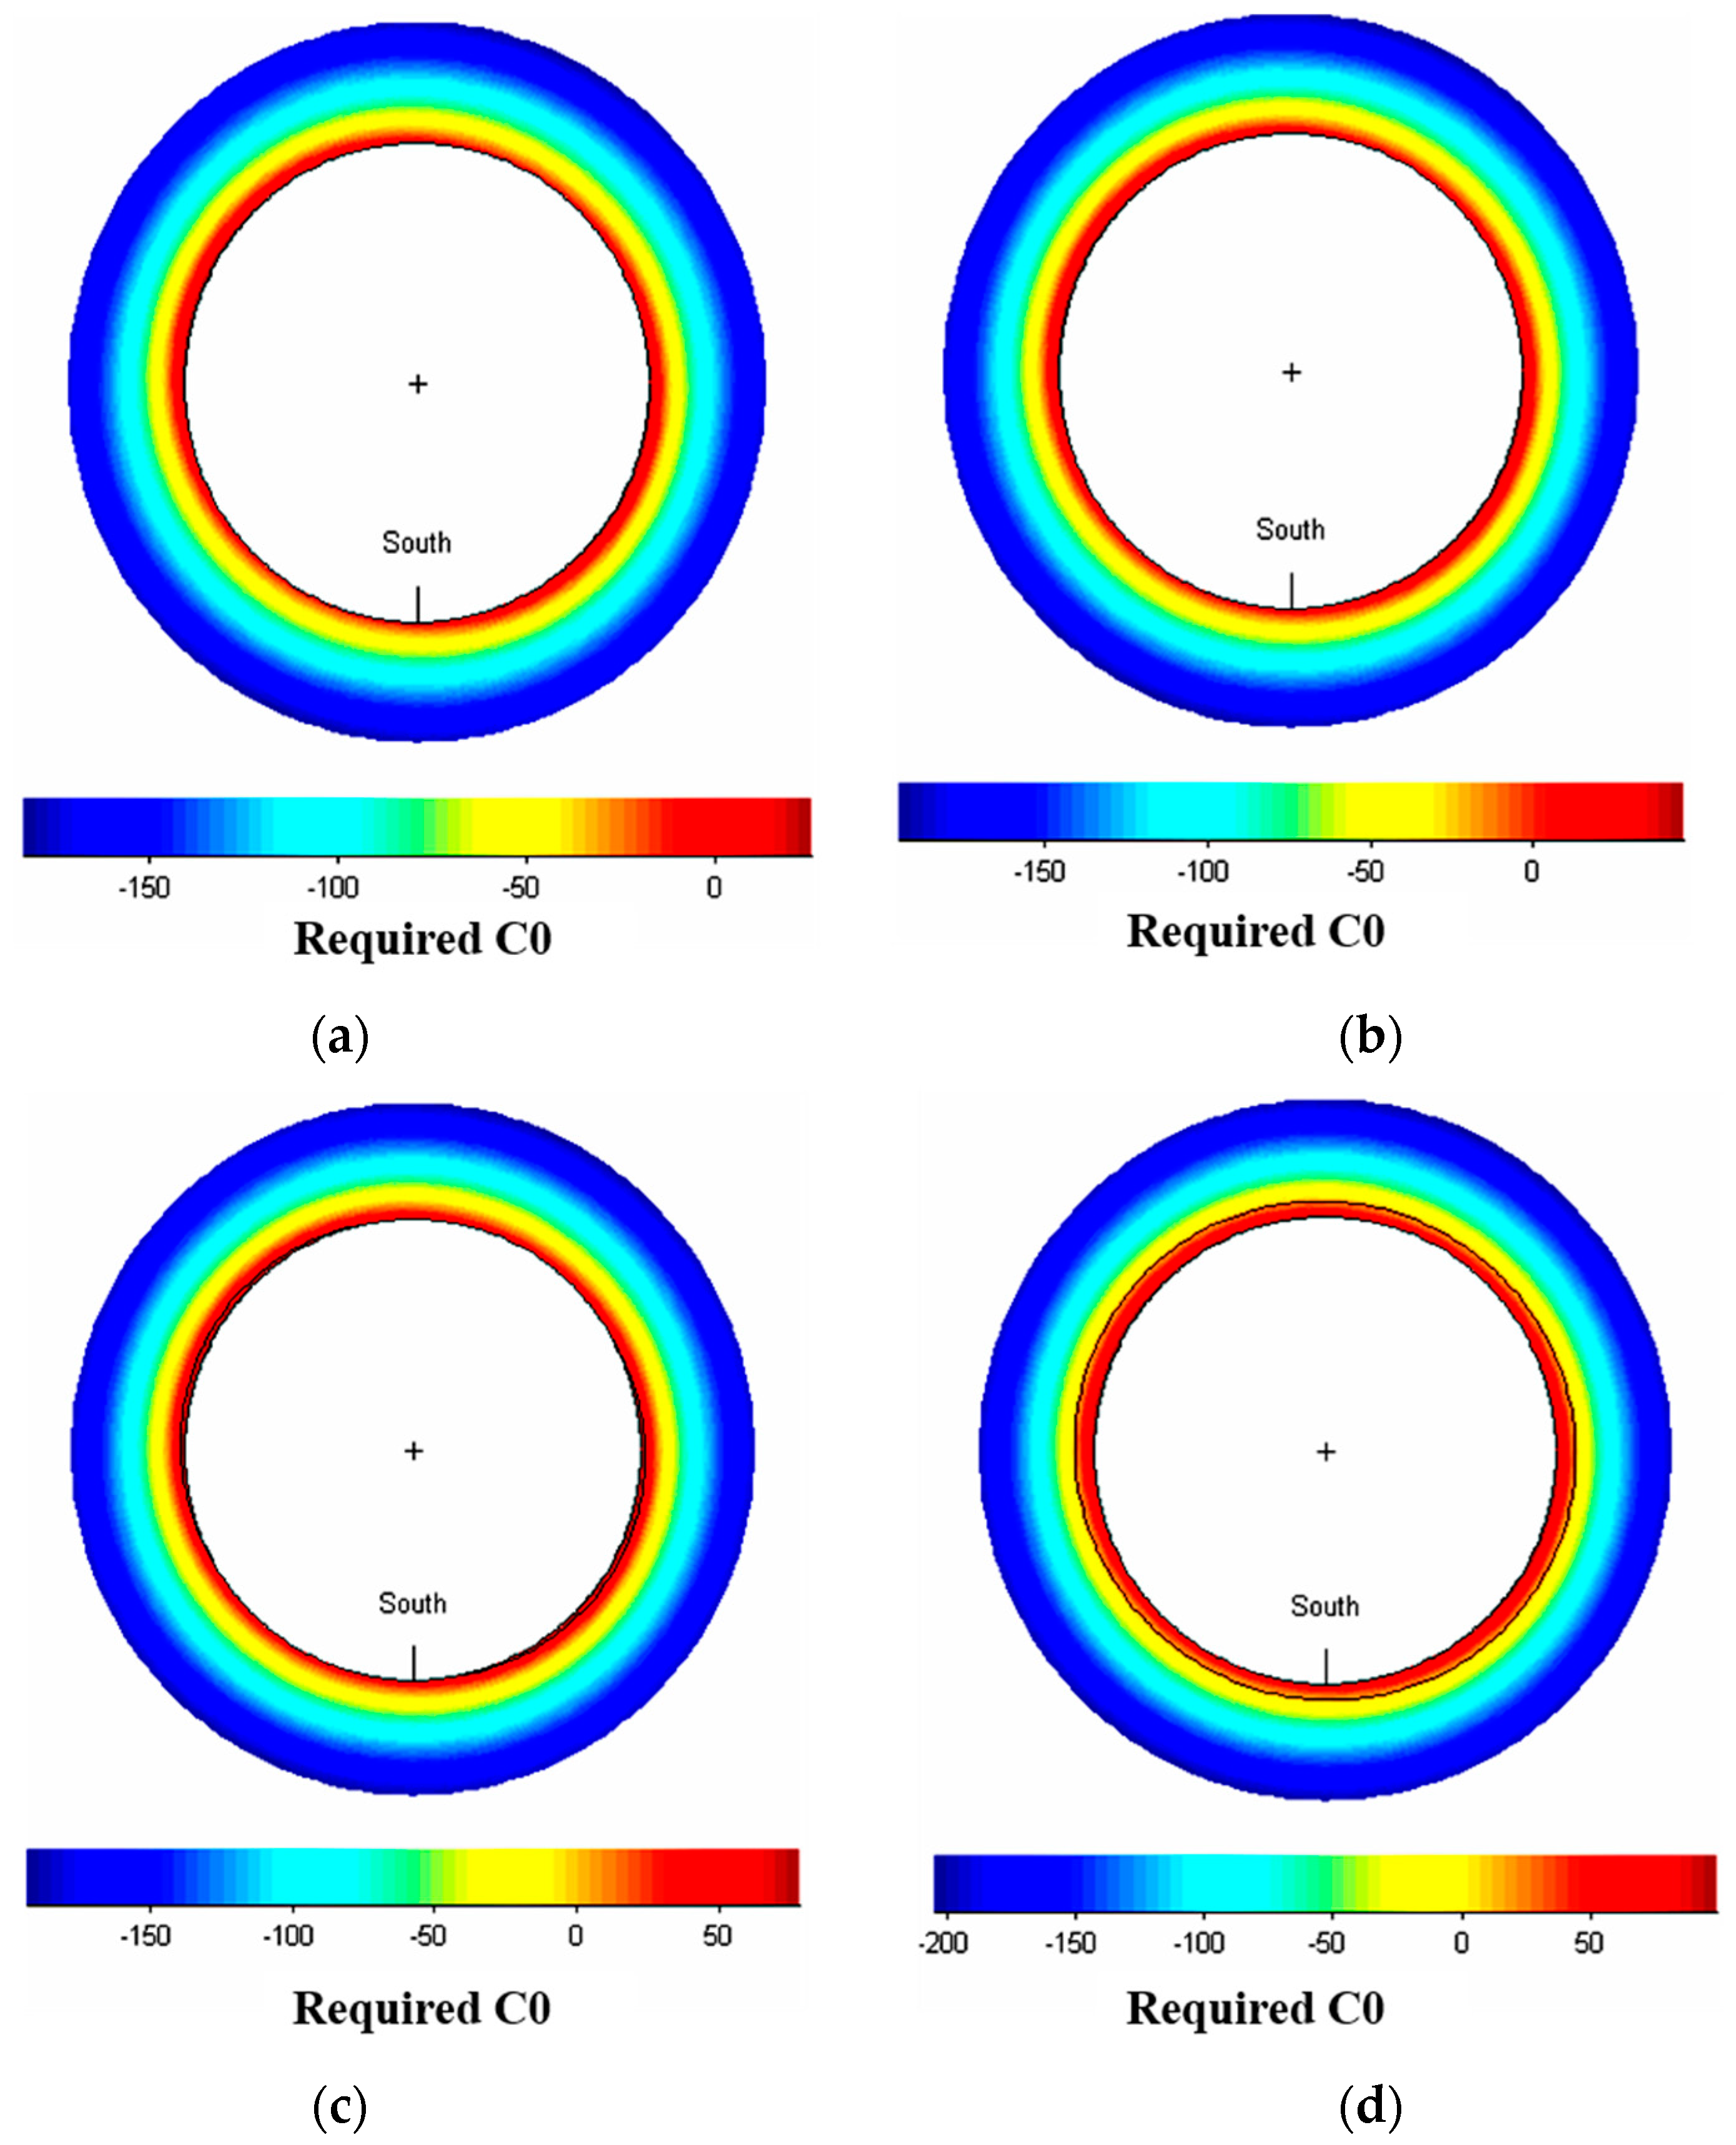
4.4. Evaluation of Perforation Completion Casing Stability

As shown in Figure 13 and Figure 14, the initial formation pressure coefficient of the target interval is 2.33, corresponding to an initial formation pressure of 135.52 MPa. The stress results of the casing under different production pressure differentials are shown in the following figure. As the production pressure differential increases, the stress of the casing does not increase monotonically but slightly decreases and then increases again. This is because the elastic modulus of the cement sheath is small, acting as a buffer between the formation and the casing. It is only under complex stress conditions that the stress of the casing does not change monotonically. Overall, the stress on the casing is relatively uniform, with stress concentration only occurring at the perforation holes. The stress concentration at the perforation holes is shown in the figure a two-pole distribution, with the maximum stress along the wellbore axis and the minimum stress perpendicular to the wellbore axis. Therefore, it can be inferred that if the casing is damaged, it must start from the perforation holes along the wellbore axis.
Observing the stress distribution results in the stress profile, we can also see that the stress concentration in the borehole is initially greater outside the pipe than inside the casing pipe (Figure 14). As the bottomhole pressure decreases, the stress concentration inside the pipe gradually exceeds that outside the pipe. Because the initial stress is small, plastic strain eventually appears from inside the pipe. Due to the decrease in formation pressure, the reservoir gradually becomes depleted, and the effective stress of overlying rock pressure on the rock skeleton will increase. In order to study the stability of the casing at different production stages, the von Mises stress of the perforated casing under different formation pressures was simulated as a function of the production pressure difference.
According to the numerical simulation results, as the formation pressure decreases, the stress on the casing continues to increase. When the wellbore is completely emptied, the larger the formation pressure coefficient, the greater the maximum stress on the casing. When the formation pressure coefficient is 0.83 (36% of the original formation pressure coefficient), the maximum stress is 902.5 MPa (Figure 15). At this point, the casing is only beginning to undergo plastic deformation under stress, so the designed casing structure is relatively safe in the production process of the target formation.

5. Conclusions

In this paper, a practical approach to evaluating the wellbore stability of deep oil wells in the southern margin of the Junggar Basin is proposed. The following key conclusions were obtained:
(1)
Based on the target deep core samples, longitudinal and transverse wave acoustic testing and rock mechanics parameter testing were conducted. Based on the logging curve and mechanical correction relationship of the G102 well, the static rock mechanics parameters and stress distribution profile of the target well were accurately predicted.
(2)
During the production process, as the formation pressure decreases, the critical collapse pressure difference in the wellbore rock decreases significantly. The greater the production pressure difference, the greater the possibility of rock damage to the wellbore.
(3)
Due to the small elastic modulus of the cement sheath and its buffering effect between the formation and casing, the stress on the casing slightly decreases and then increases again with the increase in the production pressure difference during perforation completion. The stress concentration on the perforation casing mainly occurs at the perforation hole. When the pressure inside the wellbore decreases, the higher the formation pressure coefficient, the greater the maximum stress on the perforated casing.

Author Contributions

Methodology, P.H. and M.C.; Software, J.Y.; Formal analysis, X.X.; Investigation, C.X.; Data curation, H.G. and K.Q.; Writing—review & editing, T.L. and Y.L.; Project administration, H.L. All authors have read and agreed to the published version of the manuscript.

Funding

This paper was supported by the Science and Technology Research Program of the Chongqing Municipal Education Commission (Grant No. KJQN202301514) and the General project of the Chongqing Natural Science Foundation (Grant No. cstc2021jcyj-msxmX0790).

Data Availability Statement

The original contributions presented in the study are included in the article, further inquiries can be directed to the corresponding author.

Conflicts of Interest

Authors Tao Liu, Chengwen Xue, Ming Chi, Jie Yu, Han Gao, Xiaohui Xu were employed by the Xinjiang Oilfield Company. Author Pingwei Hou was employed by the No.2 Oil Production Plant of PetroChina Changqing Oilfield Company. The remaining authors declare that the research was conducted in the absence of any commercial or financial relationships that could be construed as a potential conflict of interest. The companies had no role in the design of the study; in the collection, analyses, or interpretation of data; in the writing of the manuscript, or in the decision to publish the results.

References

  1. Yang, B.; Xu, C.; Zhang, H.; Guo, Y.; Yang, J.; Li, Y.; Zhao, J. Research progress and countermeasures for wellbore instability mechanism in deep fractured formations. Acta Pet. Sin. 2024, 45, 875–888. [Google Scholar]
  2. Meng, H.; Ge, H.; Fu, D.; Wang, X.; Shen, Y.; Jiang, Z.; Wang, J. Numerical investigation of casing shear deformation due to fracture/fault slip during hydraulic fracturing. Energy Sci. Eng. 2020, 8, 3588–3601. [Google Scholar] [CrossRef]
  3. Ding, Y.; Liu, X.; Liang, L.; Xiong, J.; Li, W.; Wei, X.; Duan, X.; Hou, L. Wellbore stability model in shale formation under the synergistic effect of stress unloading-hydration. Pet. Explor. Dev. 2023, 50, 1478–1486. [Google Scholar] [CrossRef]
  4. Wang, H.; Ge, Y.; Shi, L. Technologies in deep and ultra-deep well drilling: Present status, challenges and future trend in the 13th Five-Year Plan period (2016–2020). Nat. Gas Ind. B 2017, 4, 319–326. [Google Scholar] [CrossRef]
  5. Wang, Y.; Gao, Y.; Yang, Y. Wellbore stability of deep well in western margin thrust belt of Ordos Basin. Sci. Technol. Eng. 2024, 24, 6691–6700. [Google Scholar]
  6. Zhang, M.; Li, D.; Fan, X. Study on collapse pressure and instability area around wellbore in fault zone. Fault-Block Oil Gas Field 2024, 6, 1–11. [Google Scholar]
  7. Du, J.; Zhi, D.; Li, J.; Yang, D.; Tang, Y.; Qi, X.; Xiao, L.; Wei, L. Major breakthrough of Well Gaotan 1 and exploration prospects of lower assemblage in southern margin of Junggar Basin, NW China. Pet. Explor. Dev. 2019, 46, 205–215. [Google Scholar] [CrossRef]
  8. Bu, C.; Xiong, Y.; Zhu, C.; Qing, X.; Xie, Y. Optimization of completion modes in deep formation of west Sichuan basin. Nat. Gas Ind. 2008, 28, 95–97. [Google Scholar]
  9. Jiang, T.; Sun, X. Development of Keshen ultra-deep and ultra-high pressure gas reservoirs in the Kuqa foreland basin, Tarim Basin: Understanding points and technical countermeasures. Nat. Gas Ind. B 2018, 6, 16–24. [Google Scholar] [CrossRef]
  10. Zhang, Y. Yangs Staged fracturing for ultra—Deep and ultra—Low permeability horizontal wells in Shun—9 wellblock. Spec. Oil Gas Reserv. 2013, 20, 134–137. [Google Scholar]
  11. Law, D.; Dundas, A.S.; Reid, D.J. HPHT horizontal sand control completion. In Proceedings of the SPE/CIM International Conference on Horizontal Well Technology, Calgary, AB, Canada, 6–8 November 2000; SPE-65515-MS. SPE: Richardson, TX, USA, 2000. [Google Scholar]
  12. Biot, M.A. Theory of Elasticity and Consolidation for a Porous Anisotropic Solid. J. Appl. Phys. 1955, 26, 182–185. [Google Scholar] [CrossRef]
  13. Hubbert, M.K.; Willis, D.G. Mechanics of Hydraulic Fracting. Trans. Soc. Pet. Eng. AIME 1957, 210, 153–163. [Google Scholar] [CrossRef]
  14. Fairhurst, C. The phenomenon of rock splitting parallel to a free surface under compressive stress. In Proceedings of the First Congress of the International Society of Rock Mechanics, Lisbon, Portugal, 25 September–1 October 1968. [Google Scholar]
  15. Bradley, W.B. Failure of inclined boreholes. J. Energy Resour. Technol. 1979, 101, 232–239. [Google Scholar] [CrossRef]
  16. Lee, H.; Ong, S.H.; Azeemuddin, M.; Goodman, H. A wellbore stability model for formations with anisotropic rock strengths. J. Pet. Sci. Eng. 2012, 96–97, 109–119. [Google Scholar] [CrossRef]
  17. Ma, T.; Chen, P.; Yang, C.; Zhao, J. Wellbore stability analysis and well path optimization based on the breakout width model and Mogi–Coulomb criterion. J. Pet. Sci. Eng. 2015, 135, 678–701. [Google Scholar] [CrossRef]
  18. Far, P.B.; Hassani, A.H.; Al-Ajmi, A.M.; Heydari, H. A novel model for wellbore stability analysis during reservoir depletion. J. Nat. Gas Sci. Eng. 2016, 35, 935–943. [Google Scholar]
  19. Reisabadi, M.Z.; Haghighi, M.; Sayyafzadeh, M.; Khaksar, A. Effect of matrix shrinkage on wellbore stresses in coal seam gas: An example from Bowen Basin, east Australia. J. Nat. Gas Sci. Eng. 2020, 77, 103280. [Google Scholar] [CrossRef]
  20. Mansourizadeh, M.; Jamshidian, M.; Bazargan, P.; Mohammadzadeh, O. Wellbore stability analysis and breakout pressure prediction in vertical and deviated boreholes using failure criteria—A case study. J. Pet. Sci. Eng. 2016, 145, 482–492. [Google Scholar] [CrossRef]
  21. Xu, K.; Liu, Z.; Chen, Q.; Zhang, Q.; Ling, X.; Cai, X.; He, Q.; Yang, M. Application of machine learning in wellbore stability prediction: A review. Geoenergy Sci. Eng. 2023, 232, 212409. [Google Scholar] [CrossRef]
  22. Udegbunam, J.E.; Aadnøy, B.S.; Fjelde, K.K. Uncertainty evaluation of wellbore stability model predictions. J. Pet. Sci. Eng. 2014, 124, 254–263. [Google Scholar] [CrossRef]
  23. Guo, Y.; Blanford, M.; Candella, J.D. Evaluating the risk of casing failure caused by high-density perforation: A 3D finite-element-method study of compaction-induced casing deformation in a deepwater reservoir, Gulf of Mexico. SPE Drill. Complet. 2015, 30, 141–151. [Google Scholar] [CrossRef]
  24. Liu, L.J.L.; Li, G.; Luo, J.; Peng, Y.; Xia, X.; Wang, F. Strength analysis of perforated casing under non-uniform in-situ stress in ultra-deep wells. In Proceedings of the Second International Conference on Applied Statistics, Computational Mathematics, and Software Engineering (ASCMSE 2023), Zhengzhou, China, 12–14 May 2023; SPIE: Richardson, TX, USA, 2023; Volume 12784, pp. 6–13. [Google Scholar]
  25. Yu, R.; Yin, M.; Ran, Y. Analysis of mechanical property of screw drilling and perforated casing in open hole completion. CPM 2008, 36, 30–32, 35. [Google Scholar]
  26. Abdollahipour, A.; Soltanian, H.; Pourmazaheri, Y.; Kazemzadeh, E.; Fatehi-Marji, M. Sensitivity analysis of geomechanical parameters affecting a wellbore stability. J. Cent. South Univ. 2019, 26, 768–778. [Google Scholar] [CrossRef]
  27. Song, D.; Liu, Q.; Qiu, L.; Zhang, J.; Majid, K.; Peng, Y.; Zhao, Y.; Wang, M.; Guo, M.; Hong, T. Experimental study on resistivity evolution law and precursory signals in the damage process of gas-bearing coal. Fuel 2024, 362, 130798. [Google Scholar]
  28. Qiu, L.; Zhu, Y.; Liu, Q.; Guo, M.; Song, D.; Wang, A. Response law and indicator selection of seismic wave velocity for coal seam outburst risk. Adv. Geo-Energy Res. 2023, 9, 198–210. [Google Scholar] [CrossRef]
  29. Lin, J.E. Proceedings of the International Field Exploration and Development Conference 2019; Springer Science and Business Media LLC: Berlin/Heidelberg, Germany, 2020. [Google Scholar]
  30. Rahman, K.; Khaksar, A.; Kayes, T. Minimizing sanding risk by optimizing well and perforation trajectory using an integrated geomechanical and passive sand-controlapproach. In Proceedings of the SPE Annual Technical Conference and Exhibition, Denver, CO, USA, 21–24 September 2008; Society of Petroleum Engineers: Richardson, TX, USA, 2008. [Google Scholar]
Figure 1. Physical image of core sample.
Processes 12 02145 g001
Figure 2. Fitting diagram of transverse and longitudinal wave velocities.
Processes 12 02145 g002
Figure 3. Stress and strain curve diagram of core compression experiment.
Processes 12 02145 g003
Figure 4. Experiment result of Mohr–Coulomb circle.
Processes 12 02145 g004
Figure 5. Geostress profile of G102.
Processes 12 02145 g005
Figure 6. Cloud map of required rock compressive strength around the well. (a) ΔP1 = 50 MPa, (b) ΔP2 = 55 MPa, (c) ΔP1 = 60 MPa, and (d) ΔP2 = 70 MPa.
Processes 12 02145 g006
Figure 7. Stability of the wellbore wall under different formation pressures.
Processes 12 02145 g007
Figure 8. Basic structure of G102 vertical well model.
Processes 12 02145 g008
Figure 9. Grid division of casing before and after perforation.
Processes 12 02145 g009
Figure 10. Comparison of front and rear casing stress with production differential pressure of 60 MPa.
Processes 12 02145 g010
Figure 11. Variation in von Mises stress before and after perforation with production pressure difference under formation conditions.
Processes 12 02145 g011
Figure 12. Variation in perforating casing strength with production pressure difference.
Processes 12 02145 g012
Figure 13. The stress distribution of the perforated casing when the production pressure difference is 0, 40, 80, and 135.52 MPa, respectively, under the initial formation pressure coefficient. (a) ΔP1 = 0 MPa, (b) ΔP2 = 40 MPa, (c) ΔP3 = 80 MPa, and (d) ΔP4 = 135.52 MPa.
Processes 12 02145 g013aProcesses 12 02145 g013b
Figure 14. von Mises stress variation with production pressure difference in casing under different formation pressure coefficients.
Processes 12 02145 g014
Figure 15. Casing stress (left) and strain (right) when the well is completely hollowed out at a formation pressure coefficient of 0.83.
Processes 12 02145 g015
Table 1. Results of triaxial compression test.
Core NumberPorosityConfining Pressure (MPa)Temperature (°C)Poisson’s RatioElastic Modulus (MPa)Differential Stress (MPa)
GT-102-10.016216.01400.16114,786.6192.7
GT-102-20.03070.14514,283223.4
GT-102-30.048826.00.14615,123192.0
GT-102-40.02970.16717,901.8242.7
GT-102-50.065853.00.15616,869262.2
GT-102-60.0580.13416,293281.9
GT-102-70.0403140.00.10226,546680.3
GT-102-80.05440.10127,116720.8
GT-102-90.10770.025 °C0.181364435.4
GT-102-100.02630.1728201.888.1
GT-102-110.04890.16587374.0
GT-102-120.0820.1727834.845.4
Table 2. Results for cohesion and internal friction angle.
Sample NumberGroup NumberConfining Pressure (MPa)Differential Stress (MPa)Cohesion (MPa)Internal Friction Angle (°)
GT-102-1(1)16192.716.648
GT-102-10088.1
GT-102-2(2)16223.414.653.4
GT-102-10088.1
GT-102-3(3)2619215.544.6
GT-102-11074
GT-102-4(4)26242.713.948.8
GT-102-11074
average value15.248.7
Table 3. Relationship between critical collapse sand pressure difference and formation pressure coefficient.
Formation Pressure CoefficientFormation Pressure (MPa)Critical Collapse Pressure Difference (MPa)
2.33135.555
2116.341
1.798.826
1.481.415
1.164.82
0.846.5-15
Table 4. Basic parameters of target interval in G102 well.
Casing parametersWellbore diameter215.9mm
Inner diameter of casing111.16mm
Outer diameter of casing139.7mm
Wall thickness of casing14.27mm
Elastic modulus of casing210GPa
Shear modulus of casing82GPa
Elastic modulus of cement sheath10GPa
Poisson’s ratio of cement sheath0.25
Cement ring cohesion12MPa
Friction angle inside cement ring24°
Cement stone shear dilation angle12°
Tensile strength of cement sheath8MPa
Perforation parametersPerforation depth0.6m
Perforation phase60°
Perforation aperture10mm
Perforation density16hole/m
Table 5. Stress and strain data of TP140V-steel-grade material.
Plastic strain00.008240.022030.026060.031950.042740.057461
Stress (MPa)9501107.51139.31147.41160.61172.91180.51300
Disclaimer/Publisher’s Note: The statements, opinions and data contained in all publications are solely those of the individual author(s) and contributor(s) and not of MDPI and/or the editor(s). MDPI and/or the editor(s) disclaim responsibility for any injury to people or property resulting from any ideas, methods, instructions or products referred to in the content.

