Article

CFD Analysis of the Effects of a Barrier in a Hydrogen Refueling Station Mock-Up Facility during a Vapor Cloud Explosion Using the radXiFoam v2.0 Code

1
Korea Atomic Energy Research Institute, Daejeon 34057, Republic of Korea
2
Korea Gas Safety Corporation, Chuncheon-si 26203, Republic of Korea
*
Author to whom correspondence should be addressed.
Processes 2024, 12(10), 2173; https://doi.org/10.3390/pr12102173 (registering DOI)
Submission received: 3 September 2024 / Revised: 25 September 2024 / Accepted: 27 September 2024 / Published: 6 October 2024

Abstract

:
A CFD (computational fluid dynamics) analysis to investigate the effects of the installation of a barrier in a hydrogen refueling station (HRS) mock-up facility, with a dummy vehicle and dispensers in the vapor cloud region, during a hydrogen-air explosion using a gas mixture volume of 70.16 m3 was conducted to determine whether the radXiFoam v2.0 code with the established analysis methodology to predict the peak overpressure can be utilized to evaluate the safety of a HRS with such a barrier installed in a large city in the Republic of Korea. The radXiFoam v2.0 code was developed on the basis of the XiFoam solver in the open-source CFD software OpenFOAM-v2112 by modifying C++ source codes in several libraries and governing equations so as to ensure effective calculations of the hydrogen-air chemical reaction and radiative heat transfer through water vapor in a humid air environment and to remove unnecessary warning messages that arise when using the radXiFoam v1.0 code. First, we conducted a validation analysis on the basis of measured overpressure datasets from a near field to a far field of a vapor cloud explosion (VCE) site in the HRS mock-up facility to evaluate the uncertainty in prediction datasets by radXiFoam v2.0. After this validation analysis, we undertook CFD sensitivity calculations by installing barriers with heights of 2.1 m and 4.2 m at a horizontal distance of 2.3 m from the VCE region in the grid model used for the validation analysis to assess the effects of these barriers on reducing the peak overpressure of the blast wave. From these calculations, we judged that the radXiFoam v2.0 code can accurately simulate the effects of the barrier during a VCE, as the calculated overpressure reduction values according to the barrier height are reasonable on the basis of previous validation results from Stanford Research Institute’s explosion test with such a barrier. The results herein imply that the radXiFoam v2.0 code is feasible for use in HRS safety when barrier installation must meet the technical regulations of the Korea Gas Safety Corporation in a large city.

1. Introduction

Extensive research to increase the safety of hydrogen refueling stations (HRSs) has been conducted through experimental and numerical studies to reduce the anxiety of residents who live around HRS sites to be built in complex cities in the Republic of Korea [1]. This anxiety may have resulted from an accidental explosion of a compressed hydrogen storage tank at a water electrolysis facility in Gangwon Technopark in the Republic of Korea [2]. Tank fragments due to the rapid pressure increase in the storage tank, which occurred when safety standards were ignored, were blown far from the water electrolysis facility [3]. Thus, to decrease residents’ anxiety about the possibility of such an accident and its damage propagation far from the explosion site during the operation of a HRS, the Korea Gas Safety Corporation (henceforth KGS) decided to strengthen technical regulations for HRSs [1], which specifically describe the installation of a damage-mitigation wall, also referred to as a barrier, including its geometrical configuration and material specifications, to prevent the propagation of fragments and blast waves from an explosion of a hydrogen storage tank or a vapor cloud. Currently, the KGS technical regulations simply state that a damage-mitigation wall should be installed when the separation distance between the storage tank or processing facility at the HRS and the surrounding protected facilities does not meet the recommended separation distance according to the compressed gas volume or liquefied gas mass [4,5].
In order to create datasets with which to compile a reference database for strengthening the technical regulations, KGS has been producing quantitative data through experimentation, numerical analyses, and dataset extension efforts by machine learning to verify the effectiveness of barriers during hydrogen explosion accidents initiated by the failure of the opening of a pressure relief valve installed in a compressed storage tank or the ignition of accidently released hydrogen from a processing facility at a HRS [1,6]. To determine physical parameters such as the explosion pressure of the compressed storage tank and the released volume of the hydrogen-air mixture in the air so as to configure the hydrogen explosion accident conditions in the experiments and numerical analyses, various explosion accident scenarios were carefully developed on the basis of the results of quantitative risk assessments (QRA) of gaseous and liquefied HRSs [7].
In addition, a three-dimensional computational fluid dynamics (CFD) code running the open-source software OpenFOAM [8,9], which can accurately evaluate an overpressure decrease due to a barrier under hydrogen explosion accidents at HRSs, will be freely released to engineers working on safety issues at HRSs after conducting validation analyses using the datasets produced through experimentation at the end of this research project by KGS [1]. Thus, we, the Korea Atomic Energy Research Institute (KAERI), are currently developing a solver for use with an explosion accident analysis of released hydrogen in a humid air environment [6,10], and Pukyong National University (PNU) is working on a solver for the incident of an explosion accident that occurs at a high-pressure hydrogen storage tank in a HRS [11].
The predicted overpressure reduction by the barrier in the hydrogen explosion accident scenarios for HRSs to be built in the downtown area of a large city using the verified CFD code can decrease the anxiety of residents around HRSs because the damage criterion owing to a gas explosion accident is usually represented as the magnitude of the pressure wave, the peak overpressure, arriving at structures or people according to certain technical guidelines [12]. For instance, when a pressure wave with a magnitude of approximately 7 kPa arrives at houses, harmful effects such as partially damaged structures or even much harm to people may occur [12,13]. Moreover, three-dimensionally visualized pressure contours from the explosion site to the surrounding protected facilities can increase residents’ understanding of the safety role of the installed barrier at the HRS when compared to simple risk data produced from a QRA considering the installation of a barrier. The use of CFD codes with the open-source software OpenFOAM to evaluate the safety of energy facilities under a VCE accident has been conducted actively in the areas of process safety and loss prevention [14].
Therefore, we developed the radXiFoam v1.0 code [15] on the basis of the XiFoam solver in OpenFOAM-v2112 to simulate a hydrogen vapor cloud explosion (VCE) accident in a humid air environment at a HRS after modifying the C++ source codes. We also conducted a validation analysis of a barrier effect test under a VCE conducted by the Stanford Research Institute (SRI) [16,17]. For the first validation case, we analyzed the SRI’s VCE test with the barrier using a 5.2 m3 hydrogen-air mixture in a stoichiometric condition in an open space [10], subsequently proposing an analysis methodology that predicts the peak overpressure variation from the near field to the far field of the explosion site through the barrier with an error range of approximately ±30%. In addition, to confirm that radXiFoam generates consistent results, we performed sensitivity calculations while varying the hydrogen-air mixture volume size, the height of the barrier, the length from the explosion site to the barrier, and the shape of the barrier [6,10,18].
However, we have not yet validated the radXiFoam code against a VCE test with an obstacle geometry configuration representing the components and structures at a HRS, such as dispensers, vehicles, and walls. If a pressure buildup owing to flame acceleration, occurring when a flame passes the obstacle geometry configuration is achieved, a pressure wave with a higher magnitude can propagate to protected facilities at far field distances from the HRS. Thus, we decided to conduct a validation analysis using an experimental result from Shell Hydrogen B.V. using a HRS mock-up facility with a dummy vehicle and dispensers at Buxton in the UK [19,20]. The use of this published test data can reduce the effort required by KGS to conduct various VCE tests with barrier models in the Republic of Korea because hydrogen explosion tests generally require considerable amounts of time and incur high costs.
Through this validation analysis, if we know the prediction error range of the radXiFoam code for simulating the pressure buildup due to the flame acceleration in structures during a VCE, we can better evaluate the safety of the HRS to be built around protected facilities in a large city using radXiFoam. However, the data of the overpressure decrease through the confining wall existing at the hydrogen-air explosion site were not measured in the HRS mock-up facility test [19,20]. Thus, to obtain a dataset showing the overpressure reduction by such a barrier, we additionally performed a simulation after installing an artificial barrier model at a certain distance from the explosion site in the grid model used for the validation analysis of the pressure buildup in consideration of the obstacle geometry configuration in the HRS mock-up facility. This simulation can increase the reliability of the radXiFoam v2.0 code, which will be used to evaluate the safety of HRSs in a large city in the Republic of Korea.

2. Hydrogen-Air Explosion Test in a HRS Mock-Up Facility

2.1. Test Facility and Conditions

Shell Hydrogen B.V. performed a vapor cloud explosion test in an open space using a hydrogen-air mixture volume of 81.0 m3 (5.4 m × 6.0 m × 2.5 m), where a dummy vehicle and two dispensers were located to represent the HRS geometry configuration, under an approximately stoichiometric condition of 30.8 vol.% by igniting the hydrogen-air mixture with an electric spark of an equivalent energy of 50 mJ at the health and safety laboratory (HSL) in the UK, as shown in Figure 1a and Table 1 [19,20]. A thin plastic film with a thickness of 23 μm was used to enclose the hydrogen-air mixture from the outer surface of a confining wall to the surface at a distance of 6 m, forming a rectangular tent shape using several support bars located at the boundary of the tent [19,20]. The height and thickness of the confining wall, representing an actual wall, and a larger vehicle in the HRS, were estimated as approximately 4.2 m and 0.6 m, respectively, as indicated in Figure 2 and Figure 3 in the referenced studies [19,20]. Two dispensers located at a distance of 1.0 m from the confining wall were manufactured using steel material and were formed into a rectangular box shape with a height of 2.1 m, a width of 0.9 m, and a thickness of 0.6 m on a concrete pad. The bottom of the vehicle was raised 0.3 m above from the concrete pad by four wheel sections with a width and thickness of approximately 0.4 m and 0.13 m, respectively. The overpressures in the tent region and the air environment were measured as 3.05 m to 30.05 m and 1.5 m to 6.25 m along the x– and y–directional lines from the K3 position, respectively, as shown in Figure 1b.

2.2. Discussion on Test Results

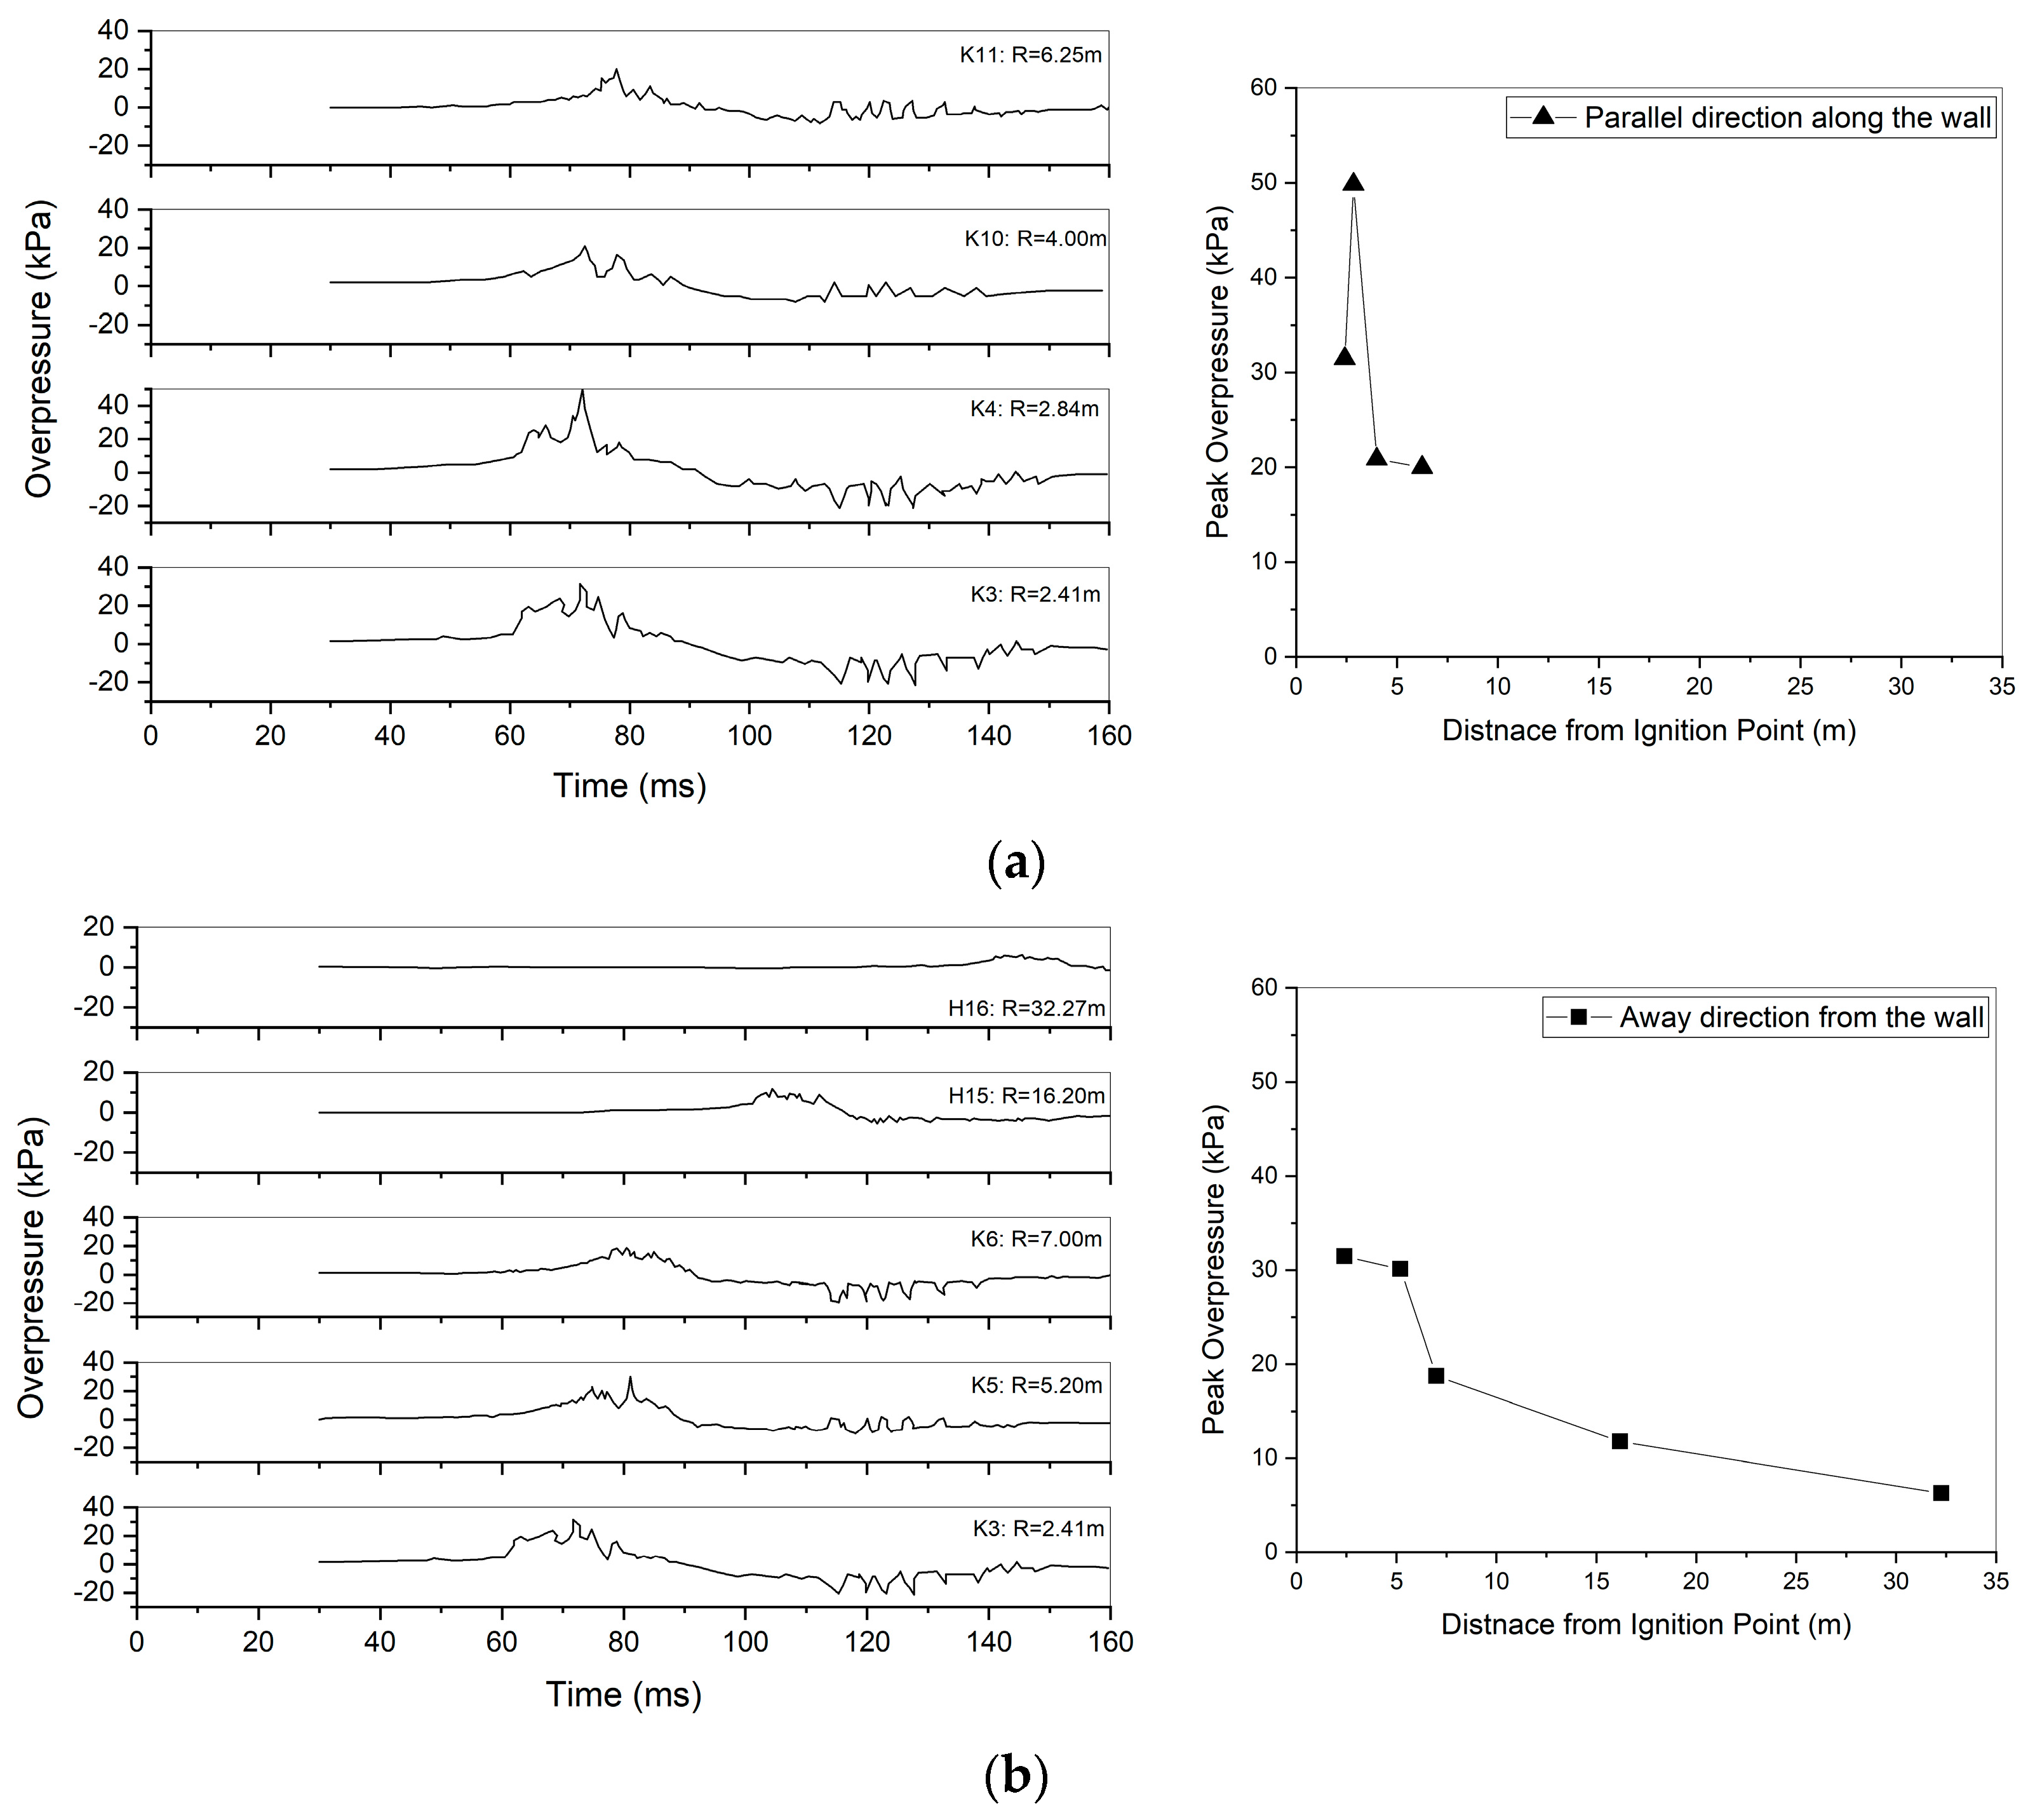
All overpressure data in the test were recorded at a rate of 50 kHz and then averaged over a time span of 0.48 ms, as shown in Figure 2, to remove the effects of noise that arose during the measuring process, which appeared more in the datasets measured at K3 and K4 located under the vehicle [19,20]. The overpressure data measured along the x-directional line from K3 showed that the peak overpressure increased rapidly from approximately 31 kPa at K3 to 49 kPa at K4 as the flame propagated from the ignition point to the corresponding distances of 2.41 m and 2.84 m, respectively, after passing the dispenser and vehicle after the start of the ignition (Figure 2a and Table 2). As soon as the pressure buildup process owing to flame acceleration was completed, the pressure wave with the increased magnitude started to propagate to the air environment from the tent region after the rupturing of the plastic film. While the pressure wave propagated to greater distances of 4.0 m and 6.25 m in the lower region of the ignition point, the measured peak overpressures along the x-directional line decreased to approximately 20.57 kPa at K10 and 14.95 kPa at K11 because the pressure wave collided with gas molecules in the air during its propagation.
We could not compare the overpressures of K4, K10, and K11 in the lower region of the HRS mock-up facility with the overpressures at locations of K2, K8, and K9 along the x-directional line (Figure 1b), located in the upper region above the K3 position, because the corresponding data were not present in the references [19,20]. The overpressures along the y-directional line from K3 to a distance of 32.27 m in the air also showed that their magnitudes decreased continuously and were finally reduced to approximately 6 kPa at H16 (Figure 2b) as the distance from the ignition point increased. From the measured overpressure data (Figure 2), we concluded that the hydrogen-air cloud explosion in the obstacle geometry configuration in the HRS mock-up facility showed a typical deflagration phenomenon [21,22].

3. Development of the radXiFoam v2.0 Solver

We developed the radXiFoam v2.0 code by modifying the radXiFoam v1.0 code [15] on the basis of the open-source CFD software OpenFOAM-v2112 [8] to simulate a VCE accident in a humid air environment and the damage mitigation effect by a barrier at a HRS. We modified C++ source codes in three libraries, a reaction thermo-physical model, a radiative heat transfer model, and a laminar flame speed model, and replaced the default library files in OpenFOAM-v2112 with new library files to remove unnecessary warning messages stemming from the double use of three libraries during the calculation when using the radXiFoam v1.0 code.

3.1. Modification of Libraries

To apply the XiFoam solver based on the flamelet progress variable model in OpenFOAM-v2112 [8,23], which only considers the combustion of fuel and oxygen for the VCE accident analysis, first we modified the source code “inhomogeneousMixture.C” in the reaction thermo-physical library to add nitrogen gas (n2) and water vapor (wv) to the previous gas mixture model, which consisted of fuel and oxygen. In the new library, the variations of the species mass fractions of hydrogen (ft), oxygen (ox), and the product (pr) during the hydrogen-air chemical reaction in the computational domain according to the hydrogen flame propagation progress are expressed as Equations (1) to (3), respectively, in the source code. The progress variable “b,” obtained by solving the transport equation (Equation (4)), predicts the flame front location in the combustion field and is used here to calculate the remaining fuel mass fraction “fu” after the hydrogen-air chemical reaction is complete. If the progress variable b is 1, it indicates an unburned state and is decreased to 0 as combustion proceeds to completion. In Equations (1) and (2), “stoicRatio().value()” is given by user input on the basis of the stoichiometric ratio of the hydrogen-air chemical reaction. The mass fraction of the hydrogen “ft,” the water vapor “wv,” and the nitrogen “n2,” of which the initial values also depend on user input, in the computational domain are sequentially solved by applying the general i-species (Yi) transport equation (Equation (5)) to each species equation. When solving the species transport equations, the turbulence effect on the diffusion phenomenon, the turbulent viscosity (μt), and the turbulent Schmidt number (Sct) are included in the diffusion term of Equation (5) [8,9].
fu = b ∗ ft + (1.0 − b) ∗ fres(ft, stoicRatio().value())
ox = 1 − ft − n2 − wv − (ft − fu) ∗ stoicRatio().value()
pr = 1 − fu − ox − n2
ρ b t + · ρ U b · μ t S c t b = ρ S u ξ b
ρ Y i t + · ρ U Y i · μ t S c t Y i = S i
We also modified the source code “greyMeanAbsorptionEmission.C” in the radiative heat transfer library so that it would reasonably simulate the heat transfer phenomenon in an unburned gas region by considering the water vapor’s heat absorption in the humid air environment, as water vapor tends to absorb the thermal photons emitted due to the high temperature of the combusted gas [24]. To predict the extent of the heat absorption accurately according to the concentration of the water vapor in the air, we introduced the absorption coefficient of the water vapor (awv), as calculated using the partial pressure of the water vapor (Pwv) in the gas mixture and the gas absorption coefficient depending on the gas temperature (kwv) (Equations (6) and (7)) [6,25]. In Equations (6) and (8), qr denotes the radiation heat flux used as the heat source or sink in the energy equation when the P-1 radiation model is applied [9,10,23,24]. We only used the P-1 radiation model when developing the radXiFoam code but plan eventually to use other radiative heat transfer models as well.
· q r = a e f f G 4 e σ S B T 4 + E
a w v = k w v × P w v
t ρ h + · ρ U h + t ρ K + · ρ U K p t + · μ t S c t h = · q r
Finally, we created the source code “powerLaw.C” to calculate the laminar flame speed (Su) effectively, using Equations (9) to (11), on the basis of the fuel equivalent ratio (φ) considering the initial water vapor mass fraction in the hydrogen–air mixture referring the source code “Gulders.C” in OpenFOAM-v2112 [8]. In Equation (9), Su0 is the laminar flame speed considering the initial water vapor at the reference condition at a temperature of 300K (Tu) and pressure of 1 bar (P0), Tu is the unburnt gas temperature, and P is the gas pressure [10,23,26].
Su = Su0 (Tu/T0)α(P/P0)β
α = 2.18 − 0.8(φ − 1)
β = −0.16 + 0.22(φ − 1)

3.2. Calculation Procedure of the radXiFoam Solver

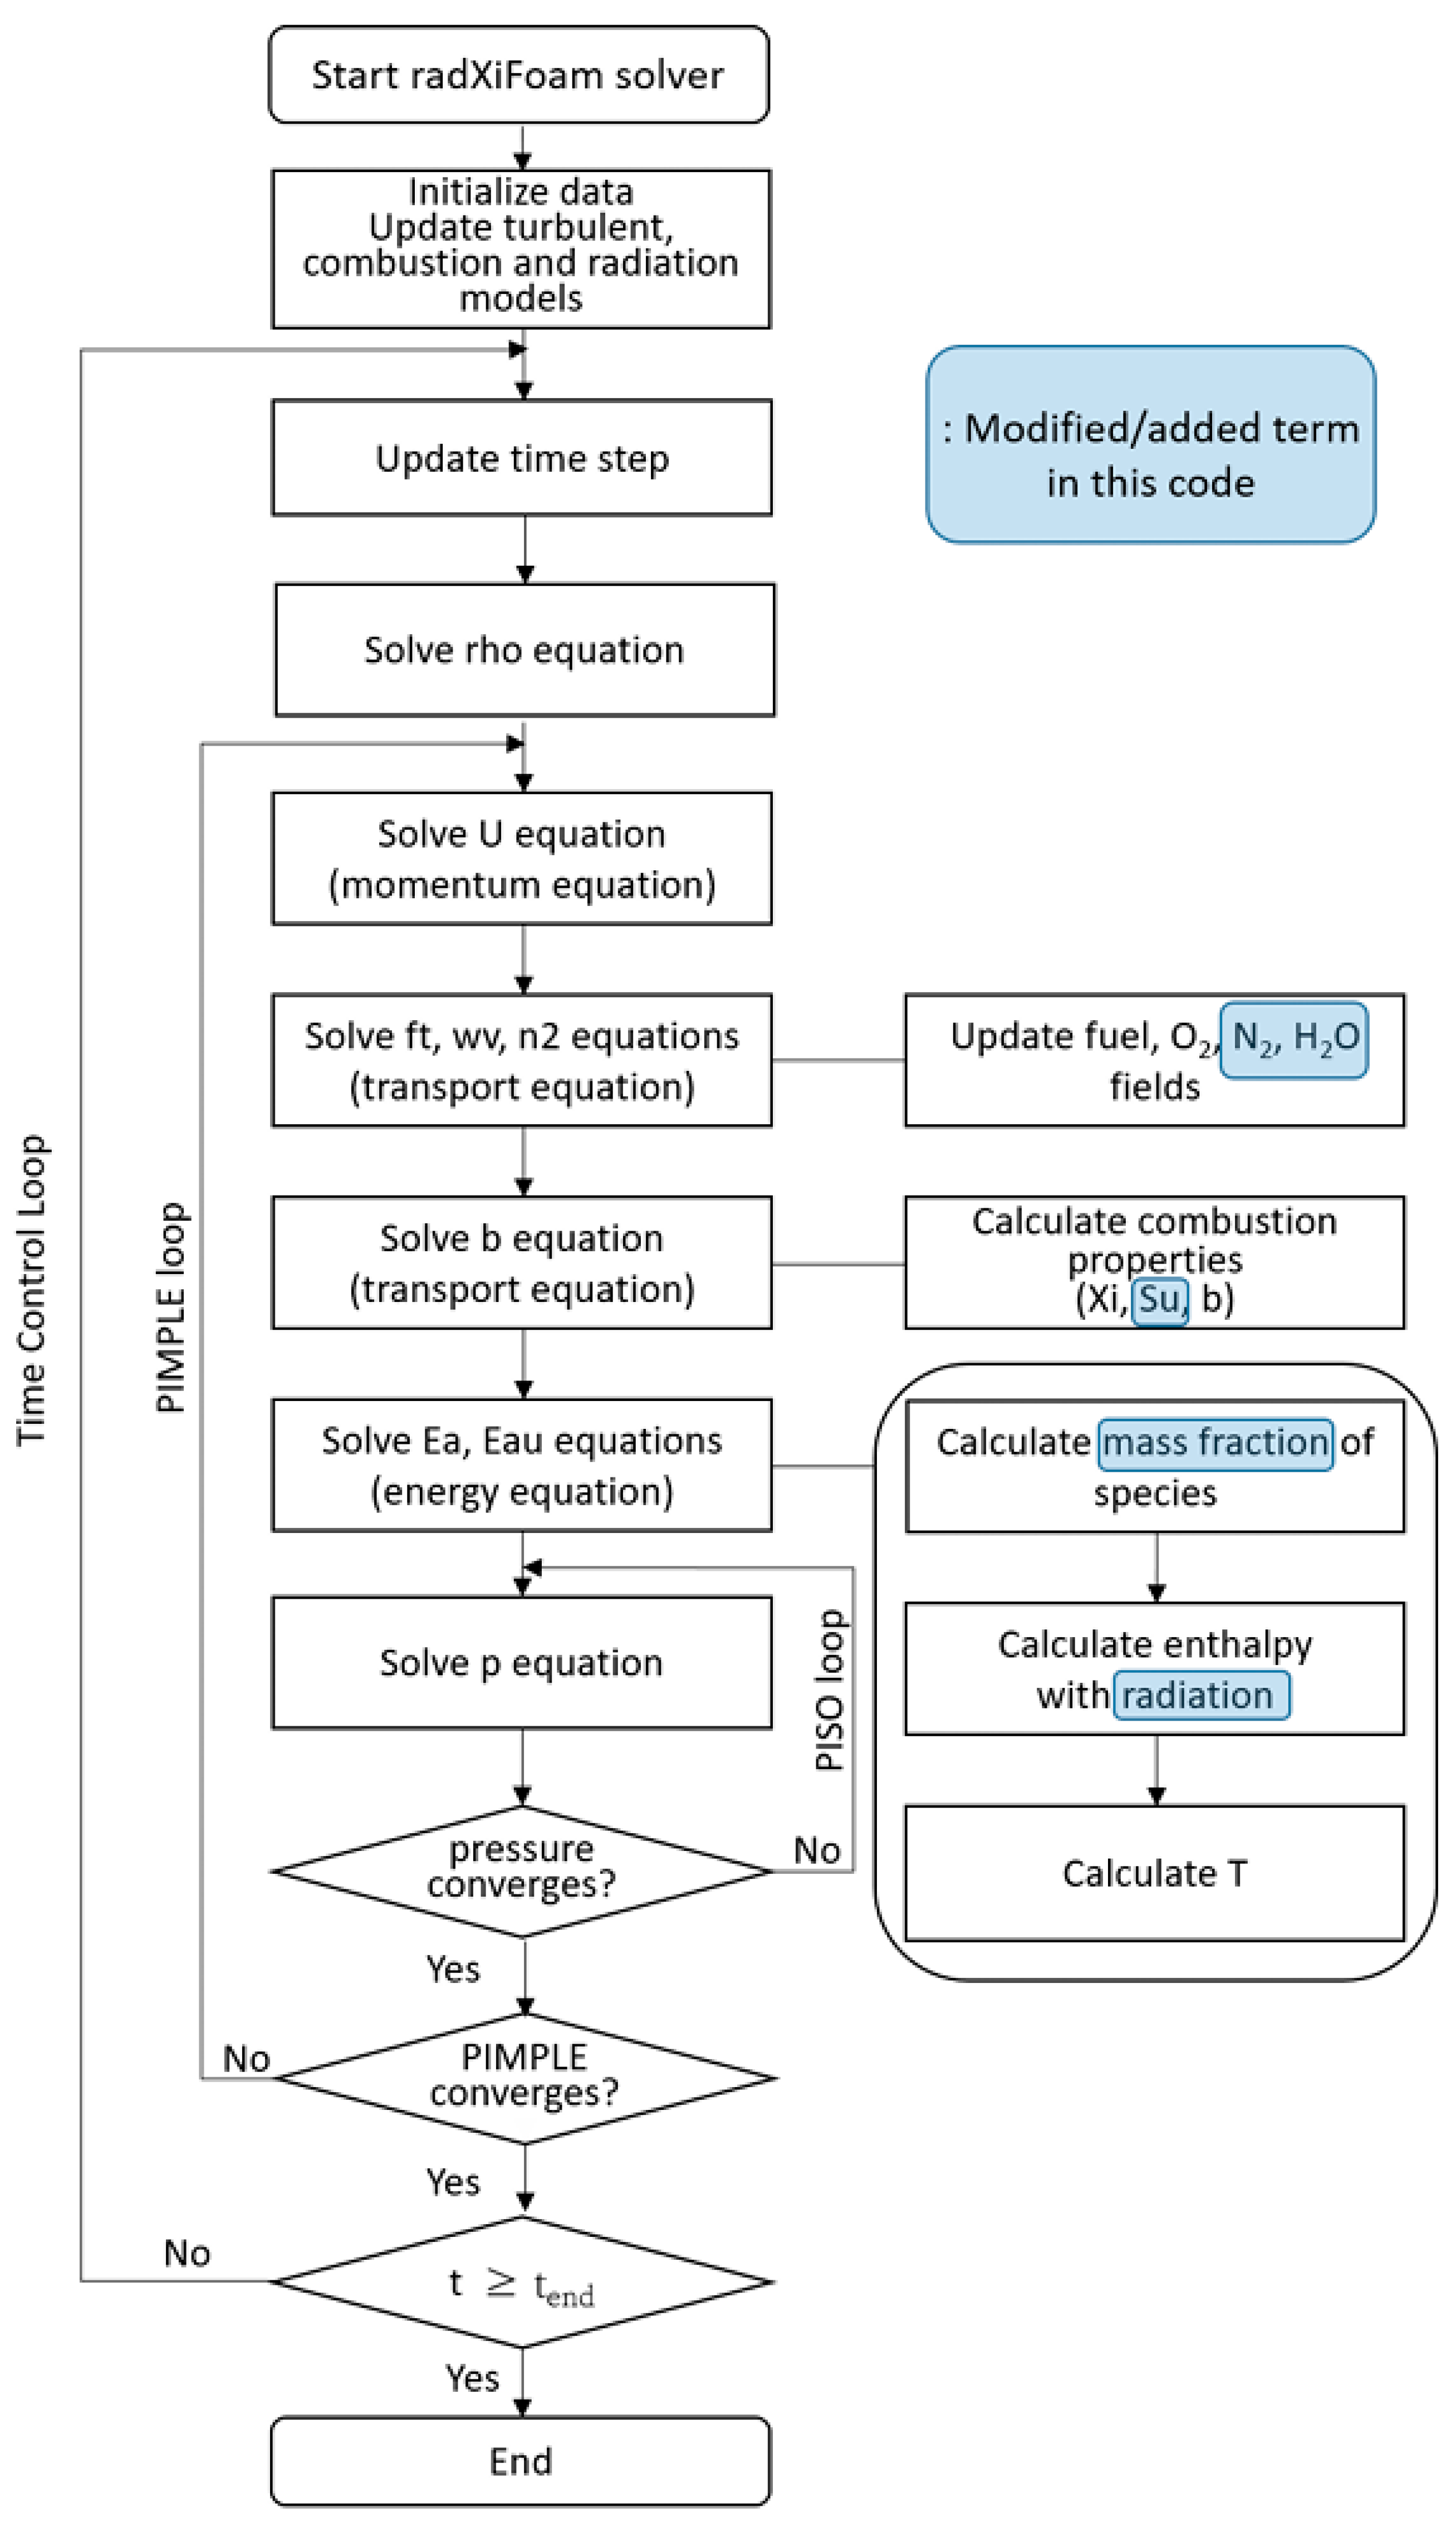
The calculation procedure of the radXiFoam v2.0 code using the PIMPLE algorithm with the modified governing equations with the newly created libraries to simulate a VCE accident in a humid air environment is shown in Figure 3. The PIMPLE algorithm is a combination of Pressure-Implicit with Splitting of Operators (PISO) algorithm and Semi-Implicit Method for Pressure-Linked Equations (SIMPLE) algorithm [9]. The modified parts from the XiFoam solver in OpenFOAM-v2112 are denoted by the rectangular boxes in sky blue in Figure 3.
After initializing all variables and updating the time step information at an early stage of the radXiFoam calculation process, the mass conservation equation, termed the “rho equation,” using the value calculated at the previous time step is initially solved after changing the time step size to meet the Courant-Friedrichs-Lewy (CFL) number established by means of user input [8,9]. We proposed a CFL number below approximately 0.9 and a proper time step of approximately 1.0 × 10⁻⁷ s to 1.0 × 10⁻⁴ s to obtain converged solutions for an accurate simulation of the propagation of the pressure wave through the barrier on the basis of the validation analysis results [6,10]. The momentum, species transport, energy, and pressure equations are iteratively solved in the PIMPLE loop to meet the required residual criteria of the important variables, from approximately 1.0 × 10⁻⁶ to 1.0 × 10⁻⁵, again by user input [6,10]. The PISO algorithm is additionally applied to obtain the converged solution of the pressure and velocity coupling equation during the transient calculation [8,9].

3.3. Validation Analysis of the radXiFoam v2.0 Code

We conducted a validation analysis of the radXiFoam v2.0 code on the basis of measured data from the hydrogen-air explosion test at the HRS mock-up facility to determine whether radXiFoam can accurately simulate the pressure buildup due to flame acceleration in the obstacle geometry configuration in the tent region and the overpressures at a far field by propagation of the blast wave.

3.3.1. Grid Model with Initial and Boundary Conditions

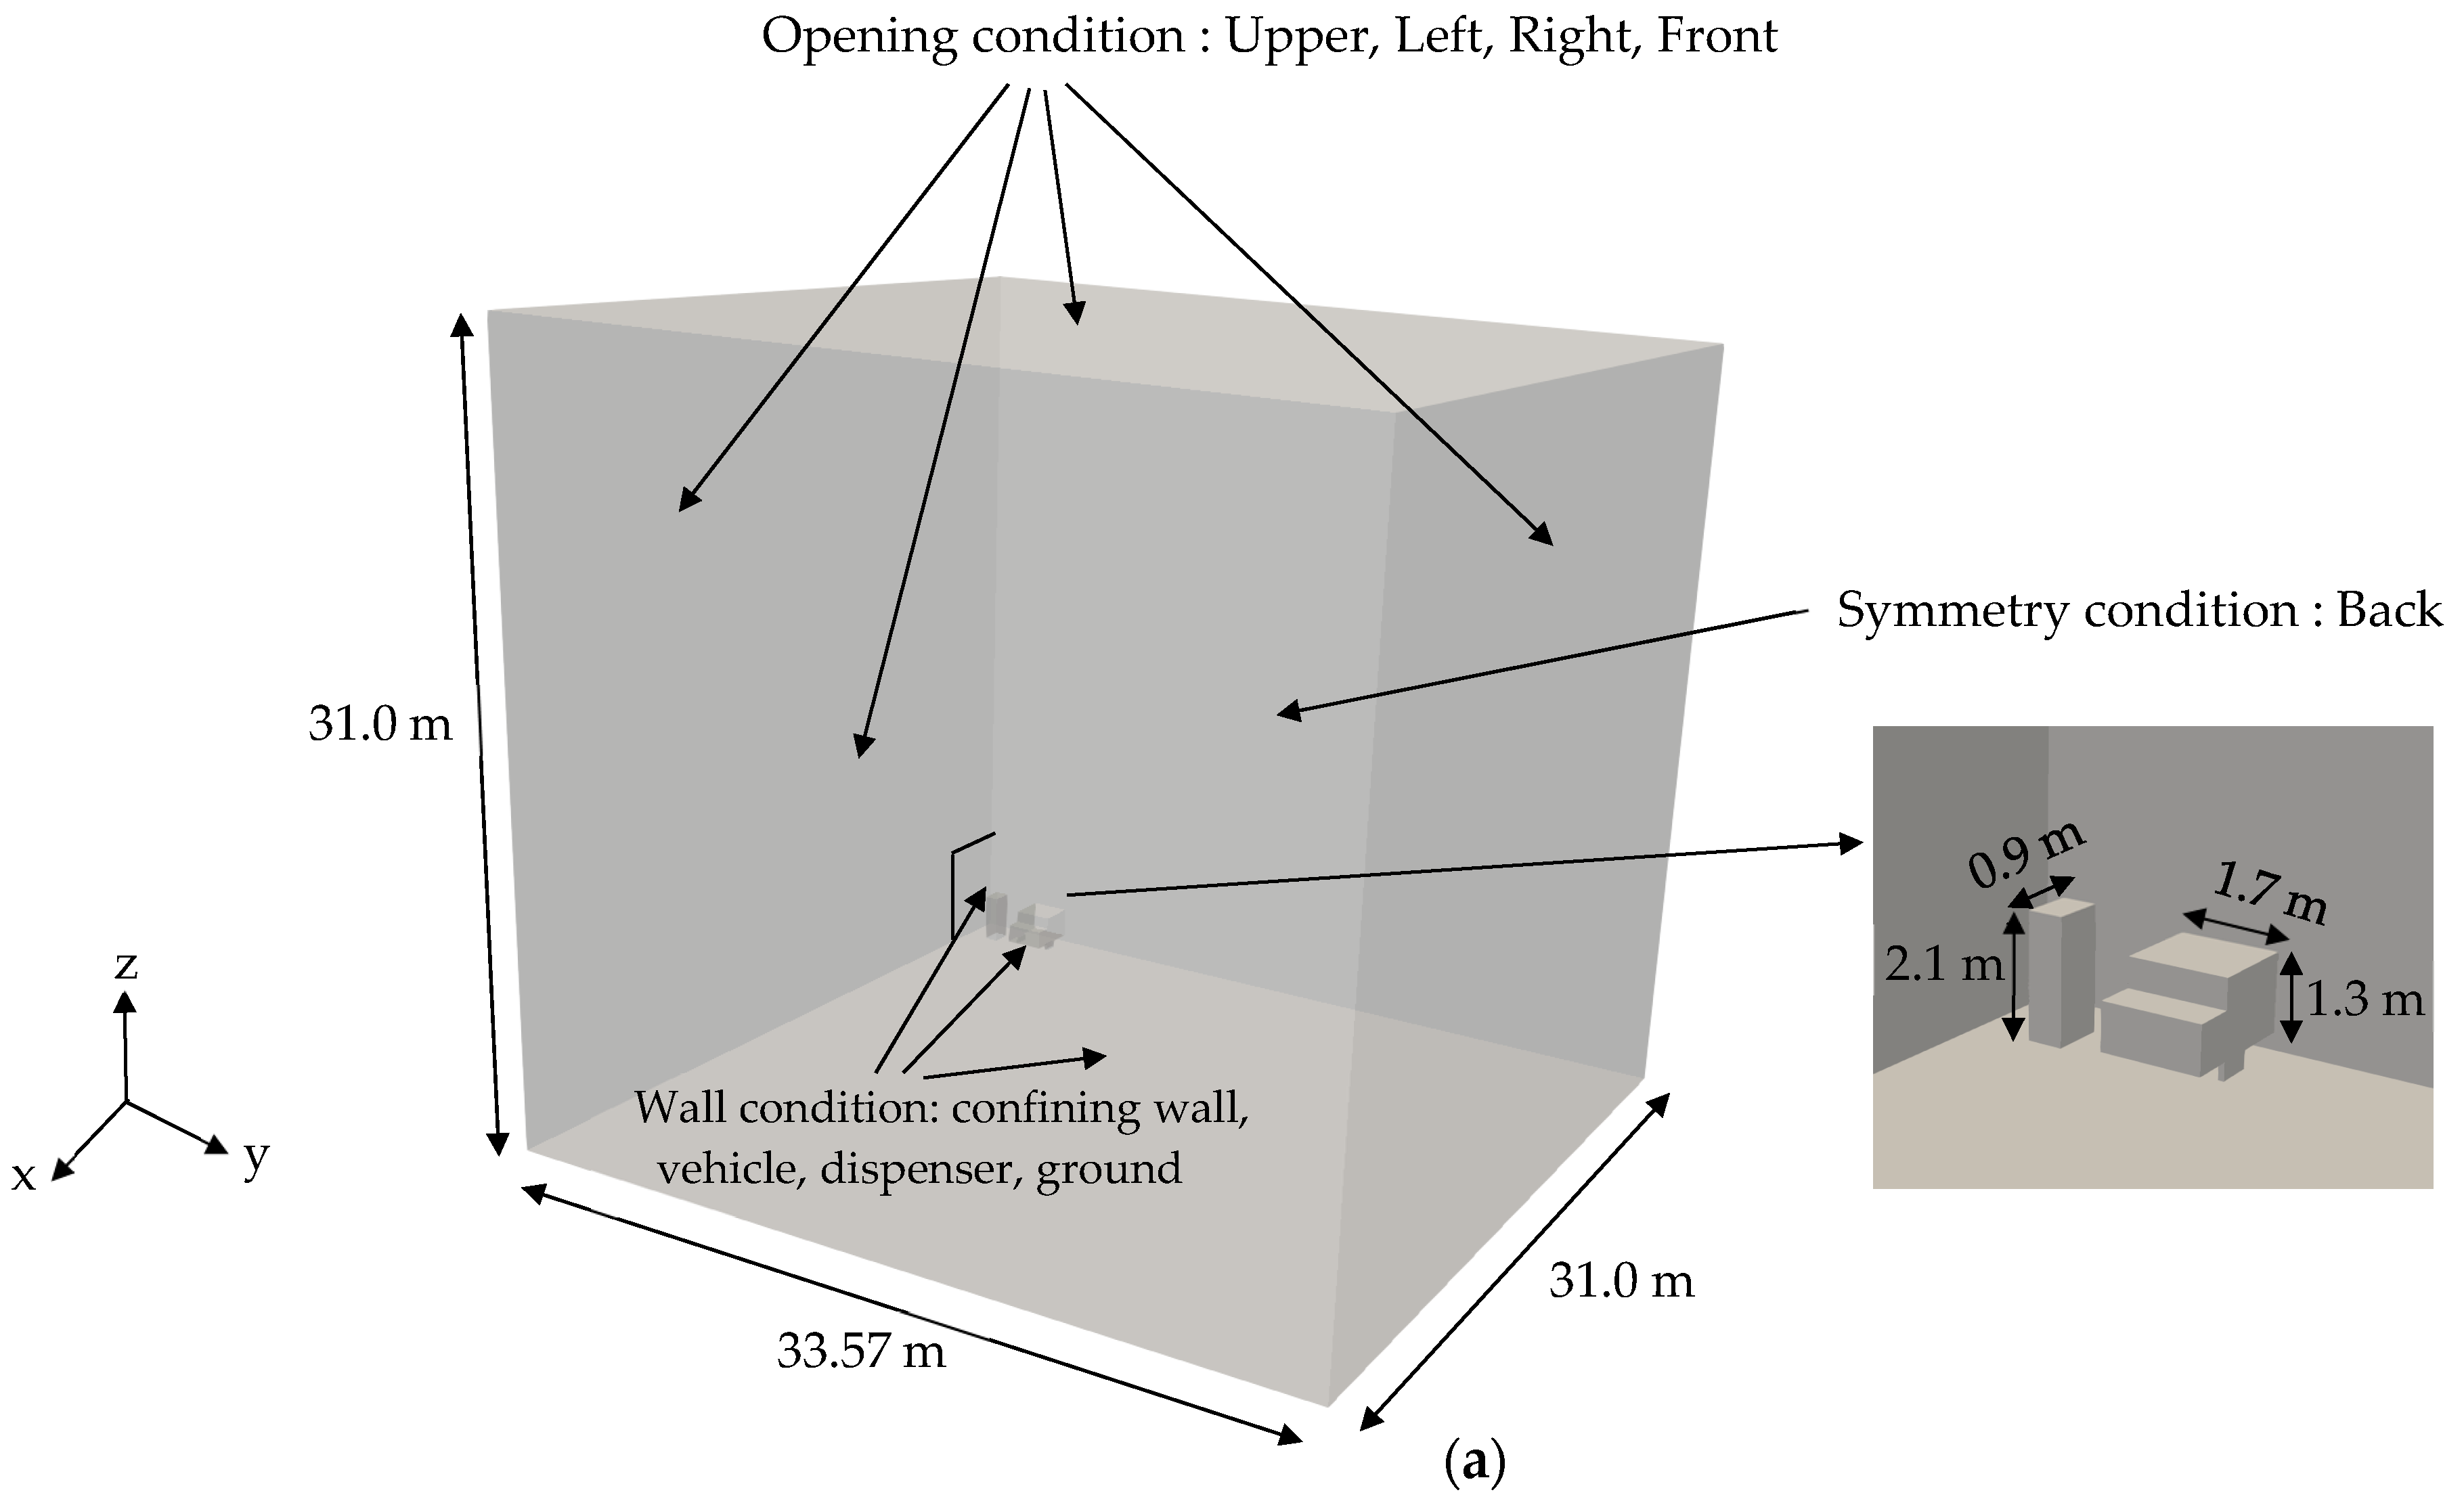
A three-dimensional grid model to simulate the HRS mock-up facility was developed using the blockMesh utility in OpenFOAM-v2112 [8], as shown in Figure 4. It was necessary to use a half-symmetric condition, applying it to the surface formed along the y-directional line from the confining wall to the H16 location as shown in Figure 1b, to develop an efficient grid model to find converged solutions within a suitable computation time using a personal desktop computer (Table 3). The experience of using this personal computer for the validation analysis based on the HRS mock-up facility can provide useful information to engineers who will conduct radXiFoam analyses to evaluate the safety of HRSs, as they can easily configure a general computing system at a lower cost compared to a high-performance computing system (HPC) [27] based on this research result. As another reason to use the half-symmetric grid model, we did not find the measured overpressure data of K2, K8, and K9 in the upper region above the y-directional line in Figure 1b for comparison with the radXiFoam analysis results [19,20].
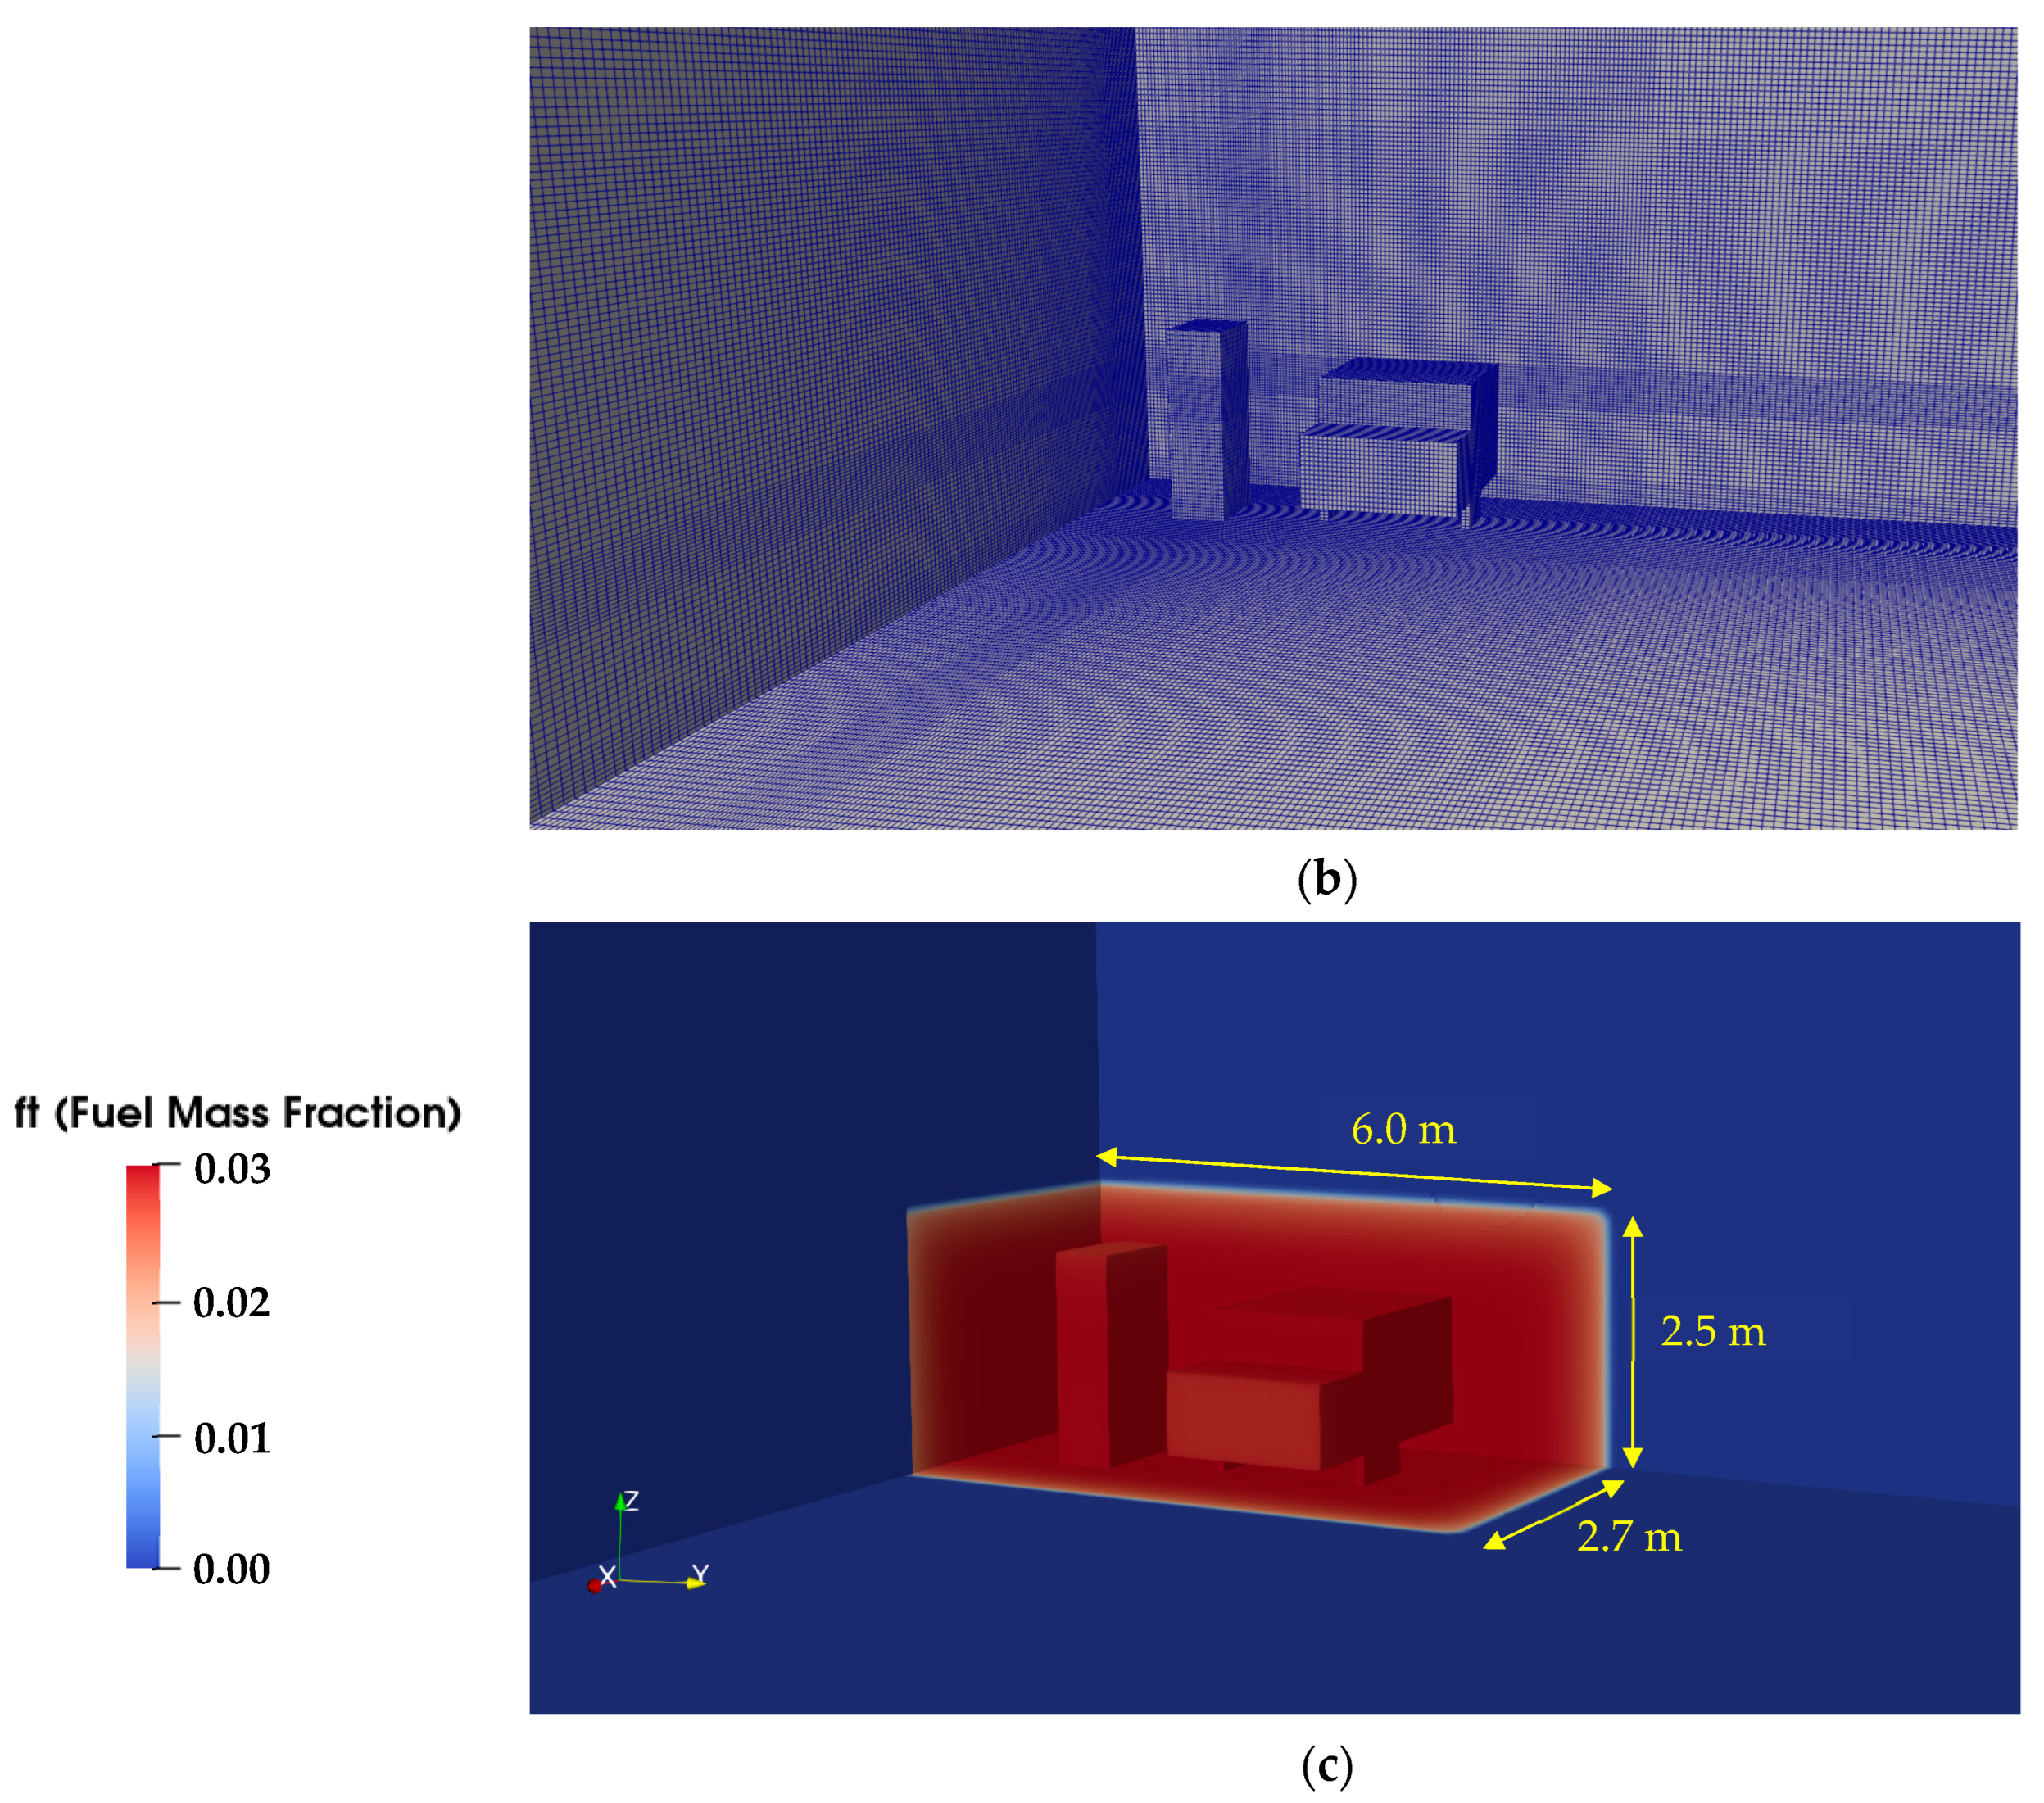
Thus, a grid model having a total of 30,432,390 hexahedral cells was developed to simulate the vapor cloud region of the air environment in the HRS mock-up facility (Figure 4a). Computational cells with an approximate length of 3.0 cm were generated in the tent region to resolve the rapid flame acceleration, as shown in Figure 4b, whereas cells approximately 10 to 25 cm in size were used to analyze the propagation of the blast wave in the air environment. This variation of the cell length size depending on the region was determined on the basis of previous analysis results, including mesh sensitivity calculations and the predicted computation times to complete the validation analysis [6,10].
The boundary condition applied to the outer surfaces of the grid model to simulate the inflow and outflow of air depending on the blast wave propagation to the air was an opening condition realized with a wave transmissive condition [6,10]. A wall condition was assigned to the bottom surface of the grid model, representing the concrete pad on the ground in the HRS mock-up facility. To simulate the radiative heat transfer from the combusted gas with higher temperatures to the outer surfaces of the vehicle and the dispenser in the tent, an emissivity value of 0.074 was assigned to those surfaces on the basis of radiative properties in the literature [24].
The initial conditions of the measured gas concentrations, temperatures, and pressures in the tent region and the air environment (Table 1) were established using the utility program setFields in OpenFOAM-v2112 [8]. In the radXiFoam code based on OpenFOAM, the gas concentrations should be given as the corresponding mass fractions, such as the hydrogen mass fraction (ft) in the tent region, as shown in Figure 4c. In particular, an initial turbulent fluctuation velocity (u’) of 5.0 m/s in the tent region was assumed to compensate for the lack of generated turbulence when the flame passes over the supporting bars located along the boundary of the tent and the cross bar located at the upper region of the engine bay in the vehicle (Figure 1) on the basis of previous validation results [10], as we did not find geometrical information pertaining to the supporting bar in the literature [19,20] and needed to reduce the time required to produce these small bars in the grid model. This strategy to model the tent region in the HRS mock-up facility, where the hydrogen-air explosion occurs, can also provide useful information to safety engineers who will create input files of the radXiFoam code to simulate a VCE accident at a HRS.

3.3.2. Analysis Methodology

We applied the established analysis methodology, as shown in Table 4, to the radXiFoam analysis for the pressure buildup due to flame acceleration in the obstacle geometry configuration on the basis of previous validation analysis results considering SRI explosion test 4-02, sensitivity calculations for various barrier heights based on the SRI test facility and shapes, and CFD results for hydrogen flame acceleration in the containment of a nuclear power plant [6,10,28,29]. The uncertainty of this methodology to predict the peak overpressure including damage mitigation by the barrier during the VCE is approximately ±30% on the basis of previous analysis results [6,10].
In particular, we introduced an ignition model of a hot-spot spherical region with a radius of 0.1 m where the hydrogen flame had already propagated at the laminar flame speed of 2.2 m/s [28,29] to simulate the hydrogen-air ignition via the electric spark operation with an equivalent energy of 50 mJ in the HRS mock-up facility. To simulate the ignition process around the ignition point precisely during the operation of the electric spark, which is much lower than that in the SRI test, it was necessary to decrease the mesh size around the ignition region to approximately the millimeter order and spend a considerable amount of time to complete the validation analysis. This situation is not suitable for development purposes of the radXiFoam code intended for practical use by safety engineers at HRSs [1].
To calculate the turbulent viscosity, which is utilized during the calculation of the diffusion term in the transport equation, including the flame progressive variable “b” equation, we proposed the use of only the k-ω Shear Stress Transport (SST) model because we did not obtain the converged solution when we used another turbulence model [6,15]. However, we will attempt to conduct an additional validation analysis to recommend various turbulence models for use with radXiFoam code.

3.3.3. Discussion on the Calculation Results

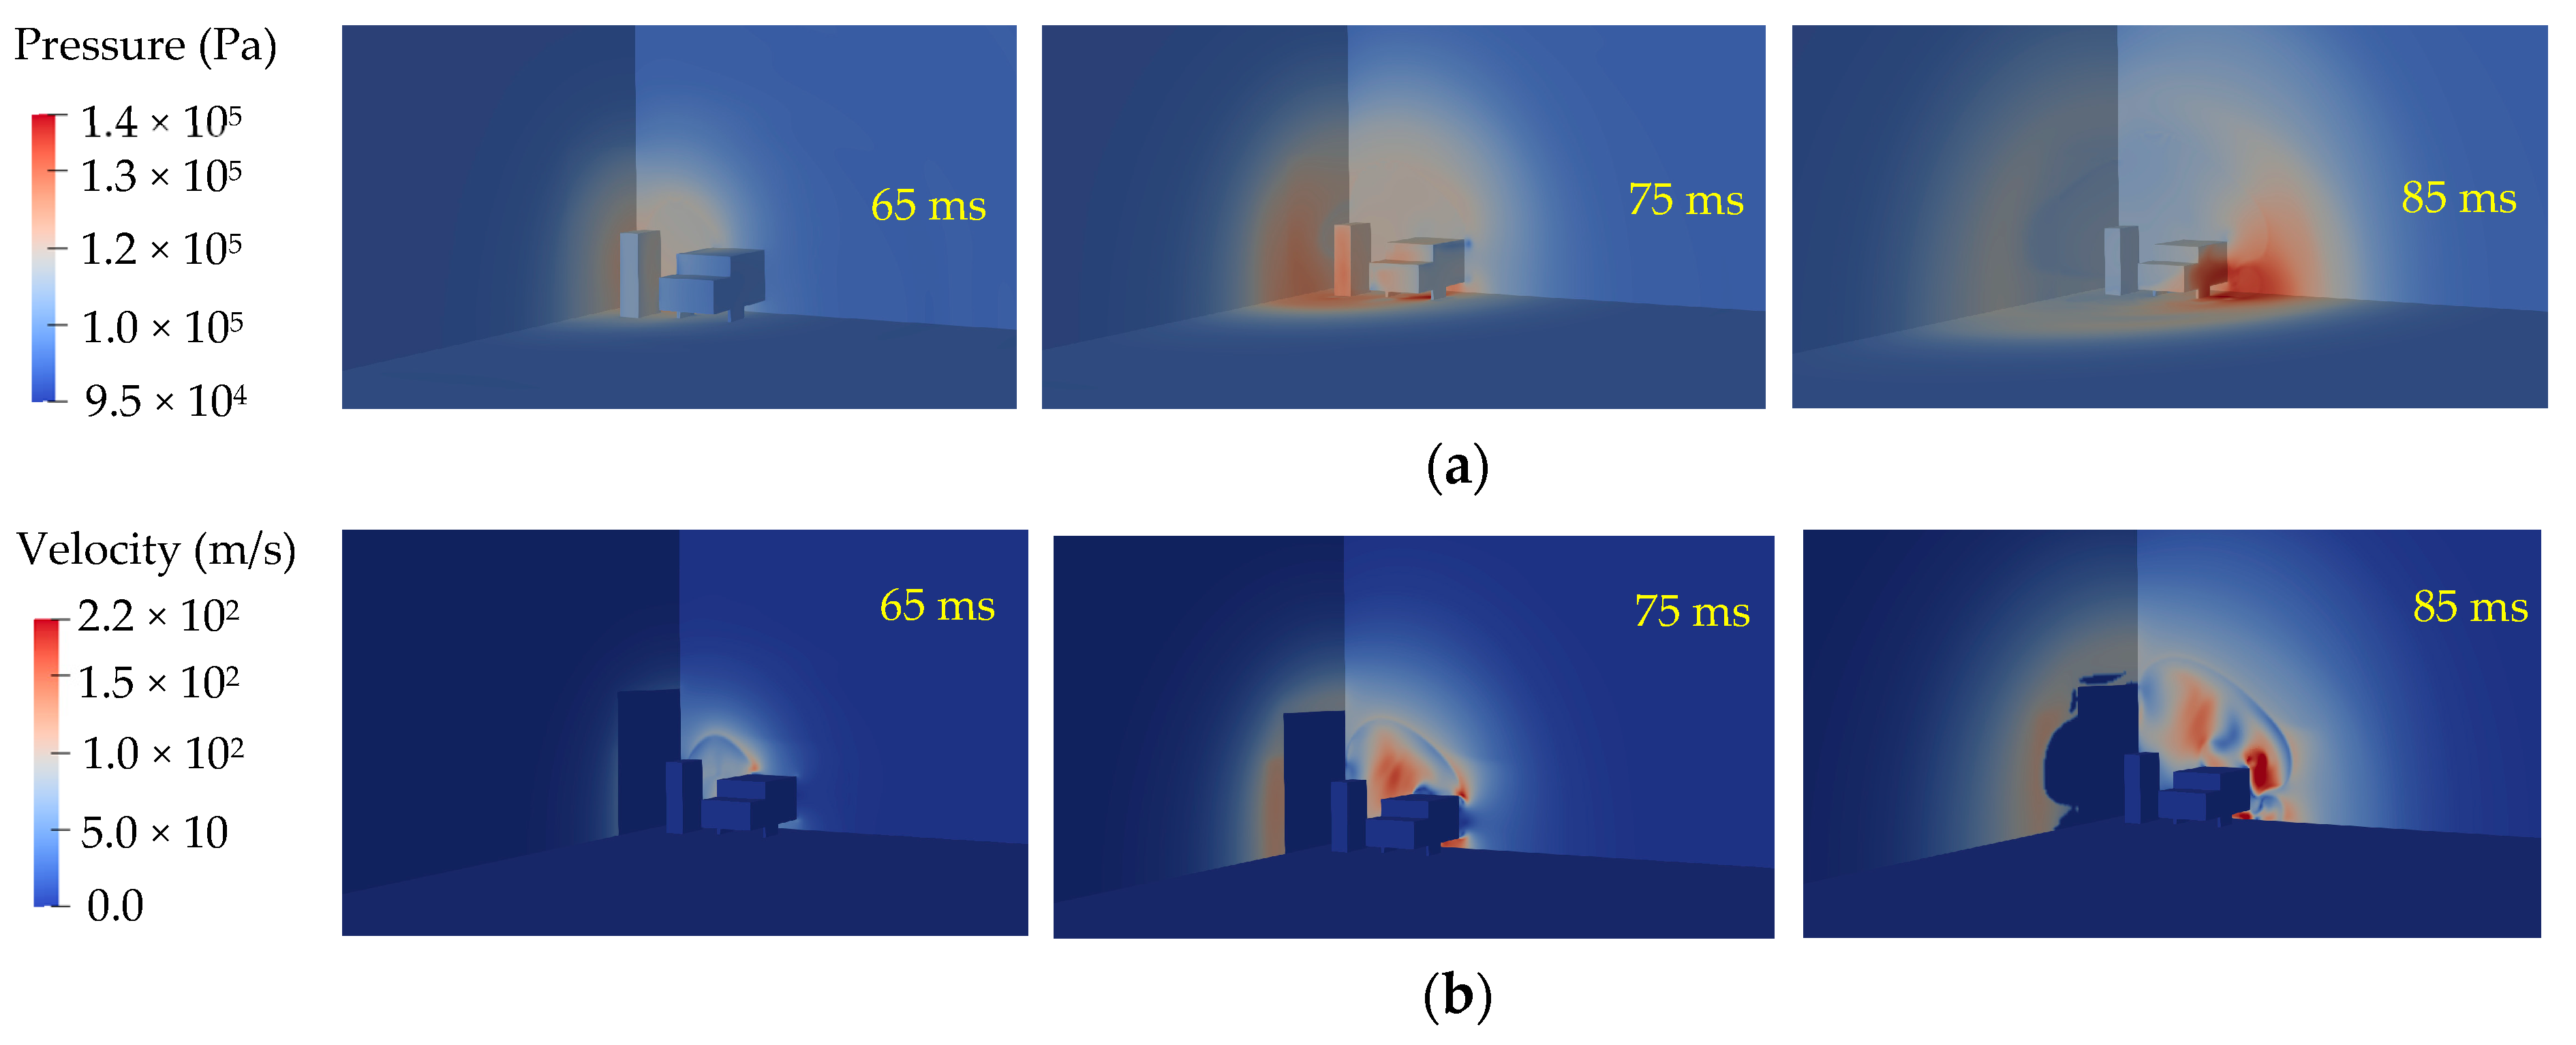
The calculated temperature, velocity, and pressure distributions on the planes around the vehicle and the dispenser using the open-source software ParaView 5.11.1 [30] are shown in Figure 5, Figure 6, Figure 7 and Figure 8. The temperature distribution results (Figure 5) over time according to the radXiFoam calculation reasonably predict the propagation of the hydrogen flame from the ignition point to the upper, right, and front directions through the vehicle and the dispenser because the confining wall is located on the left side of the ignition point. According to Figure 5c,d, the flame rapidly propagates through the dispenser and the vehicle from 65 ms to 85 ms along the upper and right directions when compared to the previous flame propagation over a time span of 20 ms; this flame acceleration can be explained by the fact that the combusted region, which forms around the ignition point, plays a role in the strong driving force for the subsequent flame propagation into the unburnt region, as the pressure in the combusted region was increased owing to the heat generated during the exothermic chemical reaction of the hydrogen-air mixture, as shown in Figure 6a. In addition, stronger turbulence generation, when the flame passes through the outer surfaces of the dispenser and vehicle, causes the flame front propagation to accelerate, of which the effect is accurately simulated by the turbulence flame source term on the right-hand side of Equation (4). As a result of this flame acceleration, the gas velocity increases to approximately 220 m/s around the vehicle, as shown in Figure 6b. Thus, we judged that the radXiFoam solver can accurately simulate the pressure buildup phenomenon when the flame passes the obstacle geometry configuration during a VCE.
After the pressure buildup process due to flame acceleration in the tent region (Figure 7a–c), the pressure wave starts to propagate from the boundary of the tent region to the far field of the explosion site with the formation of a quarter-spherical shape band, as shown in Figure 7d–f. The magnitude of the blast wave decreases continually due to collisions with molecules in the air during its propagation to the far field, as explained in “Section 2.2 Discussion on Test Results.” In Figure 7c–f, the magnitude of the pressure wave band plotted on the left surface is slightly lower than that of the right surface. This can be explained by the fact that the opening boundary condition applied to the left surface except the confining wall region allows the pressure wave to be transmitted through the boundary surface, whereas the symmetric condition on the right surface applies such that the gradient of the pressures at all cells is zero [8,9].
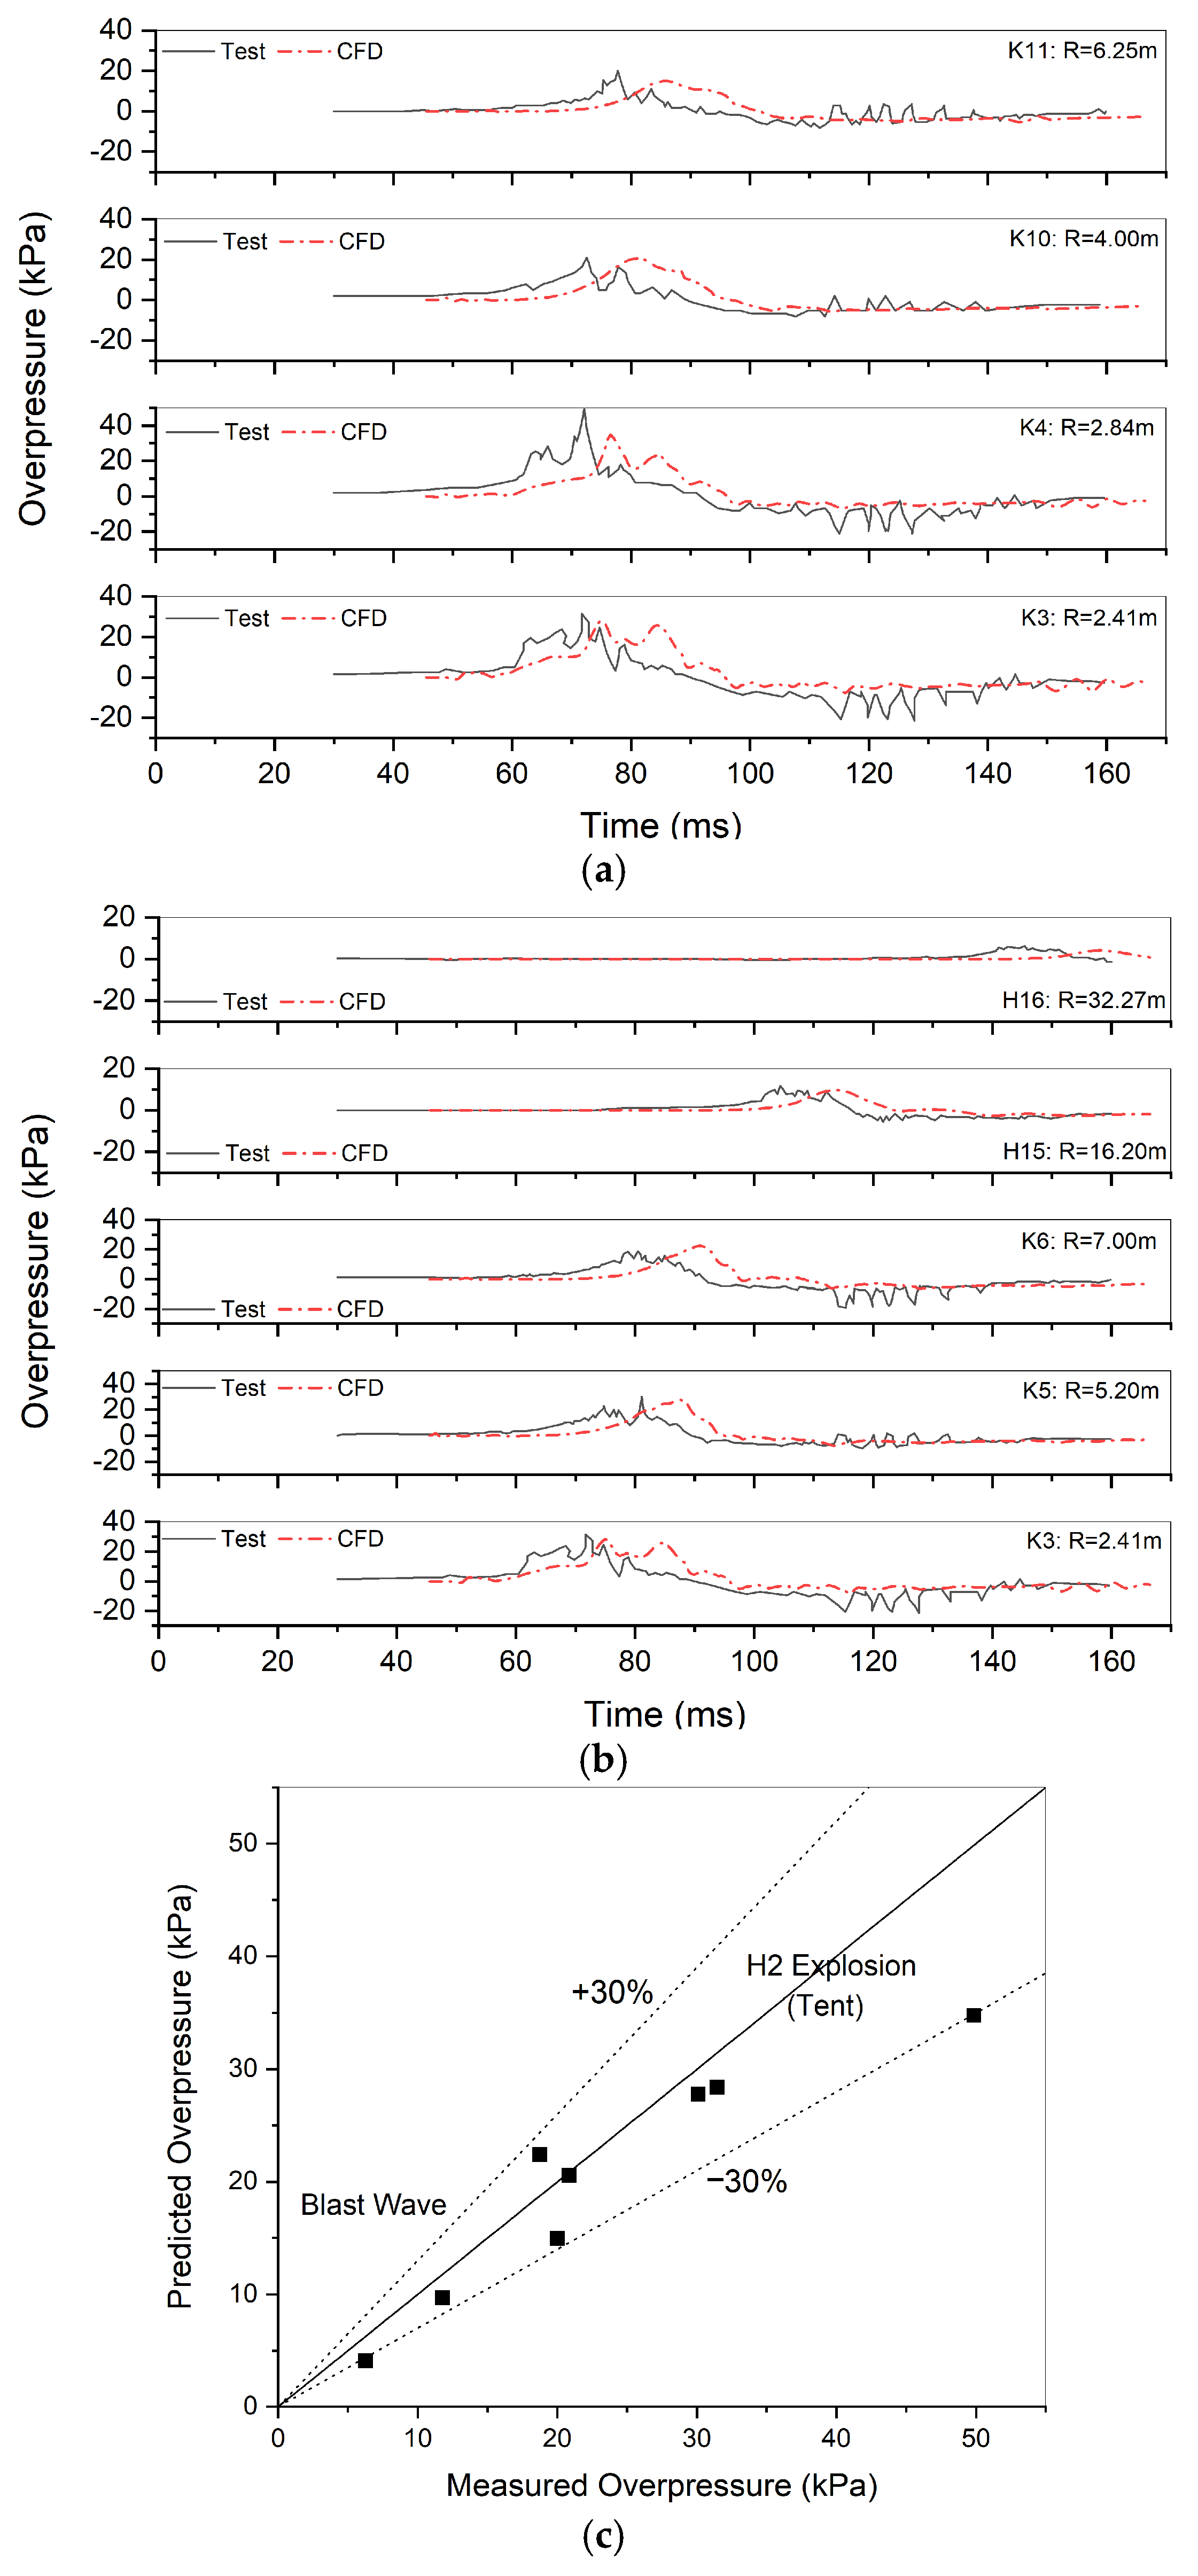
To determine the uncertainty of the CFD prediction of the overpressure increase due to flame acceleration in the tent region and the overpressure reduction as the pressure wave propagates to the far field, we locally compare the overpressure behaviors between the test data and the CFD results at eight pressure measurement locations in the HRS mock-up facility along directions parallel and away based on the confining wall, as shown in Figure 8. The CFD data used for this comparison are also averaged over a time span of 0.48 ms to create a condition as similar as possible for the test data. Figure 8a shows that the CFD results reasonably simulate the measured overpressure increase from approximately 31.4 kPa at K3 to 49.8 kPa at K4 in the tent region, despite the fact that the predicted overpressure at K4 by the radXiFoam solver is approximately 30% lower than that from the test data. However, we judged that this discrepancy is acceptable because the rupture of the plastic film during the test, giving rise to a slight increase in the gas pressure in an instant in time, was not considered in the CFD analysis; moreover, the approximated grid model with a cell length of 3.0 cm for the under-region of the vehicle may have an effect on the pressure wave arriving at the K4 location.
The comparison of the overpressures in the air along the direction parallel between the test data and the CFD results (Figure 8a) shows that the CFD results accurately predict the measured peak overpressures over the pressure behaviors with an error range of approximately ±30%, but the instances at which the overpressures are increased to the maximum values are predicted approximately 15 ms late. The time difference stems from the different instances of the peak overpressures in the tent region between the test data and the CFD results. This difference can be explained by the fact that a hot-spot spherical region with a radius of 0.1 m can induce late flame propagation around the ignition point when compared to the test data, as we assumed only laminar flame propagation of 2.2 m/s in such a hot spherical region. In the test, hydrogen flame propagation may accelerate after transiting from a laminar flame to a turbulent flame due to the instability phenomenon within the radius of 0.1 m from the ignition point [21,22].
The comparison of the overpressure behaviors between the test data and the CFD results in the away direction is also shown in Figure 8b, similar to those of the parallel direction, as the blast wave tends to propagate symmetrically in the air, as shown in Figure 7. Finally, the comparison of the peak overpressures at all pressure sensor locations from the near field to the far field of the hydrogen explosion site between the test data and the CFD results (Figure 8c) shows that the radXiFoam v2.0 code can accurately predict the peak overpressures due to flame acceleration in the obstacle geometry configuration in the HRS mock-up facility with an error range of approximately ±30%.

4. CFD Sensitivity Calculation of the Effect of the Barrier Existence

4.1. Sensitivity Calculation Conditions

To assess the effect of the existence of a barrier on the reduction of the overpressure in the blast wave transferring from the tent region after the pressure buildup due to flame acceleration in the HRS mock-up facility, we artificially installed a barrier wall at the horizontal distance of 5 m from the K3 location, located 1 m behind the K10 location, in the grid model used for the validation analysis, as shown in Figure 9 and Table 5. The dimensions of the barrier (Case 2) as in the first comparison with the validation analysis result (Case 1) are as follows: a height of 4.2 m, width of 6 m, and thickness of 0.2 m. The barrier thickness of 0.2 m was determined by referring to the standard model of such a barrier in the KGS technical regulations [4,5]. In addition, during the sensitivity calculation, we changed only the barrier height from 4.2 m to 2.1 m (Case 3) to confirm the effect of the barrier height on the overpressure reduction during the VCE. The confining wall in the grid model of Case 1 was extended to the installed barrier wall along the horizontal x-direction while maintaining its height at 4.2 m and decreasing it to a height of 2.1 m in Cases 2 and 3, respectively. There were nearly identical mesh distributions except for the barrier height change in the grid models of Cases 2 and 3 on the basis of the grid model of Case 1 were generated to eliminate the mesh dependency on the overpressures around the barrier. The wall conditions of outer surfaces of the barrier wall were considered to be equal to those of the confining wall. The analysis methodology including the initial and boundary conditions used for the validation analysis (Table 4) was also identical to that applied in the sensitivity calculation.

4.2. Discussion on the CFD Calculation Results

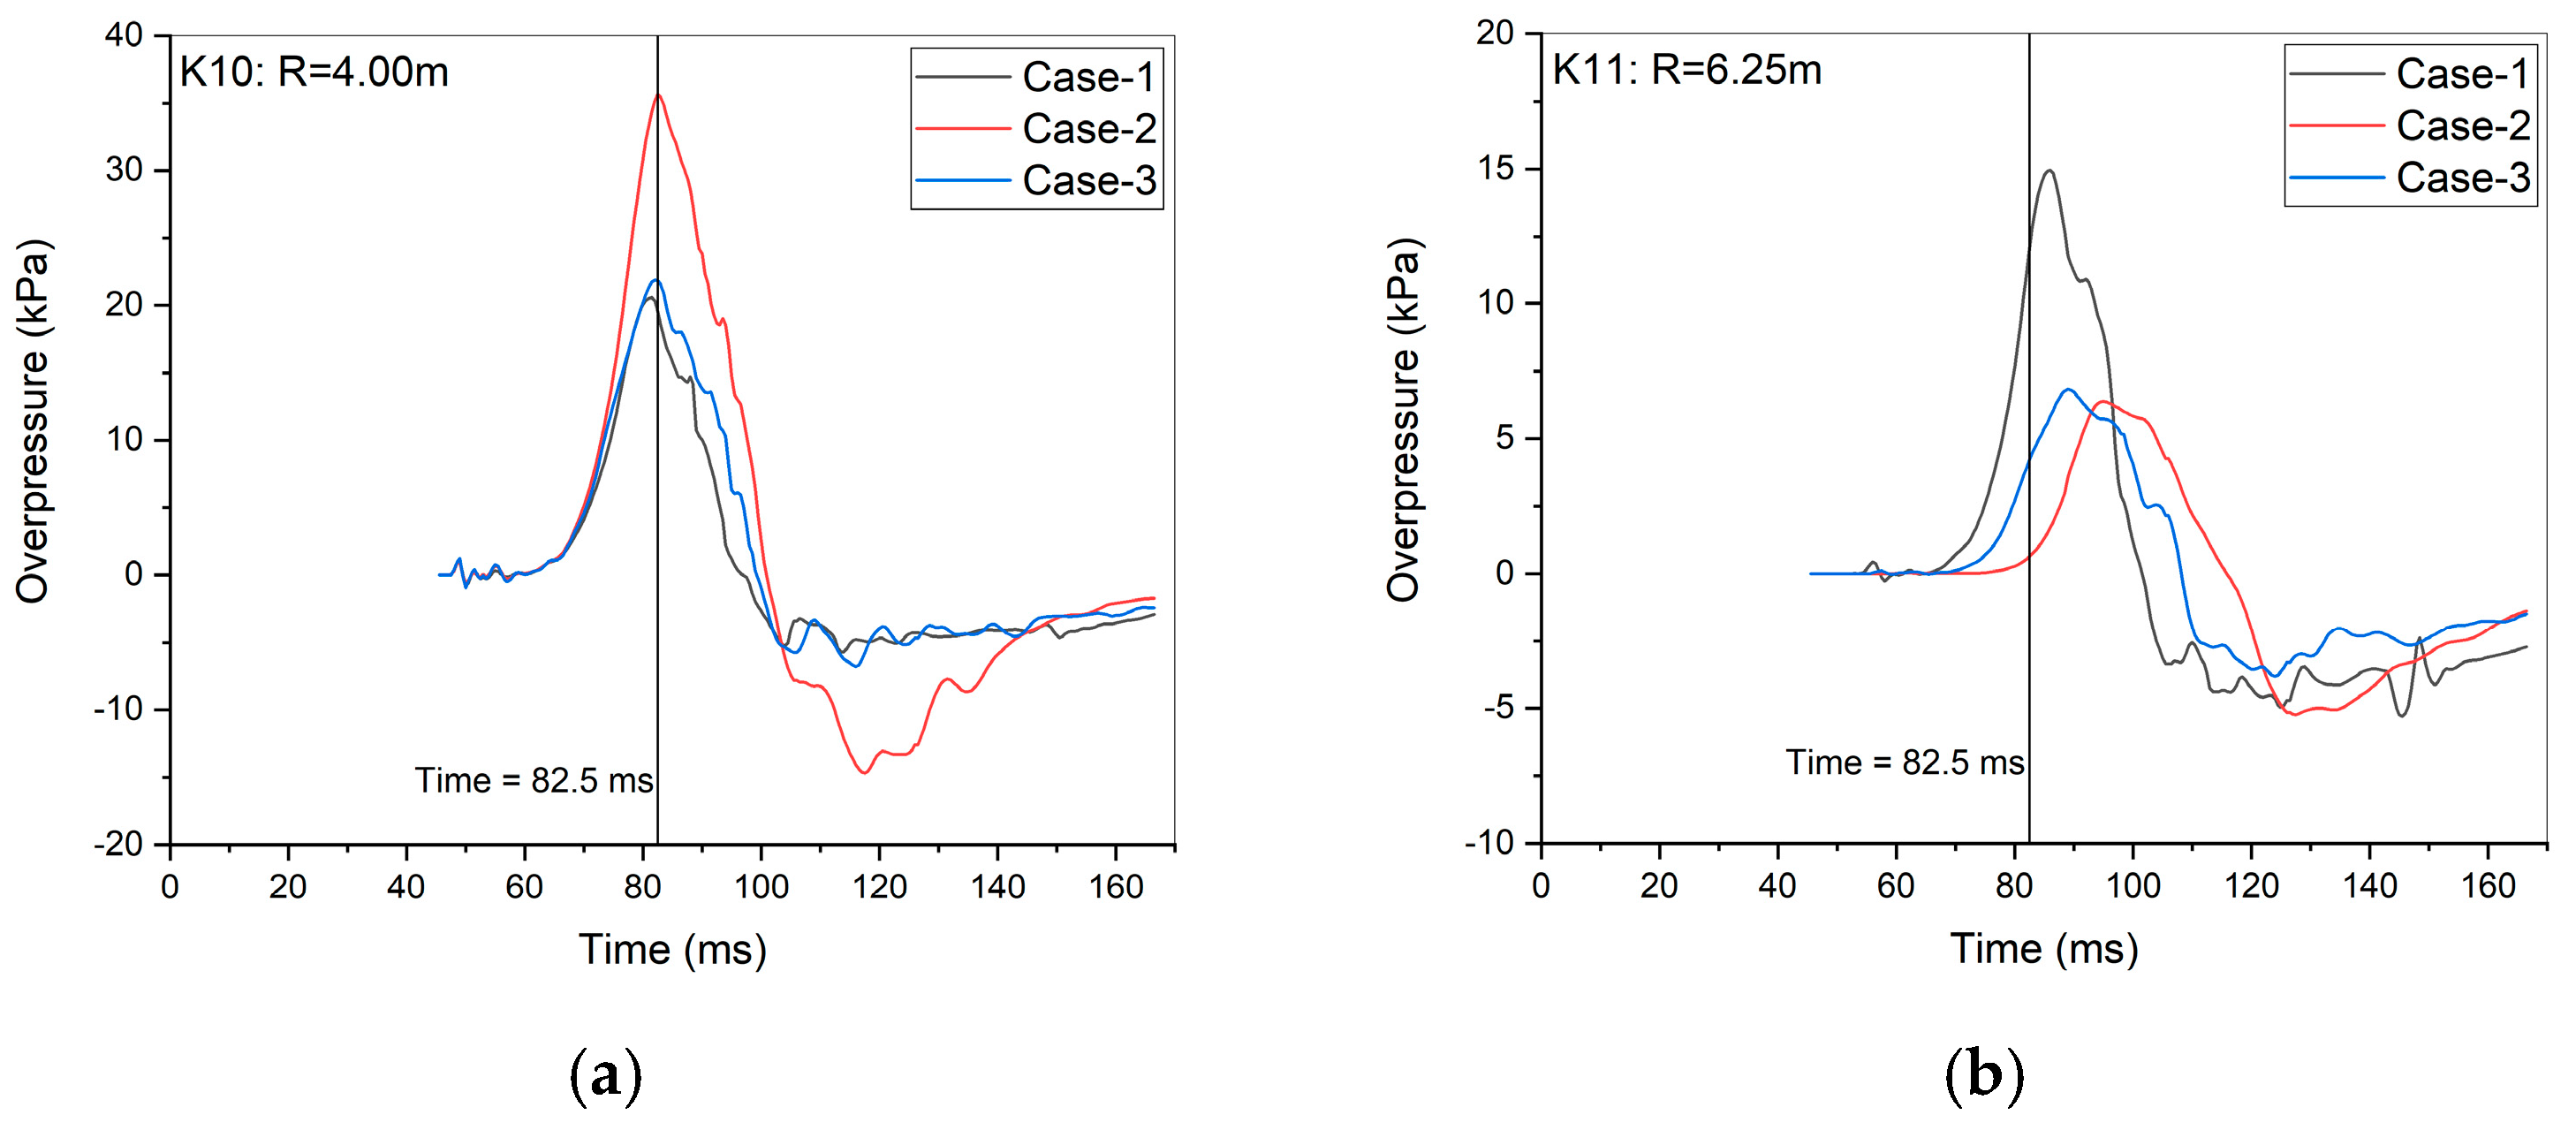
The CFD calculation results of Cases 2 and 3 using the analysis methodology applied during the validation analysis (Case 1) are shown in Figure 10 and Figure 11. According to the pressure distributions around the barriers (Figure 10b,c), the artificially installed barriers block the blast wave as it propagates from the tent region to the air environment and then reflect it to the area of the vehicle and dispenser on the ground (Cases 2 and 3), whereas the blast wave in Case 1 directly propagates to the air environment without disturbing at the barrier location in Cases 2 and 3. As a result of this difference due to the existence of the barrier, the predicted overpressures at location K11 in Cases 2 and 3 are decreased to approximately 6.2 kPa and 6.9 kPa, respectively, from approximately 15 kPa in Case 1 (Figure 11b). This difference in the overpressure reduction value according to the barrier height between Cases 2 and 3 is not high when considering the corresponding height change of 2.1 m. This can be explained by the fact that the pressure wave as it propagates under the barrier height can arrive at location K11 after bypassing the side wall of the barrier (Figure 10c) because the pressure wave tends to propagate according to the local pressure difference in the air.
In the rear region of the barrier, the calculated overpressures at location K10 in Cases 2 and 3 are increased to approximately 35 kPa and 22 kPa, respectively, from approximately 20 kPa in Case 1 due to the reflected pressure wave from the barrier. However, the difference in the overpressures between Cases 1 and 3 is smaller than that in Cases 1 and 2. This may be an effect of the reflected pressure wave from the barrier’s height of 2.1 m (Case 3) at location K10 with its height of 1.25 m, which is not affected significantly compared to when the barrier height is 4.2 m (Case 2). In addition, it was not found in Case 2 that the effect of the pressure wave bypass considerably occurred at location K11 in Case 3. Thus, we can confirm that the prevention effect by the barrier is reasonably well predicted by the radXiFoam v2.0 code on the basis of the compared results of the overpressures between Cases 1 to 3 and previous validation results using the SRI’s hydrogen explosion test with a barrier [6,10].

5. Conclusions

We developed the radXiFoam v2.0 code by modifying C++ codes in the libraries and governing equations of the XiFoam solver in the open-source CFD software OpenFOAM-v2112 to evaluate the safety of HRSs to be constructed around protected facilities in a large city in the Republic of Korea. To determine the uncertainty in the radXiFoam solver’s predictions of the overpressure buildup due to flame acceleration in an obstacle geometry configuration in a HRS, we conducted a validation analysis of the measured datasets compiled during a hydrogen-air cloud explosion test at a HRS mock-up facility performed by Shell Hydrogen B.V.
We also conducted a CFD sensitivity calculation with an installation of a barrier at a horizontal distance of 2.3 m from the VCE region in the grid model used for the validation analysis to assess the effect of a barrier existence with height variations of 2.1 m to 4.2 m during the reduction of the peak overpressure in the blast wave on the basis of the predicted error range of approximately ±30% obtained from the validation analysis. From these calculations, we judged that the radXiFoam v2.0 code can accurately simulate the effect of such a barrier during a VCE at a HRS because the calculated overpressure reductions due to the artificially installed barrier are reasonable on the basis of previous validation analysis results from an SRI explosion test with a barrier installed. Therefore, we can predict that the radXiFoam v2.0 code will be feasible for use by those in charge of evaluating the safety of HRSs when the installation of a barrier is required to meet KGS technical standards referring to the separation distance between a HRS and the surrounding protective facilities in a large city in the Republic of Korea.

6. Future Studies

The radXiFoam v2.0 code will be additionally validated against VCE tests with the installation of various barriers using a hydrogen–air mixture volume of 40 m3, as conducted by KGS in December 2023, before releasing this code to safety engineers of HRSs by KGS. To simplify the creation of the input files for the calculation of the radXiFoam v2.0 code, we will develop an Excel program, LibreOffice v6.4.7.2, based on the Visual Basic language.

Author Contributions

Conceptualization, C.-H.Y.; methodology, H.-S.K.; software, H.-S.K. and K.-S.C.; validation, H.-S.K. and K.-S.C.; formal analysis, H.-S.K.; investigation, H.-S.K. and H.-W.L.; resources, H.-S.K. and H.-W.L.; data curation, H.-S.K. and K.-S.C.; writing—original draft preparation, H.-S.K.; writing—review and editing, H.-S.K.; visualization, H.-S.K.; supervision, H.-S.K.; project administration, H.-W.L.; funding acquisition, C.-H.Y. All authors have read and agreed to the published version of the manuscript.

Funding

This work was supported by a grant from the Korea Institute of Energy Technology Evaluation and Planning (KETEP) funded by the Korean government (Ministry of Trade, Industry and Energy) (No. 20215810100020 and No. RS-2024-00432233).

Data Availability Statement

Research data will be provided through the official website that will be operated by KGS and Dahan Tech Inc. after the completion of the research project.

Conflicts of Interest

Authors Hyun-Woo Lee, and Chul-Hee Yu was employed by the Korea Gas Safety Corporation. The remaining authors declare that the research was conducted in the absence of any commercial or financial relationships that could be construed as a potential conflict of interest.

Nomenclature

VariableDefinitionUnit
awvAbsorption coefficient of water vapor[−]
bReaction progress variable[−]
EEmission contribution [−]
ftFuel mixture fraction[−]
GRadiation intensity [W/m2]
hEnthalpy[J/kg]
KThermal conductivity [W/m·K]
kwvAbsorption coefficient of water vapor depending on the gas temp.[−]
pPressure [Pa]
qHeat flux [W/m2]
SiSource/Sink of species-i [kg/m2·s]
SuLaminar flame speed [m/s]
SctTurbulent Schmidt number [−]
TTemperature [K]
UVelocity [m/s]
YiSpecies-i mass fraction [−]
μtTurbulence effective viscosity [kg/m·s]
ρDensity [kg/m3]
σSBStefan-Boltzmann constant [W/m2·K4]
φFuel equivalent ratio [−]
Subscripts
effEffective
oReference condition
uUnburned
wvWater vapor

References

  1. Kim, K.S. Development of Design Technology and Safety Standard in the Protection Wall for Blast Mitigations in a Hydrogen Station; Research Plan Report, No. 20215810100020; Korea Gas Safety Corporation: Eumseong, Republic of Korea, 2021. [Google Scholar]
  2. Chuncheon District Prosecutors’ Office, Gangneung Branch. Investigation Results for the Hydrogen Tank Explosion in Gangwon Techno Park; Press Release Report; Chuncheon District Prosecutors’ Office, Gangneung Branch: Gangneung, Republic of Korea, 2019. [Google Scholar]
  3. Lee, Y.C. Powerful explosion, directed fragments into nearby building. MBC News, 24 September 2019. [Google Scholar]
  4. KGS FP216; Facility/Technical/Inspection Code for Fuel Vehicles Refueling by Type of On-Site Hydrogen Production. Korea Gas Safety Corporation: Eumseong, Republic of Korea, 2020.
  5. KGS FP217; Facility/Technical/Inspection Code for Fuel Vehicles Refueling by Type of Compressed Hydrogen Delivery. Korea Gas Safety Corporation: Eumseong, Republic of Korea, 2020.
  6. Kang, H.-S.; Hwang, J.-W.; Yu, C.-H. A database extension for a safety evaluation of a hydrogen refueling station with a barrier using a CFD analysis and a machine learning method. Processes 2023, 11, 3025. [Google Scholar] [CrossRef]
  7. Kwon, D.; Choi, S.K.; Yu, C. Improved Safety by Crossanalyzing quantitative risk assessment of hydrogen refueling stations. Int. J. Hydrogen Energy 2022, 47, 10788–10798. [Google Scholar] [CrossRef]
  8. OpenCFD Ltd. OpenFOAM-v2112 User Guide; Technical Report; ESI: Rungis, France, 2021; Available online: https://www.openfoam.com (accessed on 6 August 2024).
  9. CFD Direct Ltd. Notes on Computational Fluid Dynamics: General Principles; CFD Direct Ltd.: Reading, UK, 2024; Available online: https://doc.cfd.direct/notes/cfd-general-principles (accessed on 6 August 2024).
  10. Kang, H.-S.; Kim, S.-M.; Kim, J. Safety issues of a hydrogen refueling station and a prediction for an overpressure reduction by a barrier using OpenFOAM software for an SRI explosion test in an open space. Energies 2022, 15, 7556. [Google Scholar] [CrossRef]
  11. Myilsamy, D.; Oh, C.-B. Computational study of a high-pressure hydrogen storage tank explosion at different heights from the ground. Int. J. Hydrogen Energy 2024, 50, 1245–1260. [Google Scholar] [CrossRef]
  12. KOSHA P-31-2001; Predictive Methods for Accident Damage. Korea Occupational Safety and Health Agency: Ulsan, Republic of Korea, 2001.
  13. NRC RG 1.91; Evaluations of Explosion Postulated to Occur at Nearby Facilities and on Transportation Routes Near Nuclear Power Plants. Nuclear Regulatory Commission: Rockville, MD, USA, 2021.
  14. Shen, R.; Jiao, Z.; Parker, T.; Sun, Y.; Wang, Q. Recent application of computational fluid dynamics (CFD) in process safety and loss prevention: A review. J. Loss Prev. Process Ind. 2020, 67, 104252. [Google Scholar] [CrossRef]
  15. Kim, S.M.; Kang, H.S.; Choi, K.S. radXiFoam v1.0; VCE Solver; KAERI: Daejeon, Republic of Korea; Available online: https://github.com/ksm0226/radXiFoam (accessed on 6 August 2024).
  16. Groethe, M.A.; Colton, J.D. FY01 Annual Report on Hydrogen Safety in the World Energy Network; Technical Report; SRI: Menlo Park, CA, USA, 2002. [Google Scholar]
  17. Groethe, M.A. FY02 Annual Report on Hydrogen Safety in the World Energy Network; Technical Report; SRI: Menlo Park, CA, USA, 2002. [Google Scholar]
  18. Kang, H.S.; Choi, K.-S. Report-I for Creating a Database of an Explosion Accident in a Liquefied Hydrogen Refueling Station; Technical Report; KAERI: Daejeon, Republic of Korea, 2023. [Google Scholar]
  19. Shirvill, L.C.; Roberts, T.A.; Royle, M.; Willoughby, D.B.; Gautier, T. Safety studies on high-pressure hydrogen vehicle refueling stations: Releases into a simulated high-pressure dispensing area. Int. J. Hydrogen Energy 2012, 37, 6949–6964. [Google Scholar] [CrossRef]
  20. Shirvill, L.C.; Royle, M.; Roberts, T.A. Hydrogen releases ignited in a simulated vehicle refueling environment. In Proceedings of the 2nd International Conference on Hydrogen Safety, San Sebastian, Spain, 11–13 September 2007. [Google Scholar]
  21. Turns, S.R. An Introduction to Combustion, 2nd ed.; McGraw-Hill, Inc.: Singapore, 2000. [Google Scholar]
  22. Kuo, K.K. Principles of Combustion, 2nd ed.; John Wiley & Sons, Inc.: Hoboken, NJ, USA, 2005. [Google Scholar]
  23. Kim, S.; Kim, J. Effect of radiation model on simulation of water vapor—Hydrogen premixed flame using flamelet combustion model in OpenFOAM. Nucl. Eng. Tech. 2022, 54, 1321–1335. [Google Scholar] [CrossRef]
  24. Modest, M.F. Radiative Heat Transfer, International Editions; McGraw-Hill, Inc.: Singapore, 1993. [Google Scholar]
  25. Mossi, A.; Galarca, M.M.; Brittes, R.; Vielmo, H.A.; Franca, F.H.R. Comparison of spectral models in the computation of radiative heat transfer in participating media composed of gases and soot. ABCM J. 2012, 34, 112–119. [Google Scholar] [CrossRef]
  26. Metghalchi, M.; Keck, J.C. Burning velocities of mixtures of air with methanol, isooctane, and indolence at high pressure and temperature. Combust. Flame 1982, 48, 191–210. [Google Scholar] [CrossRef]
  27. HP Development Company. High-performance Computing Power from Anywhere. Available online: https://hp.com/us-en/workstations/learning-hub/high-performance-computing-power.html (accessed on 6 August 2024).
  28. Kang, H.S.; Kim, J.; Hong, S.W.; Kim, S.B. Numerical Analysis for Hydrogen Flame Acceleration during a Severe Accident in the APR1400 Containment Using a Multi-Dimensional Hydrogen Analysis System. Energies 2020, 13, 6151. [Google Scholar] [CrossRef]
  29. Kang, H.S.; Kim, J.; Hong, S.W. Numerical Analysis for Hydrogen Flame Acceleration during a Severe Accident Initiated by SBLOCA in the APR1400 Containment. Hydrogen 2022, 3, 28–42. [Google Scholar] [CrossRef]
  30. Kitware Inc. ParaView-v5.11 User Guide; Technical Report; Kitware Inc.: New York, NY, USA, 2023; Available online: https://www.paraview.org (accessed on 6 August 2024).
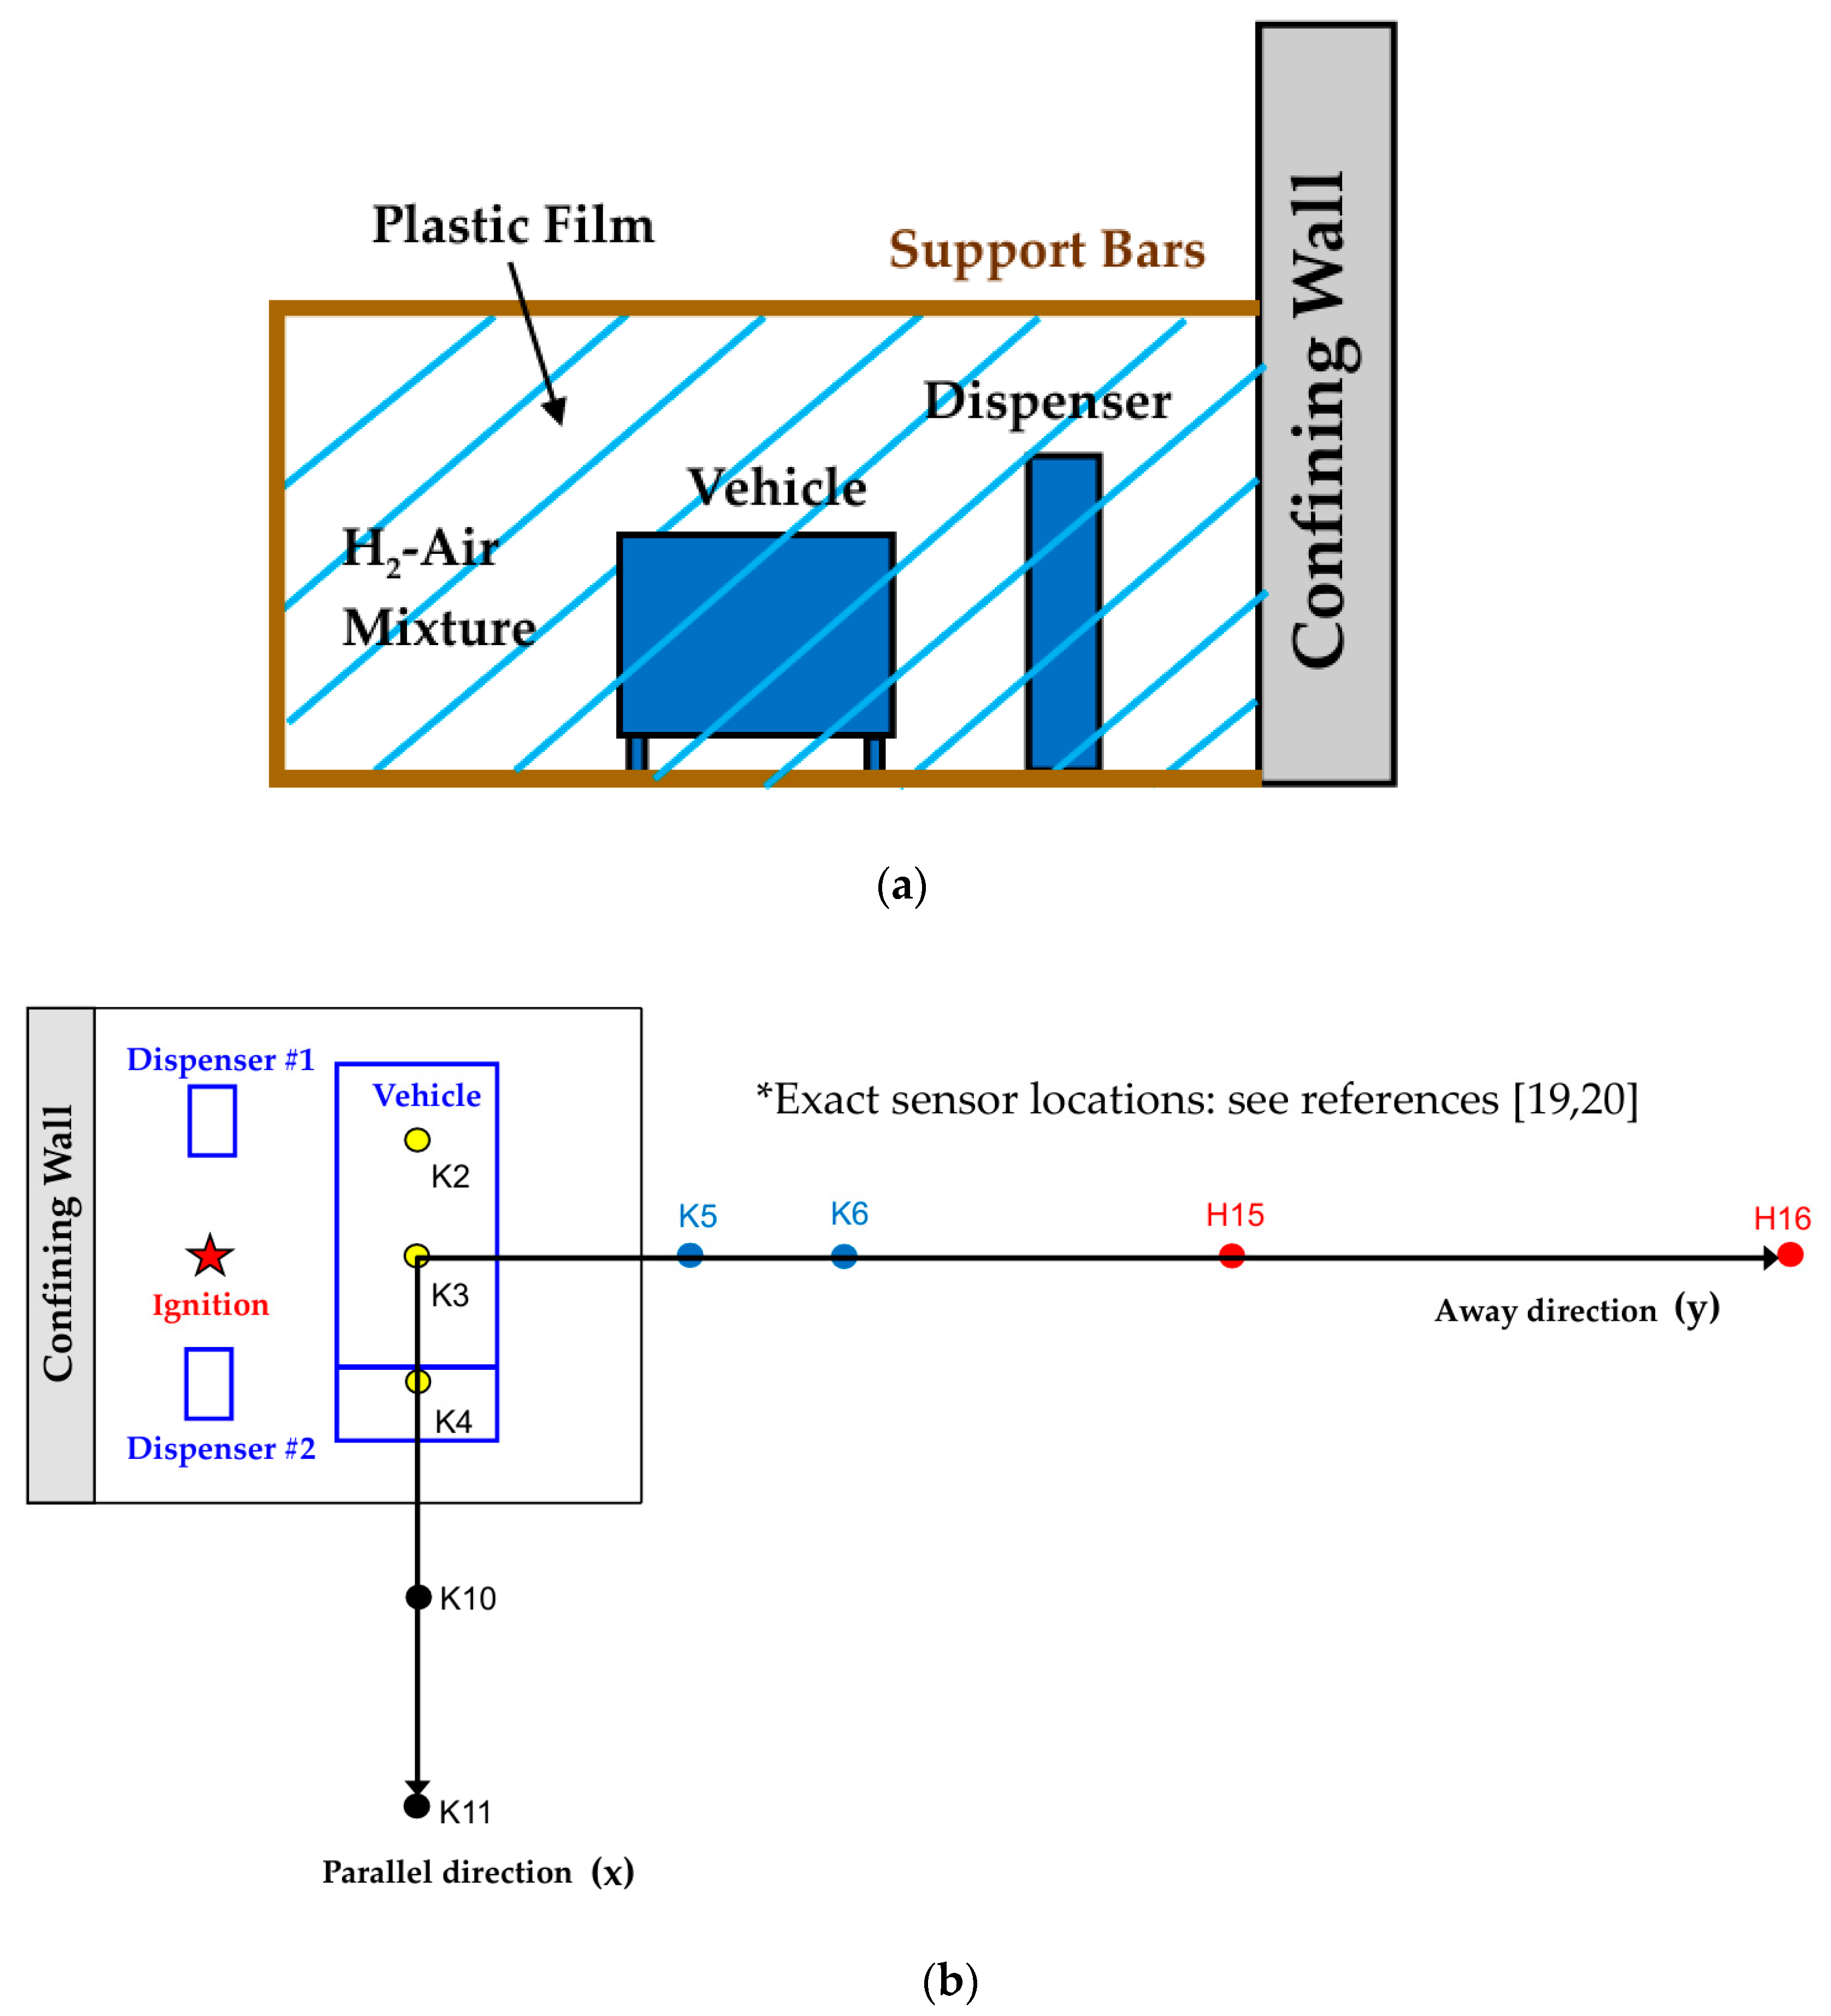
Figure 1. Schematic diagram of HRS mock-up facility: (a) side view of the tent region including the vehicle and dispensers; (b) top view with the measurement sensor locations.
Processes 12 02173 g001
Figure 2. Measured overpressures and peak overpressures in the HRS mock-up hydrogen-air explosion test [19,20]: (a) parallel direction along the confining wall; (b) away direction from the confining wall.
Processes 12 02173 g002
Figure 3. Calculation procedure of the radXiFoam v2.0 code. (Please check the quality).
Processes 12 02173 g003
Figure 4. Grid model, boundary condition, and initial condition for the simulation of the HRS mock-up facility: (a) Geometric model and boundary conditions; (b) Mesh distribution around the tent region; (c) Initial condition of the hydrogen (ft) mass fraction.
Processes 12 02173 g004aProcesses 12 02173 g004b
Figure 5. Temperature distribution over time (front view): (a) t = 46 ms; (b) t = 55 ms; (c) t = 65 ms; (d) t = 85 ms; (e) t = 105 ms; (f) t = 125 ms.
Processes 12 02173 g005aProcesses 12 02173 g005b
Figure 6. Velocity and pressure distribution around the vehicle and the dispenser over time (front view): (a) pressure; (b) velocity magnitude.
Processes 12 02173 g006
Figure 7. Pressure distribution on symmetry and wall planes: (a) t = 55 ms; (b) t = 65 ms; (c) t = 85 ms; (d) t = 105 ms; (e) t = 125 ms; (f) t = 145 ms.
Processes 12 02173 g007aProcesses 12 02173 g007b
Figure 8. Comparison of the overpressures in the test data and the CFD results: (a) parallel direction along the confining wall; (b) direction away from the confining wall; (c) error range of the peak overpressure prediction from the tent region to the air environment.
Processes 12 02173 g008
Figure 9. Grid model with the installation of a barrier wall for Cases 2 and 3.
Processes 12 02173 g009
Figure 10. Pressure distribution on planes around the barrier depending on the case: (a) t = 85.4 ms (Case–1); (b) t = 85.4 ms (Case–2); (c) t = 85.4 ms (Case–3); A (Pressure wave propagating to the barrier from the tent region); B (Reflected pressure wave propagating to the area of the vehicle and dispenser); C (Pressure wave propagating to the K11 location after bypassing the barrier side wall).
Processes 12 02173 g010aProcesses 12 02173 g010b
Figure 11. Comparison of overpressures at local positions between Cases 1, 2, and 3: (a) K10 (1 m behind the barrier); (b) K11 (1.25 m front of the barrier).
Processes 12 02173 g011
Table 1. Conditions of the HRS mock-up hydrogen-air explosion test.
Total
Tent Vol.
(m3)
Mixture Free Vol. (m3)Partial
H2 Pressure
Equivalence Ratio of
Mixture
Relative
Humidity
(%)
Ignition
Method
Mixture
Temp. (K)
81.070.160.30881.0942.1Electric spark302.05
Table 2. Pressure sensor locations in the HRS mock-up facility.
Tent Region
(Top View)
SensorDistance from Ignition Point (m)Location (m)
xyz
Processes 12 02173 i001K32.4102.150.15
K42.841.52.150.15
K55.2005.21.25
K67.0007.01.25
K104.004.02.151.25
K116.256.252.151.25
H1516.20016.21.5
H1632.27032.23.5
* Ignition point-001.25
Table 3. Specifications of the computing system for the radXiFoam calculations.
CPUParallel
Computation Core
MemoryOperating
System
Intel Core i9-13900K2464 GB (32 GB × 2) Ubuntu 20.04.6 LTS
Table 4. Analysis methodology for the HRS mock-up hydrogen-air explosion test.
ParameterModels
● Open-source softwareradXiFoam v2.0 based on OpenFOAM-v2112
● Thermal–hydraulic solver algorithmPIMPLE [8]
● Combustion modelFlamelet progress variable
● Turbulence model k-ω SST
● Wall functionkqR/omega
● CFL number<0.9
● Time step sizeApproximately 1.0 × 10⁻⁷ s to 1.0 × 10⁻⁴ s
● Mesh typeHexahedral
● Mesh size at the far field~25 cm
● Ignition modelHot-spot spherical region model [28,29]
Table 5. Installed barrier dimension in the grid models for Cases–1 to 3.
Case No.Barrier
Height (m)/Width (m)/Thickness (m)/R (m)
Number of Cells
(Grid Model)
Case–1-30,432,390
Case–24.2/6.0/0.2/5.029,569,168
Case–32.1/6.0/0.2/5.029,586,556
Range (m): horizontal x-distance from the ignition point.
Disclaimer/Publisher’s Note: The statements, opinions and data contained in all publications are solely those of the individual author(s) and contributor(s) and not of MDPI and/or the editor(s). MDPI and/or the editor(s) disclaim responsibility for any injury to people or property resulting from any ideas, methods, instructions or products referred to in the content.