Abstract
The main method used to exploit unconventional oil and gas reservoirs involves multi-cluster perforation combined with hydraulic fracturing in horizontal wells. However, as the use of this technology has expanded, challenges like reduced perforation efficiency and elevated fracture initiation pressure have surfaced. The depth-controlled oriented perforation technique helps achieve uniform fracture initiation, enhance efficiency, and lower initiation pressure. In this study, a hydraulic fracturing fluid–solid coupling model at the perforation scale was established using the 3D lattice method to compare the near-wellbore fracture morphologies of depth-controlled oriented perforation, spiral perforation, and oriented perforation. Additionally, this study analyzes the effects of injection rate, reservoir elastic modulus, and horizontal stress difference on the fracture morphology and initiation pressure of depth-controlled oriented perforation. This study clarifies the applicability of depth-controlled oriented perforation in different types of reservoirs for the first time. The results indicate that intermediate fractures between spiral and oriented perforations are hindered, while depth-controlled oriented perforation ensures uniform fracture initiation. In the injection rate range of 0.144 to 0.360 L/min, an increase in injection rate accelerates the rise of fluid pressure within the perforations, leading to an increase in fracture initiation pressure. Therefore, excessively high injection rates are unfavorable for fracture initiation. Through depth-controlled oriented perforation, long and singular fractures can be formed in reservoirs with significant horizontal stress differences and high elastic moduli.
1. Introduction
Given the low porosity and permeability inherent in unconventional oil and gas reservoirs, commercial development primarily relies on the technique of multi-cluster perforation and fracturing in horizontal wells [1,2,3]. However, the geological conditions of unconventional reservoirs are complex, with deep burial and high strength, leading to challenges such as low perforation initiation efficiency and high fracture initiation pressure. For example, research conducted by Zhang et al. revealed that the HY-A1 well in the East China Sea exhibits abnormally high temperatures and pressures. The predicted fracture initiation pressure from the fracturing design differed from the actual conditions during operations, with the fracture initiation pressure reaching nearly 80 MPa [4,5]. Therefore, innovation and improvement in perforation technology are still necessary.
Research on the initiation mechanisms of hydraulic fractures around perforation tunnels typically involves laboratory experiments, theoretical derivation, and numerical simulations. In laboratory experiments, researchers [6,7] often use true triaxial hydraulic fracturing equipment to replicate reservoir stress conditions and analyze the effects of perforation parameters and reservoir properties on hydraulic fracture initiation. However, these experiments are not only costly but are also affected by boundary effects, which can influence the results.
In the derivation of the fracture initiation pressure calculation formula for perforated completions, both domestic and international scholars have primarily based their work on M.M. Hossain’s [8] model of stress field distribution around inclined wellbores. This model has been further refined to calculate the stress at perforation sites in homogeneous formations, thereby enabling the prediction of fracture initiation pressure. Jin [9] and Zhao [10] have developed a model for calculating perforation breakdown pressure specifically for fracture-type reservoirs. These research findings are mainly applicable to simple perforation conditions and reservoir scenarios.
For more complex reservoir conditions, scholars utilize numerical simulation methods [11] to analyze the initiation and propagation patterns of hydraulic fractures in perforated wells. Existing methods for simulating hydraulic fracture initiation include traditional finite element methods (FEMs) [12], extended finite element methods (XFEMs), and discrete element methods (DEMs). Scholars [13,14] using FEM have analyzed the stress conditions around perforations under different perforation parameters. The results indicate that the closer the perforations are to each other, the lower the initiation pressure. They also clarify the influence of perforation azimuth and phase angles on fracture initiation pressure. However, traditional FEMs require remeshing to simulate the actual fracture initiation process, which reduces computational efficiency. XFEMs, which overcome the limitations of traditional FEMs, have been developed and are independent of mesh when describing discontinuous fields, allowing for the calculation of dynamic fracture initiation and propagation in formations.
Researchers [15,16,17] have used XFEM to analyze the initiation and propagation trajectories of fractures under varying differential stress conditions in 2D planes. Regarding the initiation pressure calculations for spiral perforation fractures in a 3D space, Ferguson [18] proposed the “3D advanced near-wellbore coupled flow-geomechanical model” to analyze fracture initiation in scenarios where the casing is eccentrically positioned within the wellbore. Building on this foundation, Shan [19,20] utilized the “death and birth element” approach to investigate how perforation parameters influence fracture flatness. The results showed that a combination of high perforation density, small perforation phase, and large perforation diameter is beneficial for forming straight fractures around the wellbore.
In recent years, the discrete element method has gradually been applied in the field of hydraulic fracturing numerical simulation. For instance, Peng et al. [21] used PFC2D to simulate the perforation-induced fracture initiation process in shale reservoirs under 2D conditions, analyzing the impact of shale bedding angles on fracture propagation. The 3D lattice method simplifies PFC and improves computational efficiency. Zhang [22], Huang [23], and Wang [24] used the Xsite simulator, based on the 3D lattice method, to calculate the effects of the angle between the wellbore and the maximum horizontal principal stress on fracture initiation patterns. In 2023, Li et al. [25] employed the 3D lattice method and proposed the depth-controlled oriented perforation technique by varying the perforation depths within the same cluster, ensuring balanced fracture initiation.
Building on the concept of depth-controlled oriented perforation, this study further calculates fracture initiation morphology and pressures under different operational parameters (such as injection rate) and geological conditions (such as horizontal stress difference and elastic modulus), clarifying the impact of these factors on fracture initiation. The findings not only improve the understanding of fracture initiation mechanisms in depth-controlled oriented perforation but also provide new theoretical foundations and technical guidance for optimizing fracturing parameters under various reservoir conditions, demonstrating significant innovation and practical value.
2. Method
The traditional Particle Flow Code (PFC) models rock as an assembly of rock particles and cementing materials, simulating the mechanical behavior of the rock. The 3D lattice method simplifies this approach by representing rock particles as mass-bearing nodes and the cementing materials between particles as springs that connect two nodes, as illustrated in Figure 1. This simplification enhances the computational efficiency of the 3D lattice method. Fluid nodes are positioned in the middle of the springs, and two connected fluid nodes form a pipe through which fluid flows. Using the Xsite (2.0.77) software to implement the 3D lattice method.
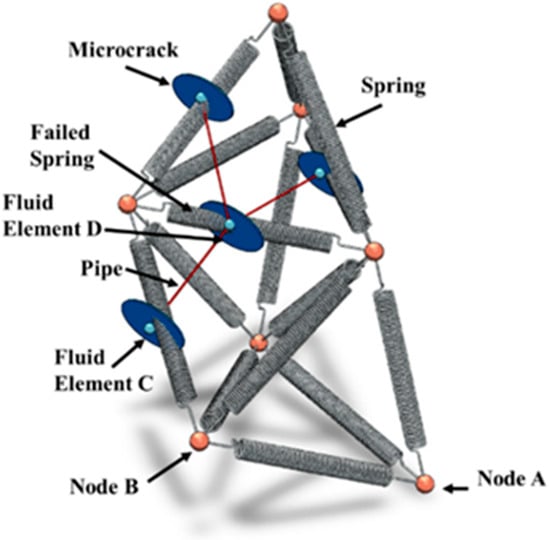
Figure 1.
Three-dimensional lattice model [25].
In this study, the following assumptions were made when simulating the hydraulic fracture propagation during perforation completion:
- The ultra-low permeability reservoir does not consider the leak-off of fracturing fluid;
- The reservoir exhibits isotropic properties;
- The fluid has negligible compressibility.
The 3D lattice method calculates the normal force FN and the tangential force FiS on the springs by computing the displacement and velocity at the nodes. The formulas [23] are as follows:
In the equations [23]:
where “N” represents the normal direction and “S” represents the shear direction. “A” and “B” represent nodes A and B, respectively. F is the force acting on the spring, N; is the velocity of the spring or node at time t, m/s; k is the stiffness of the spring, N/m. When the spring remains intact, the direction of ni follows the particle connection between nodes A and B (as shown in Figure 1). When a joint is present, the direction of ni aligns with the normal to the joint. and are the velocity and position of component i at time, m/s and m (respectively). ∆t is the time step, s. is the resultant force acting on the node at time t, N. m is the mass of the node, kg.
When the normal force on the spring exceeds the maximum tensile strength or the tangential force exceeds the maximum shear strength, the spring undergoes tensile failure or shear failure. Upon failure, a microcrack forms in the spring, and the spring no longer bears normal or tangential forces, meaning FN = 0 and FS = 0. A new fluid element is generated at the location of the newly formed microcrack, which automatically integrates with existing fluid elements to create a new “pipe,” thus updating the fluid network.
The fluid flow within the pipe is calculated using the lubrication equation. The flow rate from fluid element C to fluid element D is determined using Equation (5) [23]:
where C and D represent nodes C and D, respectively. p is the fluid pressure at the node, Pa; z is the elevation of the node, m; a is hydraulic aperture, m; μ is viscosity of the fracturing fluid, Pa·s; s is the saturation, dimensionless; ρw is density of the fracturing fluid, kg/m3; g is the acceleration of gravity, m/s2; and β is the dimensionless coefficient determined by the size of the fluid element and the connectivity of the flow grid, dimensionless.
Equation (5) can be rewritten as follows:
In the equations [23]:
The fluid pressure ∆P change over the flow time step ∆tf is calculated using an explicit scheme:
where ∆P is the increment of fluid pressure, Pa; qi is the injection rate for the pipe connected to the node i, m3/s; V is the volume of fluid element, m3; ∆V is the fluid element volume change due to mechanical deformation, m3; is the apparent fluid bulk modulus, Pa; and ∆tf is the time step, s.
3. Model Verification
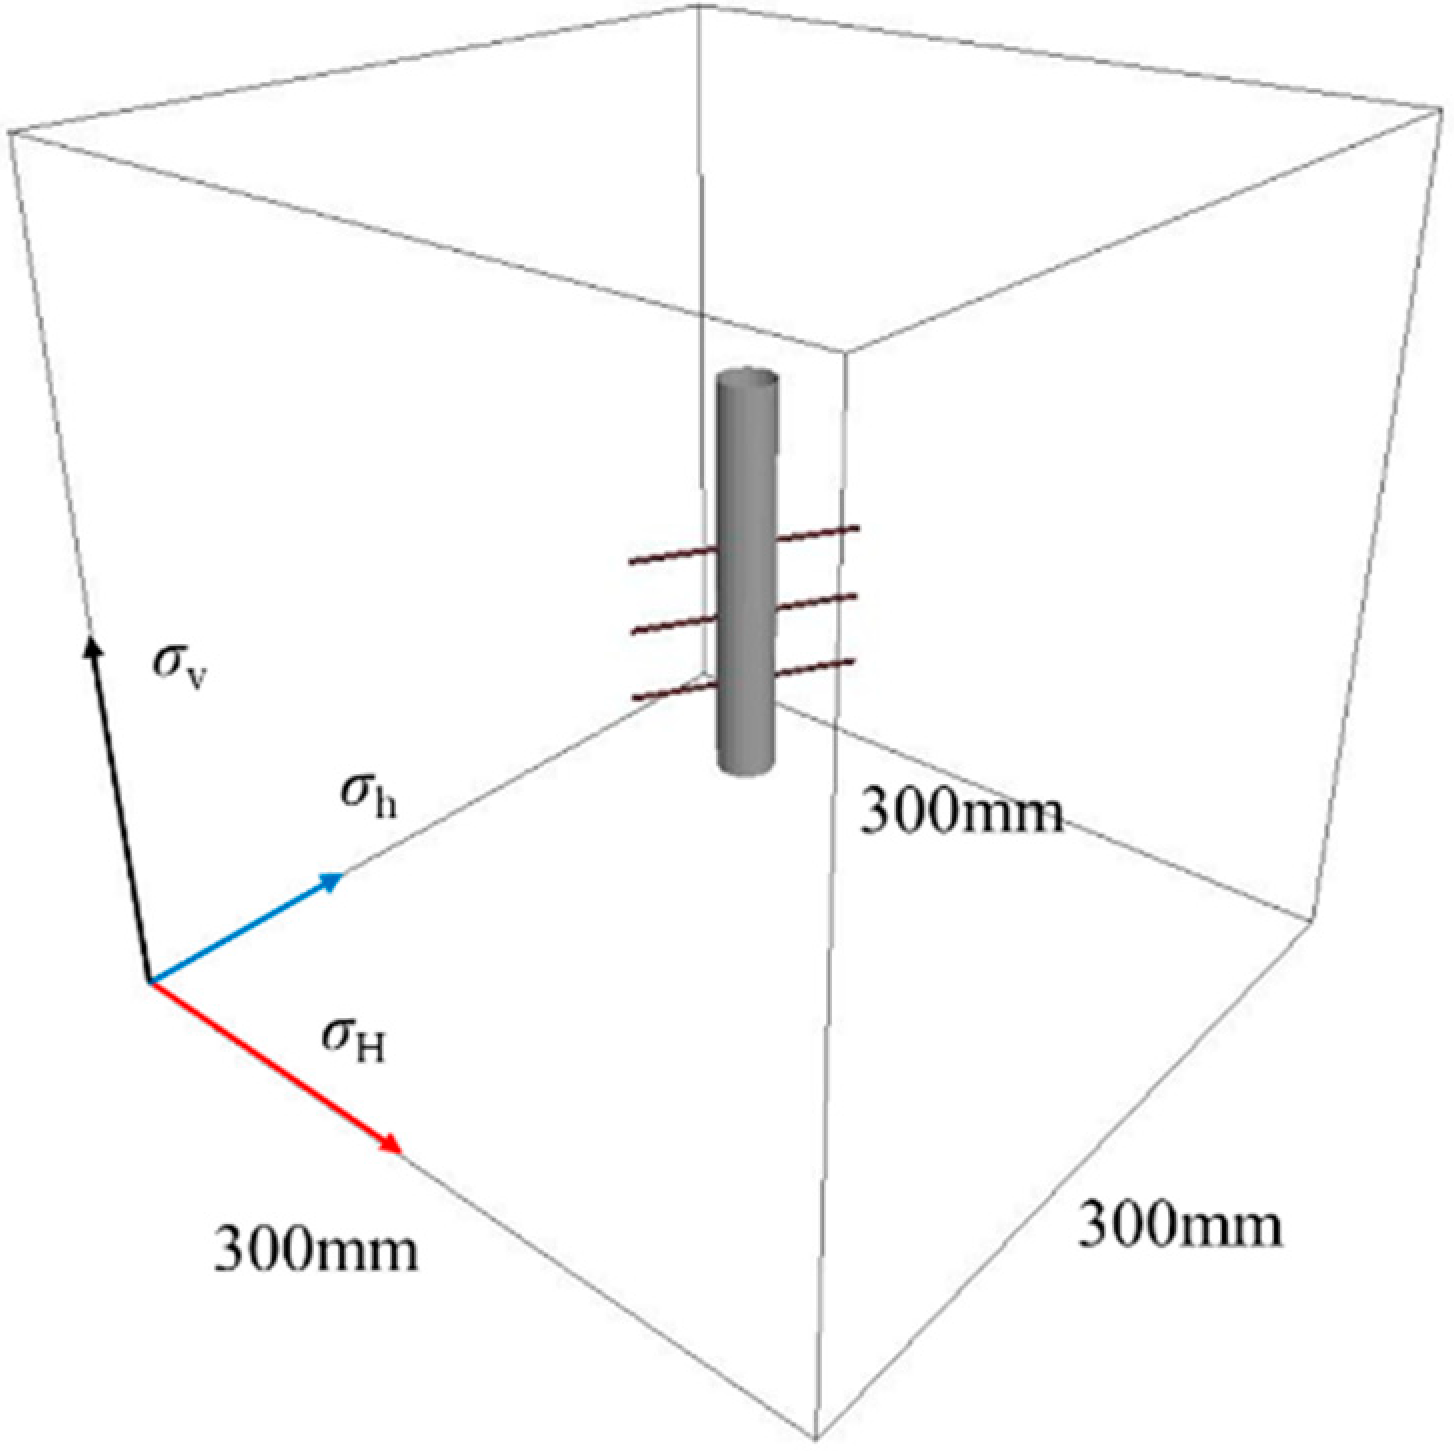
To validate the accuracy of the 3D lattice method in calculating the fracture initiation morphology for perforations, a model was established based on the true triaxial laboratory experiment data from Jiang et al. [26]. The experiment used concrete specimens with dimensions of 300 mm × 300 mm × 300 mm. The wellbore had an outer diameter of 20 mm, an inner diameter of 15 mm, and the perforation hole had a diameter of 2 mm with a length of 30 mm (Figure 2). The angle between the perforation hole axis and the maximum horizontal principal stress was designated as the perforation azimuth, set at 60°. The rock sample has an elastic modulus of 8.402 GPa, a Poisson’s ratio of 0.23, a uniaxial compressive strength of 28.34 MPa, and a tensile strength of 2.59 MPa.
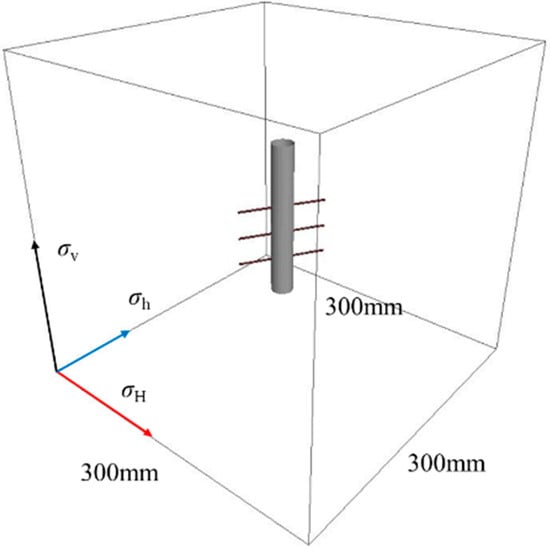
Figure 2.
True triaxial hydraulic fracturing experiment model.
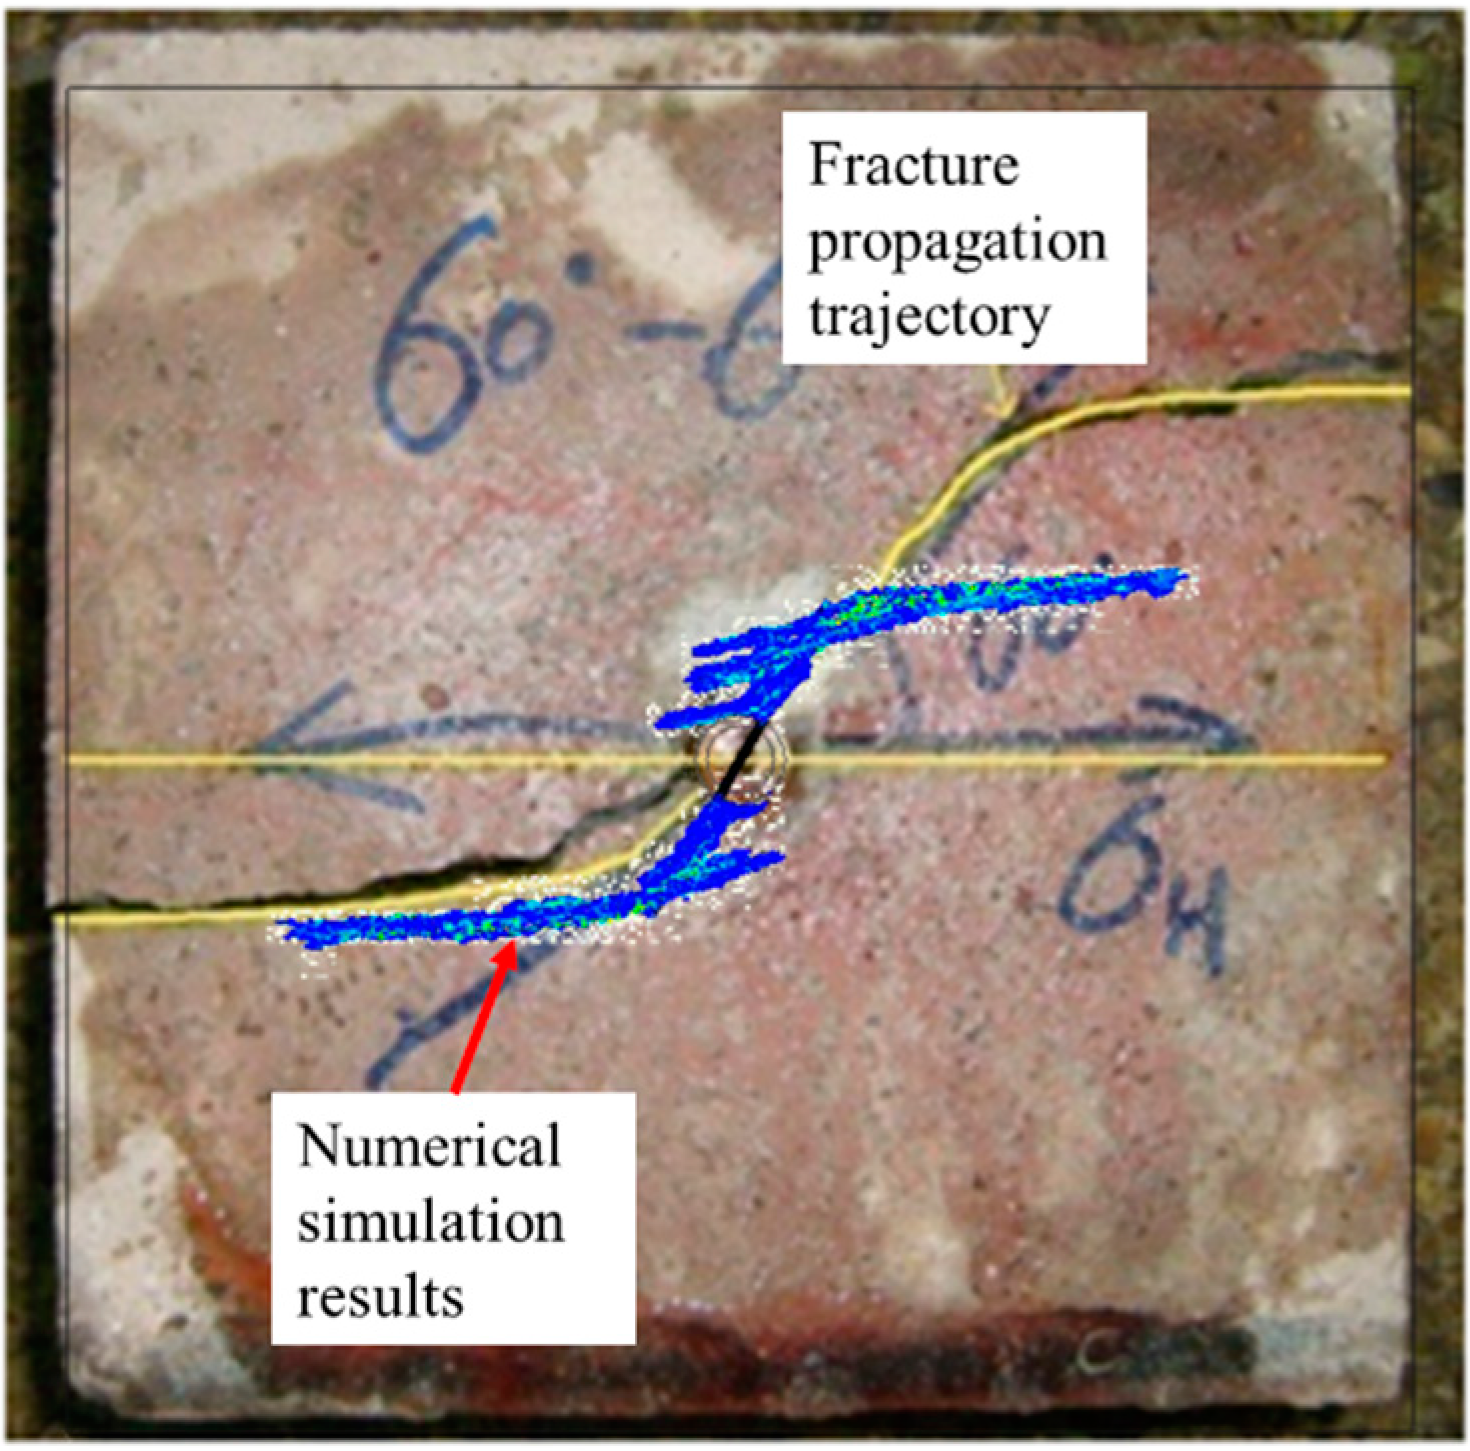
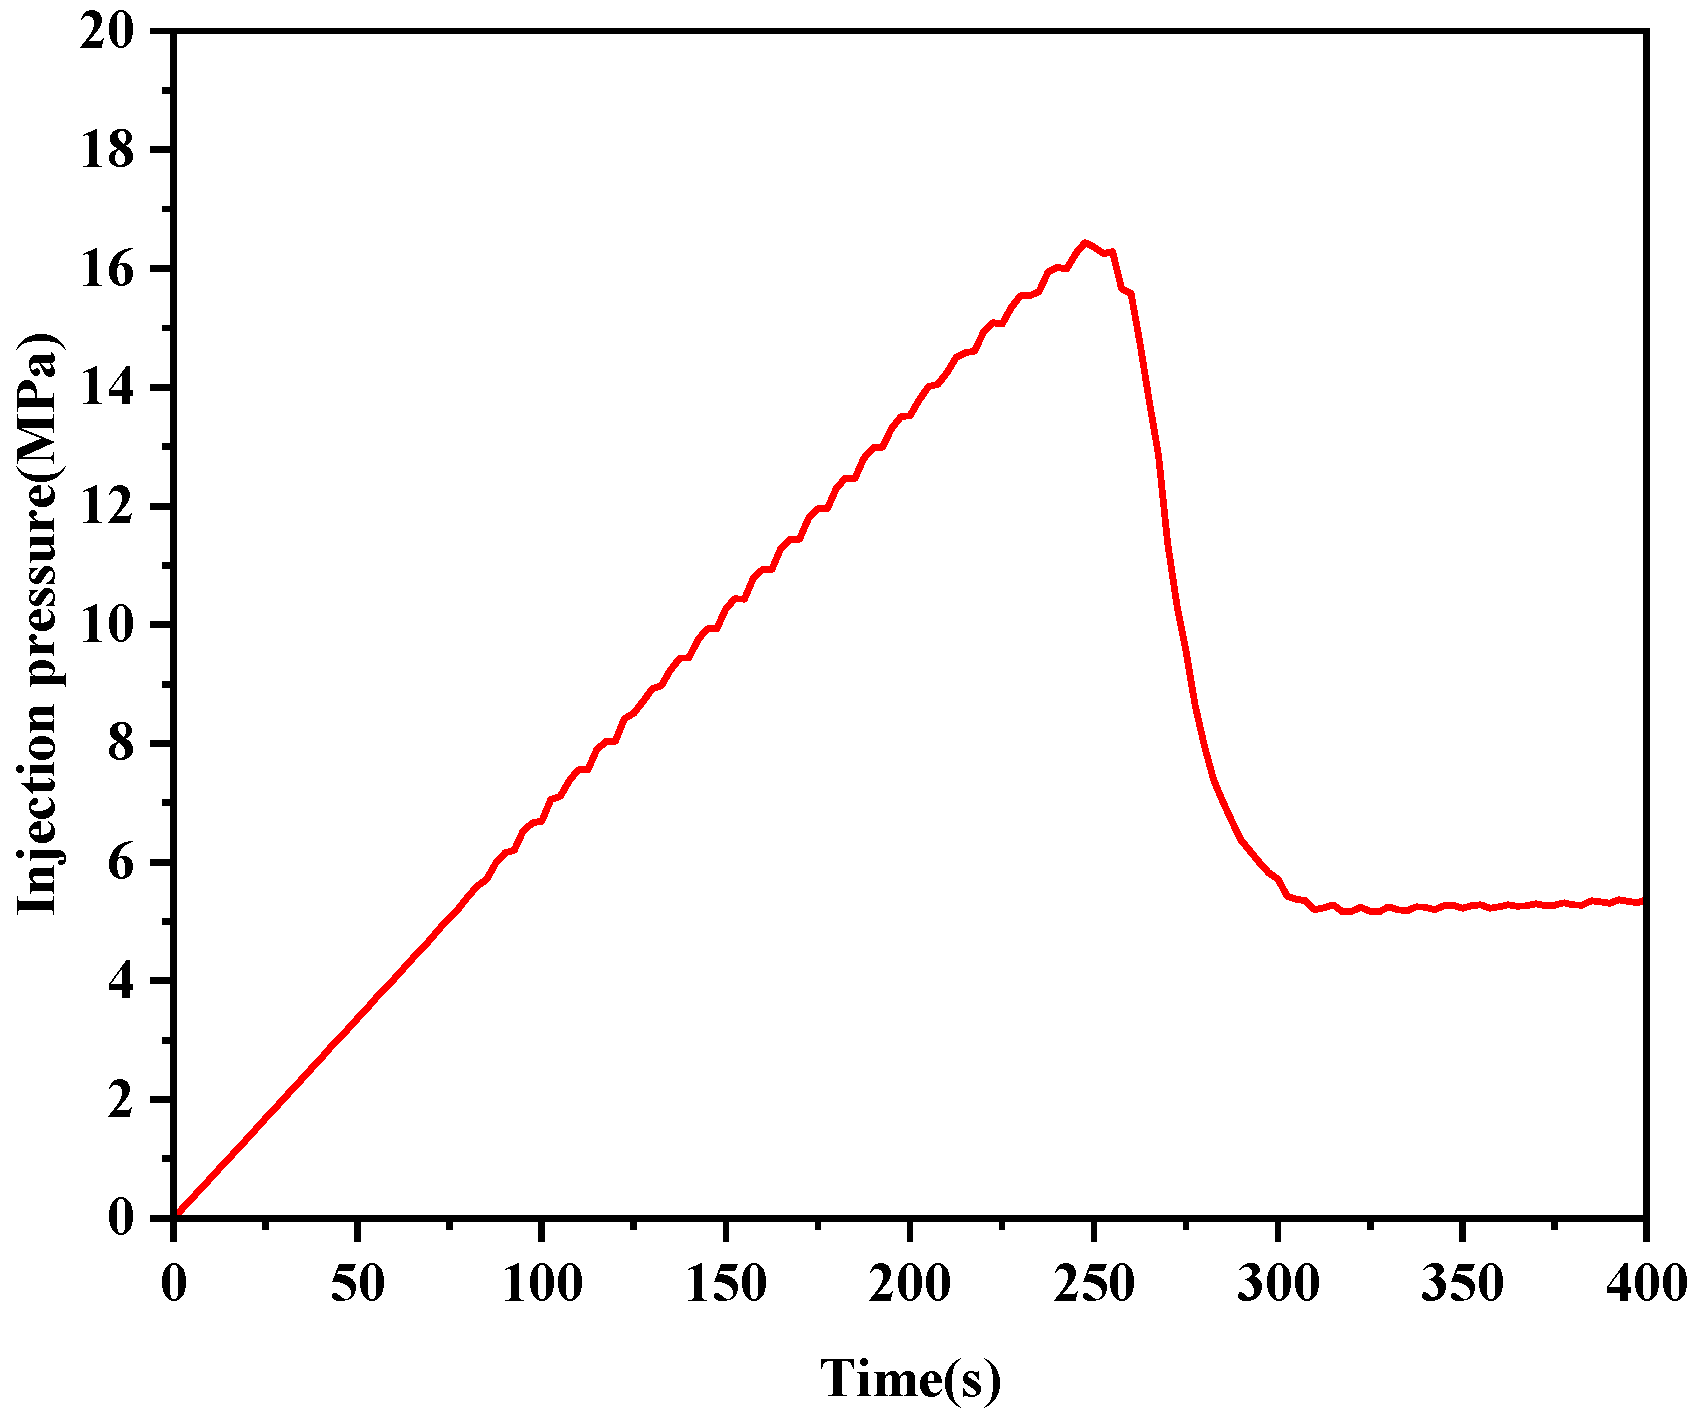
Due to the heterogeneity of the synthetic rock specimen, the deviation angles of the fractures on both sides are not entirely consistent. From the comparison of the experimental fracture propagation trajectory and the numerical simulation results shown in Figure 3, it can be seen that the 3D lattice method closely aligns with the experimental results in terms of fracture initiation and propagation morphology. Regarding the initiation pressure, the experimental initiation pressure was 15.55 MPa, while the numerical calculation resulted in an initiation pressure of 16.43 MPa (Figure 4), with a difference of 5.71%, which meets engineering requirements.
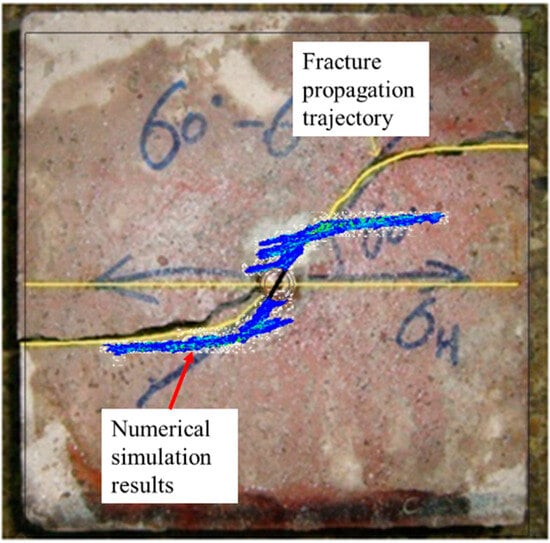
Figure 3.
Comparison of experimental fracture propagation trajectory with numerical simulation results.

Figure 4.
Numerical calculation results of injection pressure.
4. Influence of Perforation Schemes on Fracture Initiation
4.1. Numerical Model
In their research, Fu et al. [27] demonstrated that increasing perforation depth can effectively reduce the fracture initiation pressure. Therefore, in this study, different perforation depths within the same perforation cluster were set, a method referred to as controlled-depth directional perforation. To analyze the impact of different perforation patterns on fracture initiation, a cubic model with dimensions of 3 m by 3 m by 3 m was established. The minimum horizontal principal stress, σh (33 MPa), was applied in the X direction; the maximum horizontal principal stress, σH (47 MPa), was applied in the Y direction; and the overburden stress, σv (52 MPa), was applied in the Z direction.
The horizontal wellbore was aligned with the direction of the minimum horizontal principal stress. The wellbore had an outer diameter of 0.14 m and an inner diameter of 0.10 m. The perforation depth was 0.4 m, and the perforation diameter was 0.02 m. Three perforation models were established: spiral perforation, directional perforation, and controlled-depth directional perforation.
Spiral perforation (Figure 5b): The model includes 11 perforations distributed around the wellbore at a 120° phase angle. The first perforation is parallel to the direction of the vertical stress and perpendicular to the wellbore.
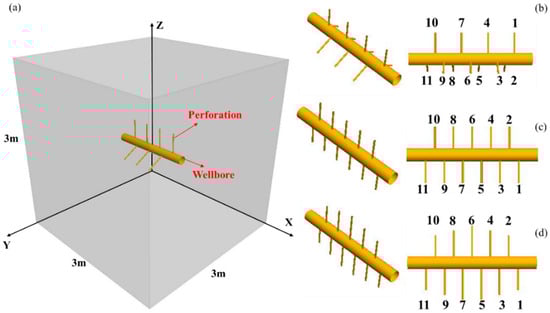
Figure 5.
Schematics of model layout (a) perspective view of the model, (b) spiral perforation, (c) oriented perforation, and (d) depth-controlled perforation.
Directional perforation (Figure 5c): The model includes 11 perforations, all perpendicular to the wellbore, with all perforations alternating along the direction parallel to the vertical stress.
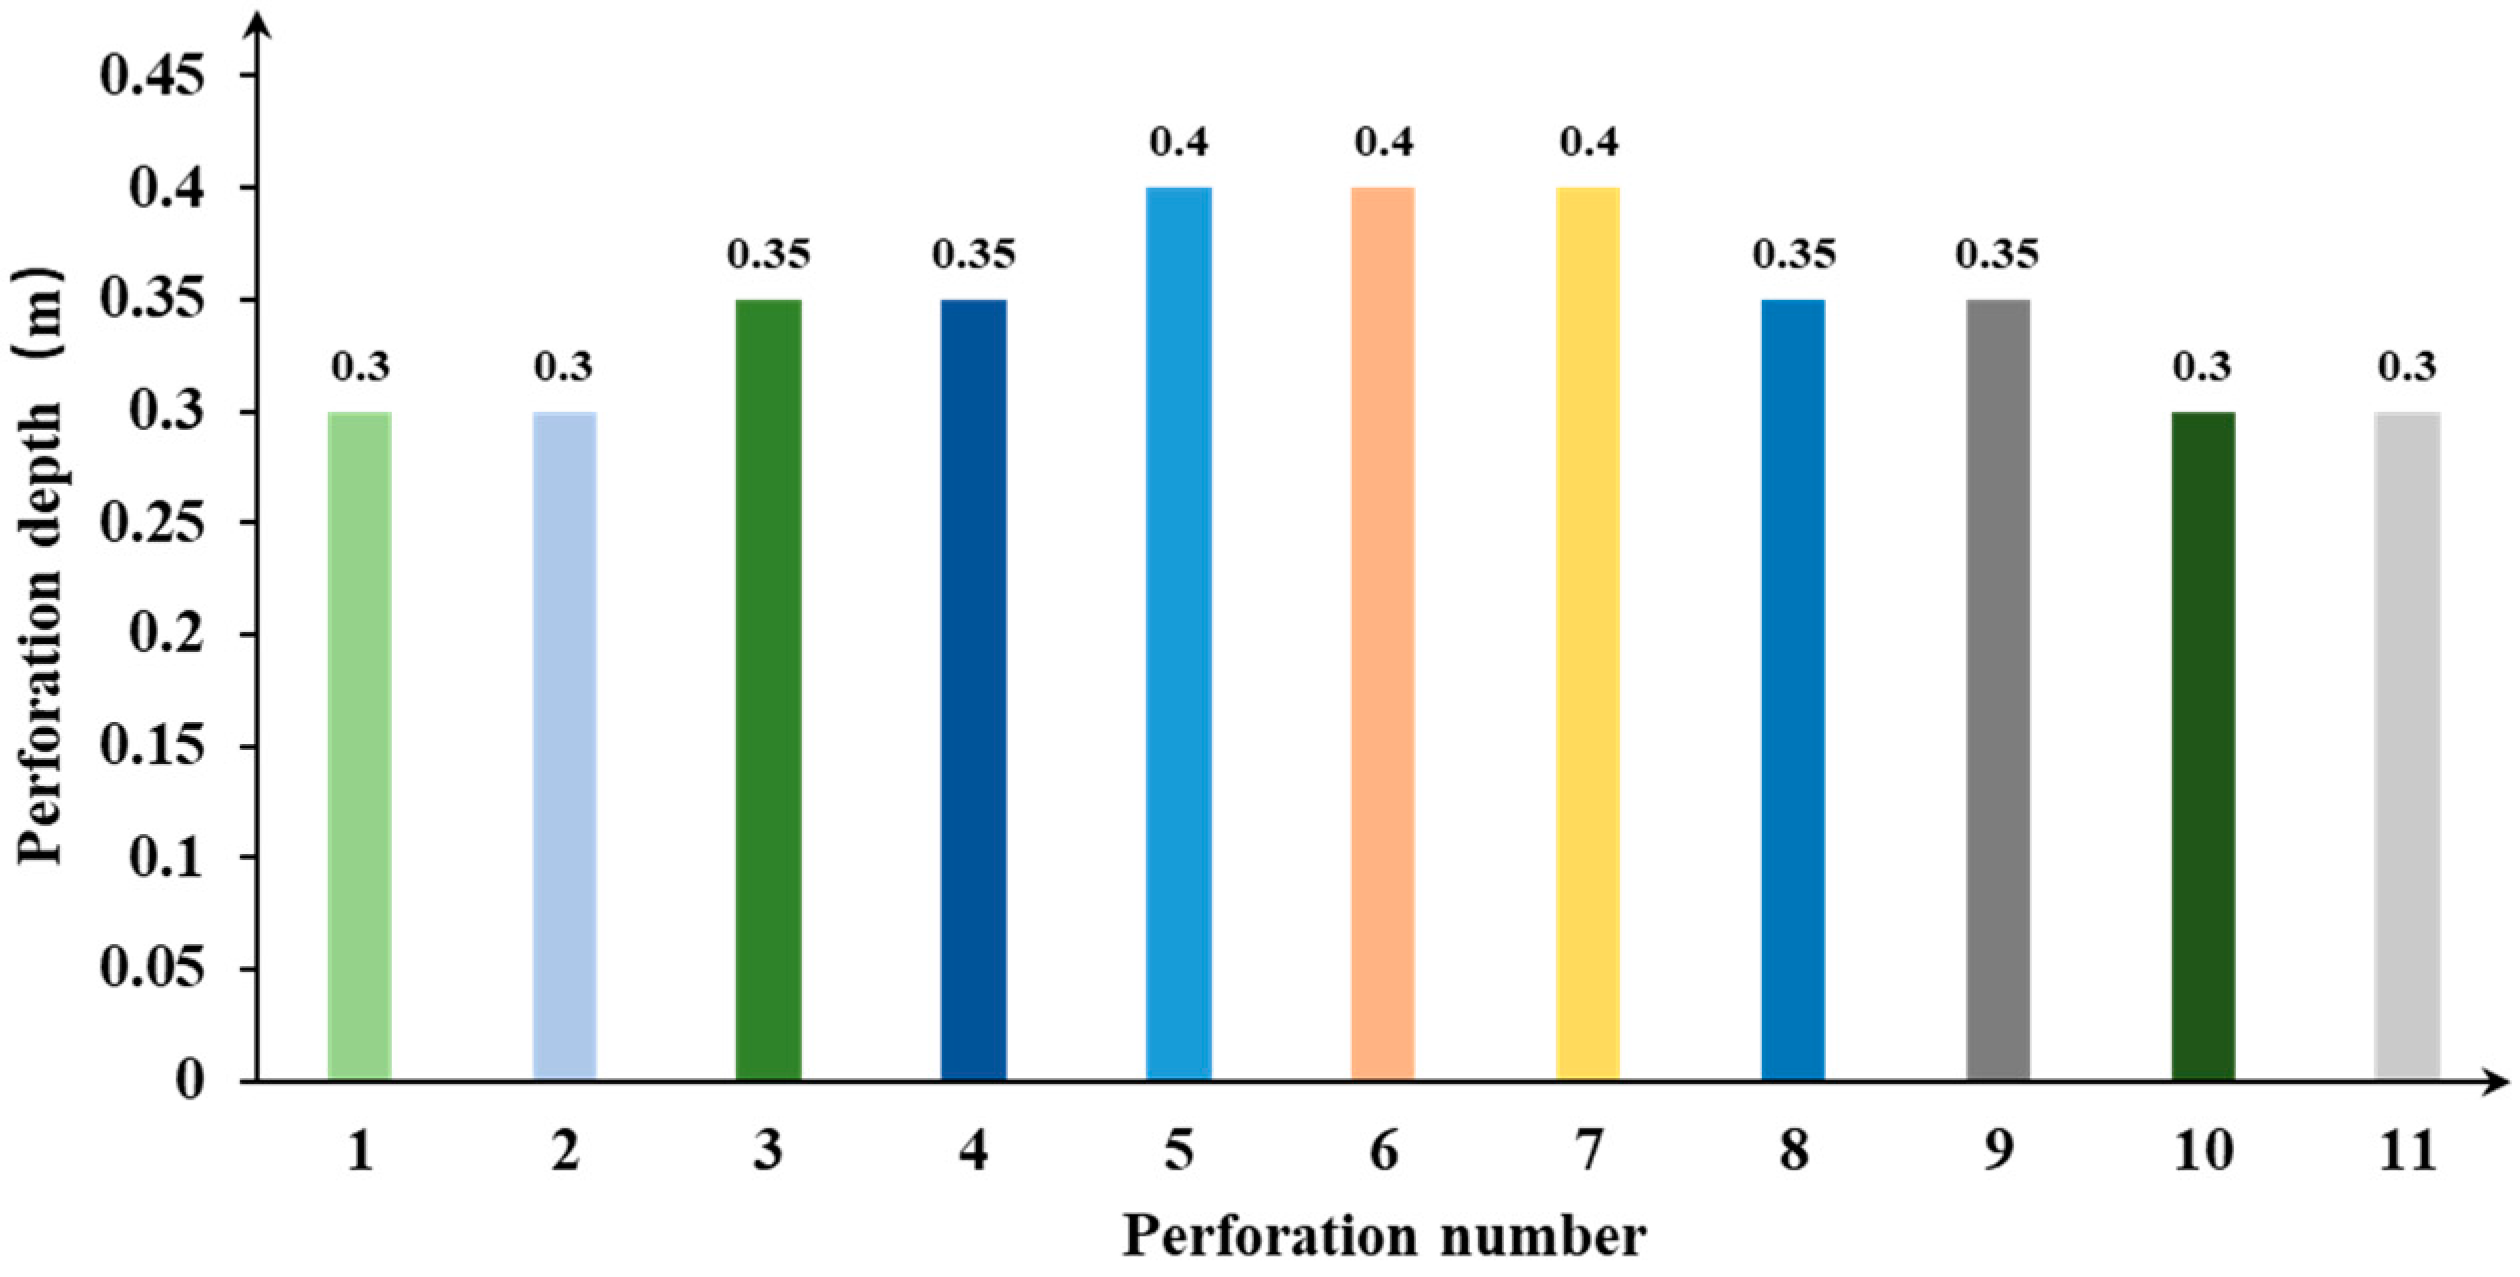
Controlled-depth directional perforation (Figure 5d): The model includes 11 perforations, all perpendicular to the wellbore, with all perforations alternating along the direction parallel to the vertical stress. The detailed distribution of perforation depths is shown in Figure 6.
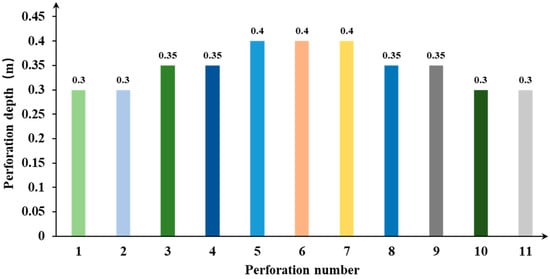
Figure 6.
Distribution of depth-controlled oriented perforation.
For this study, all three perforation schemes utilized identical rock parameters and injection schemes. The rock exhibited an elastic modulus of 30 GPa, a Poisson’s ratio of 0.21, a uniaxial compressive strength of 120 MPa, and a tensile strength of 7.2 MPa. Roller far-field boundary conditions were applied to six faces.
4.2. Result Analysis
Figure 7 and Figure 8 display the near-wellbore fracture morphology of spiral perforation, oriented perforation, and depth-controlled oriented perforation. The calculation results revealed that the hydraulic fractures propagated on both sides of spiral perforation and directional perforation, exhibiting a tendency to propagate in both directions. The intermediate perforation failed to generate an effective hydraulic fracture due to the stress shadow effect. Depth-controlled oriented perforation improved uneven fracture initiation, allowing for the effective formation of hydraulic fractures, including the middle perforation.
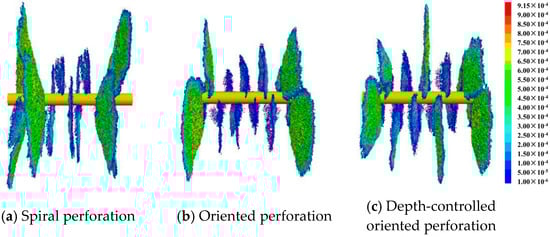
Figure 7.
Frontal view of fracture morphology around the wellbore.
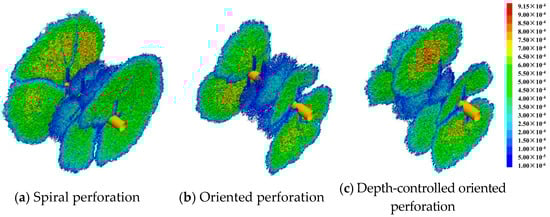
Figure 8.
Three-dimensional view of fracture morphology around the wellbore.
5. Influence Factors of Fractures Initiation in Depth-Controlled Oriented Perforation
To analyze the influence of construction and geological parameters on the initiation pressure and fracture morphology of depth-controlled oriented perforation, the initiation pressure and fracture morphology under different injection velocities, formation elastic modulus, and horizontal stress differences were calculated. To enhance calculation efficiency, the original perforation model was modified by reducing the number of perforations from eleven to six. The hole depth distribution of the model is shown in Figure 9 (The perforation number is illustrated in Figure 7). The other parameters remain unchanged.

Figure 9.
Distribution of simplified depth-controlled oriented perforation.
5.1. Injection Rate
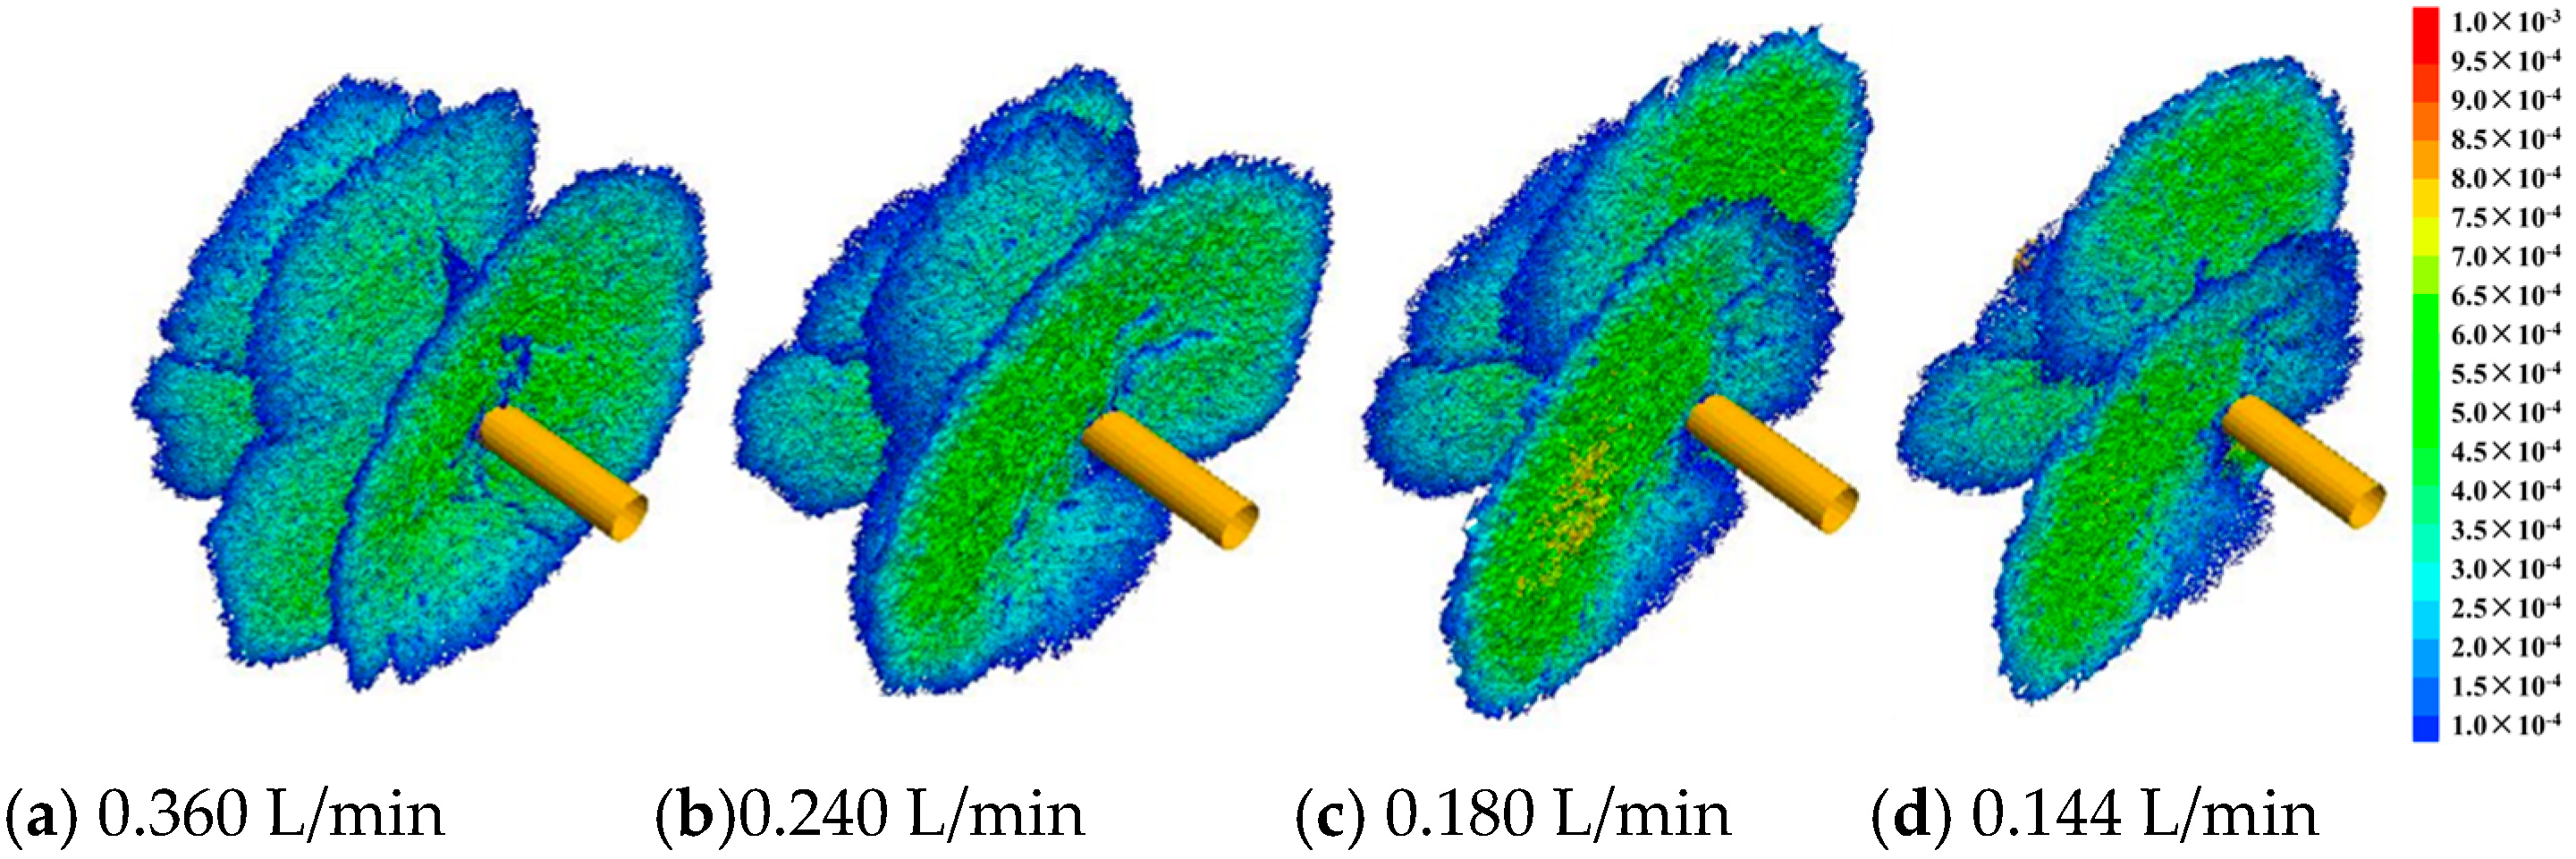
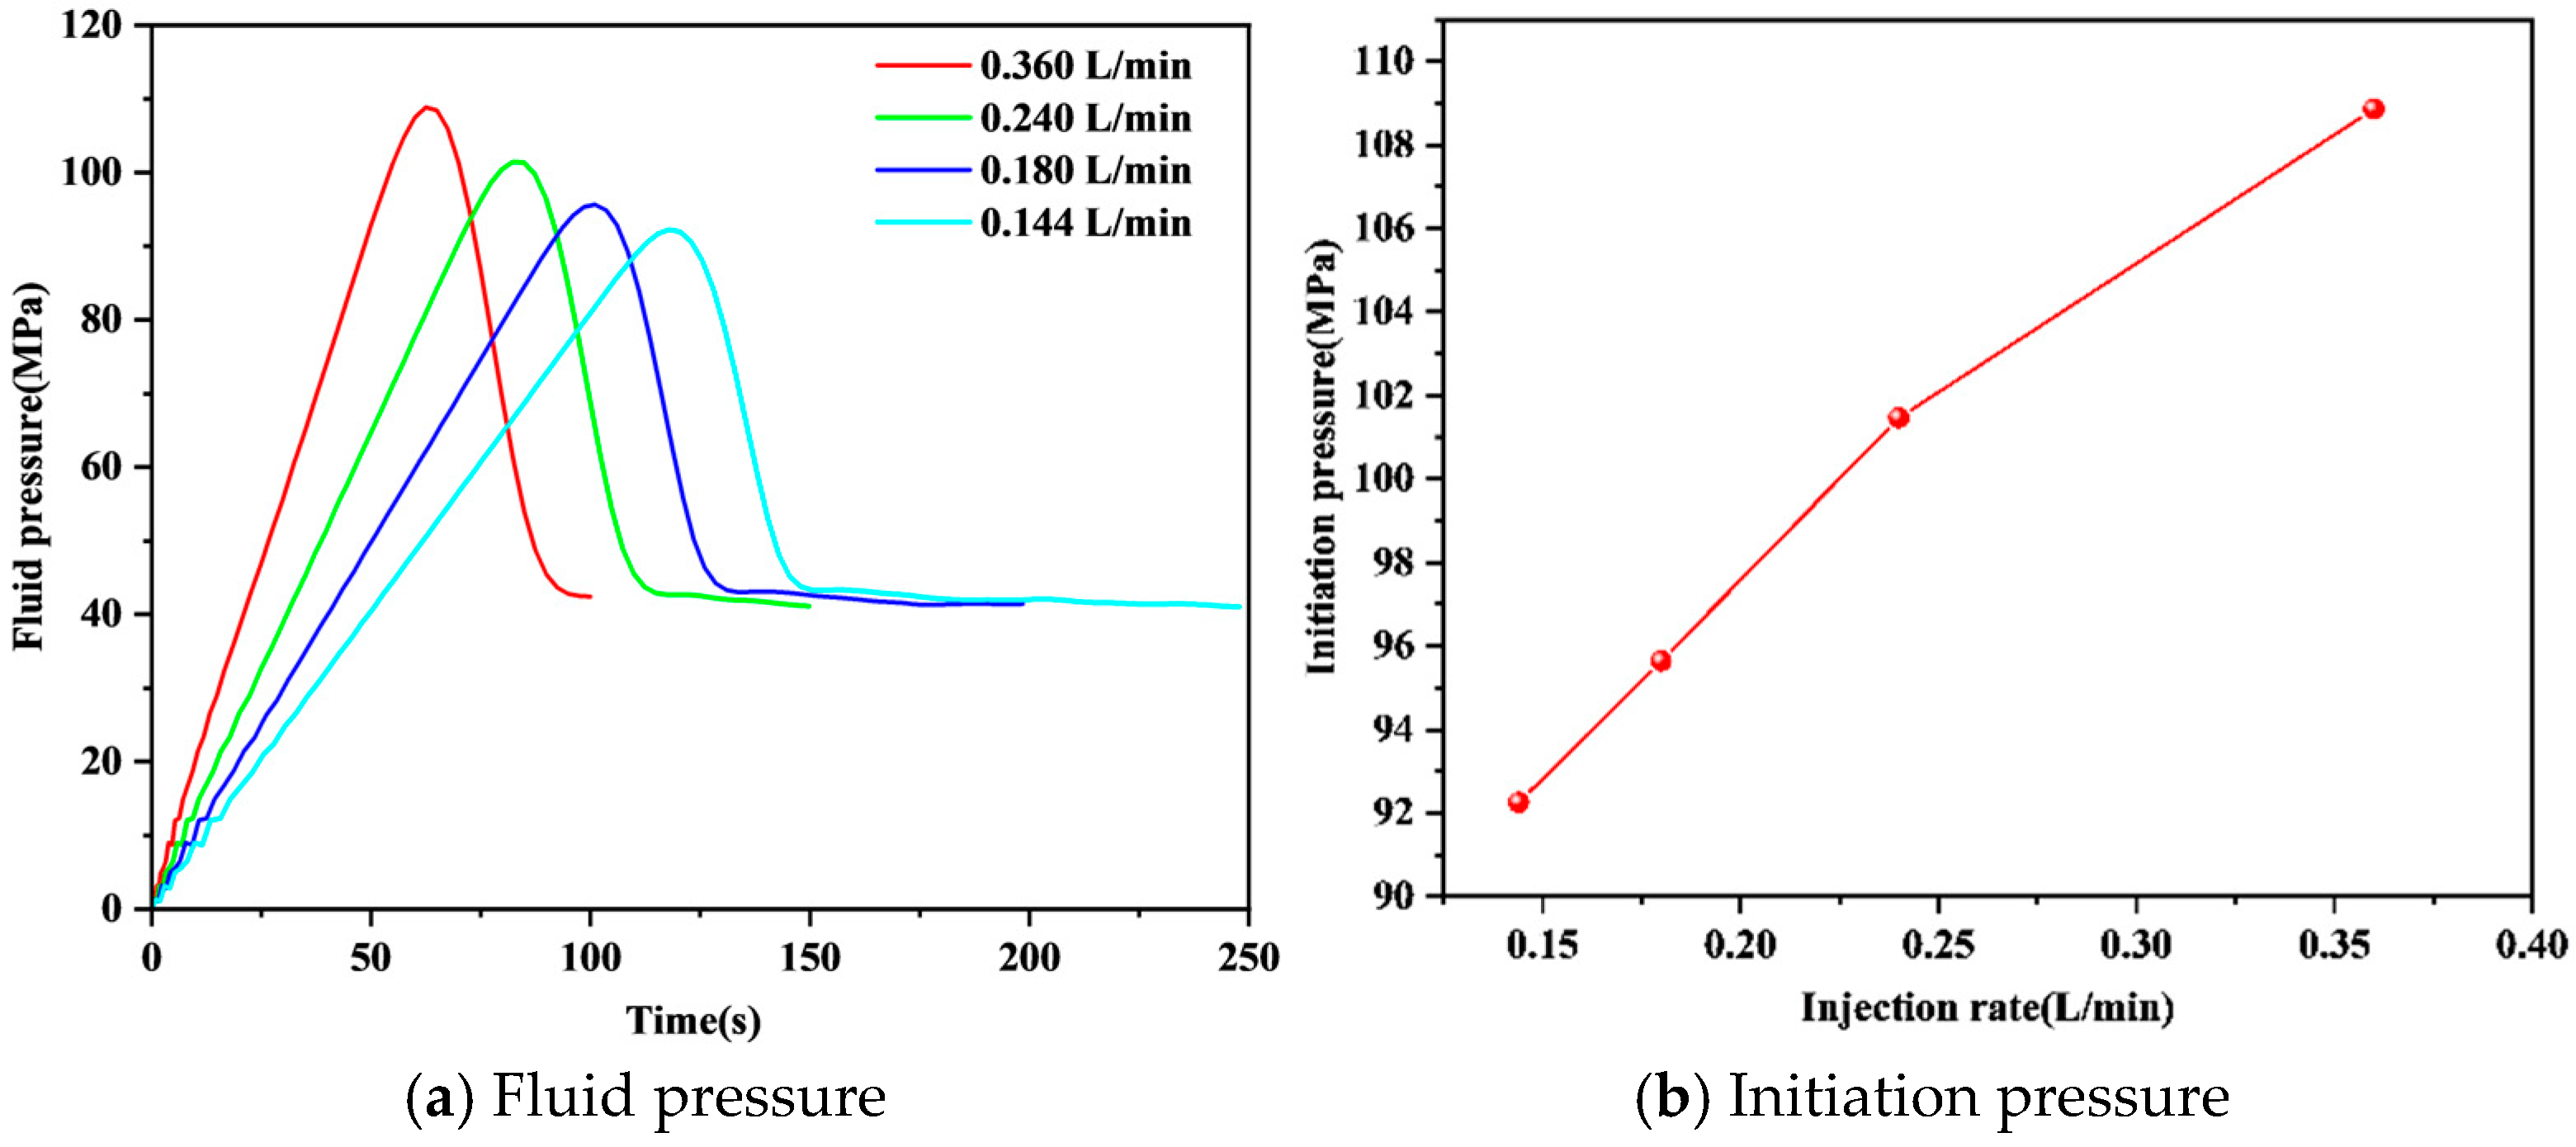
To analyze the influence of fracturing fluid injection rate on fracture initiation and the propagation morphology of depth-controlled oriented perforation while maintaining a consistent total injection volume of fracturing fluid, hydraulic fracturing simulations were conducted at flow rates of 0.360 L/min, 0.240 L/min, 0.180 L/min, and 0.144 L/min. According to the calculation results, it can be seen that the depth-controlled oriented perforation effectively ensured the uniform initiation of hydraulic fractures. Figure 10 and Figure 11 illustrate that as the injection rate increased, the hydraulic fractures formed by each perforation became independent and disconnected from each other. This phenomenon was attributed to the rapid pressure rise in perforations with high injection flow rates (Figure 12), intensifying stress interference between the perforations. As the injection rate increased, when the injection rate increased from 0.144 L/min to 0.180 L/min, 0.240 L/min and 0.36 L/min, the initiation pressure increased by 3.87%, 9.98%, and 18.00%, respectively, when compared with that of 0.144 L/min.
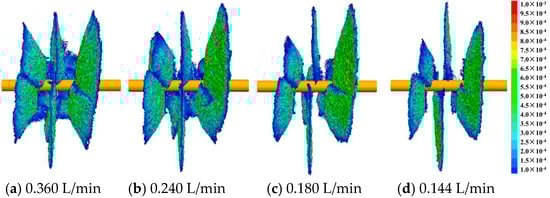
Figure 10.
Frontal view of fracture morphology around the wellbore with different injection rates at 200 s.
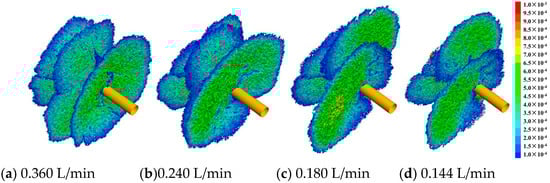
Figure 11.
Three-dimensional view of fracture morphology around the wellbore with different injection rates at 200 s.
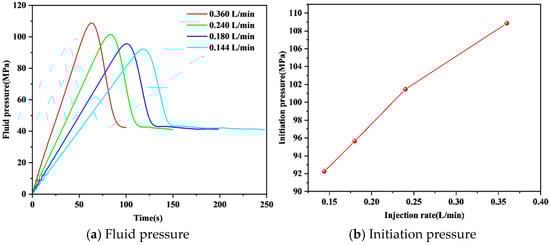
Figure 12.
Fluid pressure and Initiation pressure of different injection rates.
5.2. Elastic Modulus
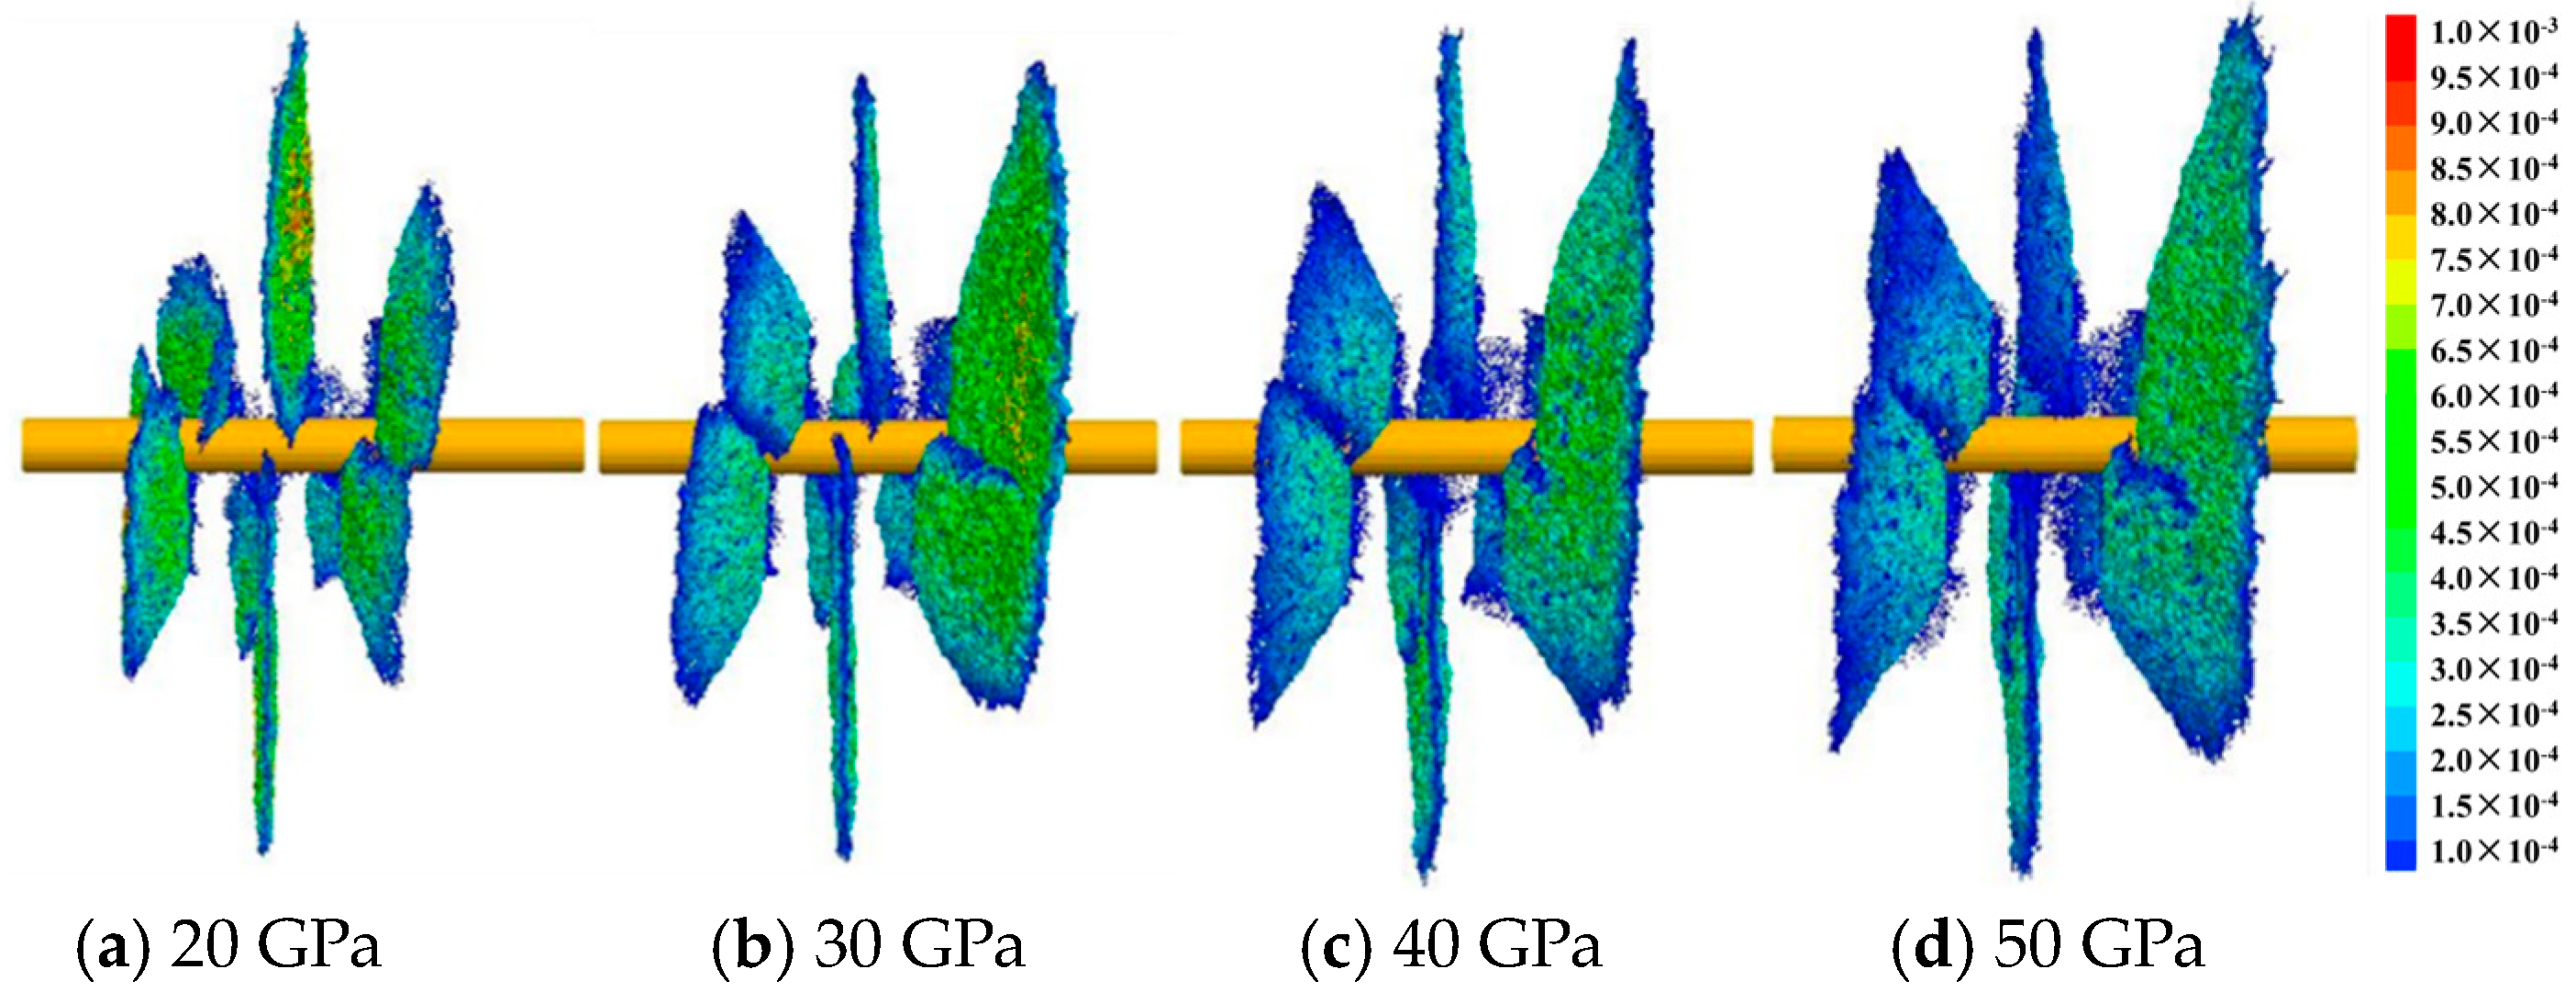
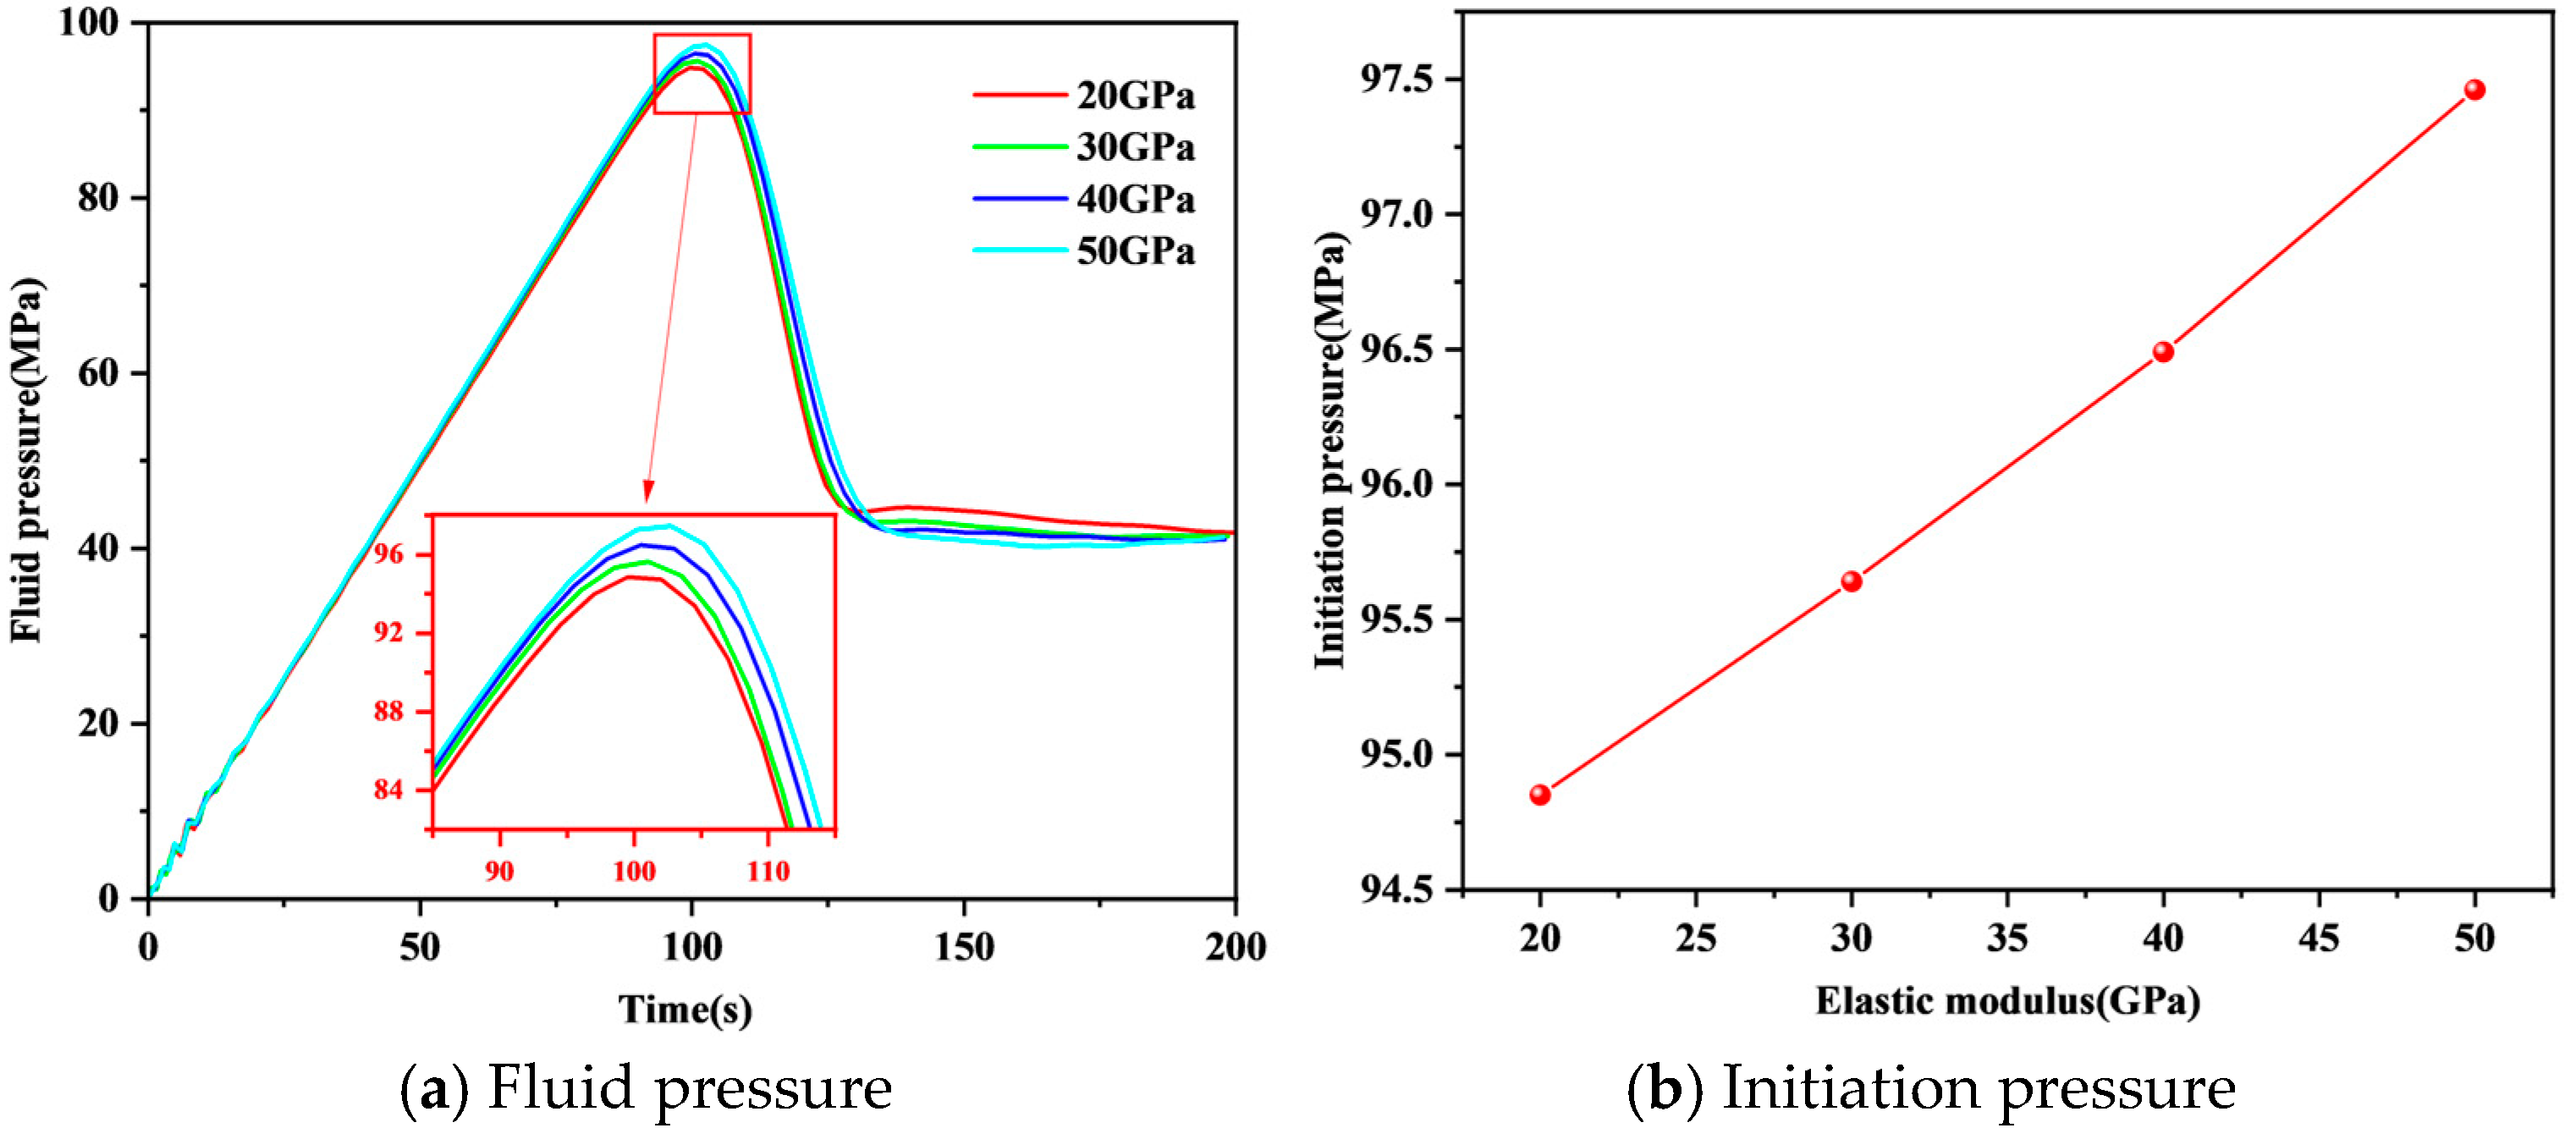
To investigate the impact of different formation elastic moduli on fracture initiation and propagation, fracture propagation morphology simulations were conducted with elastic moduli set to 20 GPa, 30 GPa, 40 GPa, and 50 GPa, as shown in Figure 13 and Figure 14. It was evident that depth-controlled oriented perforation ensured uniform initiation of hydraulic fractures in both soft and hard formations. However, for the hard formation, the fracture width was much lower than that of the soft formation, and the fracture area was larger. Figure 15 depicts the variations in pressure curves with different elastic moduli. It is found that with the increase in formation elastic modulus, the initiation pressure of controlled deep perforation increases gradually. What is more, with the increase in formation elastic modulus, directional perforation initiation pressure increased gradually. The highest initiation pressure of 97.45 MPa was observed when the elastic modulus was 50 GPa. Conversely, when the elastic modulus decreased to 20 GPa, the initiation pressure reduced to 94.83 MPa, representing a decrease of 2.6%. The results showed that although the initiation pressure was slightly higher in hard formation, the fracture area was larger, so the controlled depth directional perforation in the hard formation can better stimulate the reservoir.
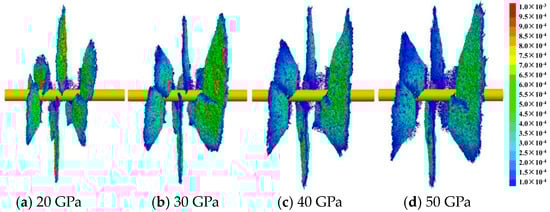
Figure 13.
Frontal view of fracture morphology around the wellbore with different elastic moduli at 200 s.
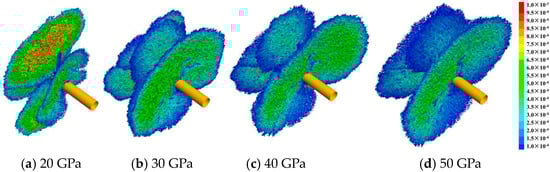
Figure 14.
Three-dimensional view of fracture morphology around the wellbore with different elastic moduli at 200 s.
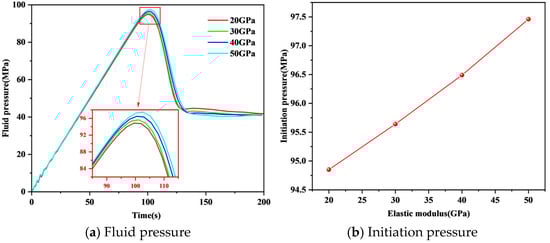
Figure 15.
Fluid pressure and Initiation pressure of different elastic moduli.
5.3. Horizontal Stress Difference
To analyze the effect of horizontal stress differences on fracture initiation pressure, the model considered a minimum horizontal principal stress of 33 MPa and varying maximum horizontal principal stresses of 35 MPa, 39 MPa, 33 MPa, and 47 MPa, respectively. Figure 16 and Figure 17 present the fracture propagation morphology under different stress differences. From Figure 18, when the horizontal stress difference was 2 MPa, the hydraulic fracture initiated along the minimum horizontal principal stress due to the interference between the perforation. As the fracture propagated, it tended to change direction under varying horizontal stress differences. As the horizontal stress difference increased, the connectivity between hydraulic fractures gradually diminished. Under high stress difference, each perforation was more likely to form a fracture strictly perpendicular to the direction of the minimum horizontal principal stress and propagate independently, which made the connection between adjacent perforations challenging. Figure 18 shows the influence of horizontal stress difference on initiation pressure. From the figure, it was evident that with the increase in the horizontal stress difference, the initiation pressure increased initially and then decreased. This finding contrasts with the research conclusions of Li et al. [28], who suggested a gradual decrease in initiation pressure with an increase in horizontal stress difference. The disparity in results may be attributed to the omission of perforation interference in Li et al.’s model [28].
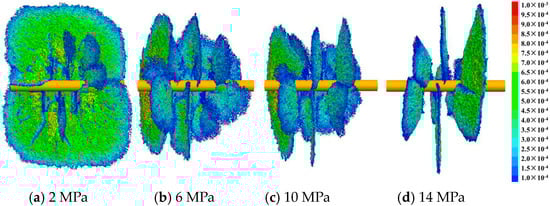
Figure 16.
Frontal view of fracture morphology around the wellbore with different horizontal stress differences at 200 s.
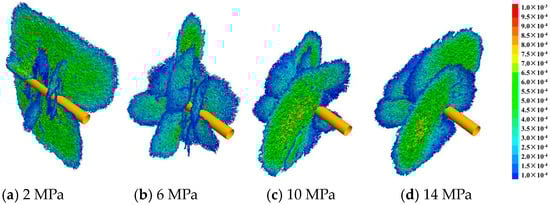
Figure 17.
Three-dimensional view of fracture morphology around the wellbore with different horizontal stress differences at 200 s.
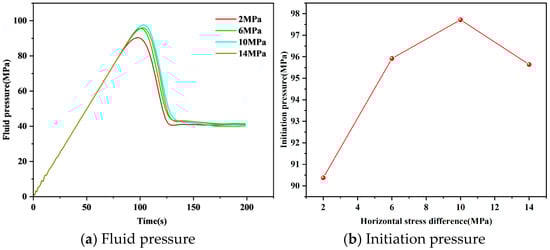
Figure 18.
Fluid pressure and initiation pressure of different horizontal stress differences.
6. Conclusions
- (1)
- This study establishes a 3D lattice method model to explore the fracture initiation mechanisms of depth-controlled oriented perforation under various operational parameters and geological conditions.
- (2)
- Depth-controlled oriented perforation ensures uniform fracture initiation at the perforations on both sides, effectively overcoming stress interference at the central perforations, thereby improving fracture formation efficiency.
- (3)
- Depth-controlled oriented perforation is more suitable for formations with high horizontal stress differences and high elastic moduli, facilitating the formation of narrow and long fractures.
- (4)
- Under high injection flow rate conditions, the fracture initiation pressure of depth-controlled oriented perforation increases; therefore, it is essential to control the injection rate appropriately to achieve effective fracture initiation.
Author Contributions
H.Z.: Conceptualization, Writing—original draft preparation, Investigation. Y.G.: Methodology, Writing—original draft preparation. D.C.: Writing—review and editing. F.Z.: Writing—review and editing. X.J.: Writing—review and editing. R.G.: Writing—review and editing, Software. Y.L.: Writing—review and editing. All authors have read and agreed to the published version of the manuscript.
Funding
This research was funded by the scientific research and technology development project “EISC Platform Improvement and Data Governance Technology Research and Application” of CNPC Oilfield Technology Service Co., Ltd., grant number Project No. 2023T-003-001 and Well logging reservoir and geology research project “Research and application of integrated evaluation technology of well logging geological engineering” of CNPC Logging Co., Ltd. grant number Project No. CNLC2024-8B02.
Data Availability Statement
The original contributions presented in the study are included in the article and further inquiries can be directed to the corresponding author.
Conflicts of Interest
Authors: Haining Zhang, Yanhong Gou, Daojie Cheng, Fengsheng Zhang, Xunan Jia are employed by the China National Logging Corporation; Author: Rui Gao is employed by the Research Institute of Petroleum Exploration and Development; The authors declare that the research was conducted in the absence of any commercial or financial relationships that could be construed as potential conflicts of interest. The funding sponsors had no role in the design of the study; in the collection, analyses, or interpretation of data; in the writing of the manuscript, and in the decision to publish the results.
References
- Liu, G. Challenges and Countermeasures of Log Evaluation in Unconventional Petroleum Exploration and Development. Pet. Explor. Dev. 2021, 48, 1033–1047. [Google Scholar] [CrossRef]
- Kokkinos, N.C.; Nkagbu, D.C.; Marmanis, D.I.; Dermentzis, K.I.; Maliaris, G. Evolution of Unconventional Hydrocarbons: Past, Present, Future and Environmental FootPrin. J. Eng. Sci. Technol. Rev. 2022, 4, 15–24. [Google Scholar] [CrossRef]
- Cong, Z.; Li, Y.; Pan, Y.; Liu, B.; Shi, Y.; Wei, J.; Li, W. Study on CO2 Foam Fracturing Model and Fracture Propagation Simulation. Energy 2022, 238, 121778. [Google Scholar] [CrossRef]
- Zhang, B.; Zhang, C.; Chen, Z. Analysis of high fracturing initiation pressure in low permeability reservoirs in the East China Sea. Chin. J. Appl. Mech. 2022, 39, 403–408. [Google Scholar]
- Lei, Q.; Weng, D.; Guan, B.; Shi, J.; Cai, B.; He, C.; Sun, Q.; Huang, R. Shale Oil and Gas Exploitation in China: Technical Comparison with US and Development Suggestions. Pet. Explor. Dev. 2023, 50, 944–954. [Google Scholar] [CrossRef]
- Zhang, J.; Li, Y.; Pan, Y.; Wang, X.; Yan, M.; Shi, X.; Zhou, X.; Li, H. Experiments and Analysis on the Influence of Multiple Closed Cemented Natural Fractures on Hydraulic Fracture Propagation in a Tight Sandstone Reservoir. Eng. Geol. 2021, 281, 105981. [Google Scholar] [CrossRef]
- Zhang, J.; Yu, Q.; Li, Y.; Pan, Z.; Liu, B. Hydraulic Fracture Vertical Propagation Mechanism in Interlayered Brittle Shale Formations: An Experimental Investigation. Rock Mech. Rock Eng. 2022, 56, 199–200. [Google Scholar] [CrossRef]
- Hossain, M.M.; Rahman, M.K.; Rahman, S.S. Hydraulic Fracture Initiation and Propagation: Roles of Wellbore Trajectory, Perforation and Stress Regimes. J. Pet. Sci. Eng. 2000, 27, 129–149. [Google Scholar] [CrossRef]
- Jin, Y.; Zhang, X.; Chen, M. Initiation Pressure Models for Hydraulic Fracturing of Vertical Wells in Naturally Fractured Formation. Acta Pet. Sin. 2005, 26, 113. [Google Scholar]
- Guo, J.; Deng, Y.; Zhao, J. Study on Breakdown Pressure of Hydraulic Fracturing for Extended Reach Wells With Perforation Completion. NGI 2006, 26, 105–107. [Google Scholar]
- Tananykhin, D.S.; Struchkov, I.A.; Khormali, A.; Roschin, P.V. Investigation of The Influences of Asphaltene Deposition on Oilfield Development Using Reservoir Simulation. Explor. Dev. 2022, 49, 1138–1149. [Google Scholar] [CrossRef]
- Li, Y.; Peng, G.; Tang, J.; Zhang, J.; Zhao, W.; Liu, B.; Pan, Y. Thermo-Hydro-Mechanical Coupling Simulation for Fracture Propagation in CO2 Fracturing Based on Phase-Field Model. Energy 2023, 284, 128629. [Google Scholar] [CrossRef]
- Lian, Z.; Meng, Y.; Tong, M. A New Method of Numerical Simulation for Perforation Completion of Fracture Formation. In Proceedings of the SPE Asia Pacific Oil and Gas Conference and Exhibition, Brisbane, Australia, 16–18 October 2000; OnePetro: Richardson, TX, USA, 2000. [Google Scholar]
- Wanniarachchi, W.A.M.; Ranjith, P.G.; Li, J.C.; Perera, M.S.A. Numerical Simulation of Foam-Based Hydraulic Fracturing to Optimise Perforation Spacing and to Investigate Effect of Dip Angle on Hydraulic Fracturing. J. Pet. Sci. Eng. 2019, 172, 83–96. [Google Scholar] [CrossRef]
- Zhang, X.; Jeffrey, R.G.; Bunger, A.P.; Thiercelin, M. Initiation and Growth of a Hydraulic Fracture from a Circular Wellbore. Int. J. Rock Mech. Min. Sci. 2011, 48, 984–995. [Google Scholar] [CrossRef]
- Sepehri, J.; Soliman, M.Y.; Morse, S.M. Application of Extended Finite Element Method (XFEM) to Simulate Hydraulic Fracture Propagation from Oriented Perforations. In Proceedings of the SPE Hydraulic Fracturing Technology Conference and Exhibition, The Woodlands, TX, USA, 3–5 February 2015; p. D031S007R006. [Google Scholar]
- Dong, Z.; Tang, S. Numerical Study of Near-Wellbore Hydraulic Fracture Propagation. Theor. Appl. Fract. Mech. 2019, 103, 10227. [Google Scholar] [CrossRef]
- Ferguson, W.; Richards, G.; Bere, A.; Mutlu, U.; Paw, F. Modelling Near-Wellbore Hydraulic Fracture Branching, Complexity and Tortuosity: A Case Study Based on a Fully Coupled Geomechanical Modelling Approach. In Proceedings of the SPE Hydraulic Fracturing Technology Conference and Exhibition, The Woodlands, TX, USA, 23–25 January 2018; p. D021S004R001. [Google Scholar]
- Shan, Q.; Zhang, R.; Jiang, Y.; Luan, H.; Li, Q. Complexity of Near-Wellbore Hydraulic Fracture Morphology around Perforated Wells with Various Orientations in Tight Reservoir. J. Nat. Gas Sci. Eng. 2022, 102, 104550. [Google Scholar] [CrossRef]
- Shan, Q.; Zhang, R.; Jiang, Y. Complexity and Tortuosity Hydraulic Fracture Morphology Due to Near-Wellbore Nonplanar Propagation from Perforated Horizontal Wells. J. Nat. Gas Sci. Eng. 2021, 89, 103884. [Google Scholar] [CrossRef]
- Peng, F.; Sheng, Q.; Feng, G.; Wen, L.; Wei, Z. Numerical Investigation on Hydraulic Fracture Propagation and Multi-Perforation Fracturing for Horizontal Well in Longmaxi Shale Reservoir. Theor. Appl. Fract. Mech. 2023, 125, 103921. [Google Scholar]
- Zhang, F.; Mack, M. Modeling of Hydraulic Fracture Initiation from Perforation Tunnels Using the 3D Lattice Method. In Proceedings of the ARMA US Rock Mechanics/Geomechanics Symposium, Houston, TX, USA, 26–29 June 2016. [Google Scholar]
- Huang, L.; Liu, J.; Zhang, F.; Fu, H.; Zhu, H.; Damjanac, B. 3D Lattice Modeling of Hydraulic Fracture Initiation and Near-Wellbore Propagation for Different Perforation Models. J. Pet. Sci. Eng. 2020, 191, 107169. [Google Scholar] [CrossRef]
- Wang, X.; Zhang, F.; Tang, M.; Du, X.; Tang, J. Effect of Stress Shadow Caused by Multistage Fracturing from Multiple Well Pads on Fracture Initiation and Near-Wellbore Propagation from Infill Wells. SPE J. 2022, 27, 204–222. [Google Scholar] [CrossRef]
- Li, Y.; Hubuqin; Wu, J.; Zhang, J.; Yang, H.; Zeng, B.; Xiao, Y.; Liu, J. Optimization Method of Oriented Perforation Parameters Improving Uneven Fractures Initiation for Horizontal Well Fracturing. Fuel 2023, 349, 12875. [Google Scholar] [CrossRef]
- Jiang, H.; Chen, M.; Zhang, G.; Jin, Y.; Zhao, Z.; Zhu, G. Impact of oriented perforation on hydraulic fracture initiation and propagation. Chin. J. Rock Mech. Eng. 2009, 28, 1321–1326. [Google Scholar]
- Fu, H.; Zhang, F.; Weng, D.; Liu, Y.; Yan, Y.; Liang, T.; Guan, B.; Wang, X.; Zheng, W. The Simulation Method Research of Hydraulic Fracture Initiation with Perforations. In Proceedings of the International Field Exploration and Development Conference 2018 8th, Xi’an, China, 18–20 September 2018; Springer: Singapore, 2020; pp. 1229–1240. [Google Scholar]
- Li, X.; Hofmann, H.; Yoshioka, K.; Luo, Y.; Liang, Y. Phase-Field Modelling of Interactions Between Hydraulic Fractures and Natural Fractures. Rock Mech. Rock Eng. 2022, 55, 6227–6247. [Google Scholar] [CrossRef]


Disclaimer/Publisher’s Note: The statements, opinions and data contained in all publications are solely those of the individual author(s) and contributor(s) and not of MDPI and/or the editor(s). MDPI and/or the editor(s) disclaim responsibility for any injury to people or property resulting from any ideas, methods, instructions or products referred to in the content. |
© 2024 by the authors. Licensee MDPI, Basel, Switzerland. This article is an open access article distributed under the terms and conditions of the Creative Commons Attribution (CC BY) license (https://creativecommons.org/licenses/by/4.0/).