Abstract
Breakthrough pressure of natural gas in rock is an important evaluation parameter in gas reservoir development. In this study, experimental measurements of porosity and permeability of the caprock core were carried out. A digital core model was obtained by body rendering of rock CT (Computed Tomography) slices using Avizo software. Then, the grid model was imported into Fluent software for a numerical simulation of natural gas breakthrough pressure in the core. The innovations of this paper include (1) an accurate calculation method of cap breakthrough pressure based on the VOF method; (2) the method performs a perceptual analysis of average pore radius, wettability, roughness height, and viscosity ratio.
1. Introduction
As a clean energy source, natural gas plays an important role in global energy restructuring and is a major component of conventional and unconventional natural gas resources. The breakthrough pressure of natural gas in rocks is a crucial parameter in gas reservoir development and cap evaluation. It is argued that breakthrough pressure can be used as the minimum pressure required for a rock system to begin to be displaced by the non-wetting phase fluid [1,2]. We believe that the closure of the cap layer mainly depends on the minimum capillary pressure difference between the reservoir and cap layer. Currently, there are many experimental studies on the breakthrough pressure of the cap layer [3,4,5,6], but there are relatively few studies on the calculation of breakthrough pressure. There have been many experimental studies on cap breakthrough pressure, but relatively few studies on calculating breakthrough pressure [7,8,9,10]. At present, scholars mainly use the average pore throat radius obtained by MICP, CT scanning or SEM, and substitute it into the Young-Laplace equation (static two-phase interface capillary force formula) to estimate the breakthrough pressure of the cap layer [11,12]. However, in reality, natural gas will intrude along the permeability path consisting of larger pores. Therefore, there are fewer studies on how to accurately calculate the breakthrough pressure, and the related influencing factors are still unclear. According to the description from Li et al., a core is water-saturated before breakthrough water is discharged in the form of propulsive drainage drive and flows out of the core from the outlet end. Gas breakthrough is considered to have been achieved until the water saturation at the outlet end begins to decrease slightly [13,14,15]. At this point, the pressure difference between the inlet and outlet ends of the core (i.e., between the gas and liquid phases) is the gas breakthrough pressure [16].
The mineral composition of caprocks significantly affects their breakthrough pressure. Clay minerals, particularly montmorillonite and illite, can substantially increase the breakthrough pressure due to their high specific surface area and adsorption capacity. Experimental studies have shown that as the clay mineral content increases, the breakthrough pressure of caprocks significantly increases [17]. This phenomenon is mainly attributed to the swelling properties of clay minerals and their restriction on fluid flow paths. Numerical simulation techniques are increasingly applied in breakthrough pressure research. Fluid dynamics software like Fluent (https://www.ansys.com/products/fluids/ansys-fluent, accessed on 15 August 2015) is widely used to simulate the breakthrough process of two-phase flow in saturated rock cores. Using the Volume of Fluid (VOF) method [18,19,20], researchers can accurately simulate the displacement process of gas in porous media to obtain breakthrough pressure [21]. In the study by Zhang et al., numerical simulations were used to validate experimentally measured breakthrough pressures and further explore the effects of pore structure, fluid properties, and external pressure on breakthrough pressure. This method not only improves the accuracy of breakthrough pressure measurements, but also provides a deeper understanding of fluid flow mechanisms in porous media.
2. Experimental Measurement of Breakthrough Pressure
The test samples are natural rock cores, which were taken from Chaosupervision 1 well, Chaokou Test 1 well, Sikou Test 1 well and Sikou Slant 4 well. Among them, the capping depth of Chaosupervision 1 well was 672.5~707.2 m, the capping depth of Chaokou Test 1 well was 666.6~680.6 m, the capping depth of Sikou Test 1 well was 536.0~560.8 m, and the capping depth of Sikou Inclined 4 well was 603.2~611.0 m. The experiment was conducted by selecting 8 natural cores from each of the 4 wells, and the total number of cores was 30, as shown in Figure 1.
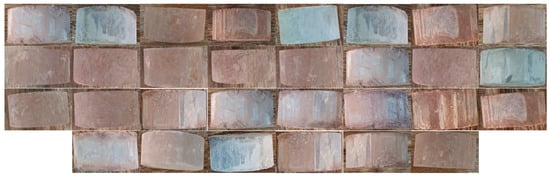
Figure 1.
Map of the experimental core.
The experiment firstly measured the permeability of the rock samples, and the CMS-300 (Core LabCo. Ltd., Houston, TX, USA) overburden porosimeter was used to carry out the experiments of overburden porosity and permeability testing of the cover cores. The experimental steps were as follows:
- (1)
- Firstly, the core samples were loaded into the feeding carousel one at a time, and the geometric parameters of each core and the required overburden pressure data were inputted in the software to start the test.
- (2)
- The instrument first pushes the core into the core gripper automatically and applies radial and axial pressures to simulate the formation of overburden pressure and start predicting the permeability. It then automatically decides whether to use helium or nitrogen to measure the permeability. Then, the measurement of porosity and permeability starts.
- (3)
- After the test is complete, the radial and axial pressures are released and a radial vacuum is applied to drop the core back into the feed carousel. At the same time, a line printer automatically prints out the real-time measurement results.
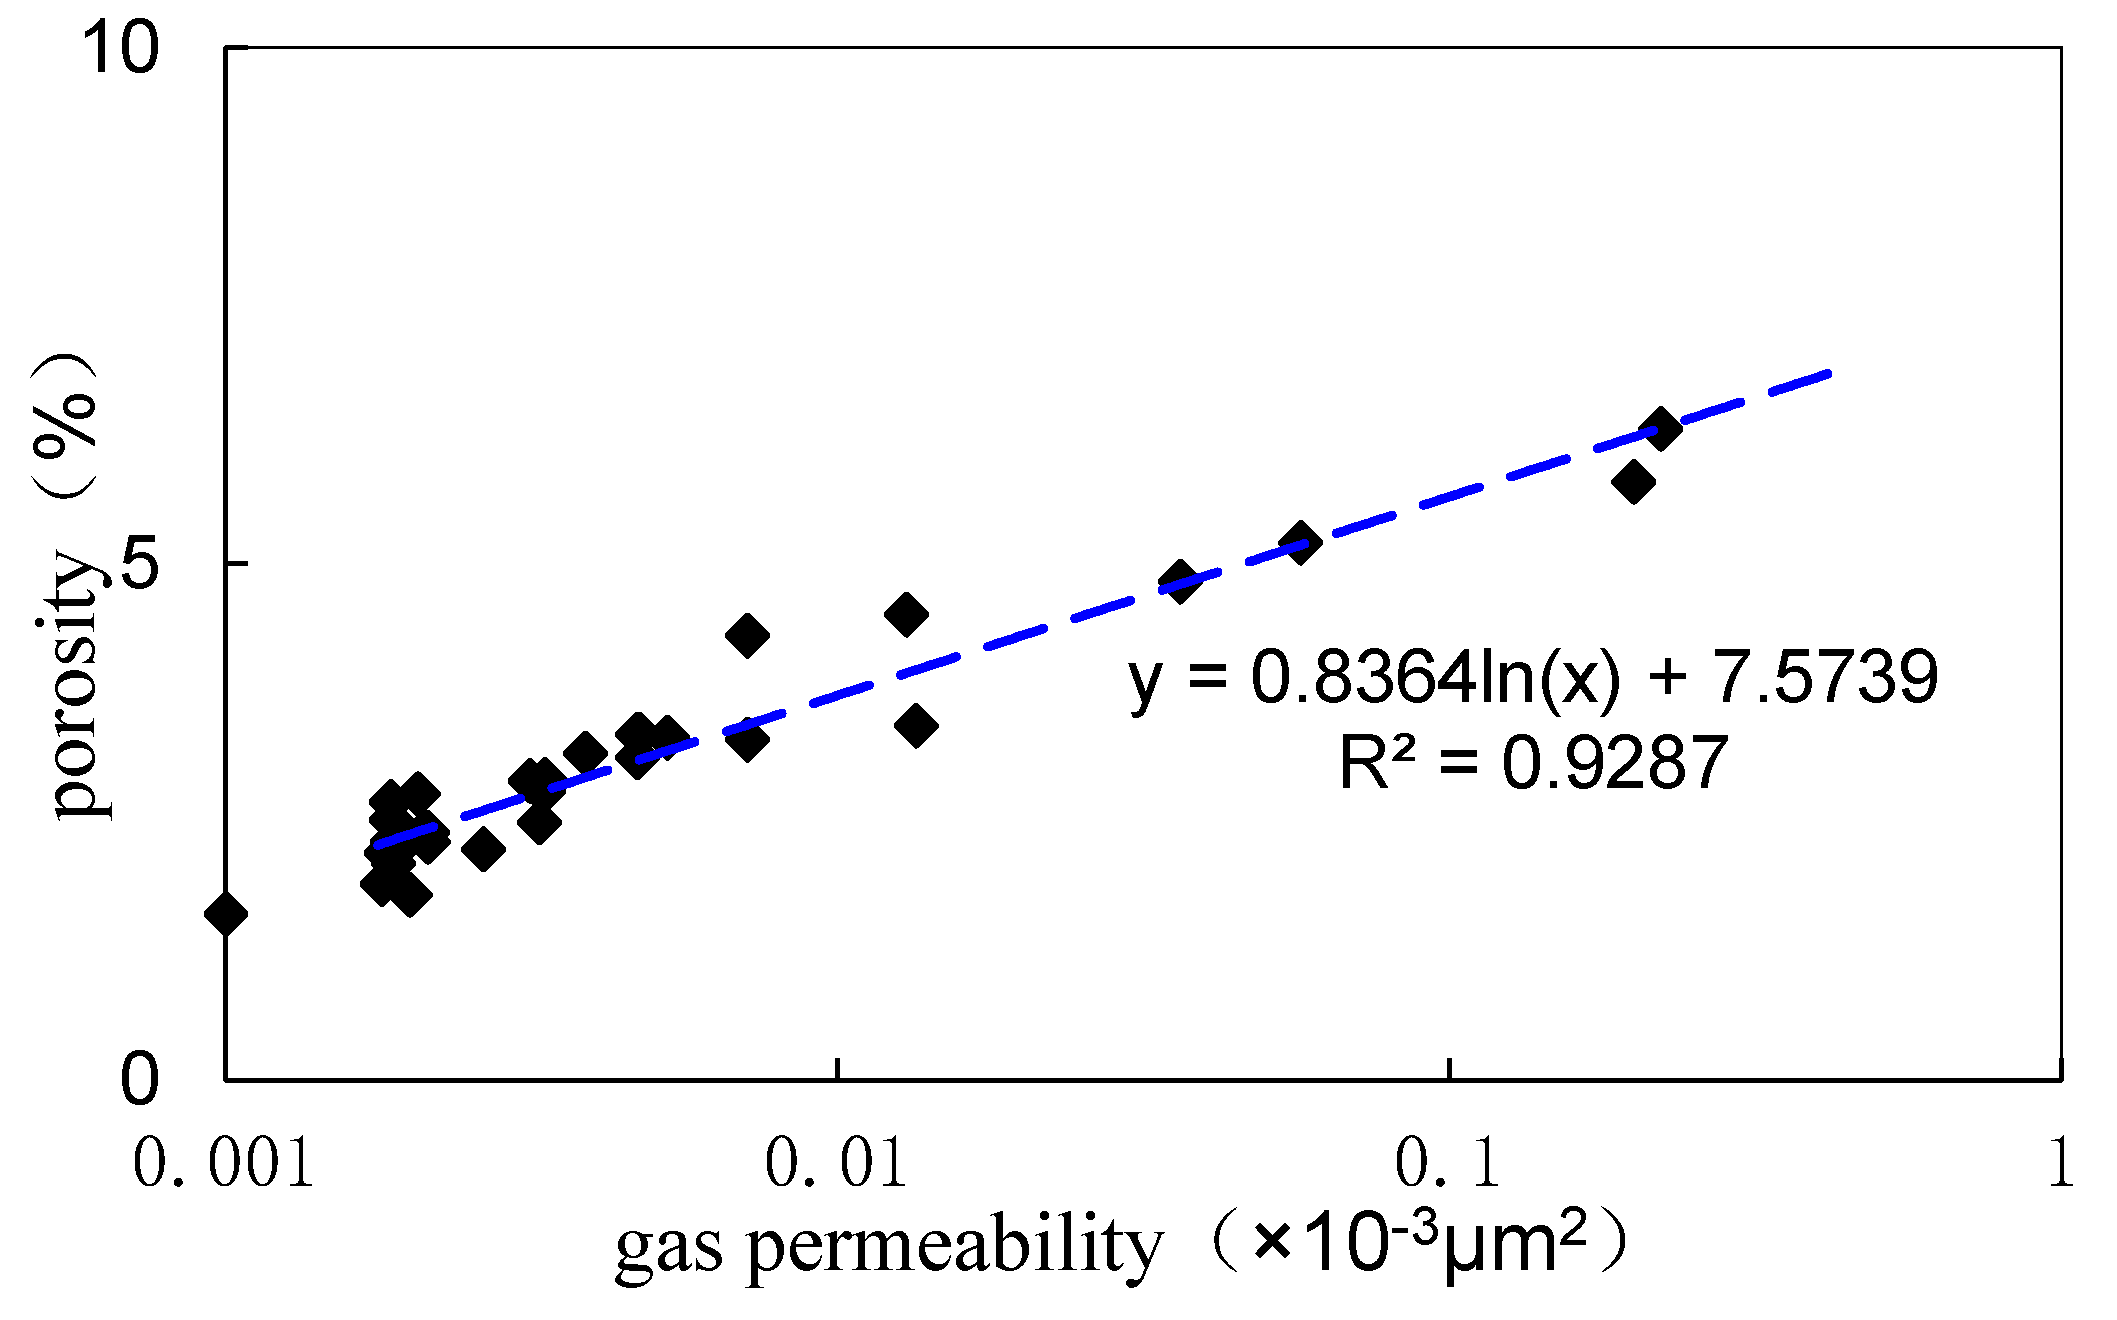
Under formation pressure conditions, permeability increases as core porosity increases. The porosity of the caprock core has a good correlation with the gasometric permeability. The fitted image is shown in Figure 2. The relationship between porosity ϕ and permeability K is satisfied as follows:
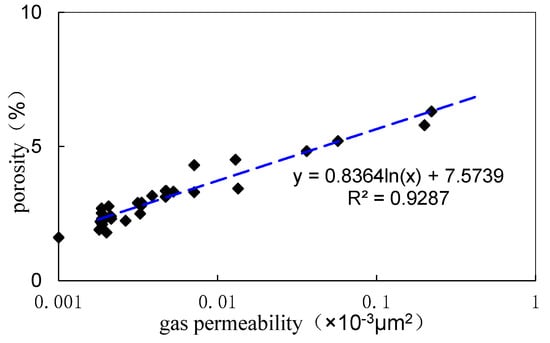
Figure 2.
Fitted image of gasometric permeability and porosity.
2.1. Experimental Steps
According to the standard of “Determination method of rock gas breakthrough pressure” (SY/T 5748-2020), the breakthrough pressure test experiment of a caprock core is carried out using self-developed breakthrough pressure testing instruments (e.g., Figure 3), and the operation steps are as follows:
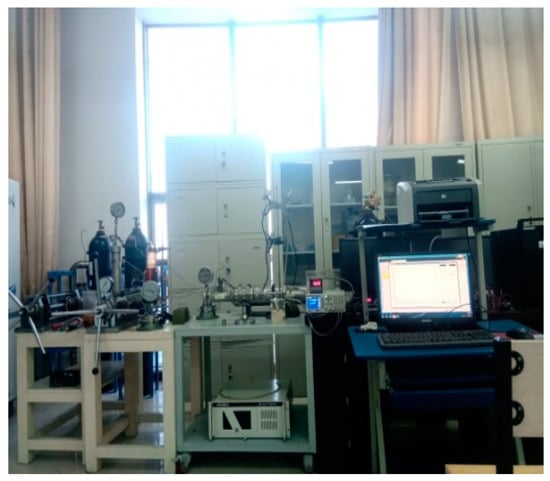
Figure 3.
Self-developed breakthrough pressure test instrument.
- (1)
- The core was evacuated and saturated with water and the volume of water used up for saturation was recorded;
- (2)
- The saturated sample was moved to the intermediate container, pressurized to 5 MPa and left for 24 h to fully saturate the rock samples;
- (3)
- The rock sample was placed into the core gripper and the experimental device was connected; the confining pressure was set according to the reservoir conditions;
- (4)
- The gas source was connected to the inlet end of the core holder, the starting differential pressure and back pressure were set, and the pressure was gradually increased at certain time intervals;
- (5)
- During the measurement, the situation at the outlet end of the rock sample was detected by the bubble monitoring device; when the bubbles escaped uniformly and continuously, the corresponding pressure difference between the inlet and outlet ends of the rock sample was the gas breakthrough pressure of the rock sample. The test temperature was the reservoir temperature
where the water saturation of the core is calculated using Equation (1), where denotes water saturation, denotes water volume, and denotes pore volume.
2.2. Analysis of Experimental Results
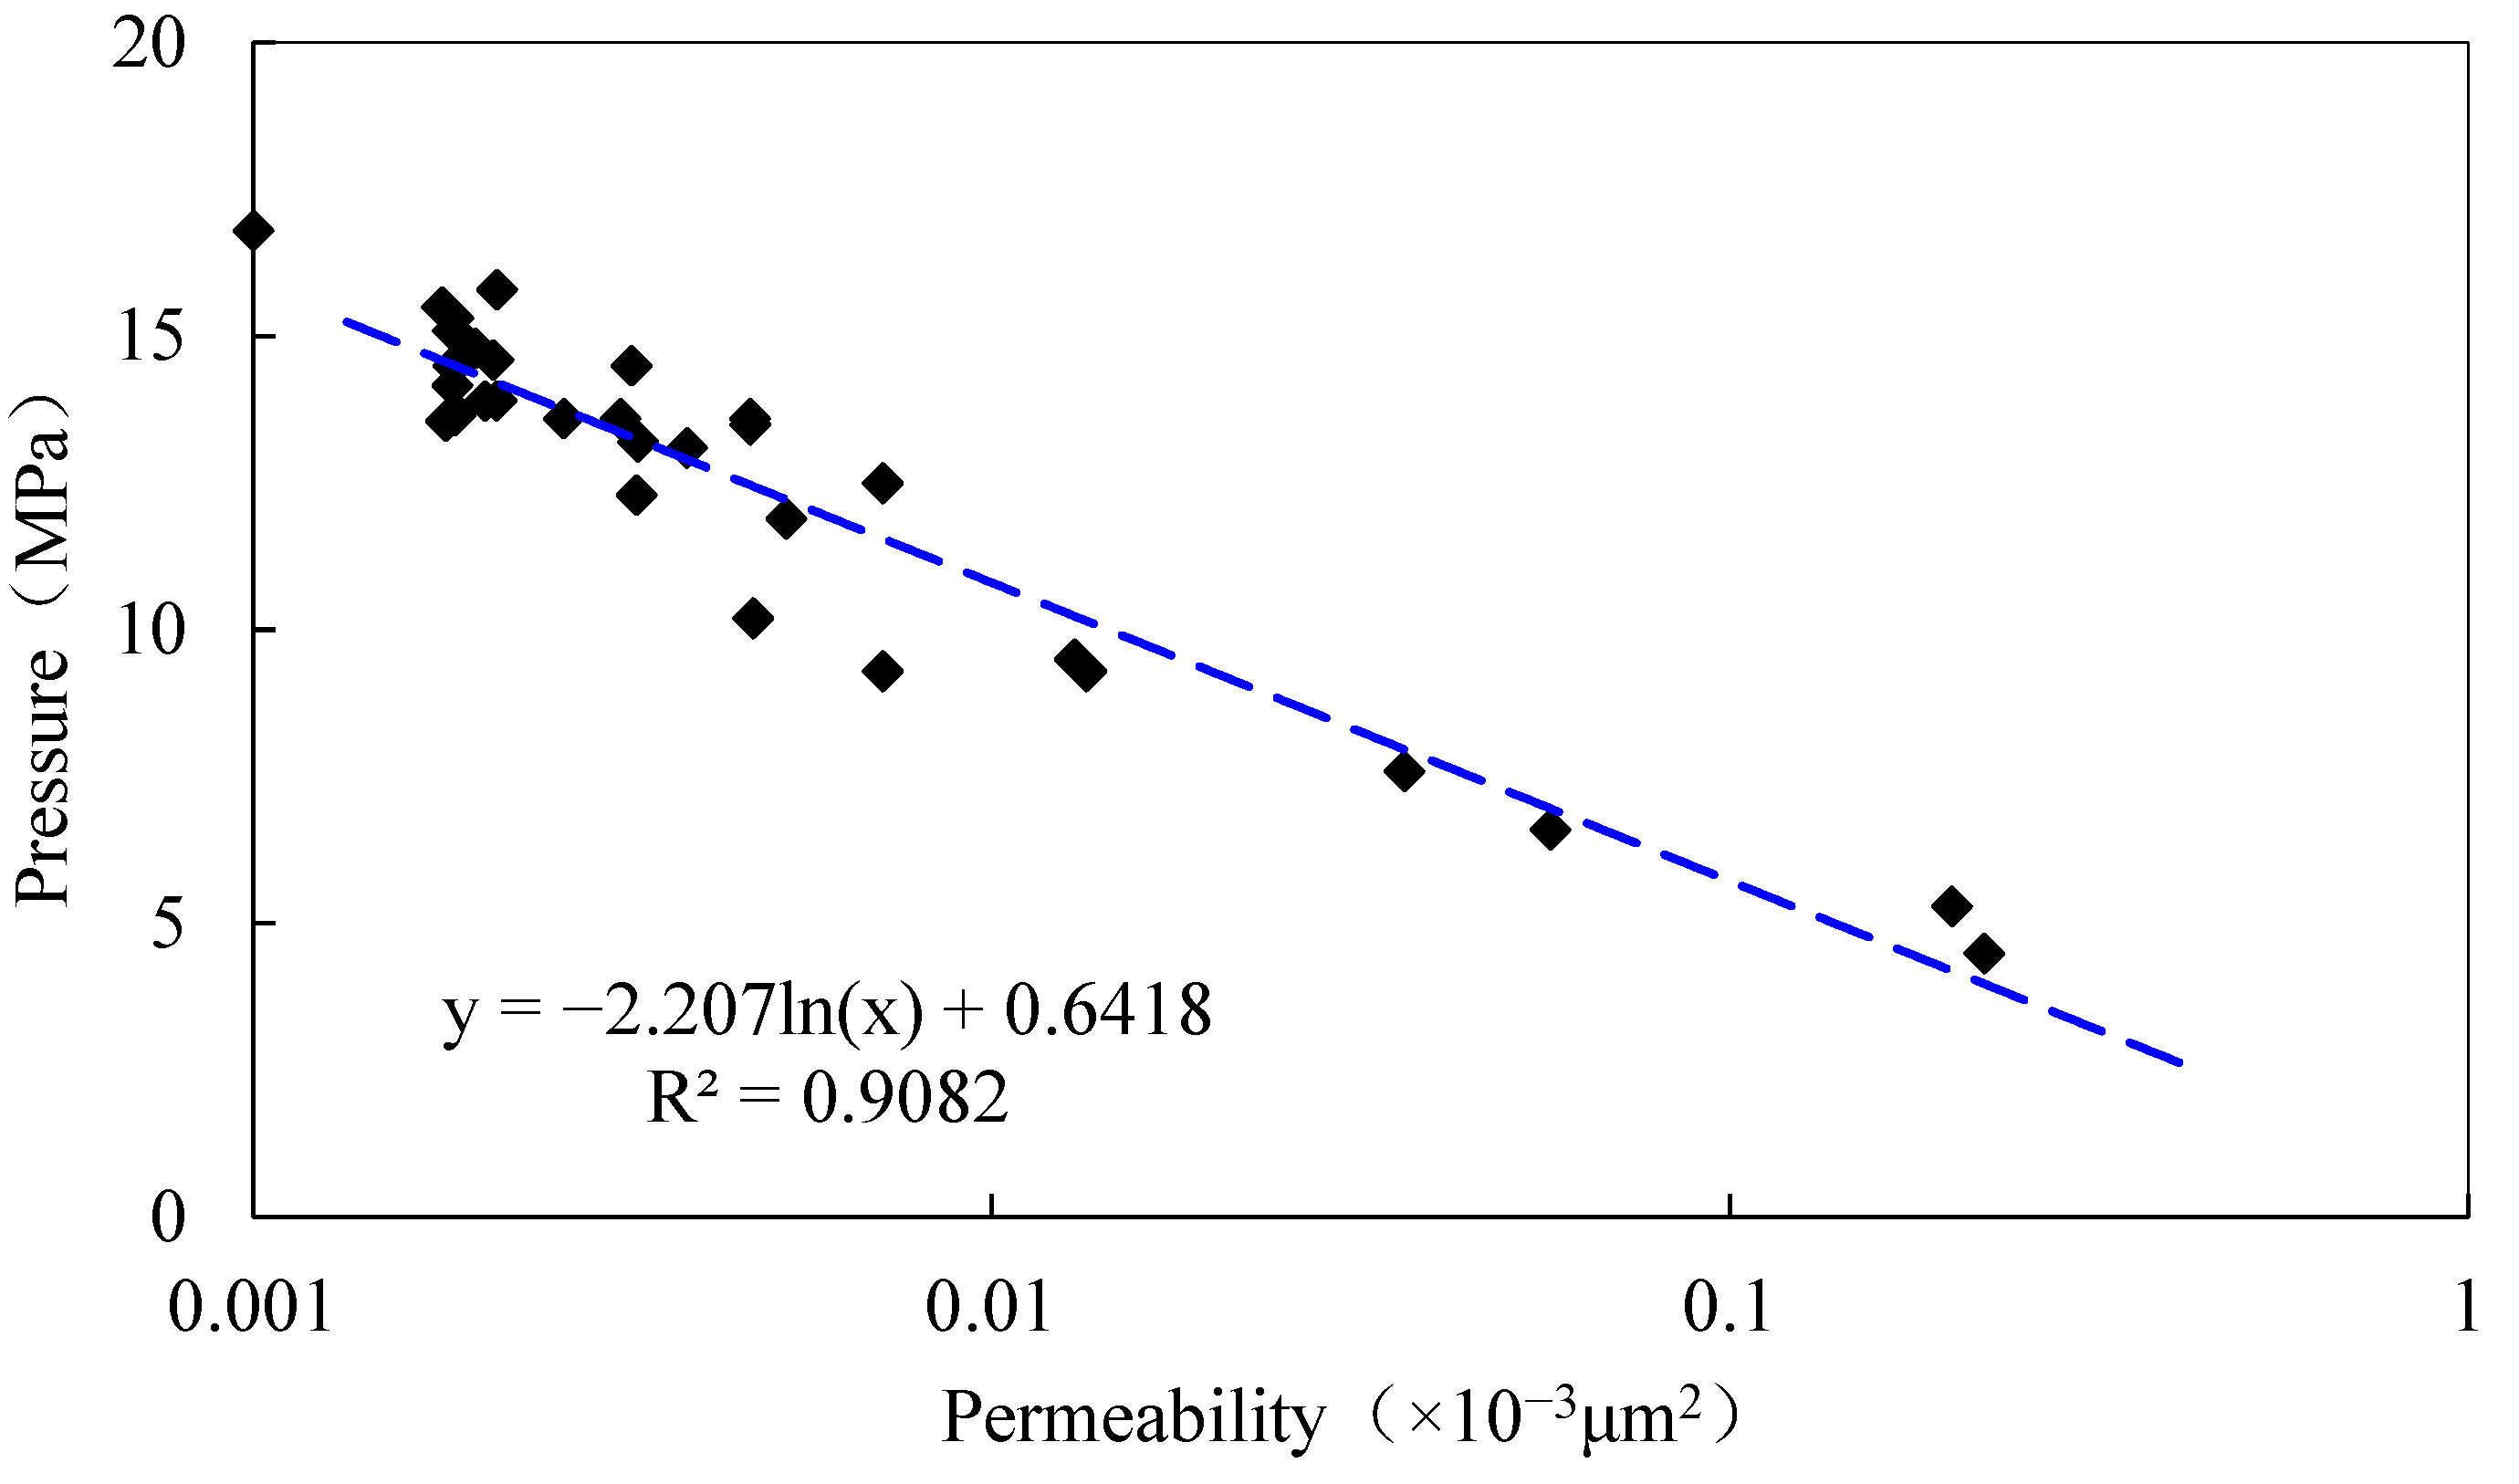
The results of the core gas breakthrough pressure test are shown in Figure 4.
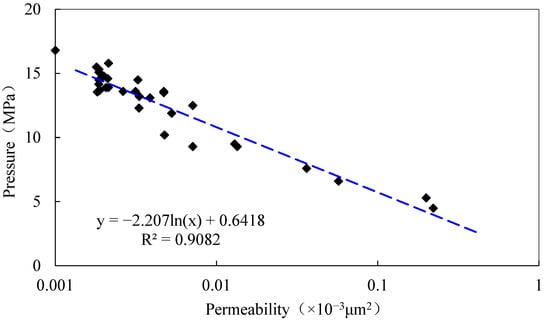
Figure 4.
Variation of breakthrough pressure with penetration rate.
As can be seen in Figure 4, the value of the caprock core gas breakthrough pressure decreases with increasing core permeability (or porosity). When the core gas permeability is 0.001~0.221 × 10⁻³μm2, the caprock core gas breakthrough pressure is 4.5~16.8 MPa. The gas breakthrough pressure of the caprock core has a good correlation with the permeability of the core gas measurement. The relationship between gas breakthrough pressure P and permeability K satisfies the following:
where the values of a and b are −2.207 and 0.6418, respectively.
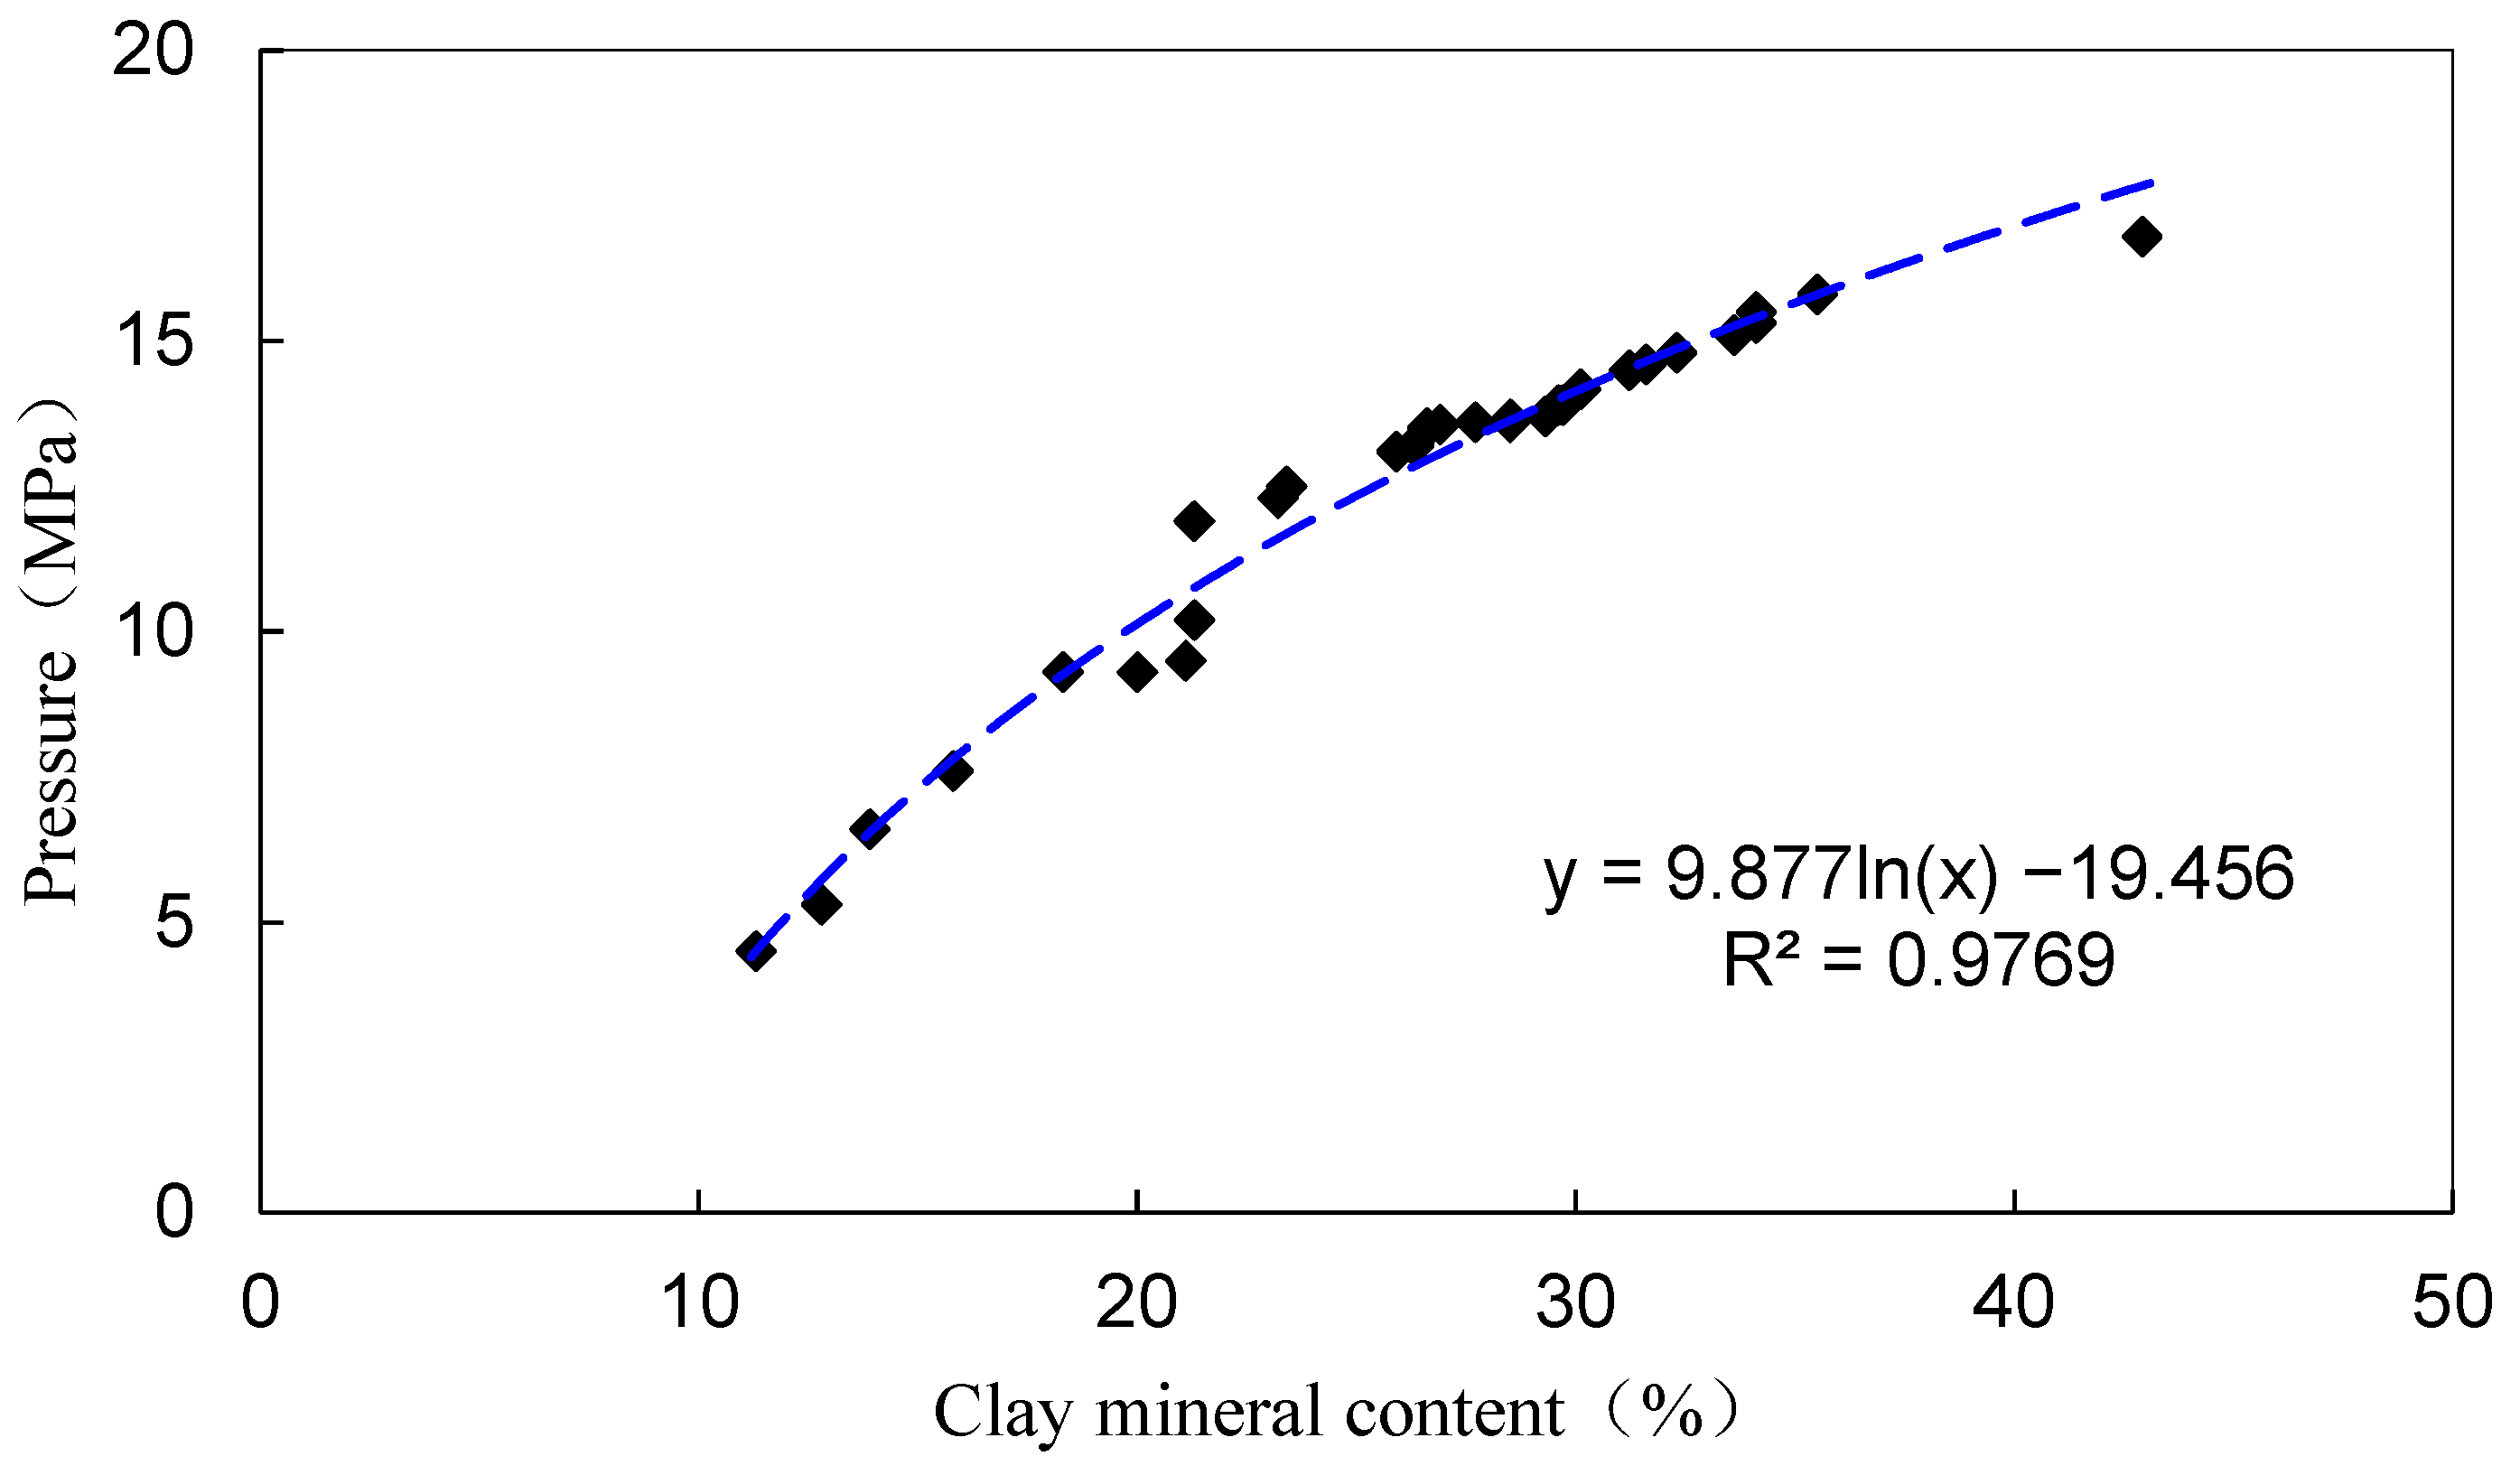
The experiments were carried out using an X-ray diffractometer for the determination and analysis of mineral components. The results of analyzing the core components of an excerpted well formation are shown in Table 1, and the relationship curve between gas breakthrough pressure and clay mineral content of the cap core is plotted according to the test results of the cap components in Table 1, as shown in Figure 5.

Table 1.
X-ray diffraction analysis of whole rock minerals from a well.
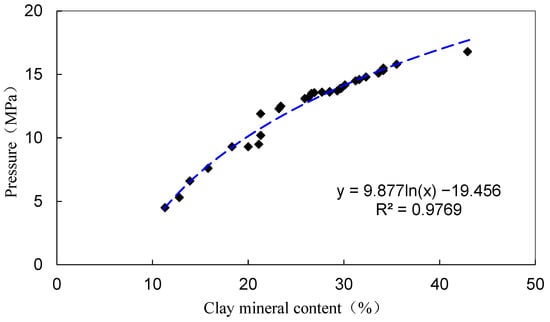
Figure 5.
Fitted plot of breakthrough pressure versus clay mineral content.
3. Digital Core Model Construction
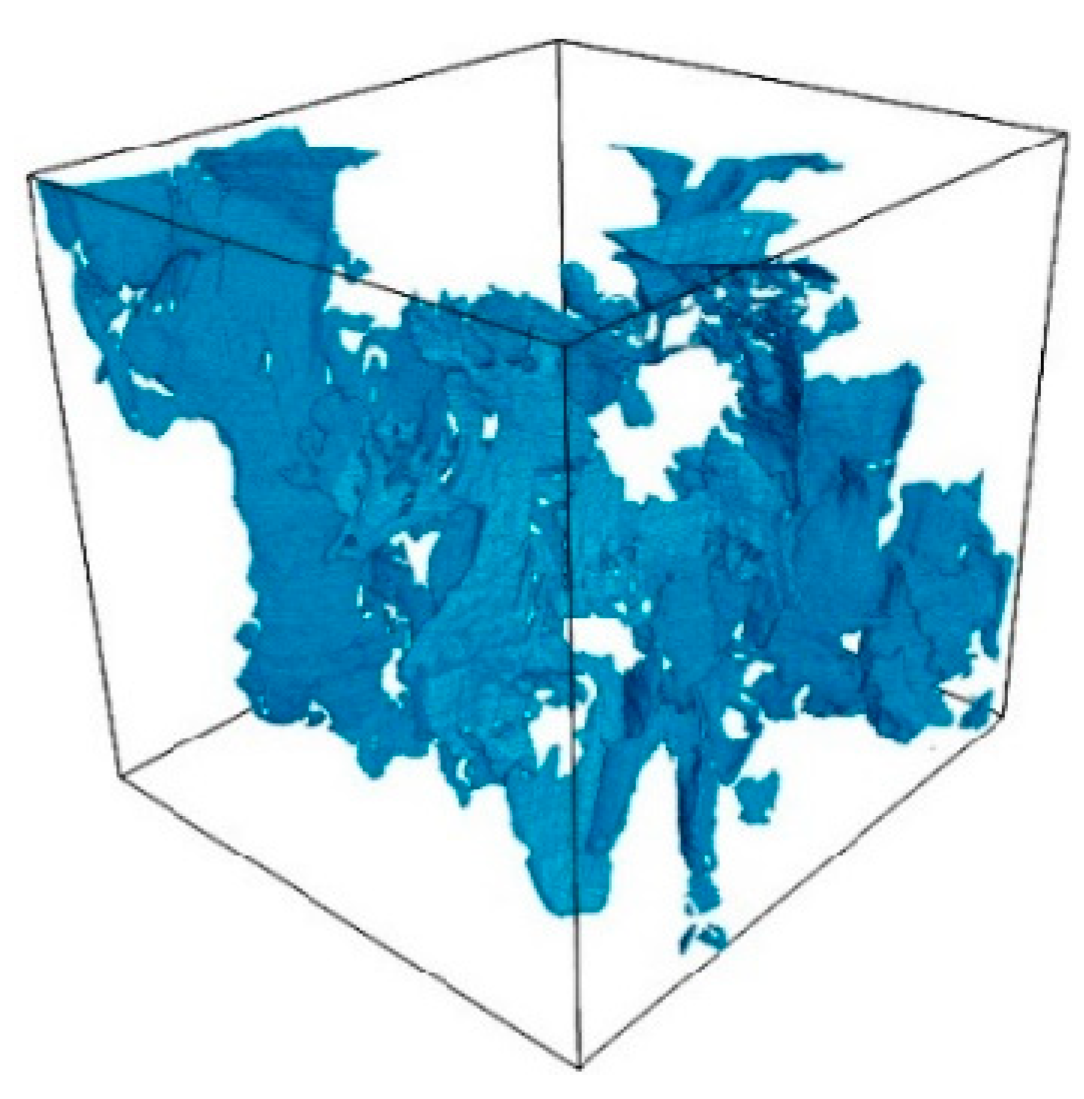
The test core was taken from a well in Daqing at a sampling depth of 678.5 m and a sample size of 2.52 cm (diameter) × 1.51 cm (height). The porosity and gas permeability were 2.52% and , respectively. Considering that most of the mudstone pores are nano-pore throat systems, and the maximum resolution of the current micron CT and nano CT is only about 500 nm, respectively, which cannot satisfy the accurate 3D imaging of nano-pores in the dense reservoirs well, we therefore used a Helios 650 focused ion beam scanning electron microscope from FEI to image the porous mudstone with a scanning resolution of 2 nm and a scanning area size of 15.18 μm (length) × 11.4 μm (width) × 16 μm (height). Image processing and 3D reconstruction of the FIB-SEM slice images were performed by Avizo software (https://www.thermofisher.com/rs/en/home/electron-microscopy/products/software-em-3d-vis/3d-visualization-analysis-software.html, accessed on 15 August 2024), and in order to improve the accuracy of the brightness thresholding method for segmenting the images, the threshold range was determined against the measured porosity of the samples. After noise reduction and segmentation, the 2D slices were read through the volume rendering module of Avizo and subjected to volume rendering (Figure 6 and Figure 7).

Figure 6.
Digital core model.
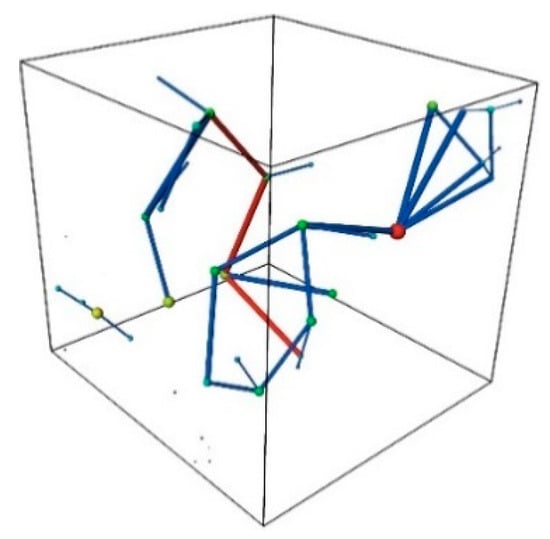
Figure 7.
Ball-and-stick network modelling from digital core models.
4. Numerical Simulation of Fluid Mechanics
It is assumed that the two-phase flow in the core conforms to Darcy’s law, and that the core is homogeneous. Most of the models we simulated had a grid size of 4 million and around 3 million nodes, using the Coupled algorithm. Least Squares Cell-Based was chosen for the spatial discretization of the gradient, PRESTO format for the pressure term, and First Order Upwind format for the momentum equation. The residuals of all the programs are less than 1 × 10⁻⁵. In the boundary condition setup, the outlet is the pressure outlet (pressure is generally set to 0) and inlet is velocity inlet. The inlet velocity is set to 0.005 m/s. The simulation assumes that the two-phase flow in the core conforms to Darcy’s law, and the core is homogeneous and isotropic; To clarify the effect of different sensitivity factors on the breakthrough pressure, a small model is intercepted accordingly in the fib-sem model based on different sensitivity factors, and multiphase flow simulation is carried out.
4.1. Theory and Methodology
The VOF method [22,23,24,25] is a computational fluid dynamics-based flow simulation method discretized by the finite volume method. It is mainly used to simulate the flow process of multiphase fluids in complex geometries, and is particularly applicable to the study of natural gas and water flow within porous media in subsurface rocks. The core idea of the method is to describe the process of variation of two-phase flow field parameters by constructing a series of partial differential equations. In the VOF method, by dividing the fluid domain into different grid cells, physical quantities can be discretized on the grid cells to obtain numerical solutions. During the flow of natural gas and water within the porous medium of subsurface rock, the main factors affecting the flow include viscous forces, capillary forces, and gravity. The VOF method solves the two-phase flow of an incompressible Newtonian fluid by coupling the continuity equation with the Navier-Stokes equations to obtain pressure and velocity variations in the flow field. The governing equations are [26]:
where denotes the velocity vector, m/s; t denotes the time, s; p denotes the pressure, N/; ρ denotes the density, kg/; g denotes the gravitational acceleration, m/; μ denotes the viscosity, mPa·s; and denotes the interfacial force acting on the phase interface, N/.
The basic principle of the VOF method to capture the fluid interface is to use the fluid volume fraction (α) to characterize the distribution of the two-phase fluid in the computational region. The fluid volume fraction (α) is defined as the percentage of the mesh volume occupied by the fluid volume of each phase and takes values from 0 to 1. The phase transport equation for the fluid volume fraction (α) is expressed as
where denotes the compression velocity, m/s, which depends on the maximum velocity in the interfacial domain, and α denotes the fluid volume fraction.
4.2. Analysis of Simulation Results
The starting differential pressure is determined by the gas permeability of the core model, and the pressure is gradually increased in the simulation software until the residual water saturation at the outlet end decreases slightly, at which time the pressure difference between the two ends of the model is considered to be the breakthrough pressure of the model. Figure 6 shows the curve of residual water saturation at the outlet end in the process of gas-driven water, and the breakthrough time can be calculated through the data table generated by the simulation.
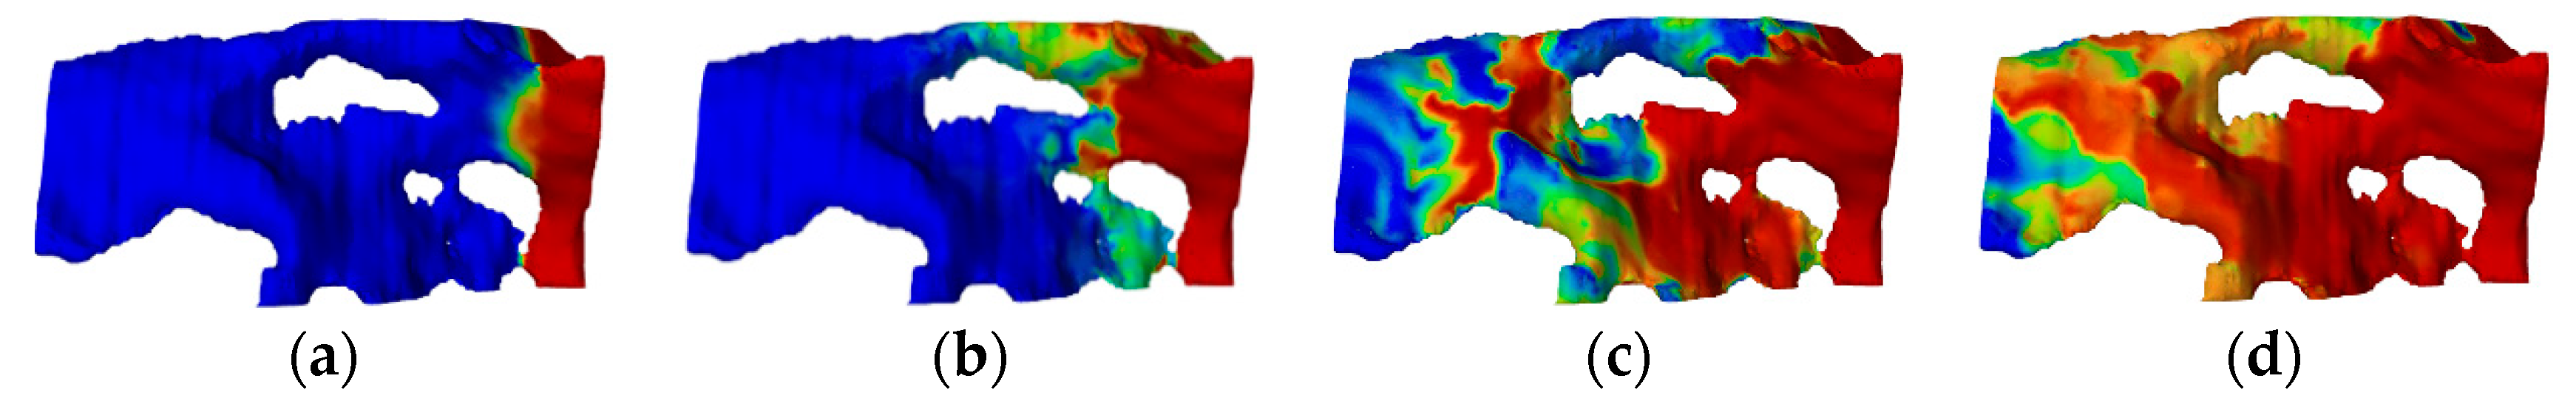
Figure 8a–d shows the simulation results of the gas volume saturation diagrams, and it can be observed that there is a clear finger-in phenomenon during the gas expulsion from the right inlet end to the left outlet end. From the microscopic model, the gas forms a dominant pathway in the pathway with larger pore throat radius due to capillary forces. From the macroscopic scale, it is possible to reveal the principle of breakthrough pressure determination: the gas always breaks through outward along one or more pore channels with less resistance. Therefore, in order to accurately determine the breakthrough pressure of the cap layer, it is necessary to have a very deep understanding of the geology of the region, and the experiment should select rock samples extensively to determine the inhomogeneity of the rocks in the region.

Figure 8.
Simulation of gas volume saturation (a–d).
In order to verify the accuracy of the simulation experiment, the breakthrough pressure of the original sample was measured using self-developed breakthrough pressure test instruments (Figure 9) according to the standard of “Determination of rock gas breakthrough pressure” before the electron microscope scanning, and the result of the breakthrough pressure was 14.2 MPa, which is basically the same as that of 14 MPa obtained by the simulation software. As can be seen in Figure 7, the numerical simulation calculates a lower value of gas breakthrough pressure in the caprock core compared to the physical simulation test. Overall, the difference between the two is not significant, with an average single-point error of 16.1% and an average breakthrough pressure error of 1.9%. After analyzing the results of the main sample, five different parts of the same rock sample were selected to simulate the breakthrough pressure, and the error in the experimental results was within 10%. Therefore, it is considered feasible and accurate to determine breakthrough pressure using this method.
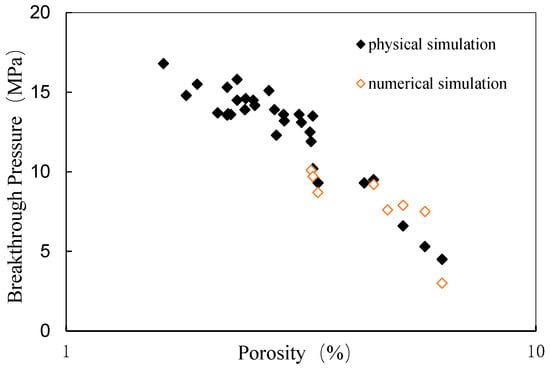
Figure 9.
Comparison of physical and numerical simulation results.
4.3. Sensitivity Analysis
Based on the breakthrough pressure measurement method, simulations of different operating conditions can be performed to test the accuracy of the method.
- (1)
- Average pore radius
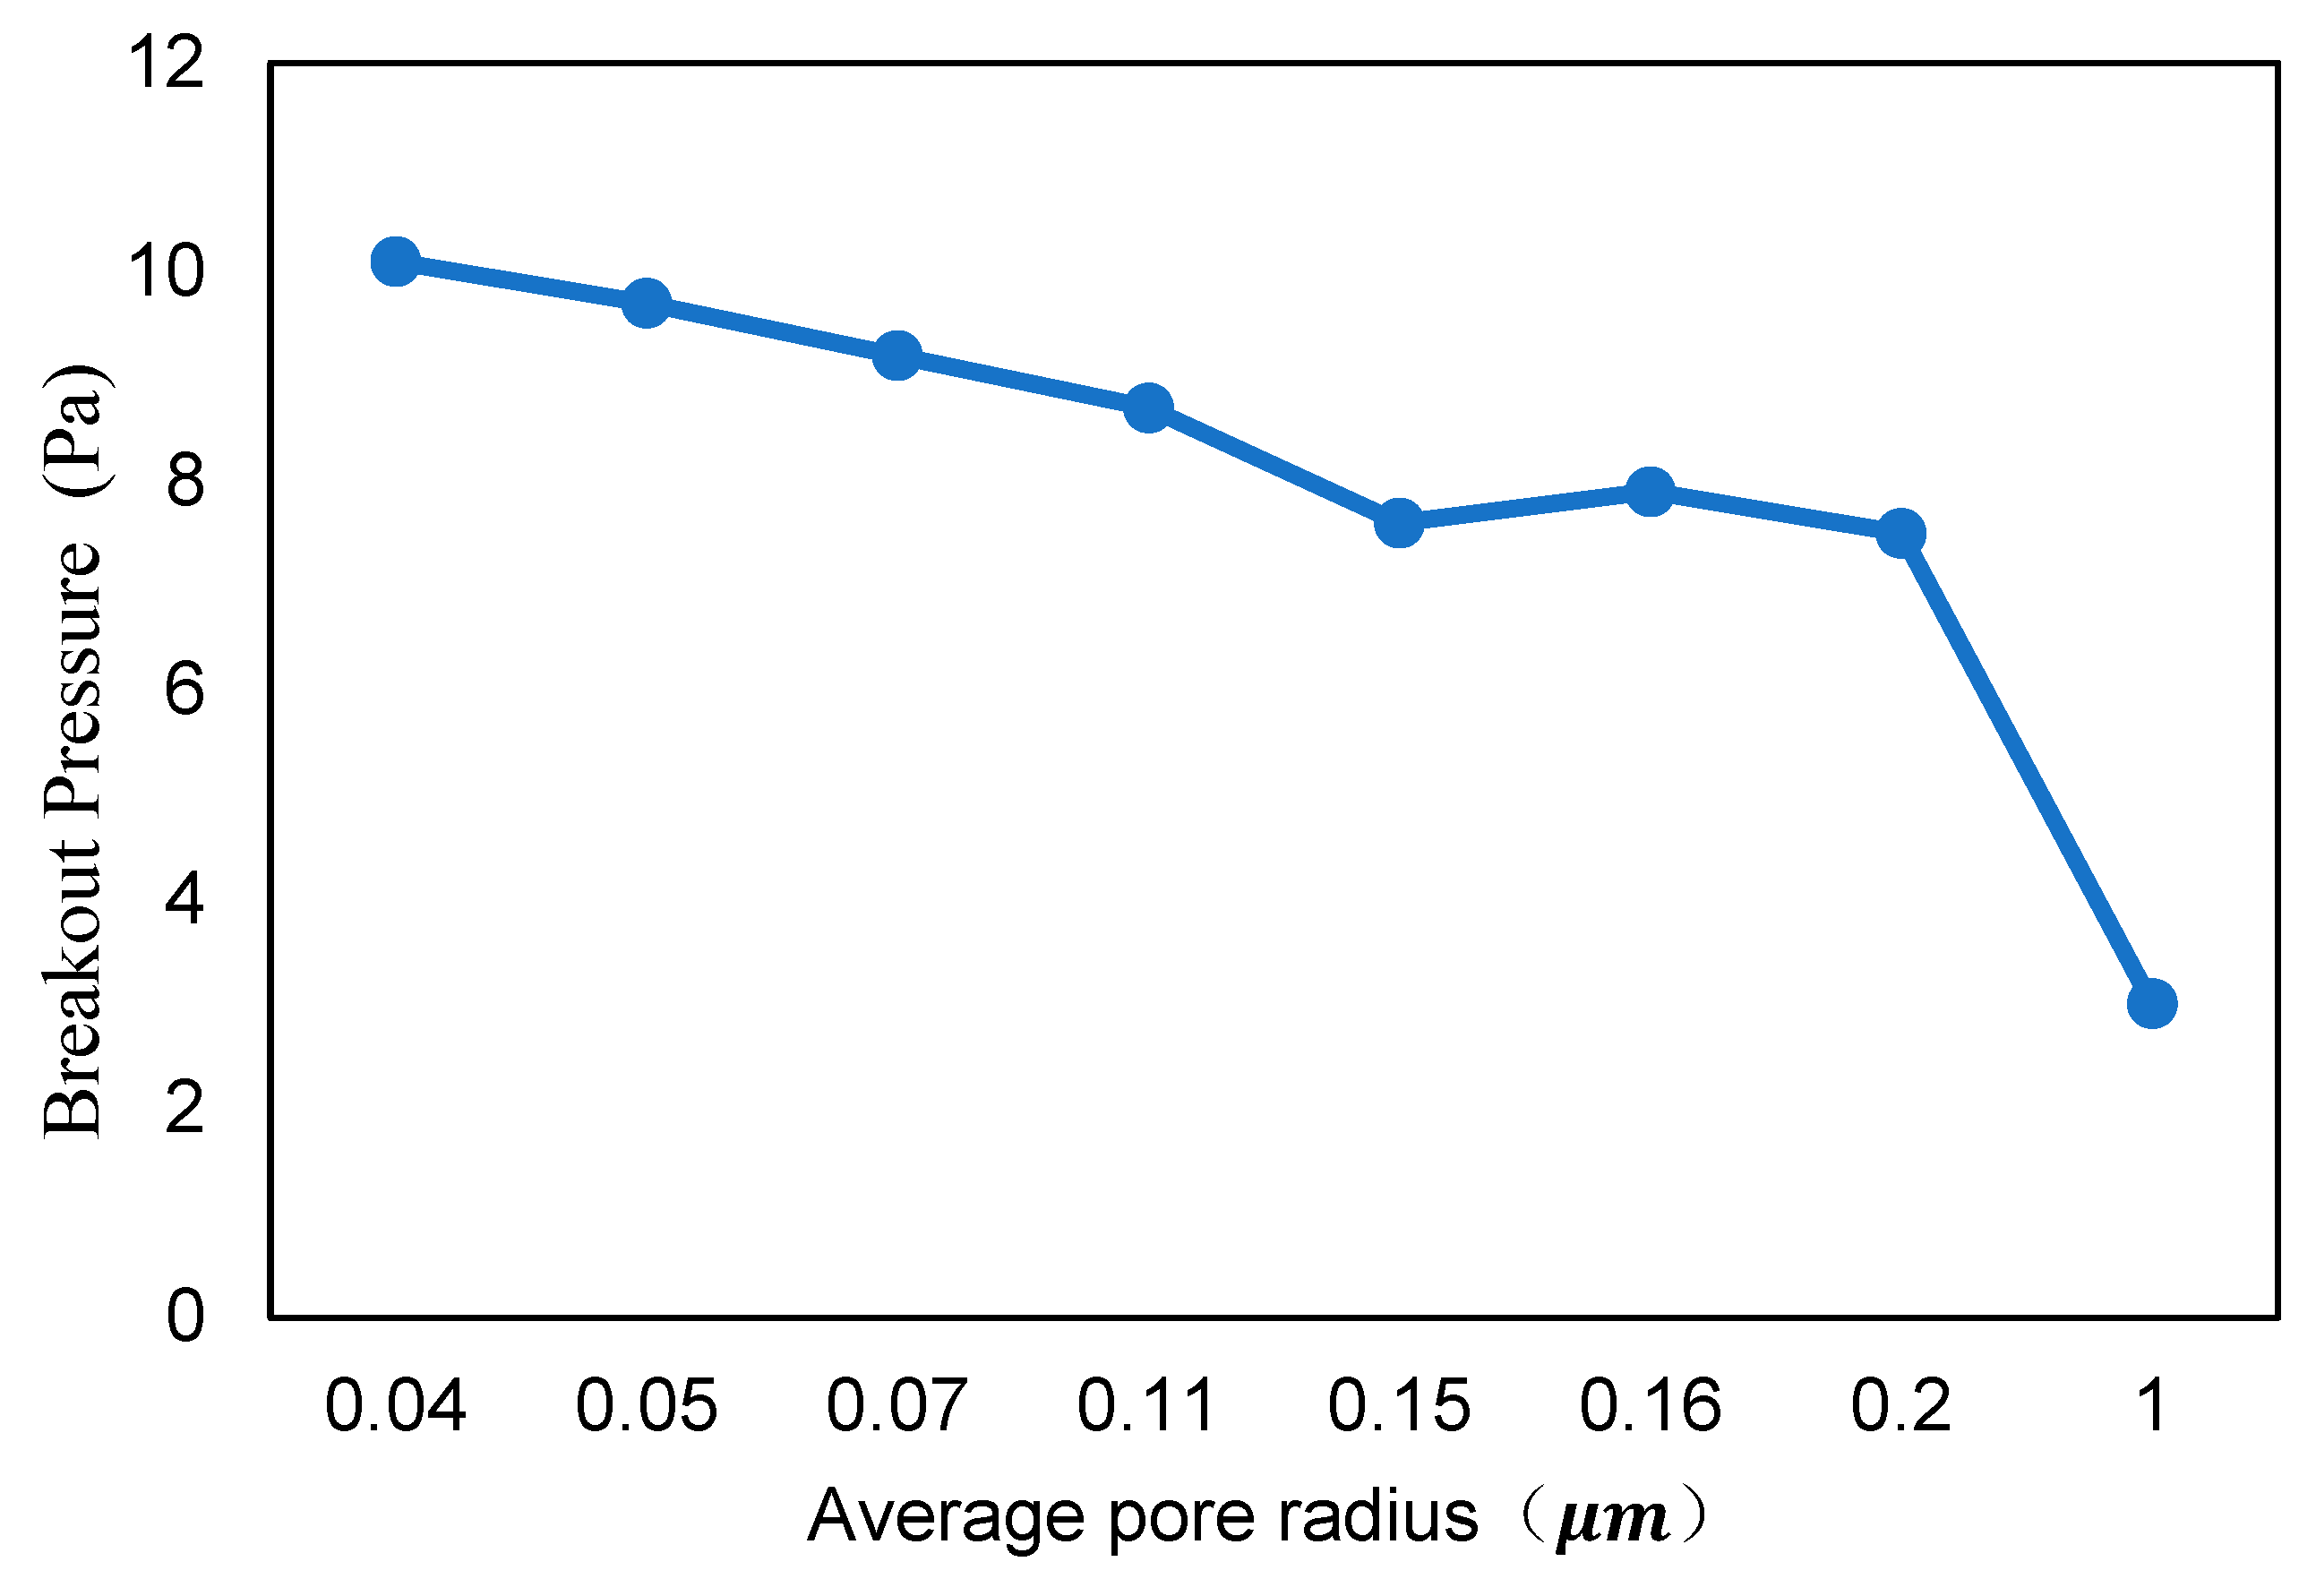
Seven groups of different pore radii were set up, nine models with the same pore radius were selected for each group, and the average value of the breakthrough pressure of multiple equal-radius models was taken as the corresponding pore radius breakthrough pressure. It can be seen that the breakthrough pressure was 7.5 MPa for a radius of 0.2 μm and 10.1 MPa for a radius of 0.04 μm (Figure 10), and that the average pore radius was the key factor affecting the breakthrough pressure (Figure 11).
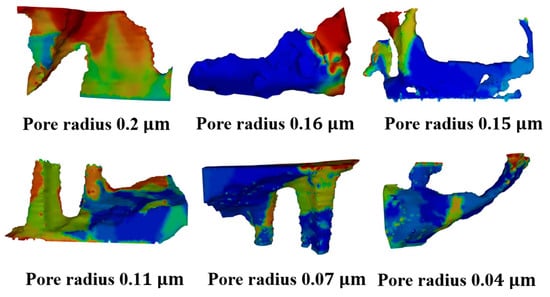
Figure 10.
Simulation plots for different pore radius models.
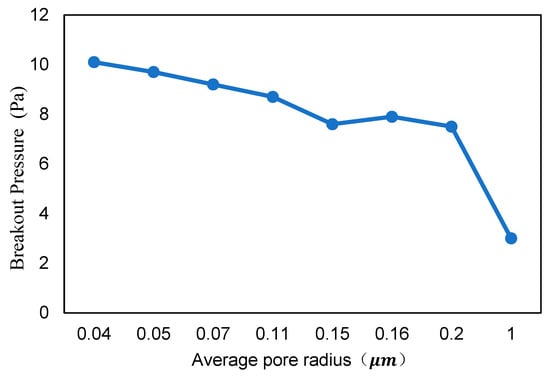
Figure 11.
Effect of pore radius on breakthrough pressure.
- (2)
- Wettability
Five different contact angles were set, namely 0°, 45°, 90°, 135°, and 180° (Figure 12), and the simulation results showed that with the increase in natural gas wetting degree on the rock, the natural gas drive-off speed was accelerated, the gas breakthrough capacity was gradually increased, and the breakthrough pressures were reduced by 22% and 38%, with the wetting angles ranging from 0° to 45° and from 135° to 180°, respectively (Figure 13).
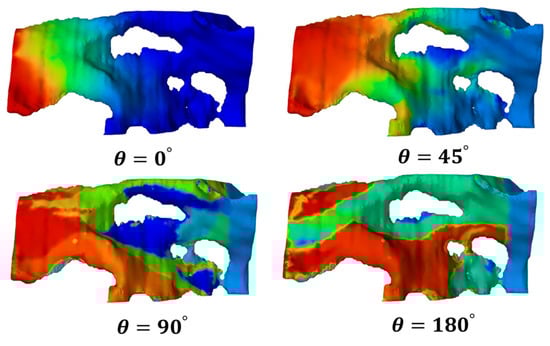
Figure 12.
Simulation plots for different wetting angle models.
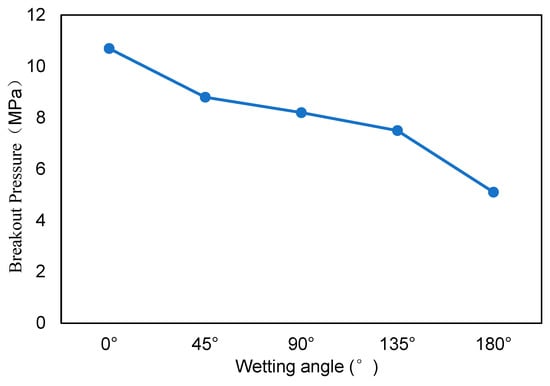
Figure 13.
Effect of wetting angle on breakthrough pressure.
- (3)
- Roughness height
The effect of pore roughness on breakthrough pressure was analyzed by adjusting the model roughness height (Figure 14). As the roughness height increased from 0.5 nm to 1.5 nm, the breakthrough pressure increased by 0.61 MPa (Figure 15).
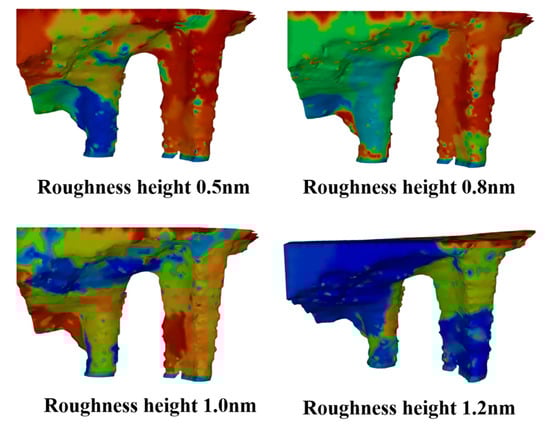
Figure 14.
Simulation plots for different roughness height models.

Figure 15.
Effect of roughness height on breakthrough pressure.
- (4)
- Viscosity ratio
The viscosity ratio of two-phase fluids is a very important parameter in seepage in porous media (Figure 16), and the characteristics of wetted-phase and non-wetted-phase seepage are analyzed by adjusting the viscosity ratio of wetted-phase and non-wetted-phase. With the increase in the viscosity ratio of natural gas and formation water, the breakthrough pressure decreases significantly (Figure 17), and the actual calculation of the breakthrough pressure should fully consider the gas viscosity change.
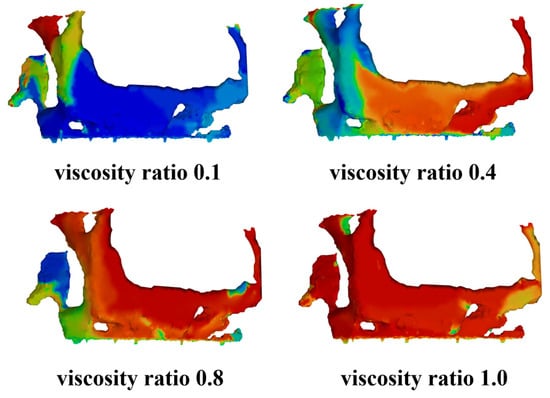
Figure 16.
Simulation plots for different viscosity ratio models.
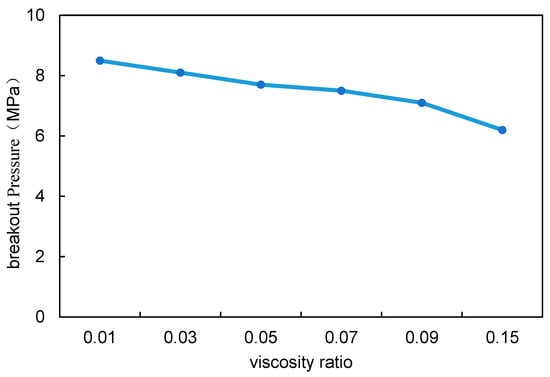
Figure 17.
Effect of viscosity ratio on breakthrough pressure.
5. Conclusions
- (1)
- Under the conditions of stratigraphic pressure, the permeability of the caprock core is 0.001~0.221 × 10⁻³μm2, and the porosity is 1.6~6.3%;
- (2)
- The breakthrough pressure of the caprock core is 4.5–16.8 MPa, with the increase in permeability (or porosity) of the core, the breakthrough pressure decreases; with the increase in clay content, the breakthrough pressure increases; the gas breakthrough pressure P and permeability (porosity or clay mineral content) x satisfy the logarithmic function, i.e., P = ;
- (3)
- Compared with the physical simulation test, the numerical simulation calculates a lower value of gas breakthrough pressure in the caprock core. Overall, the difference between the two is not significant, with an average single-point error of 16.1% and an average breakthrough pressure error of 1.9%.
Author Contributions
Methodology, T.G.; Software, X.W.; data curation, C.G.; writing—original draft, H.W.; writing—review and editing, Z.Z.; supervision, Z.Y. All authors have read and agreed to the published version of the manuscript.
Funding
This research was funded by Heilongjiang Provincial Key R&D Program Projects (GA23A914).
Data Availability Statement
The data presented in this study are available on request from the corresponding author (The data are not publicly available due to privacy restrictions).
Conflicts of Interest
Authors Tao Gao, Xiaoqiang Wang, Haiyan Wang and Chao Gu are employed by the Daqing Oilfield Co Ltd. The remaining authors declare that the research was conducted in the absence of any commercial or financial relationships that could be construed as potential conflicts of interest.
References
- Andrews, B.T.; Levy, M.L.; Dillon, W.; Weinstein, P.R. Unilateral normal perfusion pressure breakthrough after carotid endarterectomy. Neurosurgery 1987, 21, 568–571. [Google Scholar] [CrossRef] [PubMed]
- Day, A.L.; Friedman, W.A.; Sypert, G.W.; Mickle, P.J. Successful treatment of the normal perfusion pressure breakthrough syndrome. Neurosurgery 1982, 11, 625. [Google Scholar] [CrossRef] [PubMed]
- Givens, J.A. Temperature-Based Breakthrough Detection and Pressure Swing Adsorption Systems and Fuel Processing Systems Including the Same. U.S. Patent No. 7,393,382, 1 July 2008. [Google Scholar]
- Gutierrez-Rodrigo, V.; Villar, M.V.; Martin, P.L.; Romero, F.J.; Barcala, J.M. Gas-breakthrough pressure of FEBEX bentonite. Geol. Soc. Lond. Spec. Publ. 2015, 415, 47–57. [Google Scholar] [CrossRef]
- Halbach, V.V.; Higashida, R.T.; Hieshima, G.B.; Norman, D. Normal perfusion pressure breakthrough occurring during treatment of carotid and vertebral fistulas. Am. J. Neuroradiol. 1987, 8, 751. [Google Scholar]
- Heath, J.E.; Dewers, T.A.; Mcpherson, B.J.O.L.; Nemer, M.B.; Kotula, P.G. Pore-lining phases and capillary breakthrough pressure of mudstone caprocks: Sealing efficiency of geologic CO2 storage sites. Int. J. Greenh. GasControl. 2012, 11, 204–220. [Google Scholar] [CrossRef]
- Lopes, F.V.S.; Grande, C.A.; Rodrigues, A.E. Activated carbon for hydrogen purification by pressure swing adsorption: Multicomponent breakthrough curves and PSA performance. Chem. Eng. Sci. 2011, 66, 303–317. [Google Scholar] [CrossRef]
- Ma, Y.; Li, J.; Zhang, Z.; Wang, X. Evaluating Breakthrough Pressure in Gas Diffusion Layers of Proton Exchange Membrane Fuel Cells. J. Therm. Sci. 2010, 19, 79–84. [Google Scholar] [CrossRef]
- Mayer, R.P.; Stowe, R.A. Mercury porosimetry—Breakthrough pressure for penetration between packed spheres. J. Colloid Sci. 1965, 20, 893–911. [Google Scholar] [CrossRef]
- Mortazavi, M.; Tajiri, K. Liquid water breakthrough pressure through gas diffusion layer of proton exchange membrane fuel cell. Int. J. Hydrogen Energy. 2014, 39, 9409–9419. [Google Scholar] [CrossRef]
- Rezaeyan, A. Parametric analysis of caprock integrity in relation with CO2 geosequestration: Capillary breakthrough pressure of caprock and gas effective permeability. Greenh. Gases Sci.Technol. 2015, 5, 714–731. [Google Scholar] [CrossRef]
- Li, S.; Dong, M.; Li, Z.; Huang, S.; Qing, H.; Nickel, E. Gas breakthrough pressure for hydrocarbon reservoir seal rocks: Implications for the security of long-term CO2 storage in the Weyburn field. Geofluids 2005, 5, 326–334. [Google Scholar] [CrossRef]
- Sekhon, L.H.S.; Morgan, M.K.; Spence, I. Normal perfusion pressure breakthrough: The role of capillaries. J. Neurosurg. 1997, 86, 519–524. [Google Scholar] [CrossRef] [PubMed]
- Rangel-Castilla, L.; Spetzler, R.F.; Nakaji, P. Normal Perfusion Pressure Breakthrough Theory. Neurosurgery 1978, 38, 399–405. [Google Scholar]
- Spetzler, R. Normal perfusion pressure breakthrough theory. Clin. Neurosurg. 1978, 25, 651–672. [Google Scholar] [CrossRef] [PubMed]
- Liu, Y.; Tang, J.; Wang, M.; Wang, Q.; Tong, J.; Zhao, J.; Song, Y. Measurement of Interfacial Tension of CO2 and NaCl Aqueous Solution over Wide Temperature, Pressure, and Salinity Ranges. J. Chem. Eng. Data ACS J. Data 2017, 62, 1036–1046. [Google Scholar] [CrossRef]
- Zhang, N.; Wang, H.; Wang, S.; Wang, S.; Guo, Y.; Xun, X. Experimental study on the evolution law of pore structure and mechanical properties of mudstone under the effect of water rock chemistry. J. Porous Media 2023, 26, 1–22. [Google Scholar] [CrossRef]
- Guignard, S.; Grilli, S.T.; Marcer, R. Computation of shoaling and breaking waves in nearshore areas by the coupling of BEM and VOF methods In Proceedings of the ISOPE International Ocean and Polar Engineering Conference, Brest, France, 30 May 1999.
- Kim, M.S.; Lee, W.I. A new VOF-based numerical scheme for the simulation of fluid flow with free surface. Part I: New free surface-tracking algorithm and its verification. Int. J. Numer. Methods Fluids 2003, 42, 765–790. [Google Scholar] [CrossRef]
- Theodorakakos, A.; Bergeles, G. Simulation of sharp gas–liquid interface using VOF method and adaptive grid local refinement around the interface. Int. J. Numer. Methods Fluids 2004, 45, 421–439. [Google Scholar] [CrossRef]
- Zhang, X.; Duveau, G.; Colliat, J.B. Numerical modeling of gas breakthrough pressure in water-saturated argillite and gas migration pathways. In Proceedings of the 50th US Rock Mechanics/Geomechanics Symposium 2016, Houston, TX, USA, 26–29 June 2016. [Google Scholar]
- Sha, B.; Jia, Z. A very robust MMALE method based on a novel VoF method for two-dimensional compressible fluid flows. Comput. Math. Appl. 2024, 160, 86–107. [Google Scholar] [CrossRef]
- Yang, Y.; Wang, J.; Wang, J.; Zhang, Q.; Yao, J. Pore-scale numerical simulation of supercritical CO2-brine two-phase flow based on VOF method. Nat. Gas Ind. B 2023, 10, 466–475. [Google Scholar] [CrossRef]
- Song, R.; Sun, S.; Liu, J.; Yang, C. Pore scale modeling on dissociation and transportation of methane hydrate in porous sediments. Energy 2021, 237, 121630. [Google Scholar] [CrossRef]
- Liu, Y.; Ozbayoglu, E.M.; Upchurch, E.R.; Baldino, S. Computational fluid dynamics simulations of Taylor bubbles rising in vertical and inclined concentric annuli. Int. J. Multiph. Flow 2023, 159, 104333. [Google Scholar] [CrossRef]
- Tryggvason, G.; Scardovelli, R.; Zaleski, S. Direct Numerical Simulations of Gas–Liquid Multiphase Flows: Frontmatter; Cambridge University Press: Cambridge, UK, 2011. [Google Scholar]


Disclaimer/Publisher’s Note: The statements, opinions and data contained in all publications are solely those of the individual author(s) and contributor(s) and not of MDPI and/or the editor(s). MDPI and/or the editor(s) disclaim responsibility for any injury to people or property resulting from any ideas, methods, instructions or products referred to in the content. |
© 2024 by the authors. Licensee MDPI, Basel, Switzerland. This article is an open access article distributed under the terms and conditions of the Creative Commons Attribution (CC BY) license (https://creativecommons.org/licenses/by/4.0/).