Article

Geometric Evaluation of an Oscillating Water Column Wave Energy Converter Device Using Representative Regular Waves of the Sea State Found in Tramandaí, Brazil

by
Ana Paula Giussani Mocellin
1,
Maycon da Silveira Paiva
1,*,
Elizaldo Domingues dos Santos
1,
Luiz Alberto Oliveira Rocha
1,
Liércio André Isoldi
1,
Juliana Sartori Ziebell
2 and
Bianca Neves Machado
3
1
School of Engineering, Federal University of Rio Grande (FURG), Rio Grande 96203-900, RS, Brazil
2
Institute of Mathematics and Statistics, Federal University of Rio Grande do Sul (UFRGS), Porto Alegre 91509-900, RS, Brazil
3
Interdisciplinary Department, Federal University of Rio Grande do Sul (UFRGS), Tramandaí 95590-000, RS, Brazil
*
Author to whom correspondence should be addressed.
Processes 2024, 12(11), 2352; https://doi.org/10.3390/pr12112352
Submission received: 27 September 2024 / Revised: 19 October 2024 / Accepted: 24 October 2024 / Published: 26 October 2024
(This article belongs to the Special Issue Design and Utilization of Wind Turbines/Wave Energy Convertors)

Abstract

:
Aiming to contribute to studies related to the generation of electrical energy from renewable sources, this study carried out a geometric investigation of an oscillating water column (OWC) wave energy converter (WEC) device. The structure of this device consists of a hydropneumatic chamber and an air duct, where a turbine is coupled to an electrical energy generator. When waves hit the device, the air inside it is pressurized and depressurized, causing the air to flow through the duct, activating the turbine. In this sense, the present study used the constructal design method to evaluate the influence of the ratio between the height and length of the hydropneumatic chamber ( H 1 / L ) on the mean available hydropneumatic power ( P H ( R M S ) ). Fluent software was used to perform numerical simulations of representative regular waves from the sea state in the municipality of Tramandaí, southern Brazil, impacting the OWC. Thus, it was possible to identify the geometry that maximized the performance of the OWC WEC, with ( H 1 / L ) O = 0.3430 , yielding P H ( R M S ) = 56.66 W. In contrast, the worst geometry was obtained with H 1 / L = 0.1985 , where P H ( R M S ) = 28.19 W. Therefore, the best case is 101% more efficient than the worst one.

1. Introduction

As a result of population expansion and technological advances, there was an exponential increase in the use of fossil fuels, which are limited in resources and have significant environmental impacts, such as global warming and climate change [1]. Thus, researchers around the world are looking forward to reduce or eliminate the use of fossil fuels, such as the use of renewable energy sources for power generation, since they have a lower negative impact on the environment. Regarding renewable resources that remain underexplored, there is the energy contained in the sea waves, which are caused, mainly, by the tangential forces of the wind blowing over the surface of the water [2].
One way to extract this kind of energy is through wave energy converter (WEC) devices. In this sense, the oscillating water column (OWC) WEC device, which is the focus of this study, is a partially submerged hollow structure. The OWC consists of a hydropneumatic chamber, open to the sea below the free surface of the water, and an air duct, open to the atmosphere, where there is a turbine. Its operating principle consists of the pressurization and depressurization of the air inside the hydropneumatic chamber, caused by the incidence of the sea waves. Thus, the air is forced through the duct, activating the turbine that is coupled to an electric generator [3].
These devices are studied using different approaches: analytically, proposing theoretical analyses regarding fluid dynamic behavior; experimentally, carrying out tests in the laboratory or with real prototypes; or numerically, using numerical simulations of the physical operating principle of these devices, which provides extensive investigations without the costs associated with real experiments. The performance of the OWC can be analyzed, for instance, through geometric evaluation using the constructal design method, which is based on the constructal law developed by Adrian Bejan [4]. This law states that, for a finite-size flow system to persist in time (to live), its configuration must change in time such that it provides easier access to its currents [5,6].
Seeking to develop WEC technologies, several researchers have been dedicated to investigating aspects of the OWC device in recent years. Examples of these studies can be observed in the experimental field, for instance in Portillo et al. [7], who presented the model design and experimental tests of two types of OWC devices, the coaxial duct and the spar buoy; Zabihi et al. [8], who analyzed the elevation of the free surface inside the OWC chamber, where results showed that a decrease in the damping effect increases the sloshing energy inside the hydropneumatic chamber; Liu et al. [9], where an OWC model was tested considering a real impulse turbine connected to the air chamber and a numerical model was used to compare the performance of the OWC under irregular and regular waves.
Another approach that has been investigated is the hybridization of the OWC with the overtopping WEC, which, in turn, consists essentially of a ramp that directs the incident sea waves to a reservoir, where a low-head turbine is coupled to the device [10]. In this sense, it is worth highlighting that this hybrid device has been studied mainly in the experimental field, where several studies were carried out considering a laboratory-scale model of a breakwater project destined for the Port of Leixões in Portugal [11,12,13,14]. Additionally, Simonetti et al. [15] presented the experimental proof of concept of a hybrid device called an oscillating-overtopping water column (O2WC), a different model from that addressed in the other studies mentioned. Furthermore, Fenu et al. [16] proposed and experimentally investigated a new concept of a hybrid platform, which is composed of a buoy wind turbine integrated with three OWCs. The results indicate that the influence of wind loads positively affected the hydrodynamic response of the platform.
In the numerical field, which is the scope of the present paper, studies involving the OWC WEC have been published. Specifically, Hayati et al. [17] investigated the geometric parameters of an OWC, considering the characteristics of the waves from Faroor Island in the Persian Gulf, and the best geometry obtained presented an efficiency of 41.5% for extracting wave energy. Bloss et al. [18] applied the constructal design method to investigate the influence of three degrees of freedom on the performance of the device: the ratio of the height to length of the hydropneumatic chamber, the ratio of the height of the air duct to its diameter, and the ratio of the width of the hydropneumatic chamber to the width of the wave tank. Chen et al. [19] carried out a correlation study of the ideal width of the device chamber relative to the front wall draught of the OWC, where good agreements were found between the results predicted by the proposed adjusted formula and the data present in the literature. Lopez et al. [20] analyzed four shapes of the OWC device, including the classic shape, the stepped bottom device, the U-shaped device, and the L-shaped design, which presented the best performance, with a shallow entrance, a high horizontal chamber duct, and a wide vertical duct.
Regarding numerical studies, Mia et al. [21] analyzed the hydrodynamic efficiency of OWC devices with different configurations. The results showed that increasing the rear wall draught improves the hydrodynamic efficiency if the front wall draught is 0.25 times the water depth. Mocellin et al. [22] used constructal design to numerically evaluate the influence of the OWC geometry on its performance considering the incidence of realistic irregular waves that occurred in the municipality of Tramandaí, southern Brazil. De Lima et al. [23] carried out a study of an OWC device with five coupled hydropneumatic chambers, aiming to evaluate the impact of the chamber geometry on the total hydropneumatic power obtained. The best performance achieved an improvement of 98.6% in relation to the worst case analyzed.
It is worth highlighting that the proof of concept of the hybrid device that employs two operating principles for the WEC (the overtopping device and the OWC), was performed in Koutrouveli et al. [24], using a numerical study considering both regular waves and irregular waves. The hybrid device showed an efficient performance in terms of the conversion of available wave energy. Furthermore, another way to approach the OWC WEC is by considering it coupled to a breakwater structure. Specifically, Wan et al. [25] numerically investigated a device with this configuration, with the results revealing that the geometric parameters of this system have significant effects on the wave energy absorption efficiency. Yang et al. [26] numerically investigated the hydrodynamic performance of an OWC combined with a cylindrical caisson-type breakwater, in which the results indicate that this proposed half-open land-based OWC is adapted to absorb shorter nearshore waves.
Another approach for studies of OWC WEC devices, although less frequent, is the analytical approach. Zheng et al. [27] evaluated the hydrodynamic performance of an OWC device platform with multiple hydropneumatic chambers, revealing that a front wall with a smaller draft and a rear wall with a larger draft are beneficial to extend the high-efficiency performance range of the platform. Finally, it is worth noting that, as mentioned, there are several studies in the literature regarding the WEC addressed in this paper, namely, the OWC device. More examples of experimental studies are provided in [28,29,30,31,32,33,34,35]; additional numerical studies are described in [36,37,38,39,40,41,42,43,44,45,46].
Aiming to contribute to studies in the field of renewable energy, the present paper carries out a geometric investigation of the OWC device, considering the incidence of representative regular waves of the sea state that occurred in 2018 in the municipality of Tramandaí, state of Rio Grande do Sul (RS), southern Brazil. It is important to highlight that the wave characteristics were defined based on a statistical analysis of the most frequent sea state found in this region. Thus, for the geometric evaluation, the constructal design method was used to investigate the influence of the ratio between the height and length ( H 1 / L ) of the OWC hydropneumatic chamber on the mean available power ( P H   ( R M S ) ), seeking to identify the geometry that maximizes the performance of the WEC device. In total, 17 geometries based on the OWC WEC device installed off Pico Island, Portugal, were assessed. Finally, a comparison of the results obtained in the present study with those presented in Mocellin et al. [22] was performed, highlighting the differences observed in the fluid dynamic behavior of the OWC device when subjected to realistic irregular waves and representative regular waves of the same sea state. Furthermore, it is emphasized that this comparison is a novel contribution of the present study.

2. Mathematical and Numerical Modeling

The present study was carried out through numerical simulations of wave generation and propagation in a numerical channel using the fluid dynamics software Fluent [47], which is based on the finite volume method [48]. The multiphase volume of fluid (VoF) model proposed by Hirt and Nichols [49] was used to treat the phases of the interface, which include air and water. The VoF model represents the phases in a control volume using the concept of volumetric fraction ( α ), so that the sum of the phases in each volume must always equal one. Thus, there are three different states that each computational cell can present: (i) containing only water:
α w a t e r = 1 ,
(ii) containing only air:
α a i r = 1 ,
or, (iii) containing both phases:
α w a t e r + α a i r = 1 .
In addition, since the VoF model is used for immiscible fluids, the following holds:
α w a t e r = 1 α a i r .
Moreover, when VoF is used, a single set of equations is solved, which comprises the conservation equations of mass, volume fraction, and momentum. These equations are given by [50,51] as follows:
ρ t + ρ V = 0 ,
α t + α V = 0 ,
t ρ v + ρ v v = p + τ ̿ ρ g + S .
Here, ρ is the fluid density (kg/ m 3 ), t is time (s), v is the velocity vector (m/s), p is the static pressure (N/m2), τ ̿ is the stress deformation tensor (N/m2), and g is the gravity acceleration vector (m/s2). Moreover, S is the sink term, which is used to damp the energy of the waves as they reach the region at the end of the numerical channel, avoiding the reflection phenomenon. The sink term is defined by [52,53] as follows:
S = C 1 ρ V + 1 2 C 2 ρ V V 1 z z f s z b z f s x x s x e x s 2 ,
where C 1 and C 2 are the linear (s−1) and quadratic (m−1) damping coefficients, respectively; x is the horizontal position; z is the vertical position; V is the velocity along the z direction (m/s); z f s and z b are the respective vertical positions of the free surface and bottom of the channel (m); and x s and x e are the respective horizontal positions of the start and end of the numerical beach (m).
Additionally, it is worth mentioning that the damping coefficients were defined as C 1 = 20 s−1 and C 2 = 0 m−1, in accordance with Lisboa et al. [54]. It is important to highlight that, in the mentioned study, the numerical simulations were carried out by addressing the generation and propagation of regular and irregular waves using the Fluent software in order to analyze the functionality of the numerical beach tool. Thus, the region where the numerical beach is applied becomes a damping region that absorbs the reflected waves, especially when an open flow channel is considered. It is important to highlight that the open flow channel configuration will be discussed at a later moment, in Section 4, when the boundary conditions of the computational domain are presented.
Regarding the numerical methods used to solve Equations (5)–(7), the configuration defined is presented in Table 1. It is worth noting that this methodology was based on studies found in the literature, such as [22,23,44,55]. Furthermore, it is worth highlighting that the pressure-implicit with splitting of operators (PISO) scheme was used to handle the pressure–velocity coupling, which consists of a non-iterative transient procedure based on temporal precision [56]. Regarding the treatment of the advective terms, the first-order upwind method was adopted, in which the quantities on all faces of the volume are determined assuming that the value of a field variable at the center of the volume represents the average value of this variable along the control volume [57]. It is also worth mentioning that the flow was considered under a laminar regime, as it is an adequate approximation in relation to the real problem, which helps to reduce the processing time and facilitate the convergence of the simulations [55].

Generation of Representative Regular Waves

As mentioned, to carry out the present study, representative regular waves were simulated in a numerical wave channel using Fluent software [47]. Therefore, the waves approached in the study were generated through the imposition of vertical and horizontal velocities of the water particles, as noted in [23,54,55]. To do so, the wave characteristics are inserted as a velocity inlet boundary condition, aiming to reproduce these waves. More details about the computational domain and the other boundary conditions considered are presented later in Section 4.
In this sense, it is worth highlighting that the waves addressed are called representative regular waves because their characteristics are based on data from the sea state that occurred in the municipality of Tramandaí—RS, at a point with geographic coordinates 50°06′18″ W 29°59′52″ S, located 2094.33 m away from the coast. For this purpose, spectral data from the TOMAWAC model [58] were used, referring to the sea state that occurred on the coast of the state of Rio Grande do Sul, Brazil, during the year of 2018. Then, the spectral data referring to the selected point were treated using Spec2Wave software [59] in order to obtain statistical parameters regarding the sea state that occurred there. Thus, it is possible to identify the parameters that repeat the most, that is, the ones that represent the sea state that occurred at the location.
According to Holthuijsen [60], the significant height ( H s ) is commonly used to describe a sea state, since it represents the waves that cause the most significant elevations on the free surface. Another statistical parameter to be taken into consideration is the mean period ( T m ) of the recorded waves. According to Awk [58], this metric represents the arithmetic mean of the wave periods, weighted by the amount that the waves with this period contribute to the energy of the analyzed wave spectrum. Thus, in the present study, the H s and T m were considered as indicated by Mocellin et al. [22], who prepared a bivariate histogram relating the occurrences of H s and T m in order to determine the most frequent combination in the analyzed location.
Additionally, considering the depth ( h ) of the region addressed in the study, it is also possible to determine the wavelength of the regular waves that represent this sea state. For this purpose, the dispersion relation was used, which is given by [61] as follows:
σ 2 = g   k   t a n h k h ,
where h is the water depth (m), and k is the wavenumber (m−1), given by as follows:
k = 2 π λ ,
with λ being the wavelength (m) and σ the angular frequency (Hz), which is noted as follows:
σ = 2 π T ,
where T is the wave period (s).
Table 2 shows the characteristics of the representative regular waves considered in the present study. Moreover, it should be emphasized that the sea state that occurred in the municipality of Tramandaí is represented using the following terms: H stands for H s ; T stands for T m ; and h is the depth at the analyzed point.
It is worth noting that such waves are classified, according to Chakrabarti [62], as second-order Stokes waves. Therefore, the elevation of the free surface ( η ) is described analytically by [61] as follows:
η = H 2 cos k x σ t + H 2 k c o s h ( k h ) 16   s i n h 3 ( k h ) 2 + c o s h   2 k h cos 2 ( k x σ t ) ,
Meanwhile, the horizontal ( u ) and vertical ( w ) velocity components of the wave propagation are described by [61] as follows:
u = H 2 g k c o s h ( k z + k h ) σ   c o s h ( k h ) cos k x σ t + 3 H 2 16 σ k   cos h [ 2 k ( h + z ) ] s i n 4 ( k h ) cos [ 2 k x σ t ] ,
w = H 2 g k s i n h ( k z + k h ) σ   s i n h ( k h ) sin k x σ t + 3 H 2 16 σ k sin h [ 2 k ( h + z ) ] c o s 4 ( k h ) sin [ 2 k x σ t ] .

3. Constructal Design Applied to the Oscillating Water Column Device

As mentioned, the constructal design method was used to evaluate the geometry of the OWC WEC device. Such a method is based on the constructal theory, which is a visualization that the generation of geometric configurations in finite-dimensional flow systems is based on a physical principle. Thus, when constructal design is applied, the geometry of a given physical system is deduced from the principle of objectives (maximizing or minimizing a quantity) and restrictions (geometric characteristics kept constant), aiming to evaluate the influence of a degree of freedom (parameter to be varied in each geometry) [4,5,6].
Thus, the first step in applying the constructal design method is to define the physical system that shall be addressed; in the present study, the studied system is an OWC WEC inserted in a numerical wave channel. Figure 1 presents an illustration of the OWC device, highlighting its geometric characteristics. Additionally, Figure 1 also illustrates the horizontal probe inserted in the center of the OWC turbine duct (orange line) that is used to monitor the results during the simulation, i.e., the static pressure and mass flow rate of the air.
It is highlighted that, as noted in Mocellin et al. [22], the dimensions adopted for the OWC in the present study are based on the device installed off Pico Island, Azores, Portugal. The device has the following features: hydropneumatic chamber length, L = 12   m ; hydropneumatic chamber height, H 1 = 13.4   m ; turbine duct length, l = 2.8 m; turbine duct height, H 2 =   11.3 m ; and submersion depth, H 3 = 6.12 m.
According to Dos Santos et al. [63], regarding the application of constructal design in geometric evaluation studies, it is necessary to define the following:
  • The performance indicator: the available hydropneumatic power, which must be maximized;
  • Geometric constraints: the area of the hydropneumatic chamber ( A H C ) and the total area of the wave channel ( A C );
  • Degrees of freedom: the ratio between the height and length of the hydropneumatic chamber of the OWC device ( H 1 / L ) (see Figure 1).
Thus, two area constraints were considered in this study. The total area of the wave channel (see Figure 1) is given as follows:
A C = H C L C ,
where A C = 3443.4 m2. In addition, the area of the hydropneumatic chamber (see Figure 1) is given as follows:
A H C = H 1 L ,
where A H C = 160.8 m2, taking as a basis the dimensions of H 1 and L of the OWC WEC installed off Pico Island. Thus, it is possible to define a dimensionless area fraction as follows:
ϕ = A H C A C ,
which, in the present study, is given ϕ = 0.05 , as in [22,44]. In order to define the H 1 and L for each ratio of H 1 / L investigated, Equation (16) is divided by the degrees of freedom H 1 / L . Thus, by isolating L , the following is obtained:
L = A H C H 1 L ,
which allows the value of H 1 to be set as follows:
H 1 = L H 1 L .
Furthermore, it is important to highlight that there are other geometric constraints that were considered in the study (see Figure 1), such as the dimensions of the height ( H 2 ) and length ( l ) of the turbine duct, as well as the submersion of the OWC device ( H 3 ), which were kept as the same as the device installed off Pico Island.
The effect caused by the variation in the degrees of freedom on the design of the device geometry is illustrated in Figure 2. For this purpose, extreme cases are represented along with an intermediate one, which has the dimensions of the OWC device installed off Pico Island.
In total, 17 geometric configurations of the OWC WEC were tested, varying the ratio between the height and length ( H 1 / L ) of the hydropneumatic chamber. Table 3 presents the values adopted for the degrees of freedom investigated, as well as the respective dimensions of H 1 and L that were considered.
With the variations in H 1 / L , it was possible to identify the best geometric configuration for the OWC device subject to the representative regular waves of the sea state that occurred in the municipality of Tramandaí. For this purpose, the performance of the device was evaluated according to the available hydropneumatic power ( P H ), calculated using the following equation [64]:
P H = p + 1 2 m ˙ 2 A d 2 ρ a i r   m ˙ ρ a i r ,
where m ˙ is the mass flow rate (kg/s), which is monitored in the center of the turbine duct (see Figure 1), and A d is the turbine duct area (m2).
In order to determine the best geometry, i.e., the H 1 / L ratio that maximizes the hydropneumatic power obtained, as well as the static pressure and the air mass flow, the root mean square (RMS) metric was considered, which is given by [58] as follows:
R M S = K = 1 N X k 2 N ,
where X represents the quantity to be measured; and N is the total amount of data.

4. Computational Domain

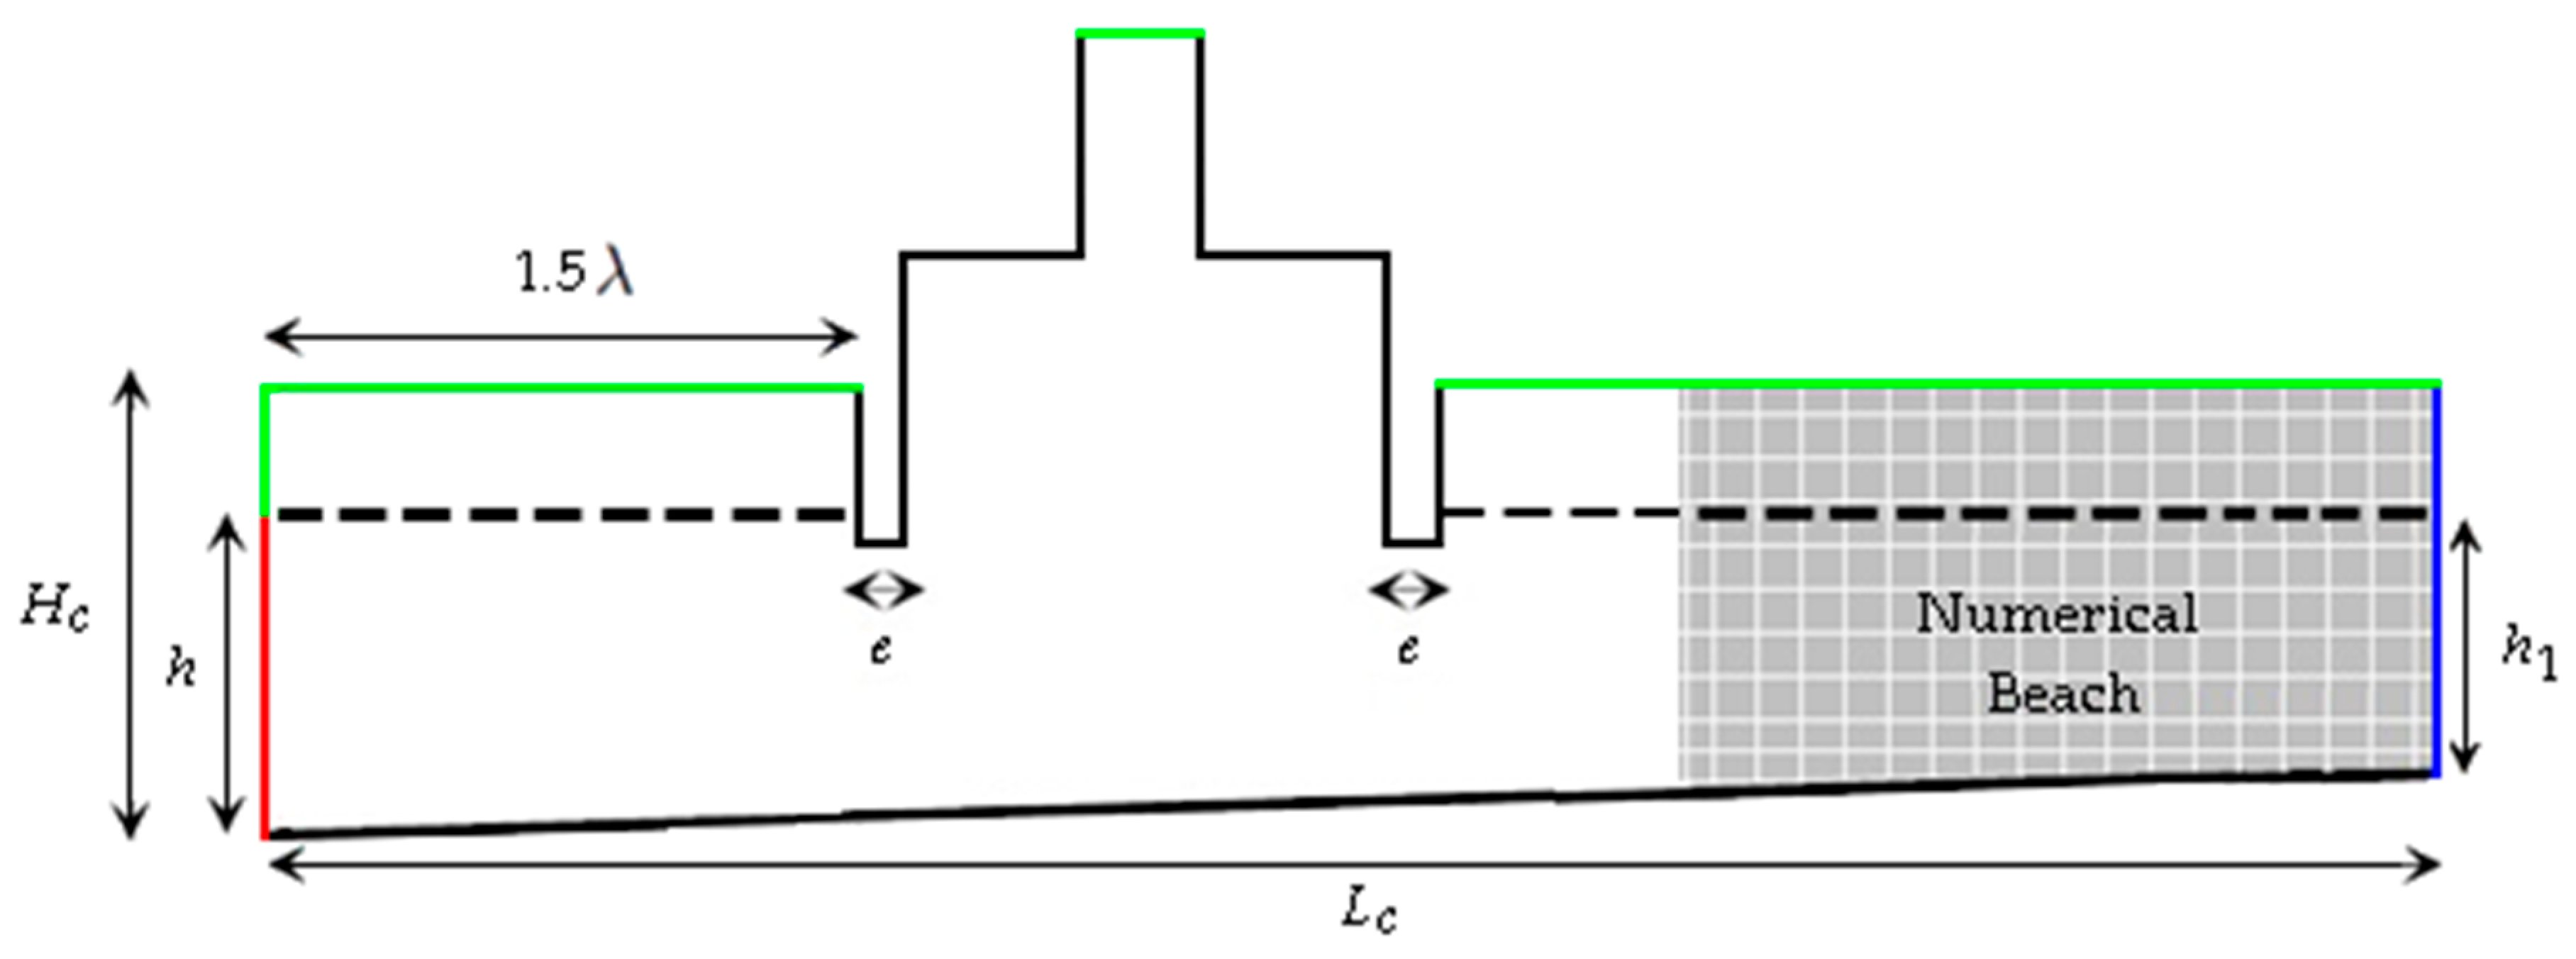
In the present study, the computational domain consists, essentially, of an OWC WEC device located inside a numerical wave channel. Regarding the dimensions of the wave channel, the length is L C = 229.56 m, which corresponds to 5 λ [65]; the height is H C = 15.00 m; the thickness of the side walls of the device is e = 0.1 m; and the depth varies from h = 10.98 m to h 1 = 10.52 m, reproducing the local bathymetry, as done in Mocellin et al. [22]. For this purpose, data from the Hydrography and Navigation Directorate of the Brazilian Navy and digitalized by Cardoso et al. [66] were considered.
Additionally, it is worth noting that the positioning of the OWC device in the wave channel corresponds to the recommendations of De Lima et al. [23], i.e., it was inserted at 1.5 λ from the left wall of the channel. In this regard, the computational domain used is presented in Figure 3, where the main dimensions and boundary conditions applied are highlighted.
Regarding the boundary conditions applied in the computational domain, the following conditions are present: the velocity inlet located at the bottom of the left wall (red line), where the velocities components u and w are inserted; the pressure outlet located at the top of the wave channel and turbine duct (green line), which is defined as atmospheric pressure; non-slip or impermeability are assessed at the bottom of the channel and on the walls of the device (solid black line); and a pressure outlet located on the right wall of the channel (blue line) allows for an open flow regime, which prevents the waves reflection. Therefore, a hydrostatic profile is also applied on the right wall (blue line), which is responsible for keeping the water level constant and equal to h 1 , avoiding the wave channel from emptying. Additionally, it is worth noting that the numerical beach (gray region) has a length of 2 λ , in agreement with Lisboa et al. [54].
For the spatial discretization of the computational domain, a stretched mesh was used, which is a method developed by Mavripilis [67] that employs a greater refinement in the region of interest, in this case, the free surface region and the region inside the device. Thus, for the wave channel, the recommendations of Gomes et al. [68], who performed a numerical investigation regarding the mesh sensitivity for waves generation and propagation, were followed. It is highlighted that this recommendation has been used in numerical studies of the OWC WEC found in the literature, such as [22,23,55], as well as in studies with other types of WEC devices, such as the overtopping and submerged horizontal plate [69,70]
Thus, when the stretched mesh is applied, the domain is divided vertically into three regions: R1, the region containing only air, discretized into 20 computational cells; R2, the free surface region, which contains both phases, air and water, discretized into 40 cells; and R3, the region containing only water, discretized into 60 cells. In addition, horizontally, there is region R4, which was subdivided into 50 computational cells per wavelength, totaling 250 cells in this direction. In order to visualize this mesh configuration, Figure 4 shows these regions.
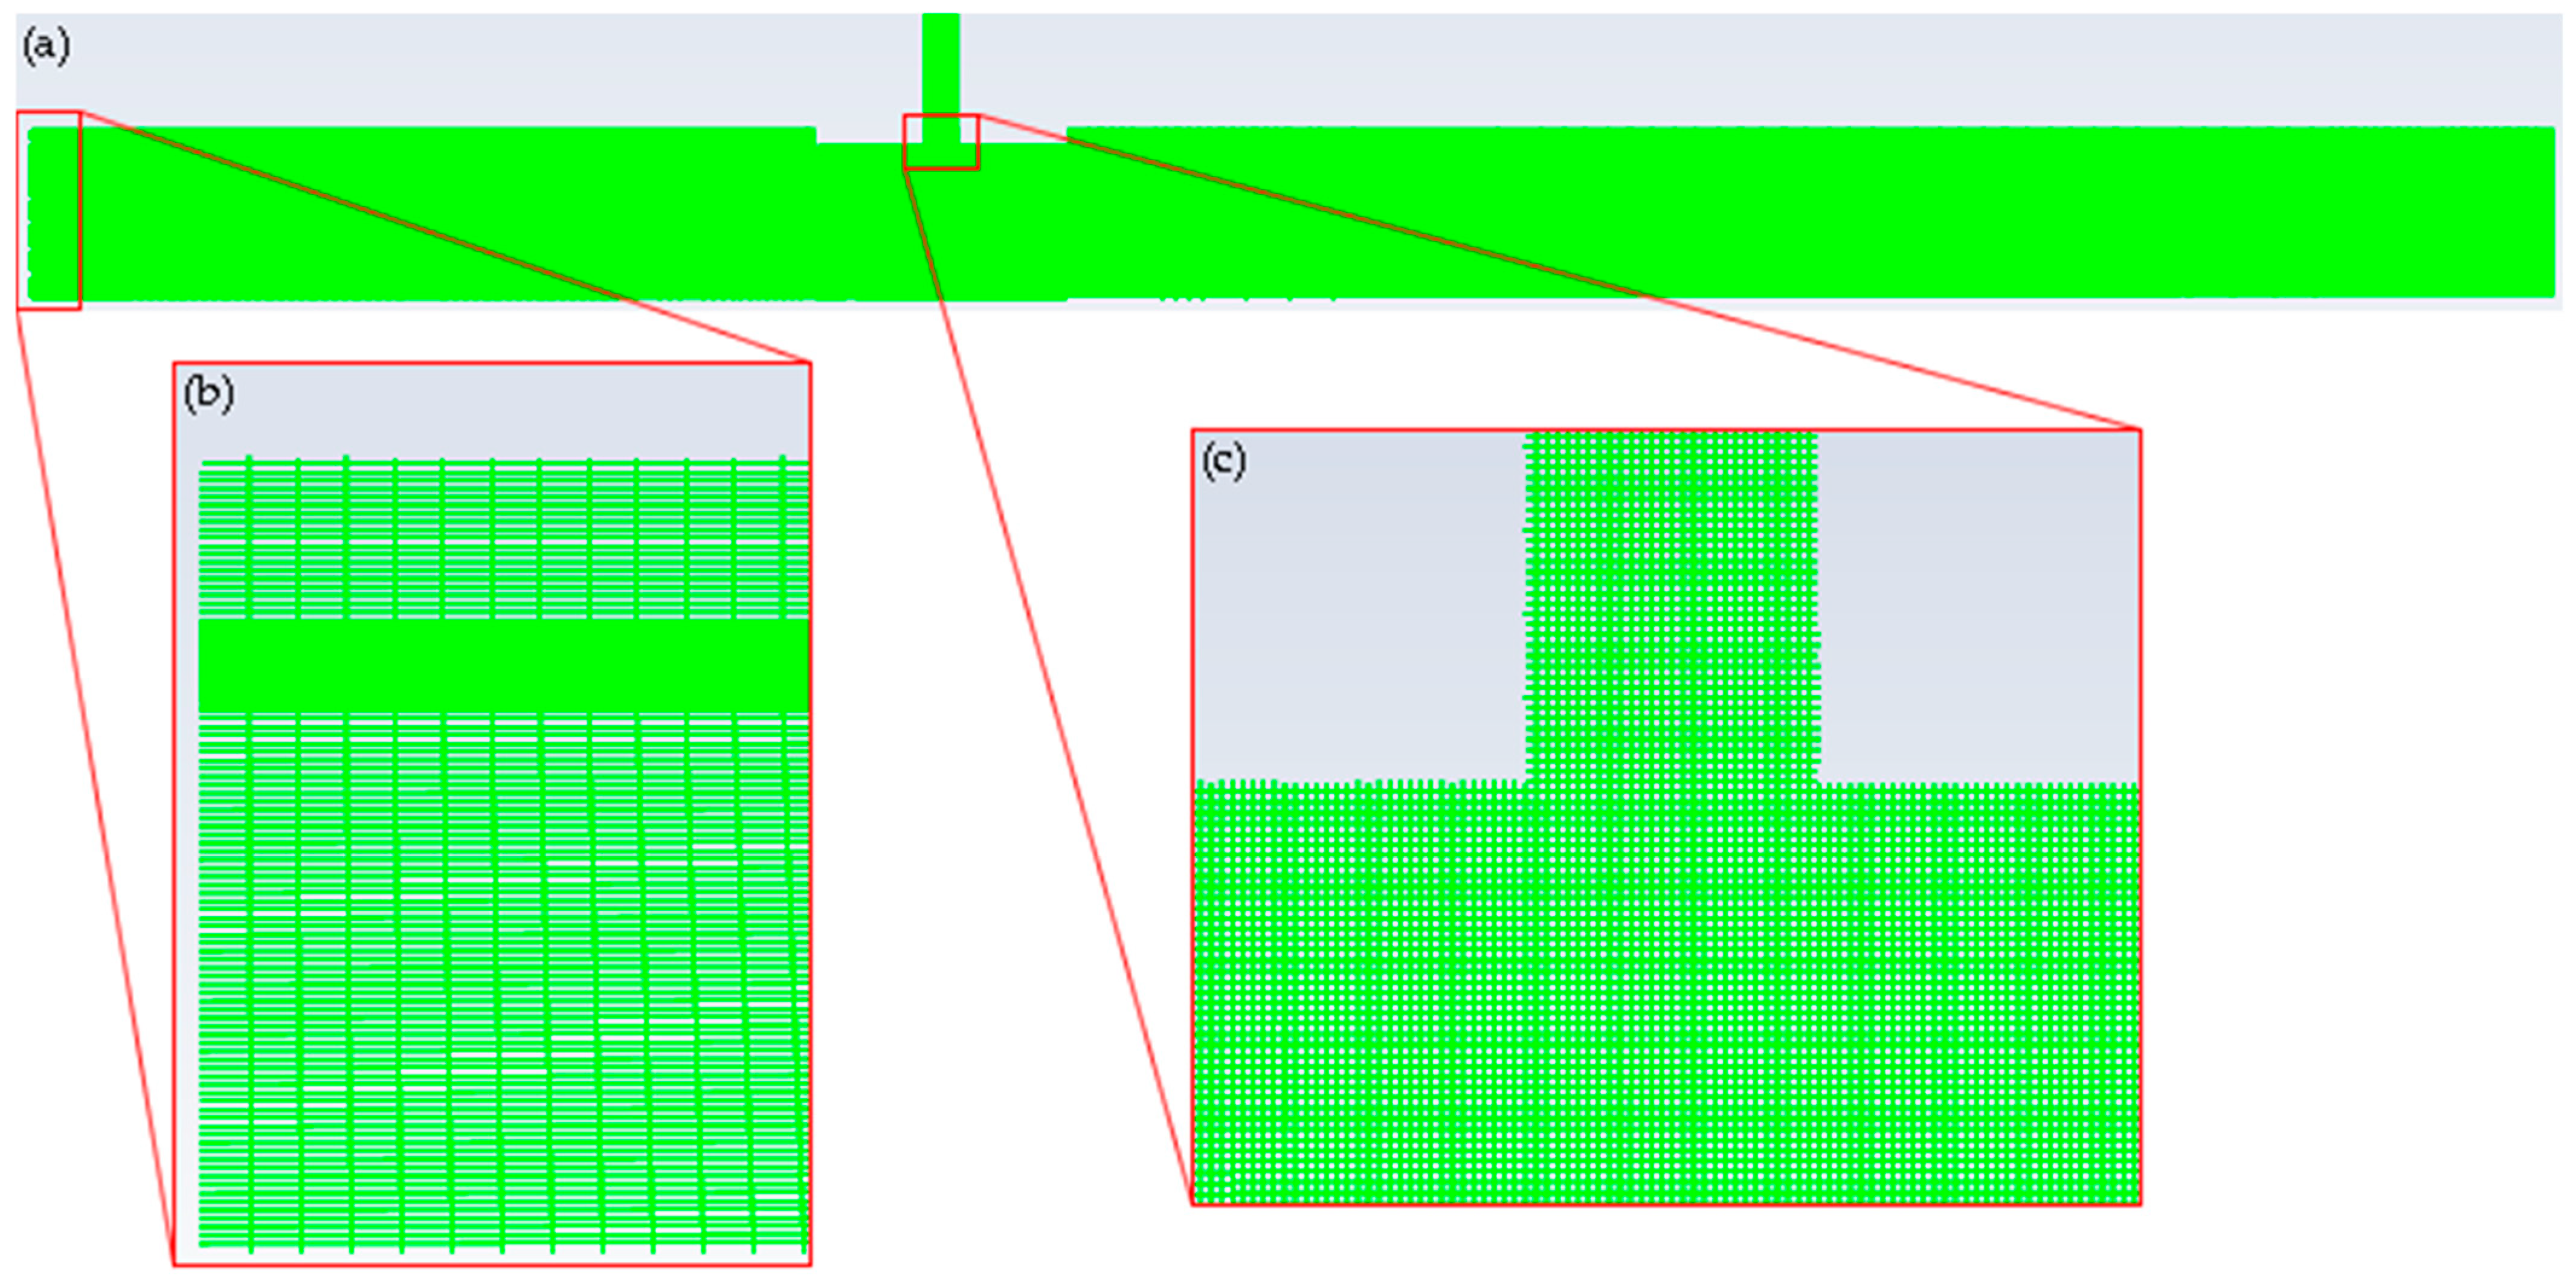
Concerning the spatial discretization in the device region, square cells of size x = 0.1 m were used, as indicated by [23,55]. Thus, Figure 5a presents the mesh adopted for the computational domain in the present study. Additionally, detailed views of the mesh are shown in Figure 5b, focusing on the beginning of the wave channel, where the regions of the stretched mesh can be observed, and Figure 5c, focusing on the OWC WEC region, which shows greater refinement.
Moreover, regarding the temporal discretization, as recommended by Barreiro [71], a time step ( Δ t ) of T/500 was used, which is equivalent to Δ t = 0.0114 s. In addition, it is worth noting that for both the verification of the numerical model and the geometric evaluation study of the OWC WEC, a total simulation time of 900 s was considered for generation and propagation of the representative regular waves.
To verify the generation and propagation of representative regular waves, a computational domain with the same dimensions and boundary conditions previously presented was used (see Figure 3), but the device was not present in the wave channel. To do so, a free surface elevation monitoring probe was used, which goes from the bottom to the top of the channel and is located at position x = 41.82 m, i.e., approximately one wavelength from the wave generation zone. Thus, the free surface elevation data obtained in the numerical simulations were compared with the data from the analytical solution, i.e., Equation (12). In order to perform a quantitative comparison of the results, the metrics mean absolute error (MAE) and root mean square error (RMSE) were used, which are given by [72] as follows:
M A E = i = 1 N | O i P i | N ,
R M S E = i = 1 N O i P i 2 N ,
where O i represents the value obtained numerically (m), and P i is the value used as a reference (m).

5. Results and Discussions

5.1. Numerical Model Verification

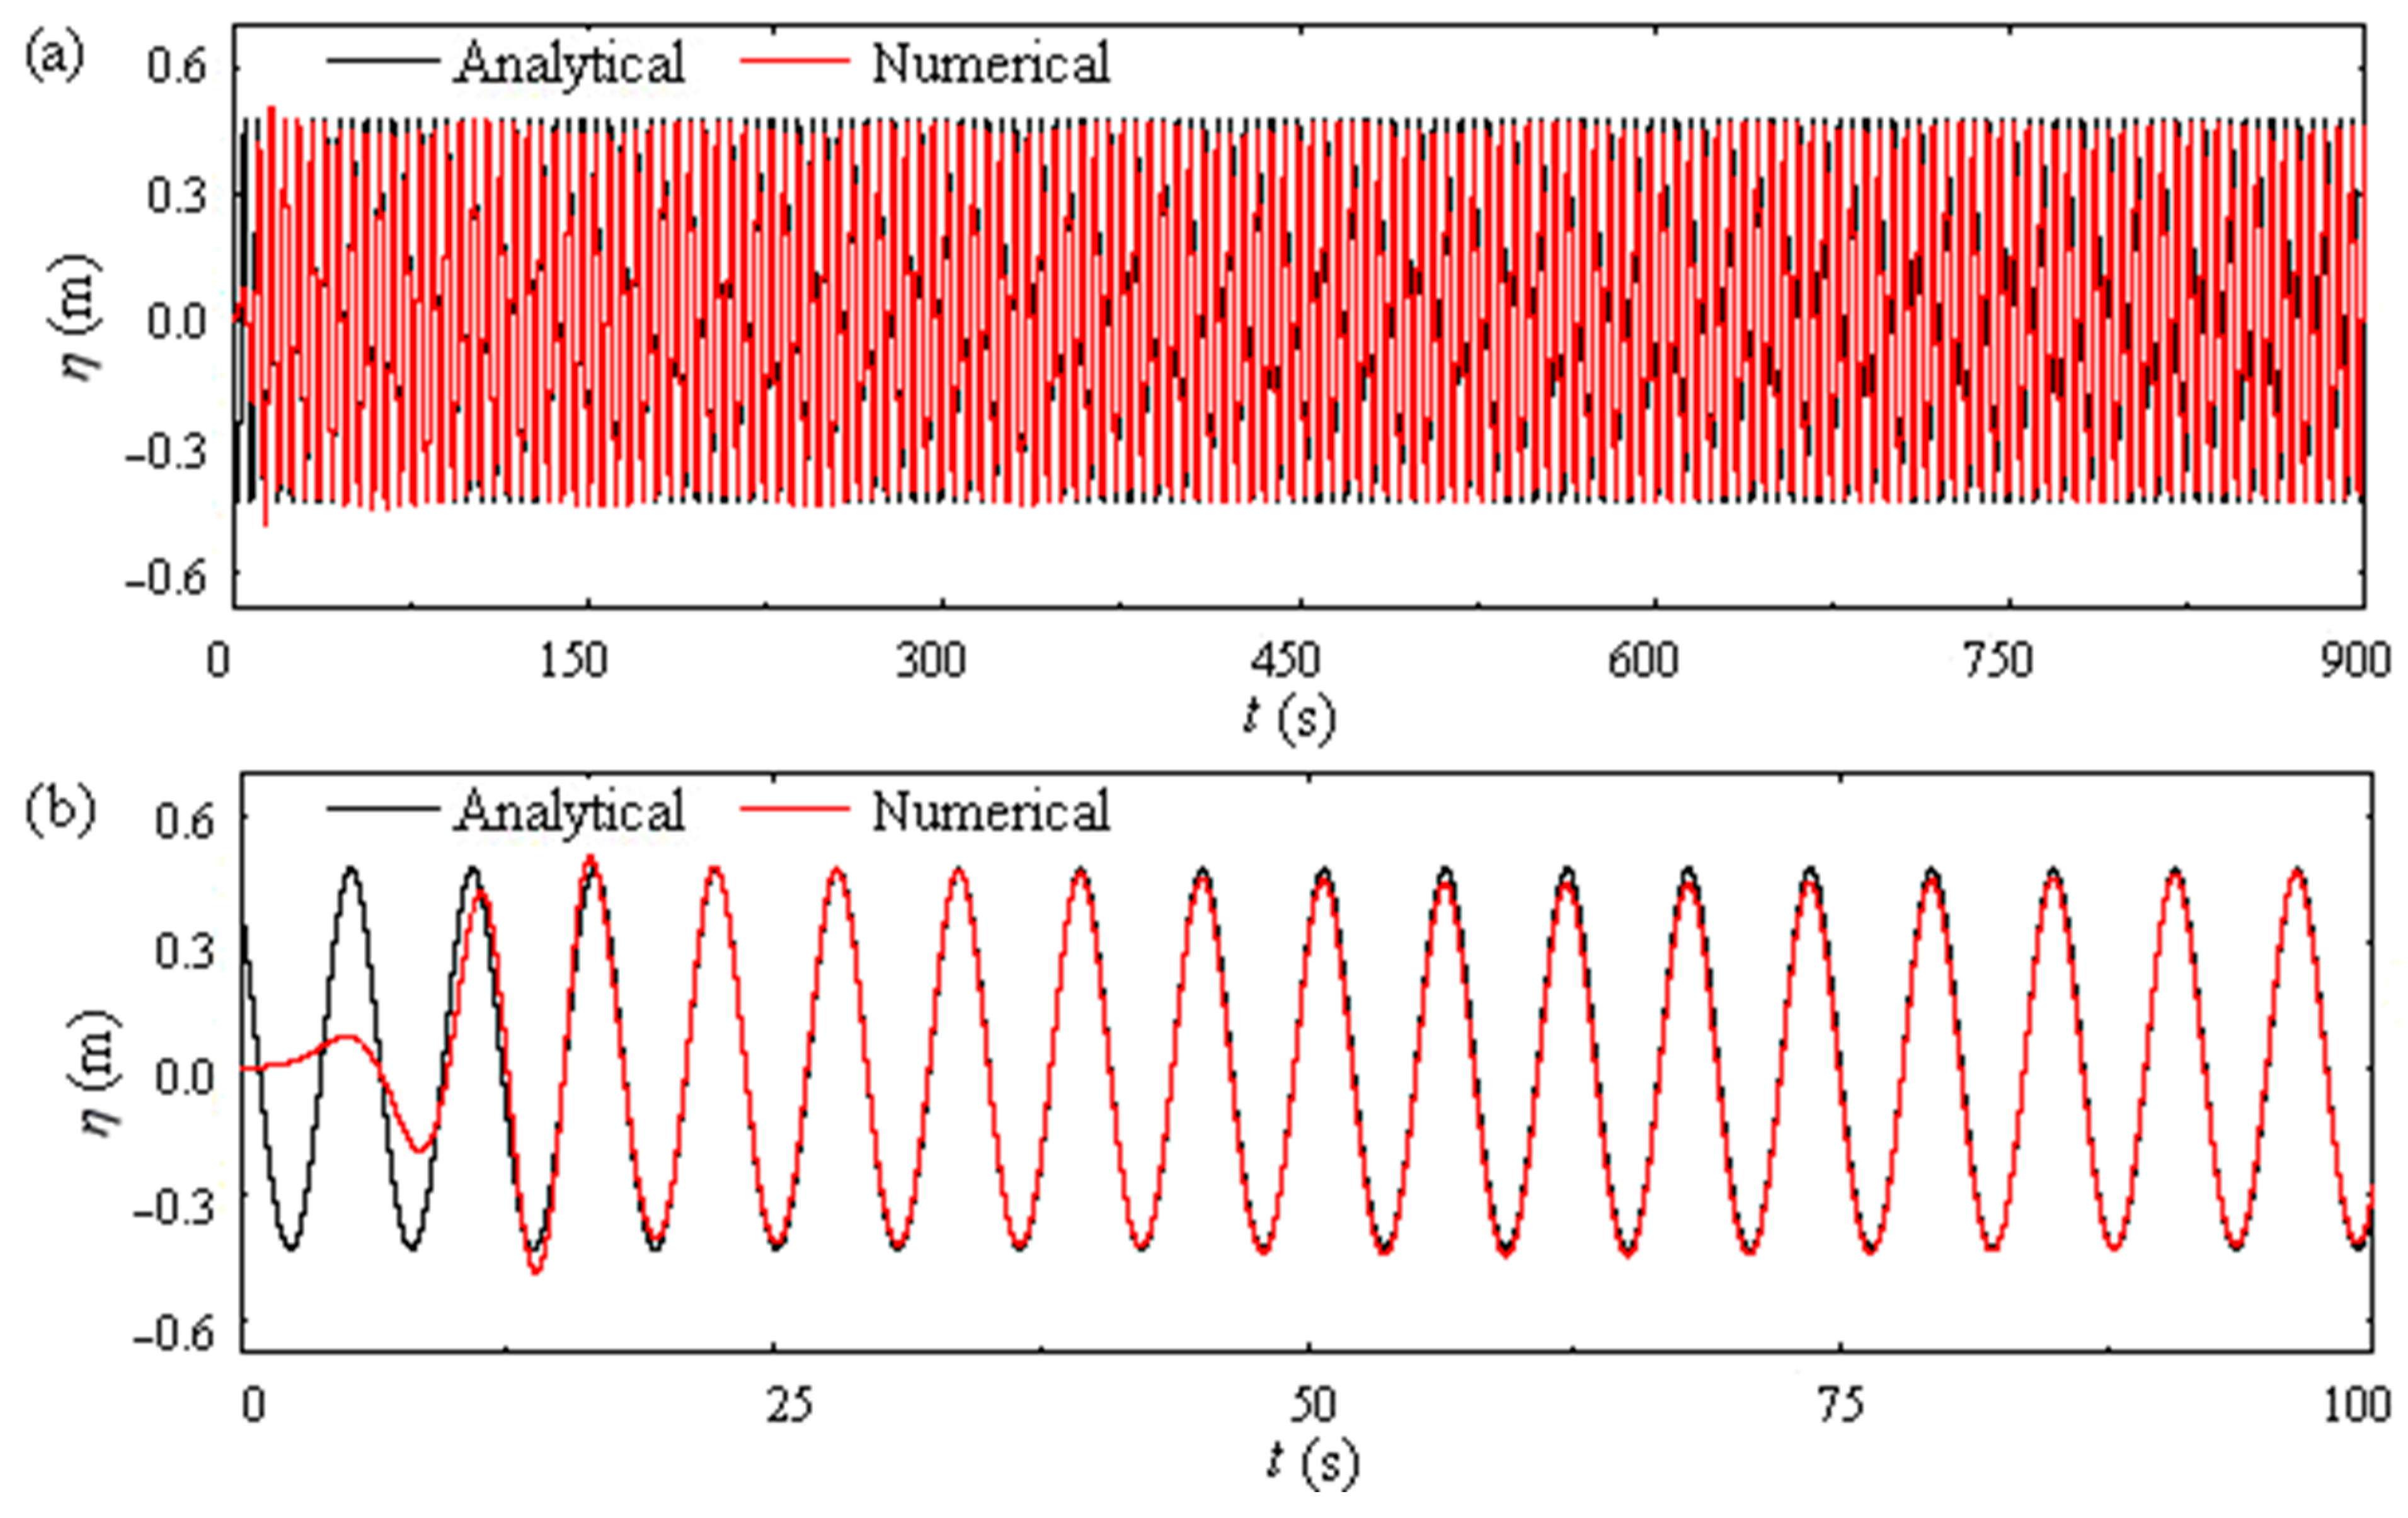
The first results to be presented are those used to verify the numerical model employed. Figure 6 presents the qualitative comparison between the free surface elevation obtained using Fluent software and the results from the analytical solution. In this sense, in Figure 6a, one can observe the total simulation time (900 s). In Figure 6b, the first 100 s are highlighted, aiming to allow a better visualization of the results.
As can be seen in Figure 6a, the representative regular waves were generated adequately, which is corroborated by Figure 6b, where it is possible to view the results in greater detail. However, for t   20 s, a difference is noted between the numerical and analytical results obtained, which occurs because the flow starts from rest. Then, due to inertia, the first waves generated in the numerical channel are damped, which leads to deviations in the comparison with the analytical results. Furthermore, it is worth noting that, as can be seen, this damping decreases as the simulation time advances.
Therefore, to perform the quantitative evaluation using the MAE and RMSE metrics (Equations (22) and (23), respectively), the results obtained for 20 s   t   900 s were considered. Thus, it was found that M A E = 0.0458 m and R M S E = 0.0601 m, confirming that the representative regular waves were generated and propagated appropriately.
Finally, in order to enable the visualization of the physical phenomenon, i.e., the generation and propagation of representative regular waves, the volume fraction field is shown in Figure 7. The water phase is represented by the color blue, while the air phase is represented by the color red. Thus, the fluid dynamic behavior in the numerical wave channel is presented, both for the beginning and for the end of the simulation in Figure 7a, at t = 0 s, and in Figure 7b, at t = 900 s, respectively.
It can be observed in Figure 7a that at the initial moment of the simulation, at t = 0 s, the flow is at rest; therefore, there is no disturbance in the water free surface. However, in Figure 7b, at the final moment of the simulation, t = 900 s, the presence of elevations in the water free surface is observed, indicating a regular oscillatory movement of the generated waves. In addition, in Figure 7b, the damping capacity of the numerical beach tool can also be observed, since there are no significant oscillations at the right end of the channel, indicating that the waves reaching this region were properly damped.
Regarding the computational modeling of the OWC device operation, it is important to emphasize that the numerical model was verified and validated by Maciel et al. [73], where a numerical wave channel was simulated considering regular waves with the same parameters used in a laboratory experiment. These waves were imposed as a prescribed velocity boundary condition and compared with the analytical solution. Afterwards, the OWC device was inserted in the computational domain for the model validation. The numerically obtained results for the OWC WEC device were then compared with those from the experimental study. In general, the numerical results showed good agreement with the results of laboratory experiments. Among the various tests performed, the normalized root mean squared error (NRMSE) for the free surface elevation monitored inside the OWC varied from 4.93 to 9.35. Regarding the pressure monitored inside the device, it ranged from 4.22 to 4.63.

5.2. Geometric Evaluation of the Oscillating Water Column Device

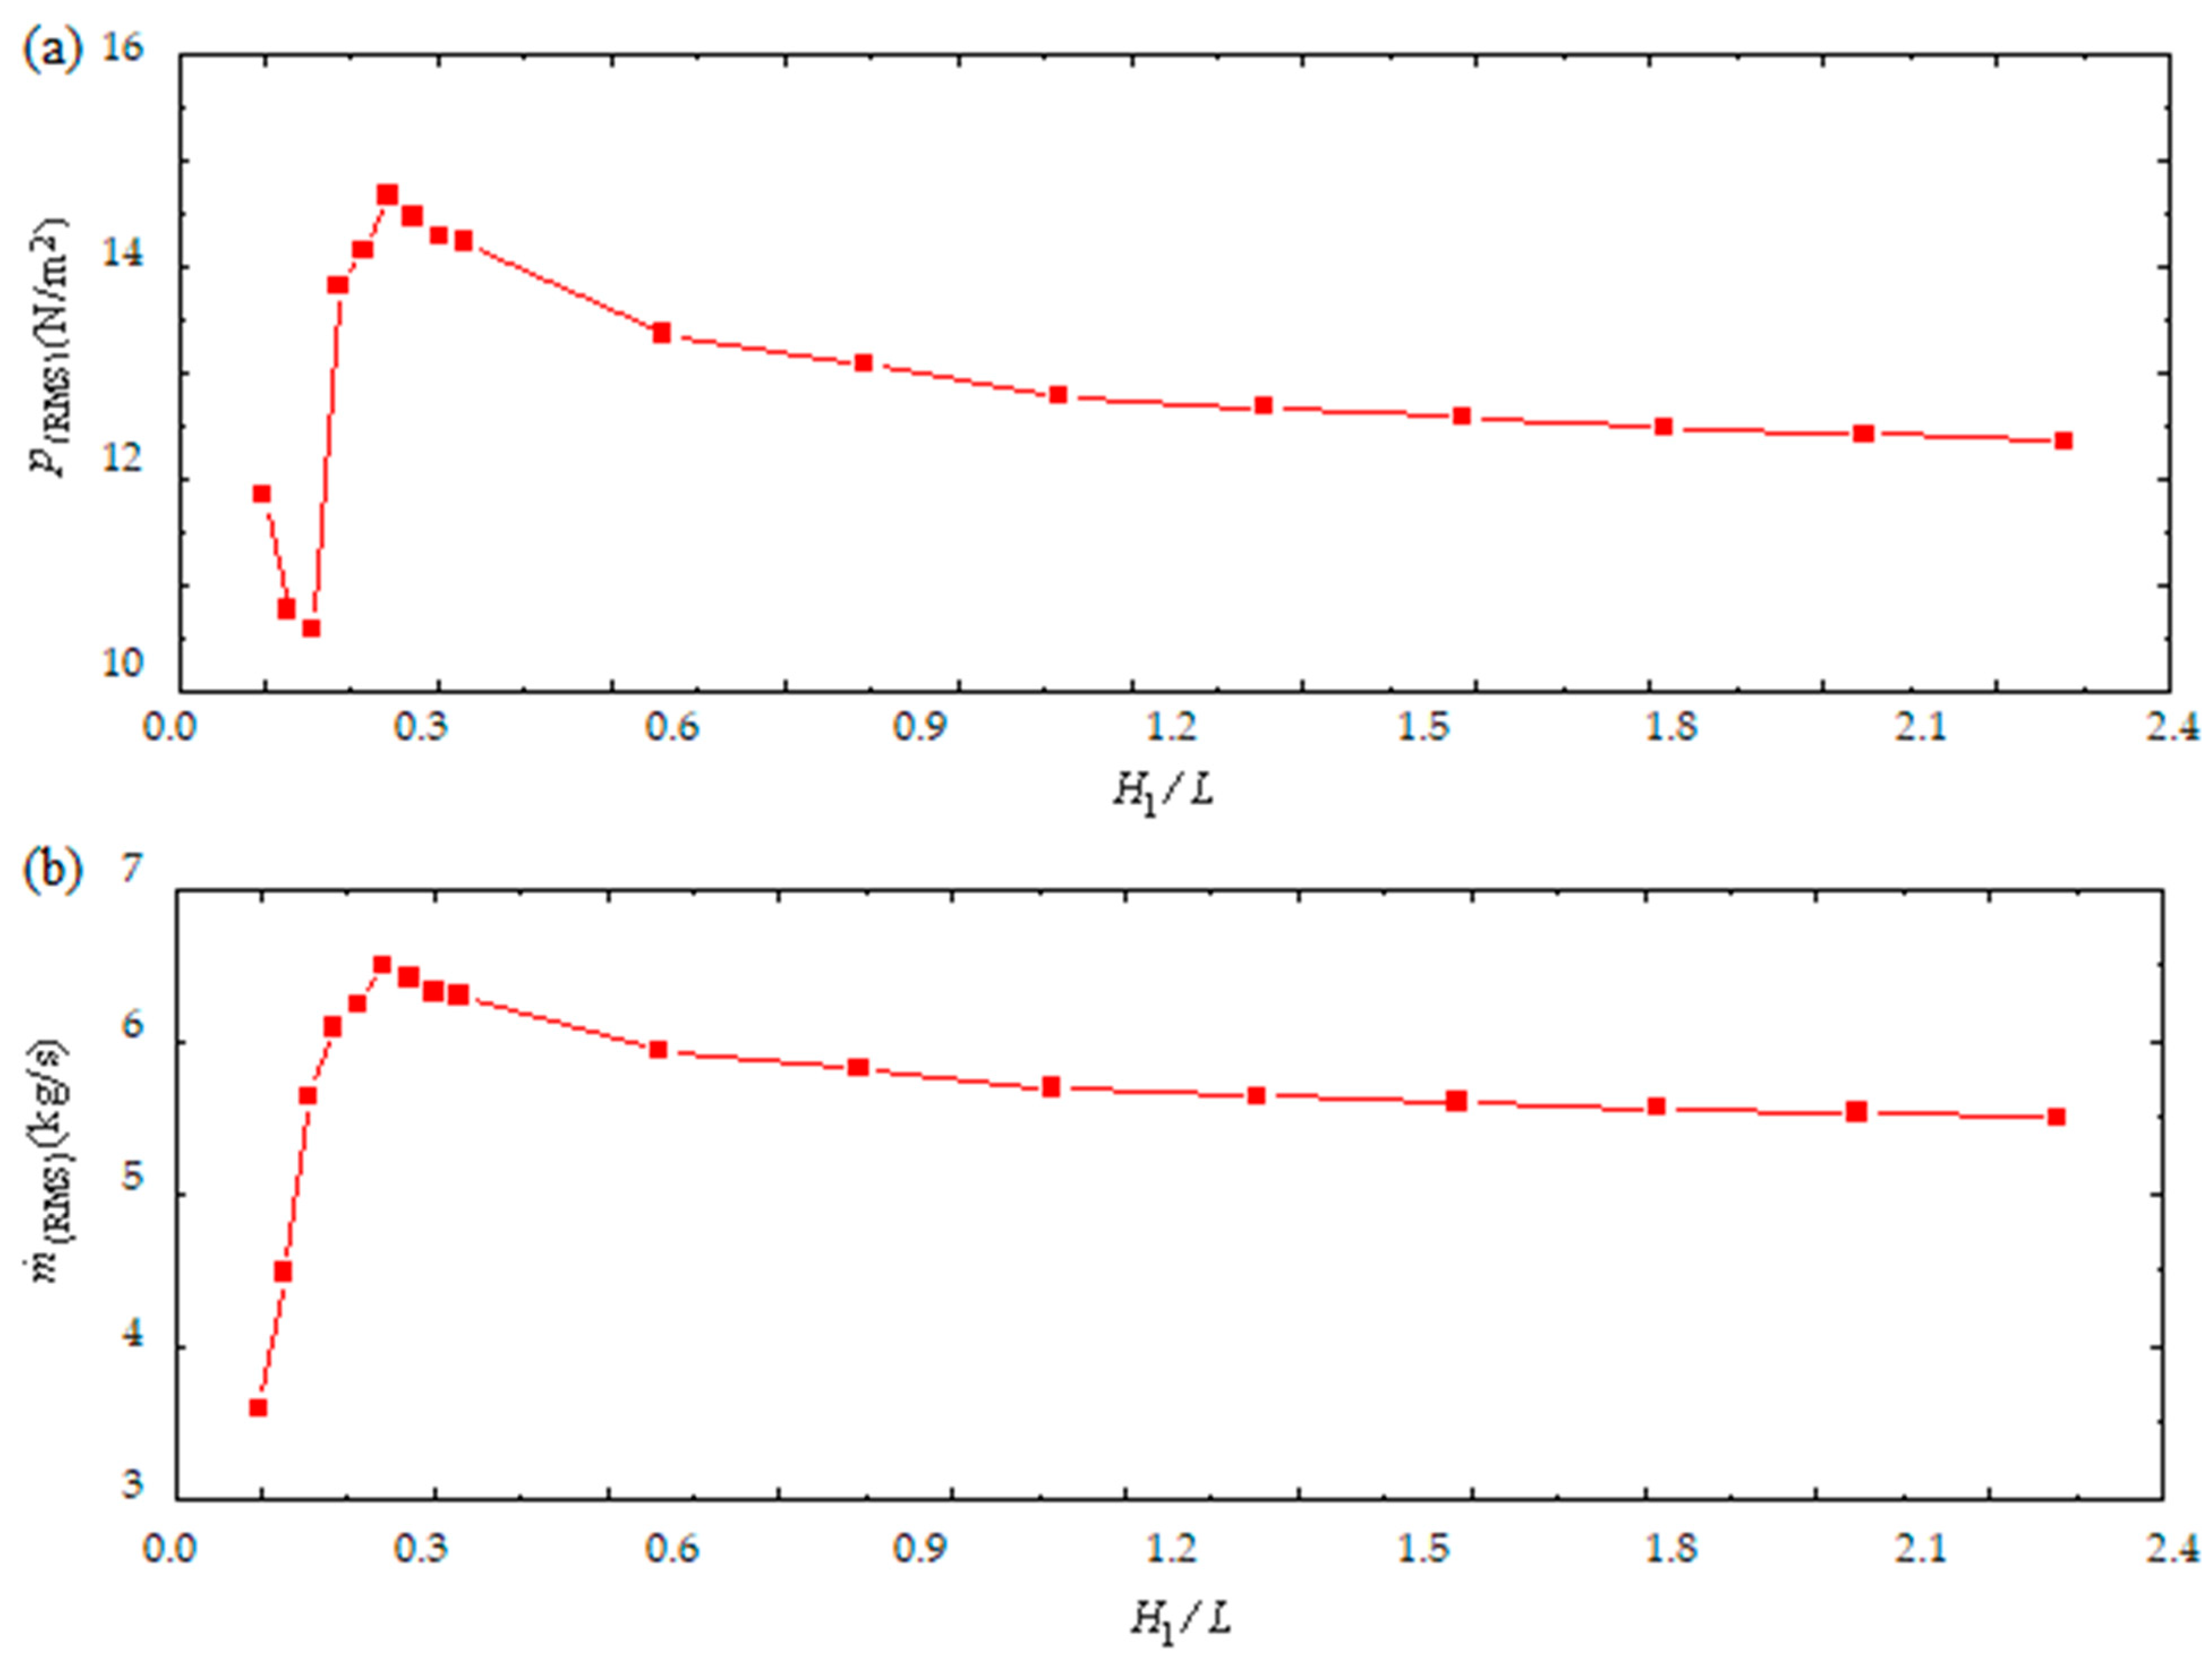
As mentioned, the present study employed the constructal design method in order to perform a geometric evaluation of the OWC WEC, aiming to define the geometry that provides the best performance. In this sense, the results monitored at the center of the air duct are presented in Figure 8 and include: (a) the pressure ( p ( R M S ) ) and (b) the mass flow ( m ˙ ( R M S ) ). It should be emphasized that the RMS metric was used to analyze these parameters as the degree of freedom H 1 / L varies.
Thus, in Figure 8a, the curve that illustrates the effect of the variation of H 1 / L on p ( R M S ) presents oscillations in the interval between 0.1985 H 1 / L 0.3430 , which is followed by a decreasing trend for the other degrees of freedom evaluated, with stable results for higher values of H 1 / L . In Figure 8b, the curve that illustrates the influence of H 1 / L on m ˙ ( R M S ) presents an increasing trend until H 1 / L = 0.3430 , which is followed by a decreasing trend, also presenting stable results for higher values of H 1 / L . Additionally, it should be highlighted that the global maximum point is the same for both metrics considered. However, there is a difference regarding the global minimum point found, which occurs at H 1 / L = 0.2563 for the p ( R M S ) and at H 1 / L = 0.1985 for the m ˙ R M S . It should be mentioned that this kind of behavior was also observed in De Lima et al. [23].
Regarding the quantitative evaluation of these results, the highest mean pressure monitored was p R M S = 14.66 N/m2 ( ( H 1 / L ) o = 0.3430 ), while the lowest was p ( R M S ) = 10.58 N/m2 ( H 1 / L = 0.2563 ). With regard to m ˙ ( R M S ) , the highest mass flow rate monitored was m ˙ ( R M S ) = 6.49 kg/s ( ( H 1 / L ) o = 0.3430 ), while the lowest was m ˙ ( R M S ) = 3.58 kg/s ( H 1 / L = 0.1985 ). Therefore, when comparing the extreme cases, there were improvements of 27.83% in the p ( R M S ) and 44.83% in the m ˙ ( R M S ) .
In addition, for H 1 / L = 1.1167 , the case where the OWC WEC installed off Pico Island is represented, intermediate results were obtained, with p ( R M S ) = 12.78 N/m2 and m ˙ ( R M S ) = 5.68 kg/s. Thus, the results for p ( R M S ) and m ˙ ( R M S ) were 14.71% and 14.26% lower, respectively, than those obtained for the best evaluated ratio, ( H 1 / L ) o = 0.3430 ; however, the values were 17.21% and 36.97% higher, respectively, than those obtained for the worst evaluated ratios, with H 1 / L = 0.2563 for p ( R M S ) and H 1 / L = 0.1985 for m ˙ ( R M S ) .
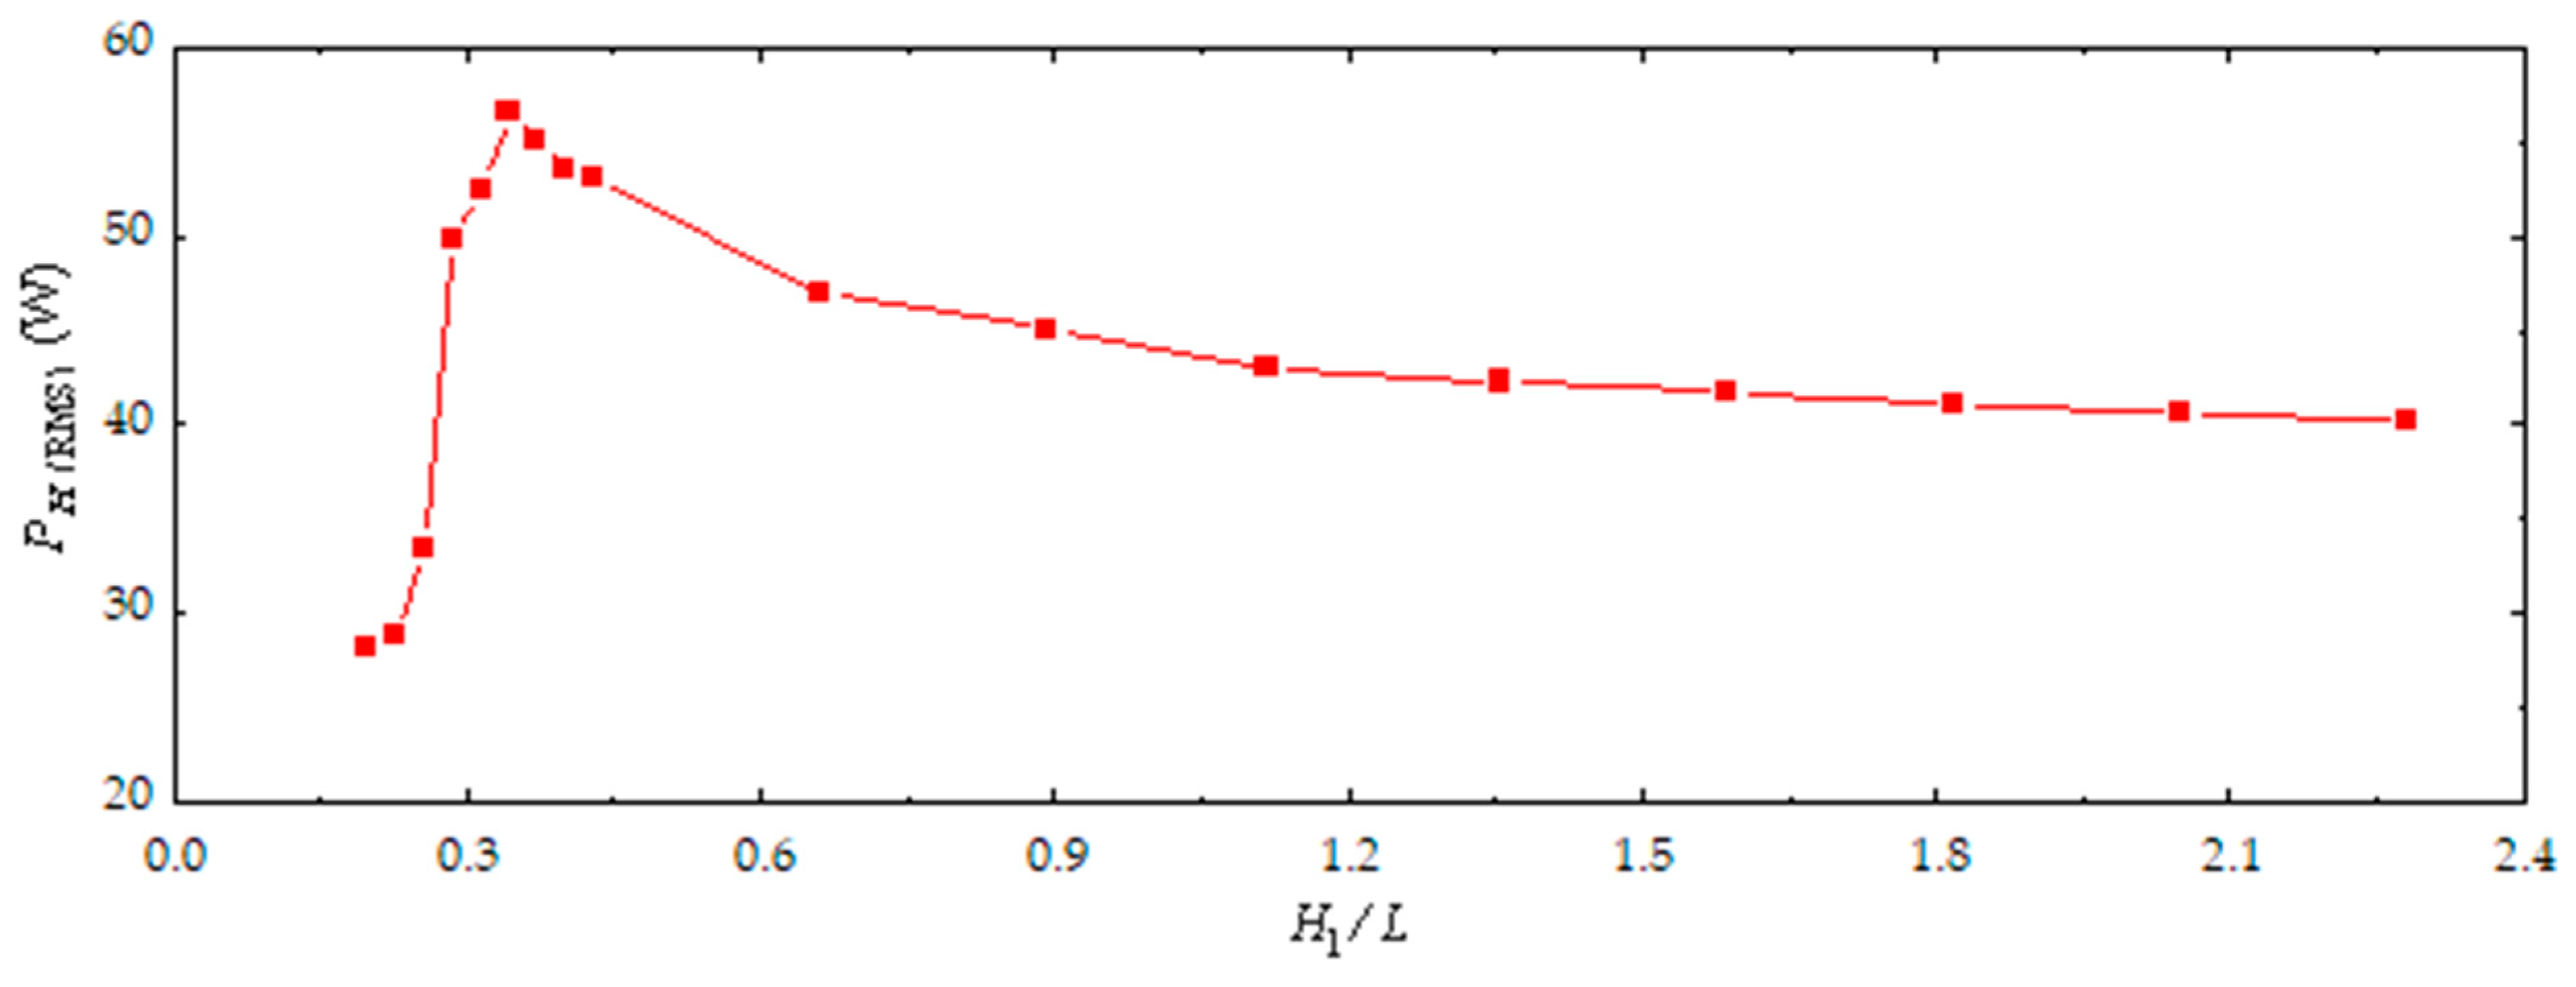
Continuing with the analysis of the results obtained in the present study, in Figure 9, it is possible to observe the effect of the variation of H 1 / L on the mean hydropneumatic power available. It can be observed that, despite some differences, the effect that the degrees of freedom H 1 / L exert on P H ( R M S ) is similar to the influence on p ( R M S ) (Figure 8a) and m ˙ ( R M S ) (Figure 8b), especially for the highest values of H 1 / L .
Observing Figure 9, one can note that there is considerable variation in the P H ( R M S ) obtained for 0.1985 H 1 / L 0.3430 , where the illustrated curve presents an increasing trend, as seen in Figure 8b. Furthermore, it is important to emphasize that this interval contains the global minimum and maximum points, that is, the geometries that present the best and worst performance at ( H 1 / L ) o = 0.3430 and H 1 / L = 0.1985 , respectively, which is the same as that noted for the m ˙ R M S . Additionally, after the global maximum point, ( H 1 / L ) o = 0.3430 , the curve that illustrates the effect of the degree of freedom H 1 / L on the P H ( R M S ) presents a decreasing trend. Despite this, stability is observed in the results obtained for the geometries that consider the highest values of H 1 / L , which was also observed in the results presented in Figure 8a,b.
Furthermore, analyzing the behavior of the curves observed in Figure 8 and Figure 9, it is worth noting that the minimum point for pressure (Figure 8a) differs from that found for the mass flow (Figure 8b) and the available hydropneumatic power (Figure 9). Analyzing Equation (20) analytically reveals a third-order term related to mass flow, which is directly proportional to the hydropneumatic power obtained; thus, its minimum points are the same. This explains why the curve that illustrates the influence of H 1 / L on P H ( R M S ) (Figure 9) shows an increasing trend for 0.1985 H 1 / L 0.3430 , as was observed for m ˙ R M S (Figure 8b).
Consequently, geometries yielding better results for m ˙ R M S also presented better results for P H ( R M S ) , despite the results obtained for p R M S . Specifically, this behavior was noted for geometries with H 1 / L = 0.2274 and H 1 / L = 0.2563 , which outperformed the one with H 1 / L = 0.1985 with regards to the P H ( R M S ) and the m ˙ R M S but performed worse for the p R M S . However, it is worth highlighting that the results for P H ( R M S ) presented low variation in the interval 0.1985 H 1 / L 0.2563 , whereas results for m ˙ R M S varied significantly within this range. Thus, it is safe to say that p R M S influenced the obtained P H ( R M S ) , but not enough to change its increasing trend.
In order to perform a quantitative evaluation of the results obtained, Table 4 presents the relative difference ( D R ), which indicates the variation between the P H ( R M S ) obtained for each geometry evaluated. For this purpose, the performance of each geometry is compared with the performance of the geometry located in the line above.
Based on the D R variations presented in Table 4, one can identify the qualitative evaluation performed in Figure 9. As mentioned, for 0.1985 H 1 / L 0.3430 , that is, up to the global maximum point, the D R values are positive. For H 1 / L > 0.3430 , as the curve decreases, the values are negative. It is also worth noting that this interval contains the largest variations regarding the P H ( R M S ) found in the present study, which exceed 32% when comparing H 1 / L = 0.2563 and 0.2852 .
Furthermore, observing Table 4, it is possible to confirm the decreasing trend of P H ( R M S ) after H 1 / L = 0.3430 , which initially presents a smooth drop and is followed by a more pronounced one (when considering H 1 / L = 0.6608 ). Then, despite the decreasing trend, there is a stabilization in the results obtained when considering the highest values of the degrees of freedom, mainly from the ratio H 1 / L = 1.3543 , when the differences become approximately 1%. This fact indicates the stability of the fluid dynamic performance of the OWC WEC subject to the incidence of representative regular waves of the sea state occurring in the municipality of Tramandaí.
Additionally, it is possible to state that the constructal design method allowed the identification of the geometry of the OWC device with the best performance, that is, the one that provides the highest P H ( R M S ) . In this sense, it is highlighted that the best geometry, ( H 1 / L ) o = 0.3430 , which has H 1 = 7.42 m and L = 21.65 m, obtained P H ( R M S ) = 56.66 W. In addition, considering the geometry that has the dimensions of the device installed of Pico Island, with H 1 / L = 1.1167 ( H 1 = 13.40 m and L = 12.00 m), P H ( R M S ) = 43.06 W was obtained, which is 24% lower than that found for the best geometry. As for the worst geometry analyzed, namely, H 1 / L = 0.1985 ( H 1 = 5.65 m and L = 28.46 m), P H ( R M S ) = 28.19 W was obtained, which corresponds to an amount that is 50.24% lower than that obtained by the best geometry.
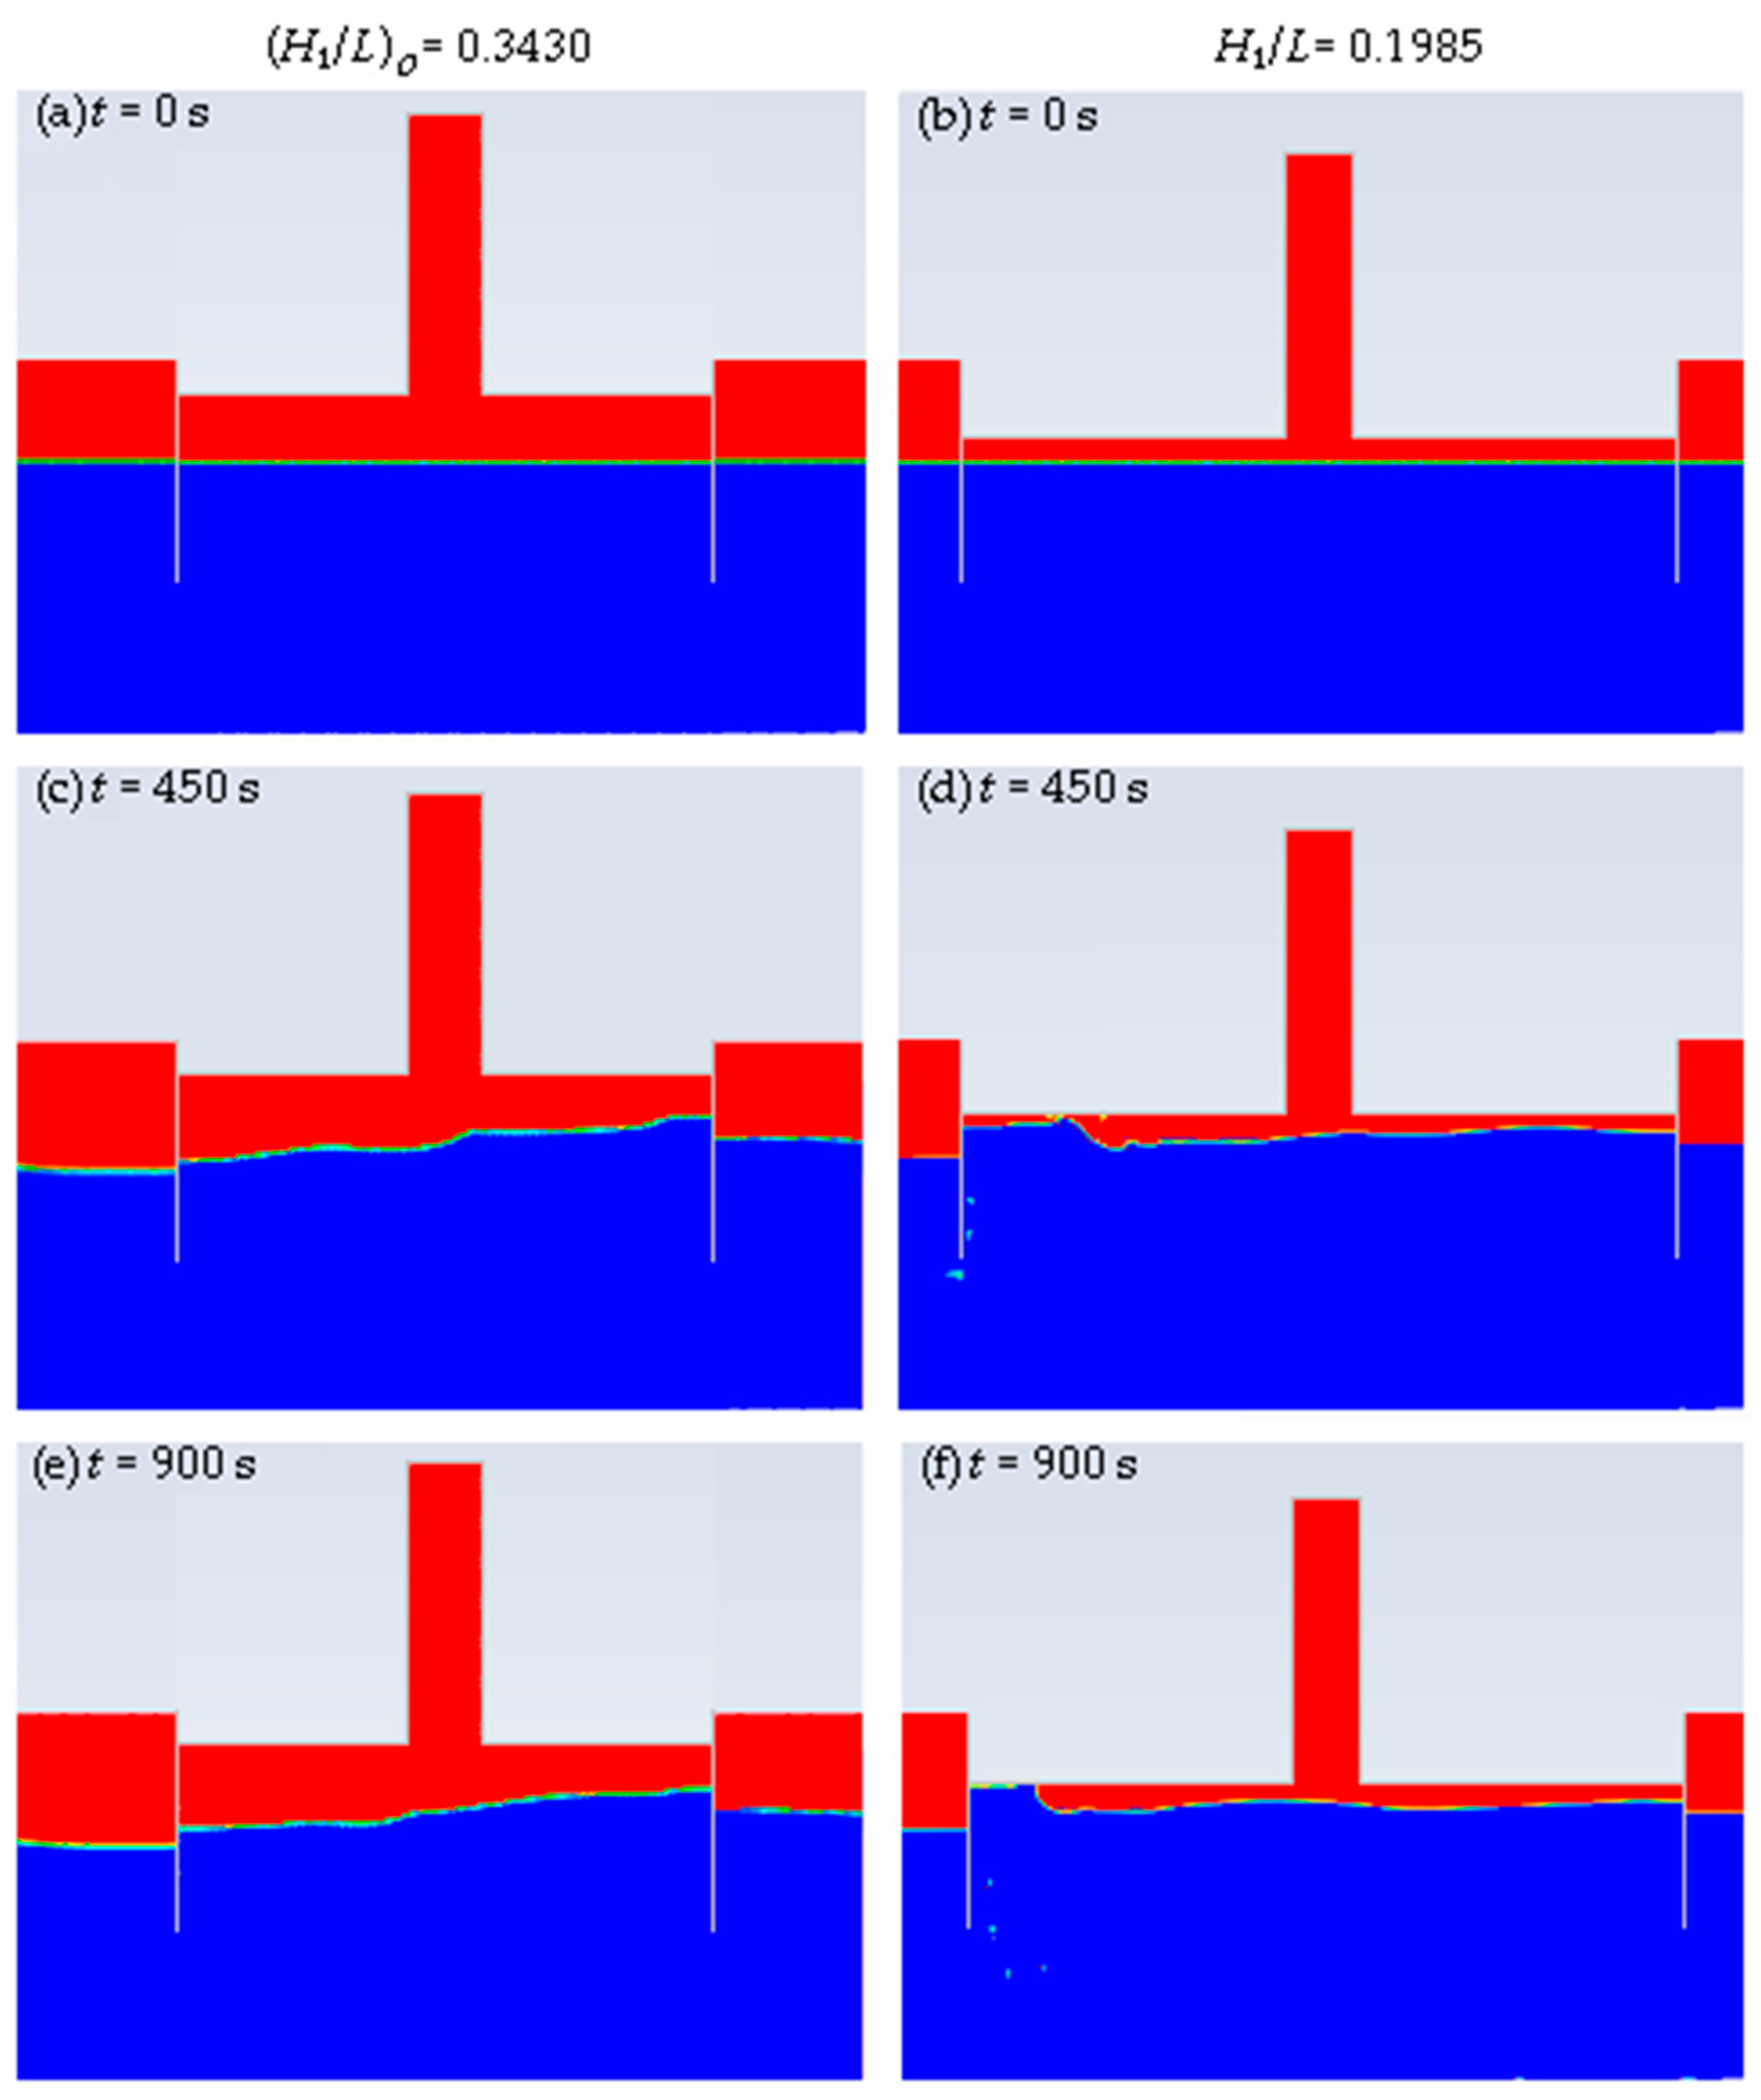
Finally, in order to provide a graphical representation of the hydrodynamic behavior of the OWC WEC, Figure 10 presents the phase topology for the best, ( H 1 / L ) o = 0.3430 , and the worst ratio, H 1 / L = 0.1985 . Again, the water and air are represented in blue and red colors, respectively. In this sense, Figure 10 illustrates the incidence of the representative regular waves on the mentioned geometries at the time instants: t = 0 s; 450 s; and 900 s.
Figure 10a,b shows the initial instant of the simulation, t = 0 s, where there is no incidence of waves in the hydropneumatic chamber of the device due to the initial condition of the flow at rest. Next, for t = 450 s, it is possible to visualize, in Figure 10c, the oscillatory movement inside the chamber of the device with the best geometry, ( H 1 / L ) o = 0.3430 . On the other hand, in Figure 10d, it is observed that the oscillatory movement is interfered by the structure of the device with the worst ratio, H 1 / L = 0.1985 , which occurs due to the reduced height of the chamber. Finally, the final instant of the simulation, t = 900 s, can be observed in Figure 10e,f, where there is the presence of a wave crest over the OWC, resulting in a greater volume of water inside the chamber. In Figure 10f, it is possible to observe, once again, the interference caused by the structure of the device in the oscillatory movement of the waves.

5.3. Comparison with Results Found by Mocellin et al. [22]

As mentioned, after performing the geometric evaluation of the OWC WEC subject to the incidence of representative regular waves of the sea state that occurred in Tramandaí, a comparison was made with the results found in Mocellin et al. [22]. For this purpose, two analyses were performed. In the first one, the best and worst cases found in the studies were compared. In the second, the data were compared with the H 1 / L ratios investigated in Mocellin et al. [22], which evaluated the OWC WEC subject to the incidence of realistic irregular waves of the Tramandaí sea state.
Referring to the first analysis, it was noted that both the best and worst geometries evaluated in the present study performed better compared to their counterparts found by Mocellin et al. [22]. However, the best and worst cases found by Mocellin et al. [22] did not occur for the same H 1 / L ratios found in the present study. Thus, a difference of 55.10% was found considering the best geometries, ( H 1 / L ) o = 0.3430 (present study) and ( H 1 / L ) o = 0.1985 [22], and a difference of 60.44% was found considering the worst geometries, H 1 / L = 0.1985 (present study) and H 1 / L = 2.2789 [22].
Concerning the second analysis, Figure 11 presents the results obtained in the present study, along with those from Mocellin et al. [22]. Thus, the first aspect to highlight is that every H 1 / L ratio evaluated presented a higher P H R M S when subjected to representative regular waves (present study) compared with realistic irregular waves [22].
As observed in Figure 11, the results found in Mocellin et al. [22] exhibited behaviors inversely proportional to the degrees of freedom investigated, which was also seen in the findings of Maciel et al. [44]. It should be emphasized that both studies addressed realistic irregular waves, but at different locations. However, this behavior did not occur in the present study, where a point of local minimum was noted. It is worth mentioning that points of local minima were also observed in other studies addressing regular waves, such as those by De Lima et al. [23] and Gomes et al. [55]. Additionally, a discrepancy was identified for the lowest degree of freedom evaluated, H 1 / L = 0.1985 . In the present analysis, this ratio represents the worst geometry considered, whereas in Mocellin et al. [22], it represents the best one.
Aiming to carry out a quantitative evaluation of the results obtained, Table 5 presents the difference associated with the type of waves addressed ( D W ), which indicates the variation between the P H ( R M S ) obtained by H 1 / L in Mocellin et al. [22] and in the present study. In concordance with Figure 11, the results shown in Table 5 verify that all the geometries evaluated presented better performance in the present study than in Mocellin et al. [22]. Thus, one can infer that the use of regular waves in geometric evaluations of the OWC device leads to an overestimation of P H ( R M S ) , even considering waves based on realistic sea state data.
Regarding the variations of D W presented in Table 5, it is noted that it is directly proportional to H 1 / L . Specifically, the differences between the results found in the studies increase as H 1 / L is increased. This is due to the fact that the P H ( R M S ) obtained was more stable when the OWC device was subjected to the incidence of representative regular waves (present study) compared with the incidence of realistic irregular waves [22]. Thus, the differences obtained from 10%, considering H 1 / L = 0.1985 , reaching up to 260%, for H 1 / L = 2.2789 ; thus, D W presents an increasing trend. Additionally, it is highlighted that considering the geometry that represents the OWC WEC device installed off Pico Island ( H 1 / L = 1.1167 ), the difference found was 189.38%.

6. Conclusions

The present study sought to carry out a geometric investigation of the OWC WEC subject to representative regular waves, which are based on realistic sea state data that occurred in the municipality of Tramandaí, southern Brazil, in 2018. For this purpose, Fluent software was used to perform numerical simulations of the incidence of waves hitting the device in a channel. Regarding the geometric evaluation, the constructal design method was employed to evaluate the influence of the degrees of freedom H 1 / L on the P H ( R M S ) obtained. Specifically, the influence of the ratio between height and length of the hydropneumatic chamber of the device on its performance was evaluated according to the average hydropneumatic power available in the turbine duct of each geometry.
Thus, the application of the constructal design method allowed the identification of the geometry that provided the best performance of the OWC WEC, namely, the device in which ( H 1 / L ) o = 0.3430 , with H 1 = 7.42 m and L = 21.65 m, achieving P H ( R M S ) = 56.66 W. Thus, the best case is 101% more efficient than the case with the worst geometry, where H 1 / L = 0.1985 . Moreover, it is worth noting that the geometry with the ratio H 1 / L = 1.1167 reproduced the dimensions of the WEC device installed off Pico Island, which presented a performance 24% lower than the best geometry evaluated. Moreover, it should be highlighted that the behavior seen in the curve that illustrates that the influence of the degrees of freedom H 1 / L on the P H ( R M S ) is consistent with results found in the literature, such as [23,55].
Additionally, comparisons were made with results found in the literature [22], which refer to a geometric evaluation for the OWC device subject to the incidence of realistic irregular waves that occurred in the municipality of Tramandaí. Therefore, it was possible to conclude that the use of regular waves in geometric evaluations of the OWC WEC resulted in an overestimation of the device’s performance. Furthermore, it was also observed that the type of waves addressed, i.e., realistic irregular or representative regular, leads to deviations regarding the determination of the best and worst geometries considered in the investigation.
Finally, with regard to future studies, it is suggested that other dimensionless area fraction ( ϕ ) values should be investigated, seeking to analyze the influence of the total size of the OWC WEC on the P H ( R M S ) obtained considering the same wave climate. Furthermore, it is suggested that the geometric evaluation of the OWC WEC device be carried out considering the wave climate found in other regions of the Rio Grande do Sul coast, seeking to identify whether there is an ideal geometry to be replicated across the southern region of Brazil, and with this, analyze a project for implementing a real OWC developed for the region.

Author Contributions

Conceptualization, A.P.G.M., M.d.S.P., L.A.I. and B.N.M.; Data curation, A.P.G.M. and M.d.S.P.; Formal analysis, A.P.G.M., M.d.S.P., L.A.I., J.S.Z. and B.N.M.; Funding acquisition, E.D.d.S., L.A.O.R., L.A.I. and B.N.M.; Investigation, A.P.G.M., M.d.S.P., L.A.I., J.S.Z. and B.N.M.; Methodology, A.P.G.M., M.d.S.P., L.A.I. and B.N.M.; Project administration, E.D.d.S., L.A.O.R., L.A.I., J.S.Z. and B.N.M.; Resources, E.D.d.S., L.A.O.R., L.A.I. and B.N.M.; Software, E.D.d.S., L.A.O.R., L.A.I. and B.N.M.; Supervision, E.D.d.S., L.A.O.R., L.A.I., J.S.Z. and B.N.M.; Validation, A.P.G.M., M.d.S.P., L.A.I., J.S.Z. and B.N.M.; Visualization, L.A.O.R. and B.N.M.; Writing—original draft, A.P.G.M. and M.d.S.P.; Writing—review & editing, A.P.G.M., M.d.S.P., L.A.I., J.S.Z. and B.N.M. All authors have read and agreed to the published version of the manuscript.

Funding

This research was funded by Brazilian Coordination for the Improvement of Higher Education Personnel—CAPES (Finance Code 001); Research Support Foundation of the State of Rio Grande do Sul—FAPERGS (Public Call FAPERGS 07/2021—Programa Pesquisador Gaúcho—PqG—21/2551-0002231-0); Brazilian National Council for Scientific and Technological Development—CNPq (processes: 307791/2019-0, 308396/2021-9, 309648/2021-1, and 403408/2023-7); Ministry of Science, Technology, Innovation and Communications (Public Call MCTIC/CNPq N°28/2018—Universal); and the institutional research assistance program for newly hired professors at the Federal University of Rio Grande do Sul.

Data Availability Statement

The data presented in this study are available on request from the corresponding author. The data are not publicly available due to privacy reasons.

Acknowledgments

A.P.G.M. and M.S.P. thank CNPq and CAPES for their master’s and doctorate scholarships. L.A.O. Rocha, E. D. dos Santos, and L.A. Isoldi thank CNPq for research grants. All authors thank FAPERGS and CNPq.

Conflicts of Interest

The authors declare no conflicts of interest. The funders had no role in the design of the study; in the collection, analyses, or interpretation of data; or in the writing of the manuscript, as well as in the decision to publish the results.

Nomenclature

A c channel area [m2]
A d turbine duct area [m2]
A H C hydropneumatics chamber area [m2]
C 1 linear damping coefficient [s−1]
C 2 quadratic damping coefficient [m−1]
D R relative differences [%]
D W difference relative to the waves considered [%]
e espessura nas laterais do dispositivo OWC [m]
g gravity acceleration vector [m/s2]
h depth [m]
H 1 height of the hydropneumatics chamber [m]
H 2 height of the turbine duct [m]
H 3 device submersion depth [m]
H c wave channel height [m]
H s significant height of the realistic sea state [m]
h 1 final depth of the wave channel [m]
k wave number [m−1]
llength of the turbine duct [m]
L length of the hydropneumatics chamber [m]
L c wave channel length [m]
m ˙ mass flow rate of the air [kg/s]
m ˙ ( RMS ) mean mass flow rate of the air [kg/s]
Ntotal number of data [-]
O i numerical value [m]
p static pressure [pa]
p ( RMS ) mean static pressure [pa]
P i reference value [m]
P H hydropneumatics power available [w]
P H ( RMS ) mean hydropneumatics power available [w]
S numerical beach sink term [-]
T m mean period of the realistic sea state [s]
Twave period [s]
ttime [s]
u horizontal velocity component [m/s]
Vvelocity along the z direction [m/s]
v velocity vector [m/s]
x mesh elements [m]
t time step [s]
x horizontal coordinate axis [m]
x s start position of the numerical beach [m]
x e ending position of the numerical beach [m]
Xquantity analyzed by the RMS metric [-]
w vertical velocity component [m/s]
z vertical coordinate axis [m]
z b vertical position of the channel bottom [m]
z f s vertical positions of the free surface [m]
α volume fraction [-]
η free surface elevation [m]
λ wave length [m]
ρ fluid density [kg/m3]
σ angular frequency [hz]
τ ̿ stress deformation tensor [n/m2]
ϕ dimensionless area fraction [-]

References

  1. Sayed, E.T.; Olabi, A.G.; Alami, A.H.; Radwan, A.; Mdallal, A.; Rezk, A.; Abdelkareem, M.A. Renewable Energy and Energy Storage Systems. Energies 2023, 16, 1415. [Google Scholar] [CrossRef]
  2. Moreira, J.R.S.; Hernandez Neto, A.; Amaral, A.C.D.; Leite, B.M.; Pacheco, C.R.D.F.; Sowmy, D.S.; Parente, V. Energias Renováveis, Geração Distribuída e Eficiência Energética; LTC: Rio de Janeiro, Brazil, 2019. (In Portuguese) [Google Scholar]
  3. Falcão, A.F.D.O. Wave energy utilization: A review of the technologies. Renew. Sustain. Energy Rev. 2010, 14, 899–918. [Google Scholar] [CrossRef]
  4. Bejan, A. Shape and Structure, from Engineering to Nature; Cambridge University Press: Cambridge, UK, 2000. [Google Scholar]
  5. Bejan, A.; Lorente, S. Constructal Theory of generation of configuration in nature and engineering. J. Appl. Phys. 2006, 100, 5. [Google Scholar] [CrossRef]
  6. Bejan, A.; Lorente, S. Design with Constructal Theory; Wiley: New Jersey, NJ, USA, 2008. [Google Scholar]
  7. Portillo, J.C.C.; Collins, K.M.; Gomes, R.P.F.; Henriques, J.C.C.; Gato, L.M.C.; Howey, B.D.; Hann, M.R.; Greaves, D.M.; Falcão, A.F.O. Wave energy converter physical model design and testing: The case of floating oscillating-water-columns. Appl. Energy 2020, 278, 115638. [Google Scholar] [CrossRef]
  8. Zabihi, M.; Mazaheri, S.; Namin, M.M.; Mazyak, A.R. Irregular wave interaction with an offshore OWC wave energy converter. Ocean Eng. 2021, 222, 108619. [Google Scholar] [CrossRef]
  9. Liu, Z.; Xu, C.; Kim, K.; Li, M. Experimental study on the overall performance of a model OWC system under the free-spinning mode in irregular waves. Energy 2022, 250, 123779. [Google Scholar] [CrossRef]
  10. Pecher, A.; Kofoed, J.P. Handbook of Ocean Wave Energy; Springer Open: Cham, Switzerland, 2017. [Google Scholar]
  11. Rosa-Santos, P.; Taveira-Pinto, F.; Clemente, D.; Cabral, T.; Fiorentin, F.; Belga, F.; Morais, T. Experimental Study of a Hybrid Wave Energy Converter Integrated in a Harbor Breakwater. J. Mar. Sci. Eng. 2019, 7, 33. [Google Scholar] [CrossRef]
  12. Cabral, T.; Clemente, D.; Rosa-Santos, P.; Taveira-Pinto, F.; Morais, T.; Belga, F.; Cestaro, H. Performance Assessment of a Hybrid Wave Energy Converter Integrated into a Harbor Breakwater. Energies 2020, 13, 236. [Google Scholar] [CrossRef]
  13. Calheiros-Cabral, T.; Clemente, D.; Rosa-Santos, P.; Taveira-Pinto, F.; Ramos, V.; Morais, T.; Cestaro, H. Evaluation of the annual electricity production of a hybrid breakwater-integrated wave energy converter. Energy 2020, 213, 118845. [Google Scholar] [CrossRef]
  14. Clemente, D.; Calheiros-Cabral, T.; Rosa-Santos, P.; Taveira-Pinto, F. Hydraulic and Structural Assessment of a Rubble-Mound Breakwater with a Hybrid Wave Energy Converter. J. Mar. Sci. Eng. 2021, 9, 922. [Google Scholar] [CrossRef]
  15. Simonetti, I.; Esposito, A.; Cappietti, L. Experimental Proof-of-Concept of a Hybrid Wave Energy Converter Based on Oscillating Water Column and Overtopping Mechanisms. Energies 2022, 15, 8065. [Google Scholar] [CrossRef]
  16. Fenu, B.; Bonfanti, M.; Bardazzi, A.; Pilloton, C.; Lucarelli, A.; Mattiazzo, G. Experimental investigation of a Multi-OWC wind turbine floating platform. Ocean Eng. 2023, 281, 114619. [Google Scholar] [CrossRef]
  17. Hayati, M.; Nikseresht, A.H.; Haghighi, A.T. Sequential optimization of the geometrical parameters of an OWC device based on the specific wave characteristics. Renew. Energy 2020, 161, 386–394. [Google Scholar] [CrossRef]
  18. Bloss, V.; Cardozo, C.F.; Zinani, F.S.F.; Rocha, L.A.O. Evaluation of 3-D Computational Model of Oscillating Water Column Converter with Constructal Design with Three Degrees of Freedom and Limited Chimney Height. Defect Diffus. Forum 2021, 407, 128–137. [Google Scholar] [CrossRef]
  19. Chen, J.; Wen, H.; Wang, Y.; Wang, G. A correlation study of optimal chamber width with the relative front wall draught of onshore OWC device. Energy 2021, 225, 120307. [Google Scholar] [CrossRef]
  20. López, I.; Carballo, R.; Fouz, D.M.; Iglesias, G. Design Selection and Geometry in OWC Wave Energy Converters for Performance. Energies 2021, 14, 1707. [Google Scholar] [CrossRef]
  21. Mia, M.R.; Zhao, M.; Wu, H.; Munir, A. Numerical investigation of offshore oscillating water column devices. Renew. Energy 2022, 191, 380–393. [Google Scholar] [CrossRef]
  22. Mocellin, A.P.G.; Maciel, R.P.; Oleinik, P.H.; dos Santos, E.D.; Rocha, L.A.O.; Ziebell, J.S.; Isoldi, L.A.; Machado, B.N. Geometrical Analysis of an Oscillating Water Column Converter Device Considering Realistic Irregular Wave Generation with Bathymetry. J. Exp. Theor. Anal. 2023, 1, 24–43. [Google Scholar] [CrossRef]
  23. De Lima, Y.T.B.; Isoldi, L.A.; dos Santos, E.D.; Machado, B.N.; Gomes, M.d.N.; Biserni, C.; Rocha, L.A.O. Study of the Geometry of an Oscillating Water Column Device with Five Chambers Coupled under Regular Waves through the Constructal Design Method. Fluids 2024, 9, 86. [Google Scholar] [CrossRef]
  24. Koutrouveli, T.I.; Di Lauro, E.; das Neves, L.; Calheiros-Cabral, T.; Rosa-Santos, P.; Taveira-Pinto, F. Proof of concept of a breakwater-integrated hybrid wave energy converter using a composite modelling approach. J. Mar. Sci. Eng. 2021, 9, 226. [Google Scholar] [CrossRef]
  25. Wan, C.; Yang, C.; Bai, X.; Bi, C.; Chen, H.; Li, M.; Jin, Y.; Zhao, L. Numerical investigation on the hydrodynamics of a hybrid OWC wave energy converter combining a floating buoy. Ocean Eng. 2023, 281, 114818. [Google Scholar] [CrossRef]
  26. Yang, C.; Wan, C.; Bai, X.; Xu, T.; Zhao, L.; Chen, H.; Lars, J.; Baldock, T.E. Numerical investigation on the hydrodynamic and conversion performance of a dual cylindrical OWC integrated into a caisson-type breakwater. Ocean Eng. 2024, 305, 117991. [Google Scholar] [CrossRef]
  27. Zheng, S.; Antonini, A.; Zhang, Y.; Miles, J.; Greaves, D.; Zhu, G.; Iglesias, G. Hydrodynamic performance of a multi-oscillating water column (OWC) platform. Appl. Ocean Res. 2020, 99, 102168. [Google Scholar] [CrossRef]
  28. Liu, Z.; Xu, C.; Shi, H.; Qu, N. Wave-flume tests of a model-scaled OWC chamber-turbine system under irregular wave conditions. Appl. Ocean Res. 2020, 99, 102141. [Google Scholar] [CrossRef]
  29. Moretti, G.; Malara, G.; Scialò, A.; Daniele, L.; Romolo, A.; Vertechy, R.; Fontana, M.; Arena, F. Modelling and field testing of a breakwater-integrated U-OWC wave energy converter with dielectric elastomer generator. Renew. Energy 2020, 146, 628–642. [Google Scholar] [CrossRef]
  30. Singh, U.; Abdussamie, N.; Hore, J. Hydrodynamic performance of a floating offshore OWC wave energy converter: An experimental study. Renew. Sustain. Energy Rev. 2020, 117, 109501. [Google Scholar] [CrossRef]
  31. Zhou, Y.; Ning, D.; Shi, W.; Johanning, L.; Liang, D. Hydrodynamic investigation on an OWC wave energy converter integrated into an offshore wind turbine monopile. Coast. Eng. 2020, 162, 103731. [Google Scholar] [CrossRef]
  32. Zhao, X.; Zhang, L.; Li, M.; Johanning, L. Experimental investigation on the hydrodynamic performance of a multi-chamber OWC-breakwater. Renew. Sustain. Energy Rev. 2021, 150, 111512. [Google Scholar] [CrossRef]
  33. Yu, T.; Guo, Q.; Shi, H.; Li, T.; Meng, X.; He, S.; Li, P. Experimental investigation of a novel OWC wave energy converter. Ocean Eng. 2022, 257, 111567. [Google Scholar] [CrossRef]
  34. Çelik, A. An experimental investigation into the effects of front wall geometry on OWC performance for various levels of applied power take off dampings. Ocean Eng. 2022, 248, 110761. [Google Scholar] [CrossRef]
  35. Zhou, Y.; Ning, D.; Chen, L.; Mayon, R.; Zhang, C. Experimental investigation on an OWC wave energy converter integrated into a floating offshore wind turbine. Energy Convers. Manag. 2023, 276, 116546. [Google Scholar] [CrossRef]
  36. Kim, J.-S.; Nam, B.W.; Kim, K.-H.; Park, S.; Shin, S.H.; Hong, K. A Numerical Study on Hydrodynamic Performance of an Inclined OWC Wave Energy Converter with Nonlinear Turbine–Chamber Interaction based on 3D Potential Flow. J. Mar. Sci. Eng. 2020, 8, 176. [Google Scholar] [CrossRef]
  37. Han, M.M.; Wang, C.M. Coupled analytical-numerical approach for determining hydrodynamic responses of breakwater with multiple OWCs. Mar. Struct. 2021, 80, 103097. [Google Scholar] [CrossRef]
  38. Kim, J.-S.; Kim, K.-H.; Park, J.; Park, S.; Shin, S.H. A Numerical Study on Hydrodynamic Energy Conversions of OWC-WEC with the Linear Decomposition Method under Irregular Waves. Energies 2021, 14, 1522. [Google Scholar] [CrossRef]
  39. Pols, A.; Gubesch, E.; Abdussamie, N.; Penesis, I.; Chin, C. Mooring Analysis of a Floating OWC Wave Energy Converter. J. Mar. Sci. Eng. 2021, 9, 228. [Google Scholar] [CrossRef]
  40. Cong, P.; Teng, B.; Liu, Y.; Ning, D. A numerical approach for hydrodynamic performance evaluation of multi-degree-of-freedom floating oscillating water column (OWC) devices. J. Fluids Struct. 2022, 114, 103730. [Google Scholar] [CrossRef]
  41. Gang, A.; Guo, B.; Hu, Z.; Hu, R. Performance analysis of a coast–OWC wave energy converter integrated system. App. Energy 2022, 311, 118605. [Google Scholar] [CrossRef]
  42. Qu, M.; Yu, D.; Xu, Z.; Gao, Z. The effect of the elliptical front wall on energy conversion performance of the offshore OWC chamber: A numerical study. Energy 2022, 255, 124428. [Google Scholar] [CrossRef]
  43. Cannata, G.; Simone, M.; Gallerano, F. Numerical Investigation into the Performance of an OWC Device under Regular and Irregular Waves. J. Mar. Sci. Eng. 2023, 11, 735. [Google Scholar] [CrossRef]
  44. Maciel, R.P.; Oleinik, P.H.; Dos Santos, E.D.; Rocha, L.A.O.; Machado, B.N.; Gomes, M.d.N.; Isoldi, L.A. Constructal Design Applied to an Oscillating Water Column Wave Energy Converter Device under Realistic Sea State Conditions. J. Mar. Sci. Eng. 2023, 11, 2174. [Google Scholar] [CrossRef]
  45. Naik, N.; Gayathri, R.; Behera, H.; Tsai, C.C. Wave power extraction by a dual OWC chambers over an undulated bottom. Renew. Energy 2023, 216, 119026. [Google Scholar] [CrossRef]
  46. Qu, M.; Yu, D.; Li, Y.; Gao, Z. Effect of relative chamber width on energy conversion and mechanical characteristics of the offshore OWC device: A numerical study. Energy 2023, 275, 127372. [Google Scholar] [CrossRef]
  47. ANSYS. ANSYS Fluent Theory Guide, Release 20.2; ANSYS Inc.: Canonsburg, PA, USA, 2017. [Google Scholar]
  48. Maliska, C.R. Tranferência de Calor e Mecânica dos Fluidos Computacional; LTC—Livros Técnicos e Científicos: Rio de Janeiro, Brazil, 2004. (In Portuguese) [Google Scholar]
  49. Hirt, C.W.; Nichols, B.D. Volume of fluid (VOF) method for the dynamics of free boundaries. J. Comput. Phys. 1981, 39, 201–225. [Google Scholar] [CrossRef]
  50. Schlichting, H. Boundary Layer Theory, 7th ed.; McGraw-Hill: New York, NY, USA, 1979. [Google Scholar]
  51. Versteeg, H.K.; Malalasekera, W. An Introduction to Computational Fluid Dynamics—The Finite Volume Method; Pearson Education Limited: London, UK, 2007. [Google Scholar]
  52. Park, J.C.; Kim, M.H.; Miyata, H.; Chun, H.H. Fully nonlinear numerical wave tank (NWT) simulations and wave run-up prediction around 3-D structures. Ocean Eng. 2003, 30, 1969–1996. [Google Scholar] [CrossRef]
  53. Foyhirun, C.; Kositgittiwong, D.; Ekkawatpanit, C. Wave Energy Potential and Simulation on the Andaman Sea Coast of Thailand. Sustainability 2020, 12, 3657. [Google Scholar] [CrossRef]
  54. Lisboa, R.C.; Teixeira, P.R.; Didier, E. Regular and Irregular wave propagation analysis in a flume with numerical beach using a Navier-stokes based model. Defect Diffus. Forum 2017, 372, 81–90. [Google Scholar] [CrossRef]
  55. Gomes, M.N.; Lorenzini, G.; Rocha, L.A.O.; Dos Santos, E.D.; Isoldi, L.A. Constructal Design Applied to the Geometric Evaluation of an Oscillating Water Column Wave Energy Converter Considering Different Real Scale Wave Periods. J. Eng. Thermophys. 2018, 27, 173–190. [Google Scholar] [CrossRef]
  56. Issa, R.I. Solution of the implicitly discretized fluid flow equations by operator-splitting. J. Comput. Phys. 1986, 62, 40–65. [Google Scholar] [CrossRef]
  57. Patankar, S.V. Numerical Heat Transfer and Fluid Flow; McGraw Hill: New York, NY, USA, 1980. [Google Scholar]
  58. Holthuijsen, L.H. Waves in Oceanic and Coastal Waters; Cambridge University Press: Cambridge, UK, 2007. [Google Scholar]
  59. Oleinik, P.H. O programa Spec2Wave. Manual do usuário. Versão 1.2.1. 2022. Available online: https://gist.github.com/PhelypeOleinik/6dc87900dbde73ad33575b9d333e1f35 (accessed on 20 January 2024). (In Portuguese).
  60. Awk, T. TOMAWAC User Manual; Version 7.2. 7.2.3; The Telemac-Mascaret Consortium; TELEMAC: Chambéry, France, 2017. [Google Scholar]
  61. Dean, R.G.; Dalrymple, R.A. Water Wave Mechanics for Engineers and Scientists; World Scientific Publishing Company: Singapore, 1991. [Google Scholar]
  62. Chakrabarti, S.K. Handbook of Offshore Engineering; Elsevier: Amsterdam, The Netherlands, 2005. [Google Scholar]
  63. Dos Santos, E.D.; Isoldi, L.A.; Gomes, M.D.N.; Rocha, L.A. The constructal design applied to renewable energy systems. In Sustainable Energy Technologies; CRC Press: Boca Raton, FL, USA, 2017. [Google Scholar]
  64. Dizadji, N.; Sajadian, S.E. Modeling and optimization of the chamber of OWC system. Energy 2011, 36, 2360–2366. [Google Scholar] [CrossRef]
  65. Gomes, M.D.N.; Nascimento, C.D.D.; Bonafini, B.L.; Santos, E.D.D.; Isoldi, L.A.; Rocha, L.A.O. Two-dimensional geometric optimization of an oscillating water column converter in laboratory scale. Thermal Eng. 2012, 11, 30–36. [Google Scholar] [CrossRef]
  66. Cardoso, S.D.; Marques, W.C.; Kirinus, E.d.P.; Stringari, C.E. Levantamento batimétrico usando cartas náuticas. In 13ª Mostra da Produção Universitária; Federal University of Rio Grande: Rio Grande, Brazil, 2014. (In Portuguese) [Google Scholar]
  67. Mavriplis, D.J. Unstructured Grid Techniques. Annual Rev. Fluid Mec. 1997, 29, 473–514. [Google Scholar] [CrossRef]
  68. Gomes M das, N.; Isoldi, L.A.; Santos, E.D.; Rocha, L.A.O. Análise de Malhas para Geração Numérica de Ondas em Tanques. In Proceedings of the VII Congresso Nacional de Engenharia Mecânica, São Luiz, MA, USA, 1–10 July 2012. (In Portuguese). [Google Scholar]
  69. Barros, A.S.; Fragassa, C.; Paiva, M.d.S.; Rocha, L.A.O.; Machado, B.N.; Isoldi, L.A.; Gomes, M.d.N.; dos Santos, E.D. Numerical Study and Geometrical Investigation of an Onshore Overtopping Device Wave Energy Converter with a Seabed Coupled Structure. J. Mar. Sci. Eng. 2023, 11, 412. [Google Scholar] [CrossRef]
  70. Thum, G.Ü.; Maciel, R.P.; Oleinik, P.H.; Rocha, L.A.O.; dos Santos, E.D.; Seibt, F.M.; Machado, B.N.; Isoldi, L.A. Numerical Analysis of the Submerged Horizontal Plate Device Subjected to Representative Regular and Realistic Irregular Waves of a Sea State. Fluids 2024, 9, 188. [Google Scholar] [CrossRef]
  71. Barreiro, T.G. Estudo da Interação de uma onda Monocromática com um Conversor de Energia. Master’s Thesis, Universidade de Nova Lisboa, Lisbon, Portugal, 2009. (In Portuguese). [Google Scholar]
  72. Chai, T.; Draxler, R.R. Root mean square error (RMSE) or mean absolute error (MAE)? Arguments against avoiding RMSE in the literature. Geosci. Model Dev. 2014, 7, 1247–1250. [Google Scholar] [CrossRef]
  73. Maciel, R.P.; Fragassa, C.; Machado, B.N.; Rocha, L.A.O.; dos Santos, E.D.; Gomes, M.N.; Isoldi, L.A. Verification and Validation of a Methodology to Numerically Generate Waves Using Transient Discrete Data as Prescribed Velocity Boundary Condition. J. Mar. Sci. Eng. 2021, 9, 896. [Google Scholar] [CrossRef]
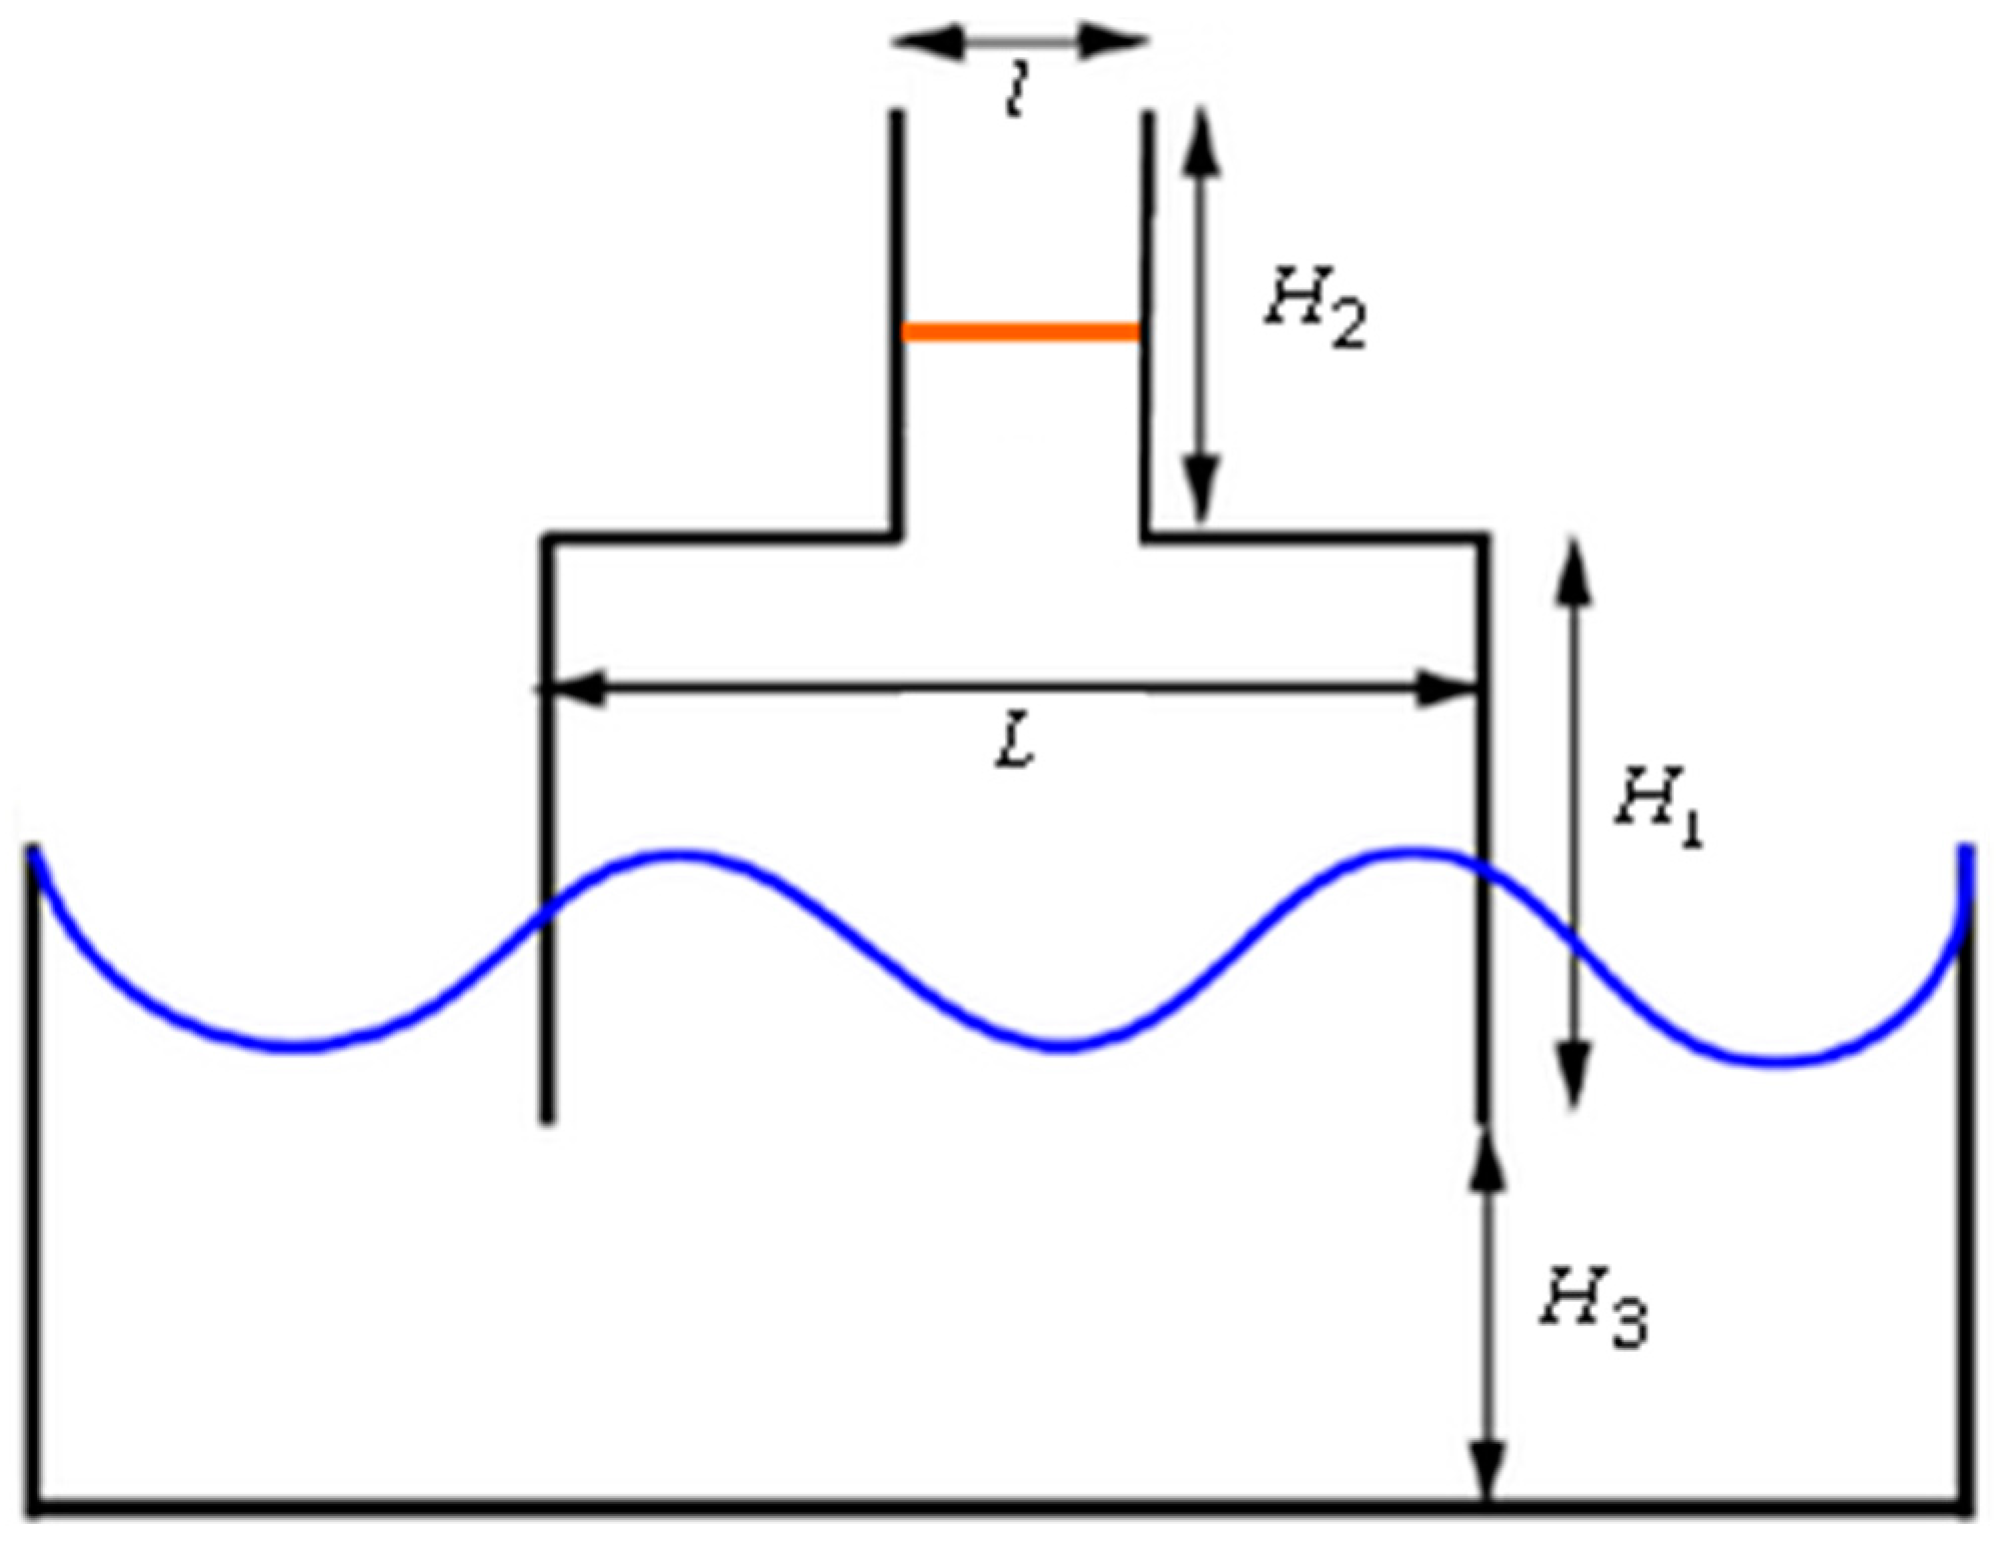
Figure 1. Geometry of the OWC WEC device.
Processes 12 02352 g001
Figure 2. Illustration of the geometric configuration of the OWC WEC based on the following parameters: (a) H 1 / L = 0.1985 ; (b) H 1 / L = 1.1167 ; and (c) H 1 / L = 2.2789 .
Processes 12 02352 g002
Figure 3. Computational domain used in the present study.
Processes 12 02352 g003
Figure 4. Illustration of the regions of the computational domain used to employ the stretched mesh.
Processes 12 02352 g004
Figure 5. Spatial discretization adopted in the present study, including (a) the computational domain; (b) the beginning of the wave channel; and (c) the OWC WEC region.
Processes 12 02352 g005
Figure 6. Free surface elevation monitored by the probe positioned at x = 41.82 m based on (a) 0 s   t   900 s and (b) 0 s   t   100 s.
Processes 12 02352 g006
Figure 7. Elevation of the free surface at time (a) t = 0 s and (b) t = 900 s.
Processes 12 02352 g007
Figure 8. Results found when H 1 / L is varied based on (a) p ( R M S ) and (b) m ˙ ( R M S ) .
Processes 12 02352 g008
Figure 9. P H ( R M S ) found for the OWC device when varying the degrees of freedom H 1 / L .
Processes 12 02352 g009
Figure 10. Hydrodynamic behavior of the flow over the OWC device at t = 0 s for (a) ( H 1 / L ) o = 0.3430 and (b) H 1 / L = 0.1985 ; t = 450 s for (c) ( H 1 / L ) o = 0.3430 and (d) H 1 / L = 0.1985 ; and t = 900 s for (e) ( H 1 / L ) o = 0.3430 and (f) H 1 / L = 0.1985 .
Processes 12 02352 g010
Figure 11. Comparison of the P H ( R M S ) values obtained in the present study with those from Mocellin et al. [22] when varying the degree of freedom H 1 / L .
Processes 12 02352 g011
Table 1. Methods and parameters employed in the present numerical simulations.
Parameters Numerical Inputs
Solver Pressure Based
Pressure–Velocity Coupling PISO
Spatial DiscretizationGradient EvaluationGreen Gauss Cell Based
PressurePRESTO
MomentumFirst Order Upwind
Volume FractionGeo-Reconstruct
Temporal Differencing Scheme First Order Implicit
Under-Relaxation FactorsPressure0.3
Momentum0.7
ResidualContinuity10−3
x Velocity
z Velocity
Regime Flow Laminar
Table 2. Characteristics of representative regular waves.
CharacteristicNomenclatureMagnitude
Height H (m)0.90
Lengthλ (m)45.91
Period T (s)5.70
Depthh (m)10.98
Table 3. Geometric configurations and dimensions considered.
H 1 / L H 1 (m) L (m)
0.19855.6528.46
0.22746.0426.59
0.25636.4225.04
0.28526.7723.74
0.31417.1022.62
0.34307.4221.65
0.37197.7320.79
0.40088.0220.03
0.42978.3119.34
0.660810.3115.16
0.892011.9813.43
1.116713.4012.00
1.354314.7610.90
1.585415.9710.07
1.816617.099.41
2.047818.158.86
2.278919.148.40
Table 4. Quantitative comparison of the influence of H1/L on PH(RMS).
H 1 / L P H ( R M S ) D R (%)
0.198528.19-
0.227428.71+1.81
0.256333.38+13.99
0.285249.79+32.95
0.314152.41+5.26
0.343056.66+7.50
0.371955.07−2.88
0.400853.57−2.80
0.429753.15−0.78
0.660846.95−11.66
0.892045.09−3.96
1.116743.06−4.50
1.354342.26−1.87
1.585441.70−1.31
1.816641.04−1.59
2.047840.64−0.98
2.278940.19−1.09
Table 5. Quantitative comparison with results found in Mocellin et al. [22].
H 1 / L P H ( R M S ) —Mocellin et al. [22] P H ( R M S ) —Present Study D W (%)
0.198525.4428.19+10.80
0.429719.8653.15+167.67
0.660817.6546.95+166.06
0.892016.0745.09+180.61
1.116714.8843.06+189.38
1.354313.9442.26+203.20
1.585413.1041.70+218.42
1.816612.3941.04+231.30
2.047811.7340.64+246.40
2.278911.1540.19+260.65
Disclaimer/Publisher’s Note: The statements, opinions and data contained in all publications are solely those of the individual author(s) and contributor(s) and not of MDPI and/or the editor(s). MDPI and/or the editor(s) disclaim responsibility for any injury to people or property resulting from any ideas, methods, instructions or products referred to in the content.