
Empirical Predictions on Wave Overtopping for Overtopping Wave Energy Converters: A Systematic Review


Abstract
1. Introduction
2. Bottom-Mounted Breakwaters
2.1. Overtopping Discharge
2.2. Distribution of Individual Overtopping Volume
2.3. Probability of Overtopping
3. Fixed OWEC
4. Floating OWECs
5. Conclusions and Further Work
Author Contributions
Funding
Conflicts of Interest
Abbreviations
| FOWT | Floating Offshore Wind Turbine |
| CROWN | Circular ramp overtopping wave energy converter |
| IEA | The International Energy Agency |
| KRISO | The Korea Research Institute of Ship and Ocean Engineering |
| OBSs | Oscillating body systems |
| OWCs | Oscillating water columns |
| OWECs | Overtopping wave energy converter |
| PTO | Power take-off |
| SSG | Sea-wave Slot-cone Generator |
| TAPCHAN | Tapered Channel |
| WD | Wave Dragon |
| Nomenclature | |
| Q | Non-dimensional average overtopping flow per crest meter width |
| Crest freeboard used for the vertical distance from mean water to | |
| the crest of the reservoir | |
| R | Non-dimensional crest freeboard |
| Significant wave height estimated from the zero-moment of the wave spectrum | |
| W | Crest width |
| g | Acceleration due to gravity |
| A | Weibull scale parameter |
| B | Weibull shape parameter |
| Breaker parameter | |
| Influence factor for a berm | |
| Influence factor for roughness elements on a slope | |
| Influence factor for oblique wave attack | |
| Influence factor for shallow foreshore | |
| Coefficient in equation of van der Meer and Bruce | |
| Coefficient in equation of van der Meer and Bruce | |
| Coefficient in equation of van der Meer and Bruce | |
| a | Weibull scale parameter |
| b | Weibull scale parameter |
| Probability of overtopping | |
| Probability of an individual wave volume | |
| Individual wave volume | |
| V | Specified volume |
| Slope angle | |
| Maximum overtopping volume | |
| Influence factor for slope angle | |
| Influence factor for limited draft | |
| Average amount of energy flux integrated from the draft up to the surface | |
| Average of energy flux integrated from the sea bed up to the surface | |
| Correction coefficient to address low-crest freeboard | |
| Dimensionless derivative of the overtopping discharge relative to the | |
| vertical distance | |
| z | Vertical distance |
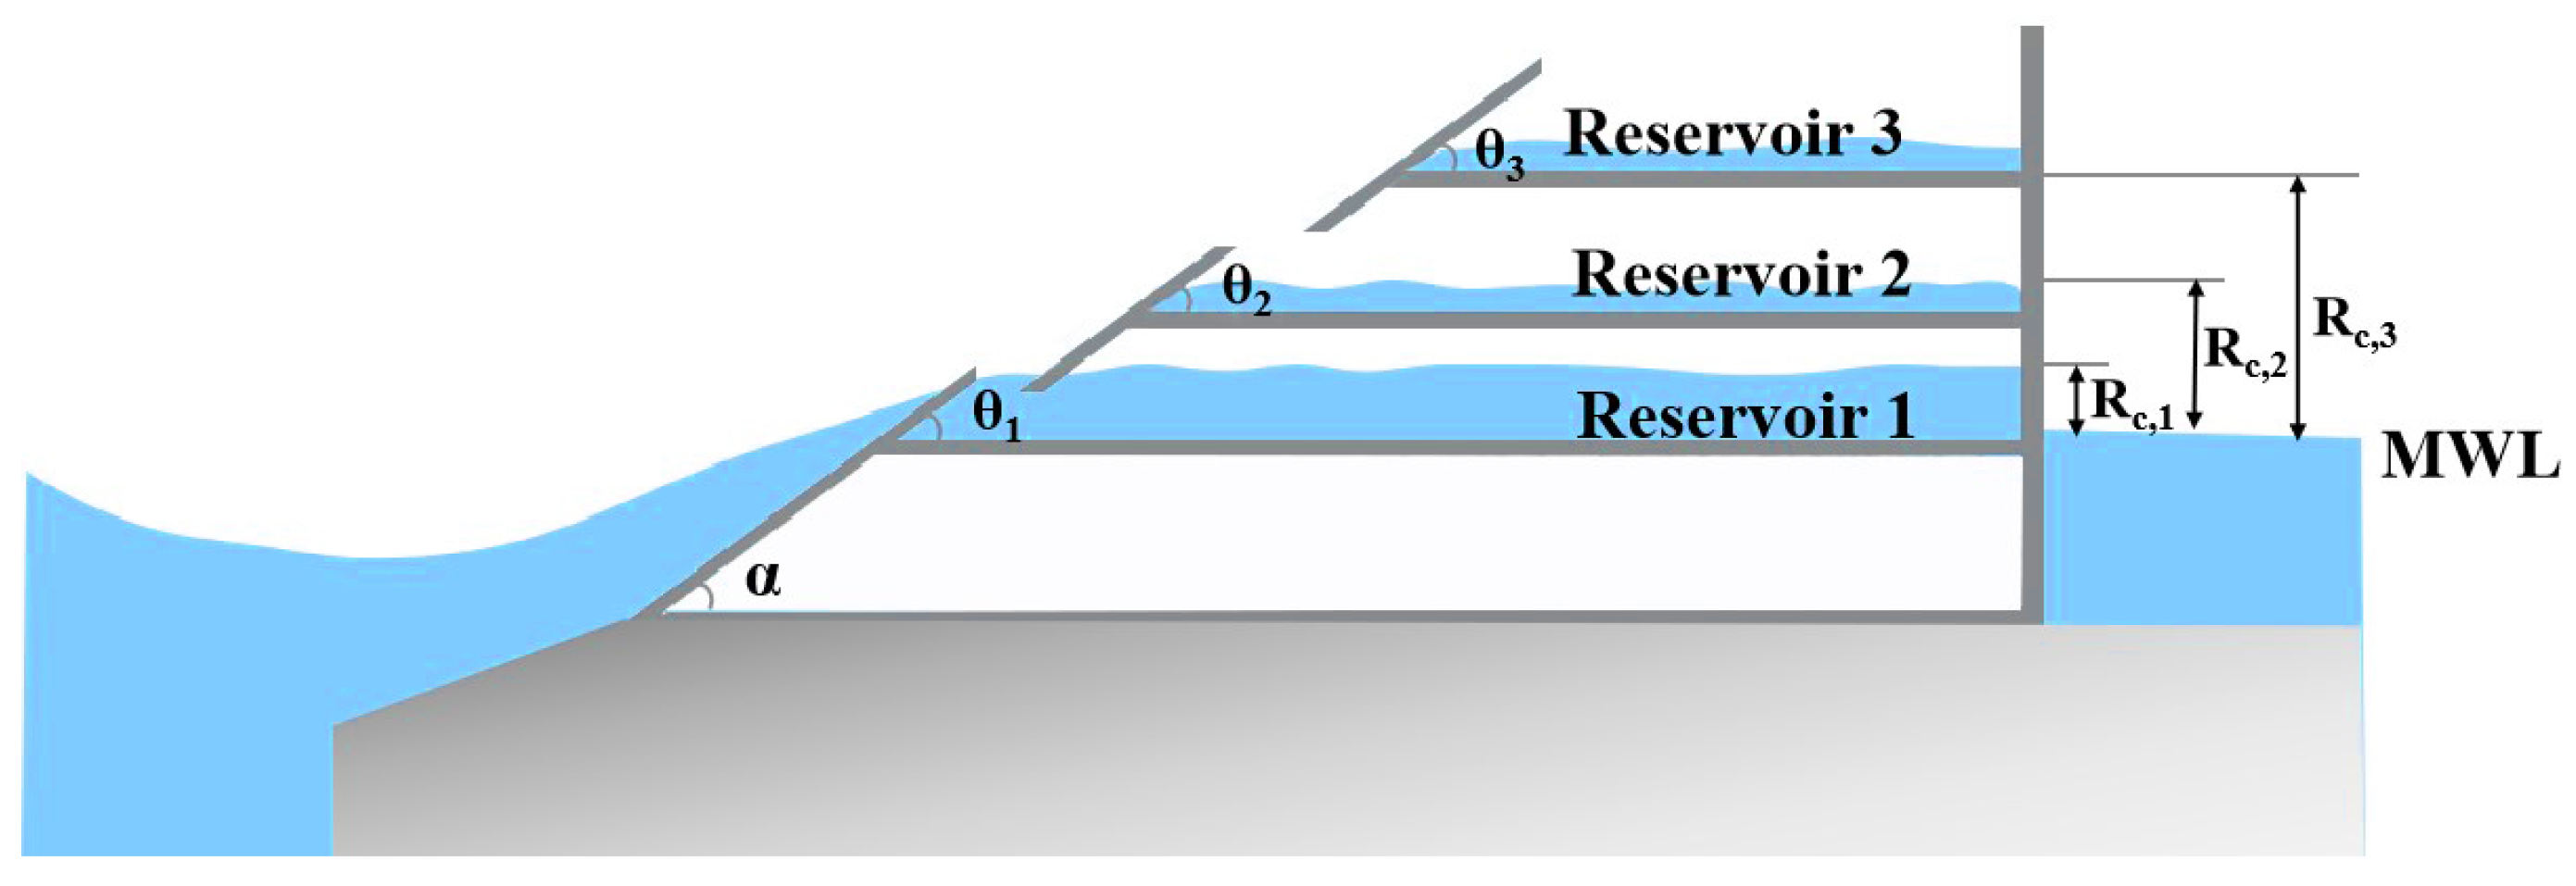
| Crest freeboard of the lowest reservoir | |
| Crest freeboard of the current reservoir | |
| Crest freeboard of the reservoir above | |
| Overtopping rates for the j-th reservoir | |
| q | Overtopping discharge |
| Reduction coefficient accounting for directional spreading effects | |
| L | Length of structure ramp |
| Wave steepness | |
| Deep water wave length | |
| Peak period | |
| Offset-correcting factor that describe the effect of the 3D Wave Dragon geometry | |
| Gain-correcting factor that describes the effect of the 3D Wave Dragon geometry | |
| Peak breaking parameter | |
| Amplified wave height due to the reflector arms | |
| Non-dimensional correcting functions of the opening of the reflectors | |
| Non-dimensional correcting functions of the draft of the reflectors | |
| Optimal opening angle at which wave amplification is maximized | |
| Diameter of circular reservoir open mouth | |
| Waterline of reservoir | |
| * | Superscript indicating dimensionless variable |
References
- Alkhabbaz, A.; Hamza, H.; Daabo, A.M.; Yang, H.S.; Yoon, M.; Koprulu, A.; Lee, Y.H. The aero-hydrodynamic interference impact on the NREL 5-MW floating wind turbine experiencing surge motion. Ocean. Eng. 2024, 295, 116970. [Google Scholar] [CrossRef]
- Robertson, A.N.; Jonkman, J.M. Loads analysis of several offshore floating wind turbine concepts. In Proceedings of the ISOPE International Ocean and Polar Engineering Conference, Maui, HI, USA, 21–26 June 2011; p. ISOPE-I. [Google Scholar]
- Castro-Santos, L.; Filgueira-Vizoso, A.; Carral-Couce, L.; Formoso, J.Á.F. Economic feasibility of floating offshore wind farms. Energy 2016, 112, 868–882. [Google Scholar] [CrossRef]
- Schwanitz, V.J.; Wierling, A. Offshore wind investments–realism about cost developments is necessary. Energy 2016, 106, 170–181. [Google Scholar] [CrossRef]
- Yang, H.S.; Alkhabbaz, A.; Tongphong, W.; Lee, Y.H. Cross-comparison analysis of environmental load components in extreme conditions for pontoon-connected semi-submersible FOWT using CFD and potential-based tools. Ocean. Eng. 2024, 304, 117248. [Google Scholar] [CrossRef]
- Edirisinghe, D.S.; Yang, H.S.; Gunawardane, S.; Alkhabbaz, A.; Tongphong, W.; Yoon, M.; Lee, Y.H. Numerical and experimental investigation on water vortex power plant to recover the energy from industrial wastewater. Renew. Energy 2023, 204, 617–634. [Google Scholar] [CrossRef]
- Cruz, J. Ocean Wave Energy: Current Status and Future Prespectives; Springer Science & Business Media: Berlin/Heidelberg, Germany, 2007. [Google Scholar]
- Thorpe, T.W. A Brief Review of Wave Energy (Report No. ETSU-R120). Report by UK Department of Trade and Industry (DTI). 1999. Available online: https://tethys-engineering.pnnl.gov/publications/brief-review-wave-energy (accessed on 30 August 2024).
- Clément, A.; McCullen, P.; Falcão, A.; Fiorentino, A.; Gardner, F.; Hammarlund, K.; Lemonis, G.; Lewis, T.; Nielsen, K.; Petroncini, S.; et al. Wave energy in Europe: Current status and perspectives. Renew. Sustain. Energy Rev. 2002, 6, 405–431. [Google Scholar] [CrossRef]
- Aderinto, T.; Li, H. Ocean wave energy converters: Status and challenges. Energies 2018, 11, 1250. [Google Scholar] [CrossRef]
- Falnes, J. A review of wave-energy extraction. Mar. Struct. 2007, 20, 185–201. [Google Scholar] [CrossRef]
- Bracco, G.; Giorcelli, E.; Mattiazzo, G. ISWEC: A gyroscopic mechanism for wave power exploitation. Mech. Mach. Theory 2011, 46, 1411–1424. [Google Scholar] [CrossRef]
- Harris, R.E.; Johanning, L.; Wolfram, J. Mooring systems for wave energy converters: A review of design issues and choices. In Proceedings of the Marec2004, Blyth, UK, 7–9 July 2004; pp. 180–189. [Google Scholar]
- Energy, A. Oscillating water column wave energy converter evaluation report. In The Carbon Trust, Marine Energy Challenge; The Carbon Trust: London, UK, 2005; pp. 1–196. [Google Scholar]
- Falcão, A.F.d.O. Wave energy utilization: A review of the technologies. Renew. Sustain. Energy Rev. 2010, 14, 899–918. [Google Scholar] [CrossRef]
- Evans, D.; Falcão, A.F.O. Hydrodynamics of Ocean Wave-Energy Utilization; Springer: Berlin/Heidelberg, Germany, 1986. [Google Scholar]
- Kofoed, J.; Frigaard, P. Indledende Hydrauliske Undersøgelser af Bølgeenergianlægget Power Pyramid; Aalborg Universitet, Inst. for Vand, Jord og Miljøteknik, Laboratoriet for Hydraulik og Havnebygning: Copenhagen, Denmark, 2000. [Google Scholar]
- Frigaard, P.; Trewers, A.; Kofoed, J.P.; Margheritini, L. Conceptual Design of Wave Plane; Department of Civil Engineering, Aalborg University: Aalborg, Denmark, 2008. [Google Scholar]
- Kofoed, J. Model Testing of the Wave Energy Converter Seawave Slot-Cone Generator; Number 18 in Hydraulics and Coastal Engineering; Department of Civil Engineering, Aalborg University: Aalborg, Denmark, 2005. [Google Scholar]
- Kofoed, J. Experimental Hydraulic Optimization of the Wave Energy Converter Seawave Slot-Cone Generator; Number 26 in Hydraulics and Coastal Engineering; Department of Civil Engineering, Aalborg University: Aalborg, Denmark, 2005; 29p. [Google Scholar]
- Kofoed, J.P.; Frigaard, P.; Friis-Madsen, E.; Sørensen, H.C. Prototype testing of the wave energy converter wave dragon. Renew. Energy 2006, 31, 181–189. [Google Scholar] [CrossRef]
- Fernandez, H.; Iglesias, G.; Carballo, R.; Castro, A.; Fraguela, J.; Taveira-Pinto, F.; Sanchez, M. The new wave energy converter WaveCat: Concept and laboratory tests. Mar. Struct. 2012, 29, 58–70. [Google Scholar] [CrossRef]
- Izzul, M.; Fadhli, M.; Azlan, M.; Noor, M. Parametric Study on Wave Overtopping due to Wedge Angle and Freeboard of Wavecat Wave Energy Converter. Univ. Malays. Teren. J. Undergrad. Res. 2022, 4, 37–50. [Google Scholar] [CrossRef]
- Liu, Z.; Hyun, B.S.; Jin, J. Numerical prediction for overtopping performance of OWEC. In Proceedings of the OCEANS 2008-MTS/IEEE Kobe Techno-Ocean, Kobe, Japan, 8–11 April 2008; pp. 1–6. [Google Scholar]
- Liu, Z.; Hyun, B.S.; Jin, J.Y. Computational analysis of parabolic overtopping wave energy convertor. J. Korean Soc. Mar. Environ. Energy 2009, 12, 273–278. [Google Scholar]
- Liu, Z.; Hyun, B.S.; Hong, K.; Jin, J. 3d numerical investigation on reservoir system for an overtopping wave energy convertor. In Proceedings of the ISOPE Pacific/Asia Offshore Mechanics Symposium, Busan, Republic of Korea, 14–17 November 2010; p. ISOPE-P. [Google Scholar]
- Vicinanza, D.; Contestabile, P.; Nørgaard, J.Q.H.; Andersen, T.L. Innovative rubble mound breakwaters for overtopping wave energy conversion. Coast. Eng. 2014, 88, 154–170. [Google Scholar] [CrossRef]
- Van der Meer, J.; Allsop, N.; Bruce, T.; De Rouck, J.; Kortenhaus, A.; Pullen, T.; Zanuttigh, B. EurOtop, 2018. Manual on Wave Overtopping of Sea Defences and Related Structures. An Overtopping Manual Largely Based on European Research, But for Worldwide Application. 2018. Available online: www.overtopping-manual.com (accessed on 1 December 2018).
- Cao, D.; Yuan, J.; Chen, H.; Zhao, K.; Liu, P.L.F. Wave overtopping flow striking a human body on the crest of an impermeable sloped seawall. Part I: Physical modeling. Coast. Eng. 2021, 167, 103891. [Google Scholar] [CrossRef]
- Chen, H.; Yuan, J.; Cao, D.; Liu, P.L.F. Wave overtopping flow striking a human body on the crest of an impermeable sloped seawall. Part II: Numerical modelling. Coast. Eng. 2021, 168, 103892. [Google Scholar] [CrossRef]
- Cao, D.; Lin, Z.; Yuan, J.; Tan, W.; Chen, H. Swash-flow induced forces on human body standing on a smooth and impermeable slope: A numerical study with experimental validations. Eng. Appl. Comput. Fluid Mech. 2024, 18, 2319768. [Google Scholar] [CrossRef]
- Cao, D.; Chen, H.; Yuan, J. Inline force on human body due to non-impulsive wave overtopping at a vertical seawall. Ocean. Eng. 2021, 219, 108300. [Google Scholar] [CrossRef]
- Van der Meer, J. Technical Report Wave Run-Up and Wave Overtopping at Dikes; TAW Report (Incorporated in the EurOtop Manual); Rijkswaterstaat, DWW(Department of Water and Wastewater): Utrecht, The Netherlands, 2002. [Google Scholar]
- Owen, M. Design of seawalls allowing for wave overtopping. Rep. Ex 1980, 924, 39. [Google Scholar]
- Van der Meer, J.W. Wave run-up and wave overtopping at dikes. In Wave Forces on Inclined and Vertical Structures; ASCE: New York, NY, USA, 1995. [Google Scholar]
- Van der Meer, J.; Bruce, T. New physical insights and design formulas on wave overtopping at sloping and vertical structures. J. Waterw. Port Coast. Ocean. Eng. 2014, 140, 04014025. [Google Scholar] [CrossRef]
- Smid, R.; Schüttrumpf, H.; Möller, J. Untersuchungen zur Ermittlung der mittleren Wellenüberlaufrate an einer senkrechten Wand und einer 1: 1, 5 geneigten Böschung für Versuche mit und ohne Freibord. Rep. Small Scale Tests 2001. [Google Scholar]
- Franco, L.; De Gerloni, M.; Van der Meer, J. Wave overtopping on vertical and composite breakwaters. In Coastal Engineering 1994; Coastal Engineering Proceedings; ASCE: New York, NY, USA, 1995; pp. 1030–1045. [Google Scholar]
- Allsop, N. Overtopping performance of vertical and composite breakwaters, seawalls and low reflection alternatives. In Proceedings of the Paper to Final MAST-MCS Project Workshop, Alderney, UK, 31 July 1995; University of Hannover: Hanover, Germany, 1995. [Google Scholar]
- Victor, L. Optimization of the Hydrodynamic Performance of Overtopping Wave Energy Converters: Experimental Study of Optimal Geometry and Probability Distribution of Overtopping Volumes. Ph.D. Thesis, Ghent University, Ghent, Belgium, 2012. [Google Scholar]
- Victor, L.; Van der Meer, J.; Troch, P. Probability distribution of individual wave overtopping volumes for smooth impermeable steep slopes with low crest freeboards. Coast. Eng. 2012, 64, 87–101. [Google Scholar] [CrossRef]
- Hughes, S.A.; Thornton, C.I.; Van der Meer, J.W.; Scholl, B. Improvements in describing wave overtopping processes. Coast. Eng. Proc. 2012, 1, 35. [Google Scholar] [CrossRef]
- Zanuttigh, B.; Van Der Meer, J.; Bruce, T.; Hughes, S. Statistical characterisation of extreme overtopping wave volumes. In Proceedings of the From Sea to Shore–Meeting the Challenges of the Sea: (Coasts, Marine Structures and Breakwaters 2013), Edinburg, UK, 17–20 September 2013; ICE Publishing: London, UK, 2014; pp. 442–451. [Google Scholar]
- Kofoed, J. Wave Overtopping of Marine Structures: Utilization of Wave Energy; Hydraulics & Coastal Engineering Laboratory, Department of Civil Engineering, Aalborg University: Aalborg, Denmark, 2002; 191p. [Google Scholar]
- Vicinanza, D.; Frigaard, P. Wave pressure acting on a seawave slot-cone generator. Coast. Eng. 2008, 55, 553–568. [Google Scholar] [CrossRef]
- Margheritini, L.; Vicinanza, D.; Frigaard, P. SSG wave energy converter: Design, reliability and hydraulic performance of an innovative overtopping device. Renew. Energy 2009, 34, 1371–1380. [Google Scholar] [CrossRef]
- Tanaka, H.; Inami, T.; Sakurada, T. Characteristics of volume of overtopping and water supply quantity for developing wave overtopping type wave power generation equipment. In Proceedings of the ISOPE International Ocean and Polar Engineering Conference, Big Island, HI, USA, 21–26 June 2015; p. ISOPE-I. [Google Scholar]
- Kofoed, J.P.; Frigaard, P.; Sorenson, H.C.; Friis-Madsen, E. Development of the wave energy converter-Wave Dragon. In Proceedings of the ISOPE International Ocean and Polar Engineering Conference, Seattle, WA, USA, 27 May–2 June 2000; p. ISOPE-I. [Google Scholar]
- Margheritini, L. R & D towards Commercialization of the Sea Wave Slot Cone Generators (SSG) Overtopping Wave Energy Converter. Ph.D. Thesis, Aalborg University, Department of Civil Engineering, Aalborg, Denmark, 2009. [Google Scholar]
- Margheritini, L.; Vicinanza, D.; Kofoed, J.P. Overtopping performance of Sea wave Slot cone Generator. In Coasts, Marine Structures and Breakwaters: Adapting to Change: Proceedings of the 9th International Conference, Edinburgh, UK, 16–18 September 2009; Thomas Telford Ltd.: London, UK, 2010; pp. 750–761. [Google Scholar]
- Kofoed, J.P.; Hald, T.; Frigaard, P.B. Experimental study of a multi level overtopping wave power device. In Proceedings of the 10th Congress of International Maritime Association of the Mediterranean (IMAM 2002), Crete, Greece, 13–17 May 2002. [Google Scholar]
- Kofoed, J.P.; Osaland, E. Crest level optimization of the multi level overtopping based wave energy converter seawave slot-cone generator. In Proceedings of the 6th European Wave and Tidal Energy Conference: EWTEC 2005: 6th Reflectors to Focus Wave Energy, Glasgow, UK, 29 August–2 September 2005; Department of Mechanical Engineering, University of Strathclyde: Glasgow, UK, 2005. [Google Scholar]
- Kofoed, J.P. Vertical distribution of wave overtopping for design of multi level overtopping based wave energy converters. In Coastal Engineering 2006: (in 5 Volumes); World Scientific: Singapore, 2007; pp. 4714–4726. [Google Scholar]
- Sørensen, H.; Friis-Madsen, E. Wave Dragon–Tests to Evaluate the Hydraulic Response; Aalborg University: Aalborg, Denmark, 1999. [Google Scholar]
- Martinelli, L.; Frigaard, P. The Wave Dragon: 3D Overtopping Tests on a Floating Model; Aalborg University: Aalborg, Denmark, 1999. [Google Scholar]
- Martinelli, L.; Frigaard, P. The Wave Dragon: Tests on a Modified Model; Hydraulics & Coastal Engineering Laboratory, Department of Civil Engineering, Aalborg University: Aalborg, Denmark, 1999. [Google Scholar]
- Frigaard, P.; Kofoed, J. Evaluation of Hydraulic Response of the Wave Dragon; Hydraulics & Coastal Engineering Laboratory, Department of Civil Engineering, Aalborg University: Aalborg, Denmark, 1999. [Google Scholar]
- Martinelli, L.; Frigaard, P. Low-Pressure Turbine and Control Equipment for Wave Energy Converters (Wave Dragon); Aalborg Universitet: Aalborg, Denmark, 2000. [Google Scholar]
- Hald, T.; Lynggaard, J. Hydraulic Model Tests on Modified Wave Dragon; Aalborg Universitet: Aalborg, Denmark, 2001. [Google Scholar]
- Tedd, J.; Kofoed, J.P. Measurements of overtopping flow time series on the Wave Dragon, wave energy converter. Renew. Energy 2009, 34, 711–717. [Google Scholar] [CrossRef]
- Frigaard, P.; Hald, T. Forces and Overtopping on 2nd Generation Wave Dragon for Nissum Bredning; Technical Report. Phase; Hydraulics & Coastal Engineering Laboratory, Aalborg University: Aalborg, Denmark, 2001. [Google Scholar]
- Kofoed, J.P.; Frigaard, P. Hydraulic Response of the Wave Energy Converter Wave Dragon in Nissum Bredning; Aalborg Universitet: Aalborg, Denmark, 2004. [Google Scholar]
- Parmeggiani, S.; Kofoed, J.P.; Friis-Madsen, E. Experimental update of the overtopping model used for the wave dragon wave energy converter. Energies 2013, 6, 1961–1992. [Google Scholar] [CrossRef]
- Liu, Z.; Shi, H.; Cui, Y.; Kim, K. Experimental study on overtopping performance of a circular ramp wave energy converter. Renew. Energy 2017, 104, 163–176. [Google Scholar] [CrossRef]


| Feature | Traditional Breakwaters | OWEC |
|---|---|---|
| Advantages | ||
| Energy Attenuation | Effective in reducing wave energy, providing a calm area for the operation of wave energy converters | Designed to allow wave energy to pass through, potentially useful for wave energy conversion |
| Structural Integrity | Proven design with well-understood structural characteristics, ensuring long-term stability | Can be optimized for wave energy conversion with specific geometries that facilitate overtopping |
| Environmental Compatibility | Generally has less impact on the surrounding marine environment due to their traditional design | Can be designed to minimize environmental impact while still allowing for efficient energy extraction |
| Limitations | ||
| Energy Conversion Efficiency | Not specifically designed for energy conversion, may not maximize the capture of wave energy | Relies on overtopping for energy conversion, which can be less efficient than other methods like direct wave capture |
| Structural Complexity | Simpler structures may not provide the optimal conditions for wave energy conversion | More complex structures compared to traditional breakwaters, which can increase construction and maintenance costs |
| Maintenance | May require less maintenance due to their straightforward design | Potentially higher maintenance due to moving parts or more intricate design features |
| Cost-Effectiveness | Lower initial construction costs due to simplicity, but may not generate revenue through energy production | Potentially higher maintenance due to moving parts or more intricate design features |
| Sources | Structures | Overtopping Model | Dimensionless Overtopping Discharge Q | Dimensionless Freeboard R | Applicability Range of Parameters |
|---|---|---|---|---|---|
| [34] | Impermeable smooth, rough, straight and bermed slopes | ||||
| [35] | Berm, foreshore, rough surface, mild slopes | (for ) | Slope angle | ||
| [36] | Steep slopes and vertical walls for relative deep water | ||||
| [38] | Vertical walls for relative deep water | ||||
| [28] | Steep slopes and vertical walls for relative deep water |
| Sources | Structures | Overtopping Model | Dimensionless Overtopping Discharge Q | Dimensionless Freeboard R | Applicability Range of Parameters |
|---|---|---|---|---|---|
| [44] | A single reservoir with smooth and non-permeable surface and linear profile, low relative crest freeboard | ||||
| [44] | Multi reservoirs with fronts and 35° linear slope |
| Sources | Structures | Overtopping Model | Dimensionless Overtopping Discharge Q | Dimensionless Freeboard R | Applicability Range of Parameters |
|---|---|---|---|---|---|
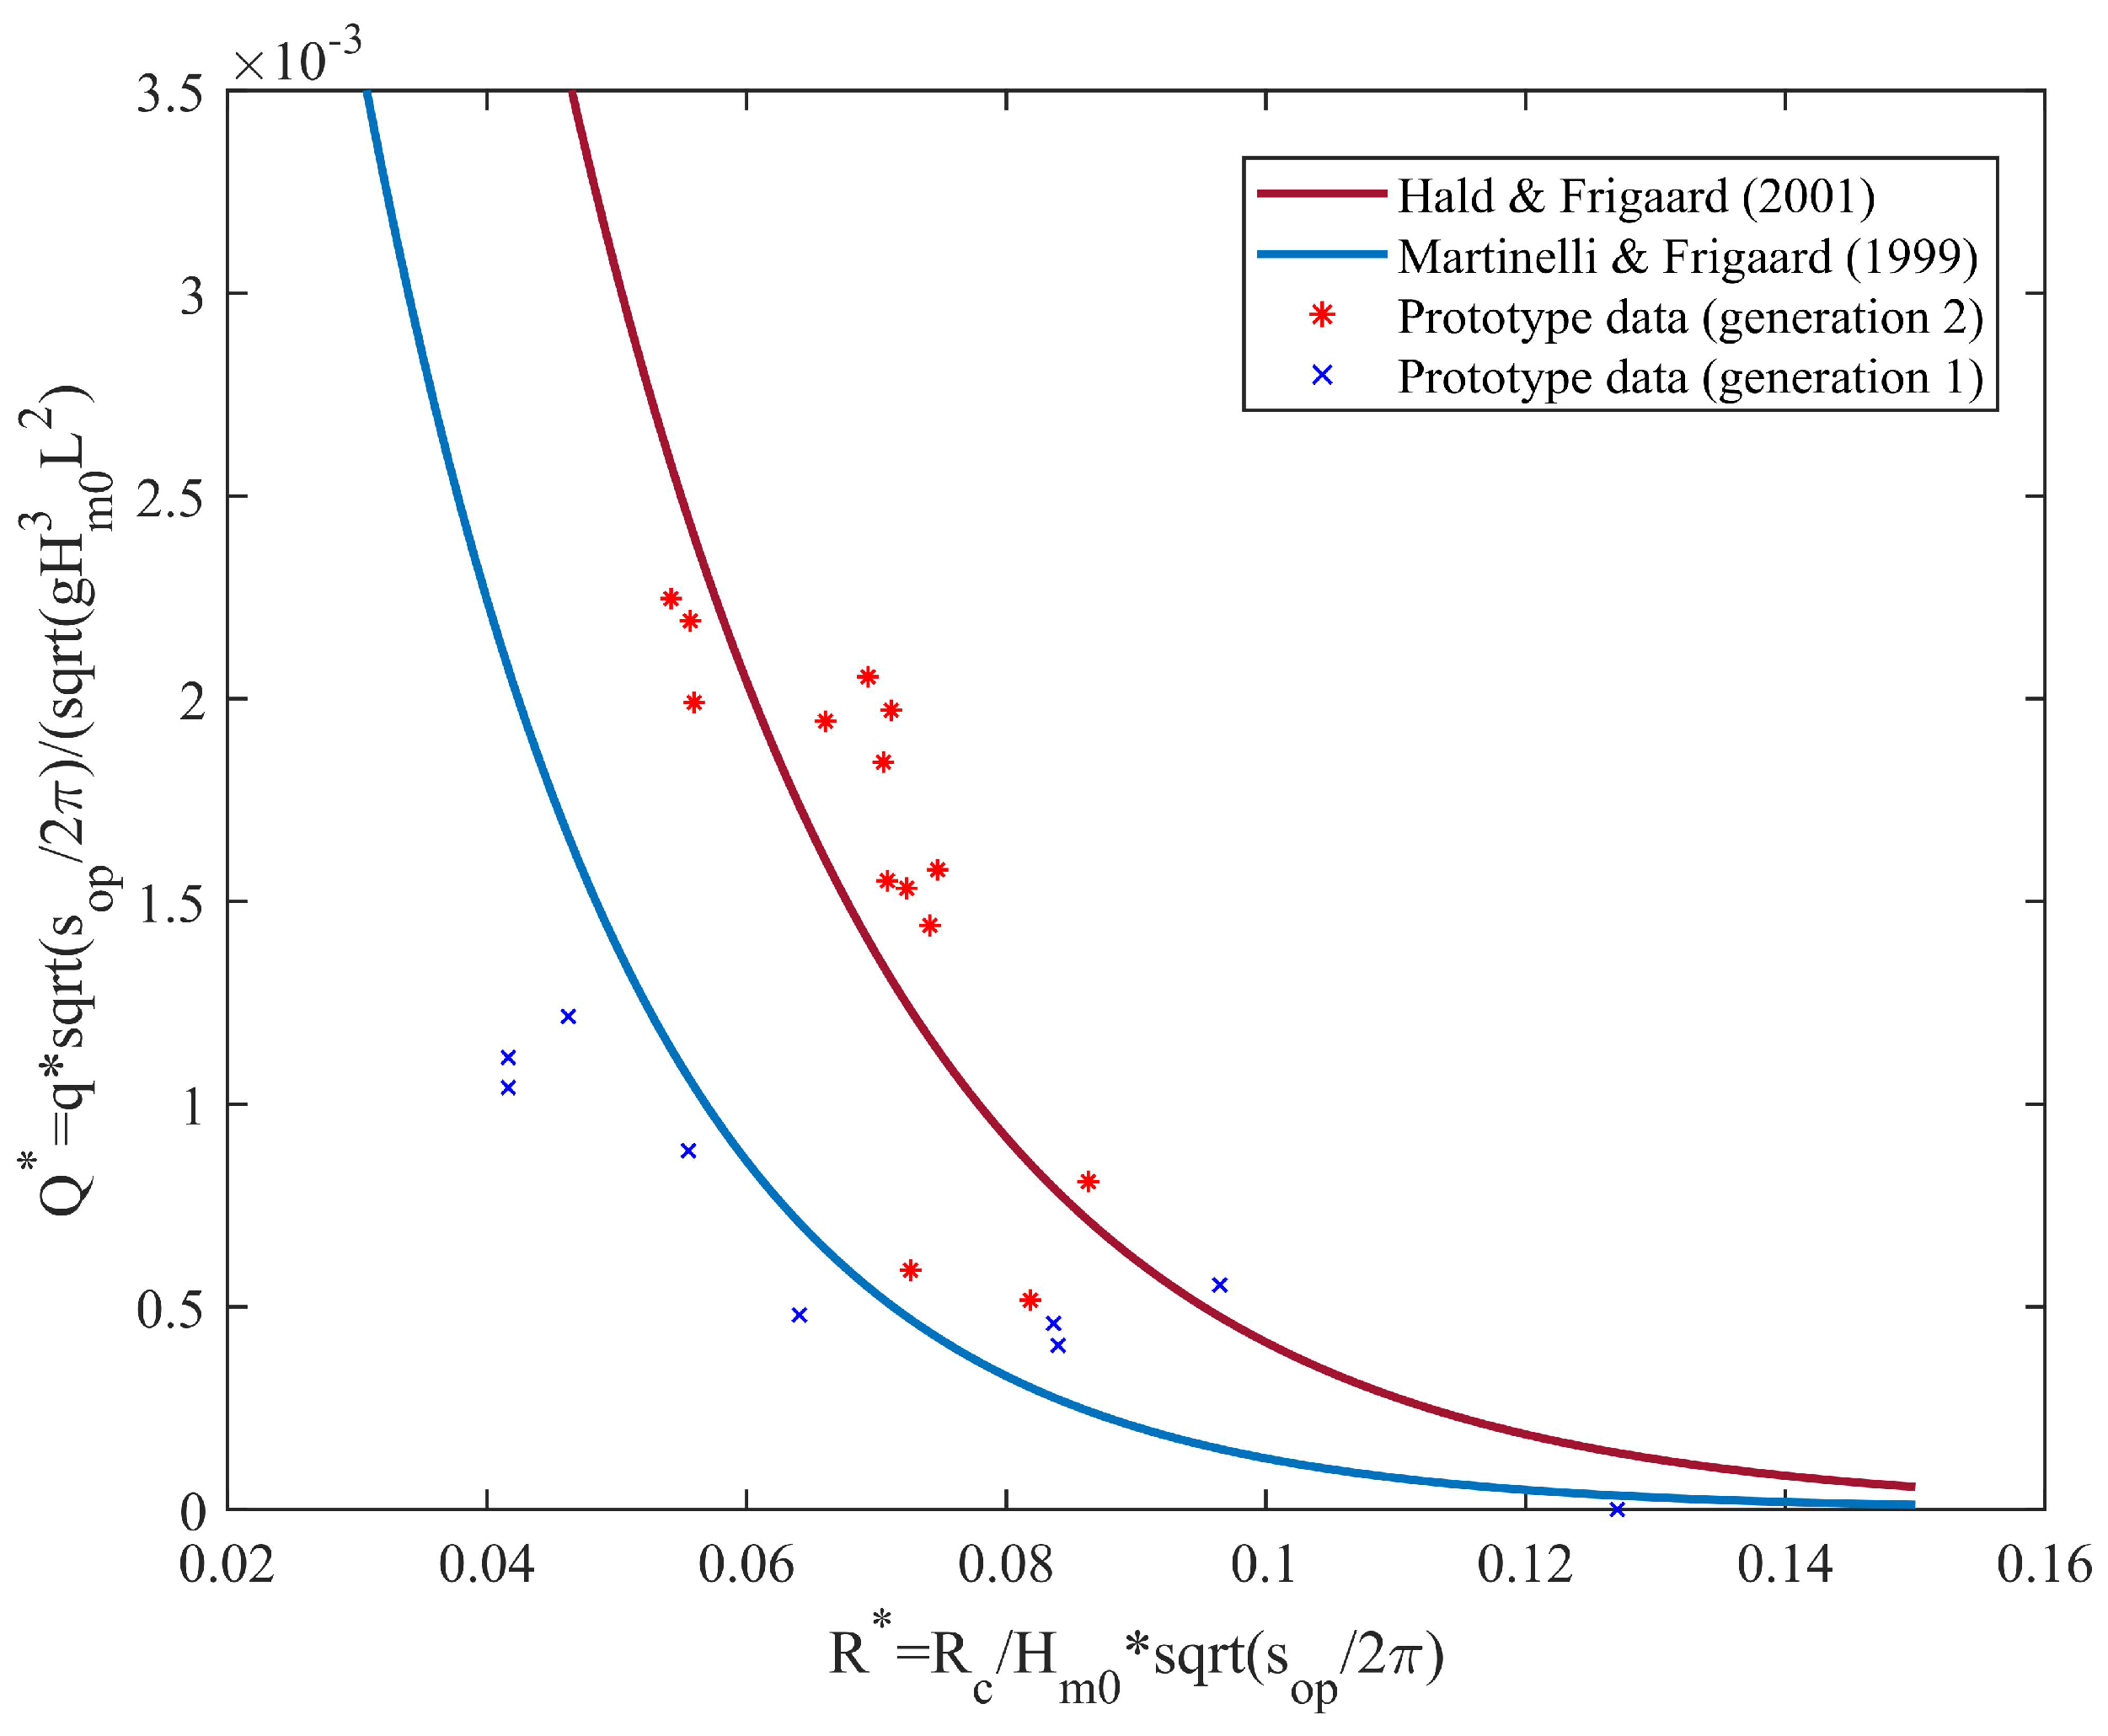
| [55] | 1. generation Wave Dragon with linear ramp inclination 45° | Significant wave height | |||
| [59] | 2. generation Wave Dragon with doubly-curved ramp | ||||
| [44] | Wave Dragon, low crest freeboard and limited draft | Slope angle, | |||
| [63] | 2 generation Wave Dragon |
Disclaimer/Publisher’s Note: The statements, opinions and data contained in all publications are solely those of the individual author(s) and contributor(s) and not of MDPI and/or the editor(s). MDPI and/or the editor(s) disclaim responsibility for any injury to people or property resulting from any ideas, methods, instructions or products referred to in the content. |
© 2024 by the authors. Licensee MDPI, Basel, Switzerland. This article is an open access article distributed under the terms and conditions of the Creative Commons Attribution (CC BY) license (https://creativecommons.org/licenses/by/4.0/).
Share and Cite
Cao, D.; He, J.; Chen, H. Empirical Predictions on Wave Overtopping for Overtopping Wave Energy Converters: A Systematic Review. Processes 2024, 12, 1940. https://doi.org/10.3390/pr12091940
Cao D, He J, Chen H. Empirical Predictions on Wave Overtopping for Overtopping Wave Energy Converters: A Systematic Review. Processes. 2024; 12(9):1940. https://doi.org/10.3390/pr12091940
Chicago/Turabian StyleCao, Deping, Jie He, and Hao Chen. 2024. "Empirical Predictions on Wave Overtopping for Overtopping Wave Energy Converters: A Systematic Review" Processes 12, no. 9: 1940. https://doi.org/10.3390/pr12091940
APA StyleCao, D., He, J., & Chen, H. (2024). Empirical Predictions on Wave Overtopping for Overtopping Wave Energy Converters: A Systematic Review. Processes, 12(9), 1940. https://doi.org/10.3390/pr12091940