Article

Study on the Vertical Propagation Behavior of Hydraulic Fractures in Thin Interbedded Tight Sandstone

1
College of Petroleum Engineering, China University of Petroleum, Beijing 102249, China
2
State Key Laboratory of Petroleum Resources & Engineering, Beijing 102249, China
3
CNOOC Research Institute, Beijing 100027, China
*
Author to whom correspondence should be addressed.
Processes 2024, 12(11), 2375; https://doi.org/10.3390/pr12112375
Submission received: 19 September 2024 / Revised: 23 October 2024 / Accepted: 23 October 2024 / Published: 29 October 2024

Abstract

:
Hydraulic fracturing technology is vital for the efficient extraction of oil and gas from low-permeability tight sandstone reservoirs.Taking the central Bohai oilfield in China as an example, these fields are typically composed of thinly interbedded tight sandstone, characterized by low permeability and significant lithological heterogeneity between layers. Fractures may either be confined, limiting vertical growth and reducing production, or overextend into water-bearing zones, causing contamination and compromising reservoir integrity. Therefore, predicting vertical fracture propagation during field fracturing operations is critical for efficient resource extraction.However, there is still a lack of comprehensive understanding of the mechanisms governing vertical fracture growth offshore.This paper applies numerical simulations based on the finite element method to elucidate the interlayer fracture propagation behavior in low-permeability tight sandstone reservoirs. A fracture propagation model for thin interlayered tight sandstone formations is constructed, and the effects of various factors on hydraulic fracture propagation are systematically analyzed, including geological factors such as interlayer stress contrast, thickness, and differences in elastic modulus, as well as operational parameters including fracturing fluid viscosity and injection rate. This study clarifies the cross-layer propagation patterns of hydraulic fractures under the influence of multiple factors and yields a comprehensive prediction chart for fracture propagation thickness under the combination of complex factors. The results of this research can provide theoretical support for the design of reservoir stimulation operations in low-permeability tight sandstone oilfields.

1. Introduction

As global demand for oil and gas resources continues to rise, the ongoing extraction of conventional reserves has led to their gradual depletion. Unconventional resources, such as tight oil, tight gas, coalbed methane, and shale oil and gas, offer substantial reserves, widespread distribution, and promising exploration and development prospects. Consequently, the effective development of these resources has become a major focus of researchers worldwide [1,2,3,4]. Tight sandstone reservoirs, a significant component of unconventional oil and gas resources, are typically characterized by low permeability, low porosity, low oil saturation, considerable vertical distribution, and marked heterogeneity [5,6,7,8,9,10,11,12,13]. In the absence of stimulation, natural production from these reservoirs is minimal, making hydraulic fracturing the primary technique for enhancing production from such formations [14,15]. Hydraulic fracturing plays a crucial role in the development of tight sandstone reservoirs.
Offshore oil and gas resources are becoming increasingly vital to the global energy supply as land-based reserves are depleted. Consequently, offshore exploration and development have become central to global energy expansion. China’s offshore region contains extensive low-permeability tight sandstone reservoirs, but offshore oil and gas development faces numerous challenges [13]. For instance, in the central Bohai oilfield, the reservoir comprises thin interbedded layers of mudstone and sandstone with varying thicknesses. During hydraulic fracturing, differences in mechanical and physical properties between lithological layers complicate predictions of vertical fracture propagation. This results in several uncontrolled factors, such as unpredictable vertical fracture growth, uncertain fracture geometries, and suboptimal stimulation outcomes. Hydraulic fractures often encounter resistance from mudstone layers, hindering vertical propagation and limiting stimulation efficiency. In some cases, fractures may connect with water-bearing formations, leading to oil and gas contamination and reduced economic returns. Therefore, understanding the mechanisms governing vertical fracture propagation in thin interbedded tight sandstone reservoirs is crucial to optimizing fracturing designs, improving production forecasts, and enhancing economic viability.
Some researchers have extensively investigated the mechanisms governing cross-layer hydraulic fracture propagation in thin interbedded tight sandstone formations. Adachi et al. [16] employed both theoretical and experimental methods to examine the effects of in situ stress on hydraulic fracture propagation in stratified reservoirs. Fisher et al. [17] analyzed field data on hydraulic fracture height growth, focusing on mechanisms that limit vertical propagation and explaining the predominant horizontal extension of fractures. Chen et al. [18] applied the cohesive zone model [13,19,20,21,22,23,24] to study the interaction between hydraulic fractures (HFs) and natural fractures (NFs). Chitrala et al. [25] examined hydraulic fracturing through acoustic emission monitoring [26,27]. Pu et al. [12] optimized fracture propagation patterns and parameters using electrical analog experiments and reservoir simulations. Liu et al. [28] developed mechanical and mathematical models for vertical hydraulic fracture propagation based on fracture mechanics principles. Arash Dahi Taleghani et al. [15] reviewed numerical models of HF and NF interactions, identifying key challenges and limitations in current modeling approaches. Ju et al. [29] investigated the 3D initiation and propagation of fractures in heterogeneous materials using the Combined Discrete Element Method (CDEM) [30], revealing distinct stages of fracture development under the coupled effects of horizontal stress anisotropy and material heterogeneity. Zou et al. [31] proposed a high-frequency propagation model for layered formations, using a combined finite element [32,33,34,35,36] and discrete element [37,38] approach to evaluate the impact of anisotropy, operational parameters, and injection pressure on 3D fracture propagation.
Through large-scale true triaxial experiments [39], Gao Jie et al. [40] explored the influence of layer selection, interlayer bonding strength, coal seam thickness, and fracturing fluid type on hydraulic fracture propagation. Rui Wu et al. [11] employed numerical simulations to manage fracture height during hydraulic fracturing in the tight sandstone gas reservoirs of the Shihezi Formation, Linxing block [10]. Their findings emphasize that in situ stress contrasts between layers, physical property variations, fracturing fluid viscosity, injection rate, and perforation location significantly impact fracture propagation. Hisanao Ouchi et al. [41] quantitatively analyzed vertical fracture propagation, identifying three propagation modes—crossing, turning, and branching—validated by experimental results. Pengju Xing et al. [42] conducted laboratory tests on zero-toughness hydraulic fractures, simulating vertical fracture propagation with lattice models [43] and developing multi-parameter control charts based on interlayer stress contrasts, vertical stress differences, fracture toughness, and interface properties. Bingxiang Huang et al. [44] investigated the micro-mechanisms of tensile failure and proposed mechanical criteria for the expansion of both primary and secondary (interlayer) fractures, shedding light on hydraulic fracture penetration of bedding planes.
V. Roche et al. [1] performed 3D modeling and studied stress disturbances during hydraulic fracturing in tight gas reservoirs with shale interlayers. AiBo Li [8] examined the effects of reservoir rock mechanics and in situ stress characteristics on cross-layer hydraulic fracturing in horizontal wells of thin interbedded tight sandstone reservoirs. Through fracture simulation, they analyzed the effects of in situ stress contrasts, interlayer thickness, and Young’s modulus differences between reservoirs and interlayers, elucidating the geological controls on cross-layer fracturing in horizontal wells. Shirong Cao [45] concluded that low interlayer stress contrasts, low elastic modulus differences, low permeability differences, and high injection rates increase the likelihood of hydraulic fractures penetrating interlayer interfaces. Zhuang Cui et al. [46] studied vertical hydraulic fracture propagation across multiple tight sandstone and mudstone production layers, applying cross-layer fracturing technology.
While most research has concentrated on onshore shale reservoirs, studies on offshore tight sandstone and mudstone interlayers remain in the exploratory phase, with limited comprehensive analysis of how multiple factors affect fracture propagation. This paper develops a hydraulic fracture propagation model for thin interbedded tight sandstone formations using the finite element method and cohesive zone model. By varying injection rates, interlayer stress contrasts, elastic modulus differences, and fracturing fluid viscosity, the study thoroughly examines vertical fracture propagation under the influence of multiple factors, predicting fracture morphology. The findings provide theoretical guidance for cross-layer hydraulic fracturing design in offshore low-permeability reservoirs.

2. Overview of the Study Area

The Bozhong Oilfield is located in the southern part of the Bohai Sea, 150 km northwest of Tanggu and 127 km southeast of Longkou, where low-permeability and ultra-low-permeability reservoirs are primarily found in the Shahejie Formation (Sha-2 and Sha-3 members), with oil reservoirs buried at depths of -3200 to -3900 m. The Sha-2 member consists of medium-porosity, low-permeability reservoirs, divided into six sub-layers with an average sand thickness of 3.3 to 7.2 m. The Sha-3 member is characterized by low-porosity, ultra-low-permeability reservoirs, with an average porosity of 13.9% and an average permeability of 7.7 mD. The geological reserves of low-permeability layers in the Sha-3 member account for 64% of the total, remaining largely untapped, with strong heterogeneity and significant differences in reservoir thickness. In Well Block 5, thick layers (90–100 m) are present, while in Well Block 4, thin layers (10–20 m) are observed, with ten sub-layers vertically and severe sand–mud interbedding, making it a key area for research and development (as shown in Figure 1).
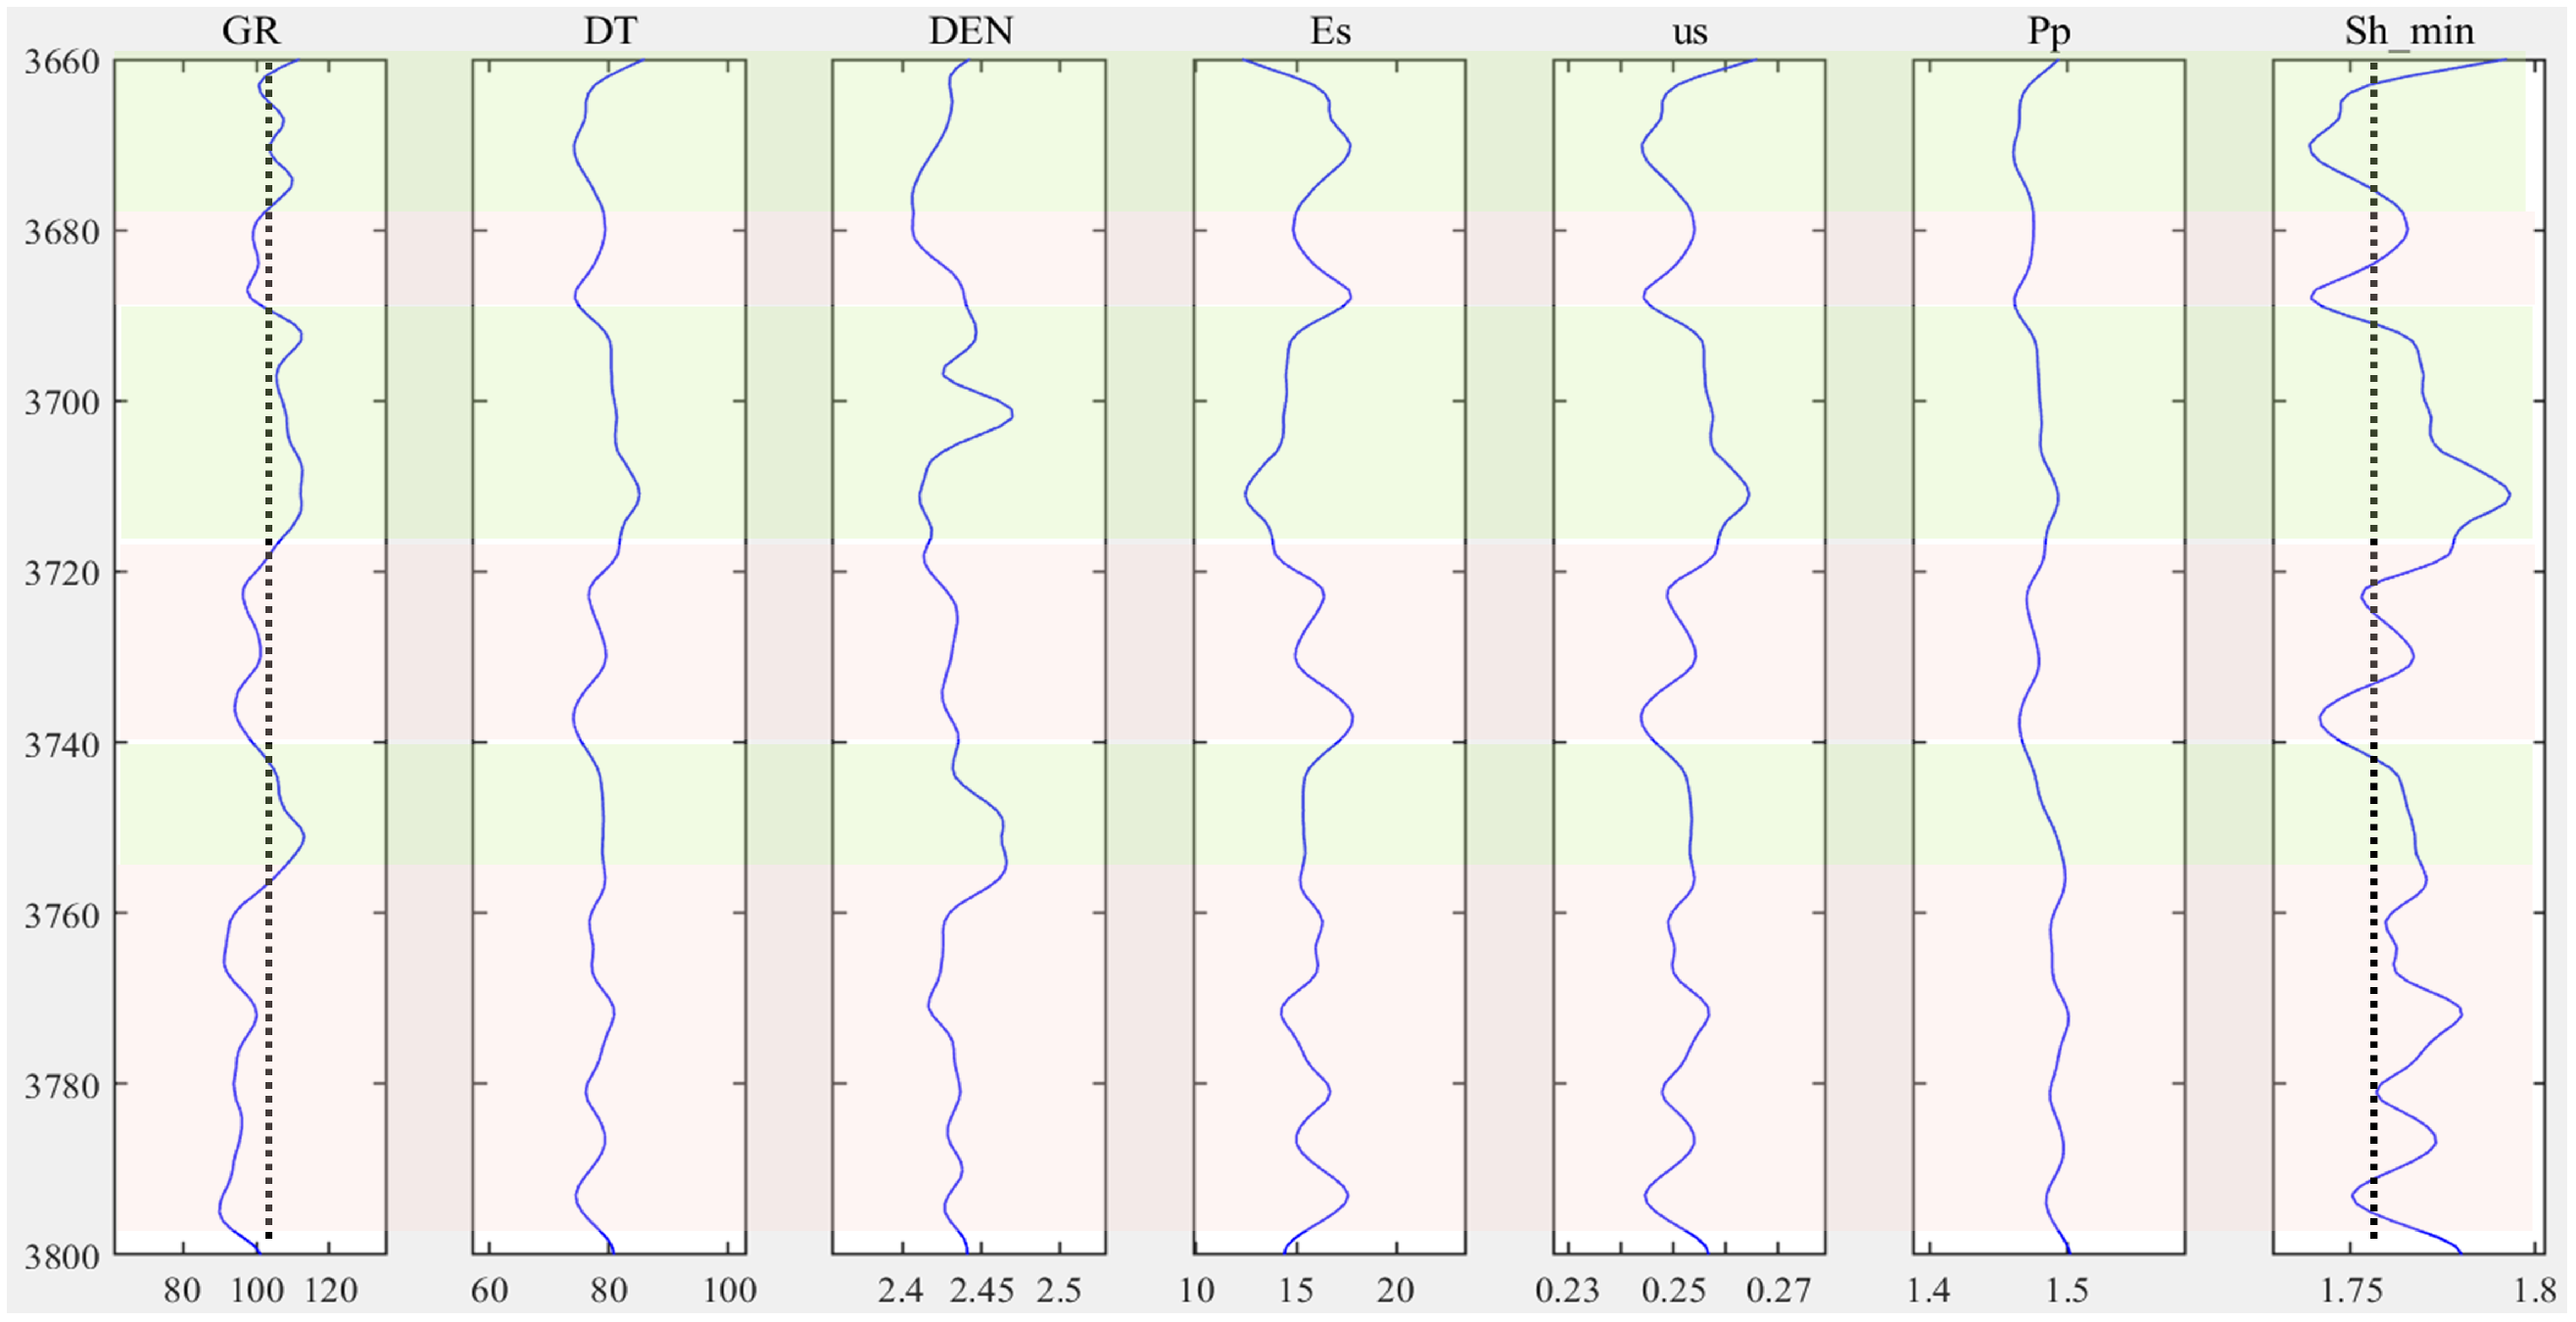
During fracturing, it is crucial to ensure vertical communication across all oil layers to maximize production potential, while overcoming the challenges of fracture imbalance caused by heterogeneity during horizontal multi-cluster fracturing design. Results based on well-logging data predictions (as shown in Figure 2) indicate that the formation elastic modulus of the Sha-3 member in Well Block 5 of the Bozhong Oilfield is around 15 GPa, with the elastic modulus of mudstone interlayers being approximately 3 GPa lower than that of sandstone reservoirs. Mudstone has weaker brittleness compared to sandstone reservoirs, and the minimum horizontal stress in sandstone reservoirs is about 4 MPa lower than in mudstone interlayers. Together, these factors contribute to the vertical containment of fractures, hindering the communication of multiple reservoirs along the vertical direction.
Due to platform space limitations, fractured wells in the central Bohai oilfield typically have low pump rates, small fluid volumes, and low proppant concentrations. Consequently, the overall fracture network generated is small, and dynamic analysis indicates that the actual propped fracture half-length is significantly shorter than the designed length, reaching only 25% to 50% of the created fracture half-length (see Table 1).
The generalized fracturing strategy lacks reservoir specificity, leading to inadequate vertical transformation of the formation. Post-fracturing, production rates for some wells have fallen below expectations, with rapid decline rates and short effective production lifespans. Taking the typical well C37H as an example, a horizontal well with multi-stage fracturing was employed, with five fracture stages designed and executed, and a fracture spacing of approximately 100 m. The reservoir thickness is 113 m, with a mudstone interlayer of 73 m. The fracture height obtained from inversion analysis is about 64 m, resulting in a penetration ratio of 0.56. The dynamically interpreted fracture half-length is 40 m. Due to the low pump rates, small fluid volumes, low proppant concentrations, and a small but relatively thick interlayer stress contrast, it was difficult for fractures to propagate vertically. This led to short fractures and a low vertical penetration ratio.

3. Method

3.1. Cohesive Zone Model

This paper employs the finite element method and the cohesive zone model to study the vertical propagation behavior of hydraulic fractures. To provide a more comprehensive understanding, a brief introduction to the theory behind the cohesive zone model is included.

3.1.1. Cohesive Element

Cohesive elements are a type of bonding element used to simulate the bonding connection between two types of materials. These elements require that the size and strength of the bonding material be smaller than the bonded parts, thus allowing the simulation of material fracture using cohesive elements. Cohesive elements can be understood as quasi-two-dimensional elements, representing two surfaces separated by a zero-thickness layer. These surfaces are bonded to other solid elements, and based on the traction–separation criterion, the initiation and propagation of cracks are determined.
Since cohesive elements simulate crack propagation through stiffness degradation, it is necessary to predefine the damage parameters of the elements. When the elements are fully damaged, the middle layer of the cohesive element begins to separate, causing geometric discontinuity in the model, thus forming hydraulic fractures. Essentially, the process of hydraulic fracture propagation is also the process of cohesive element deletion. According to the constitutive relationship of two-dimensional cohesive elements at the onset of damage, the damage parameters include normal stress and shear stress:
t n t s t t = E n n E n s E n t E n s E s s E s t E n t E s t E t t ε n ε s ε t = E ε
In the equation,
ε n = δ n T 0
ε s = δ s T 0
ε t = δ t T 0
where
  • T 0 represents the initial thickness of the cohesive element;
  • δ n represents the displacement in the normal direction;
  • δ s and δ t represent the displacements in the two directions perpendicular to the normal.

3.1.2. The Criterion for Crack Initiation and Propagation

The cohesive zone model uses the traction–separation criterion to determine the initiation and propagation of hydraulic fractures. It leverages the damage deletion characteristic of cohesive elements to represent the fracture propagation trajectory. In this paper, a linear criterion is adopted to describe the traction–separation behavior of cohesive elements. When the displacement of the cohesive element is less than the displacement at the onset of damage, the stress in the cohesive element follows a linear elastic process until it reaches the maximum traction. During this phase, both the loading and unloading processes are reversible. However, when the displacement exceeds the damage initiation threshold, the cohesive element begins to separate, and the stiffness degradation gradually approaches 1, making the loading and unloading process irreversible.
This study uses the maximum principal stress criterion to determine whether the cohesive elements undergo initial damage. That is, if the stress in one of the three directions exceeds the corresponding critical value, hydraulic fracture initiation begins, as described by the following:
max { t n t n o , t s t s o , t t t t o } = 1
where
  • t n represents the normal stress;
  • t s and t t represent the shear stresses in two directions;
  • 〈〉 indicates that no damage occurs under tensile or compressive stress;
  • the superscript m a x denotes the critical values.
A damage model typically consists of three parts: a crack initiation criterion, a damage evolution law, and post-failure treatment. The crack propagation process is described using the stiffness degradation p of the cohesive element. The stress expressions in the three directions are given by the following:
t n = ( 1 D ) t ¯ n , t ¯ n 0 t ¯ n
t s = ( 1 D ) t ¯ s
t t = ( 1 D ) t ¯ t
where
  • t n represents the actual normal stress;
  • D is the damage factor;
  • t ¯ n is the undamaged normal stress, which characterizes the overall failure extent of the cohesive element;
  • t s and t t represent the shear stresses in two directions;
  • t ¯ s and t ¯ t are the undamaged shear stresses in the two directions.
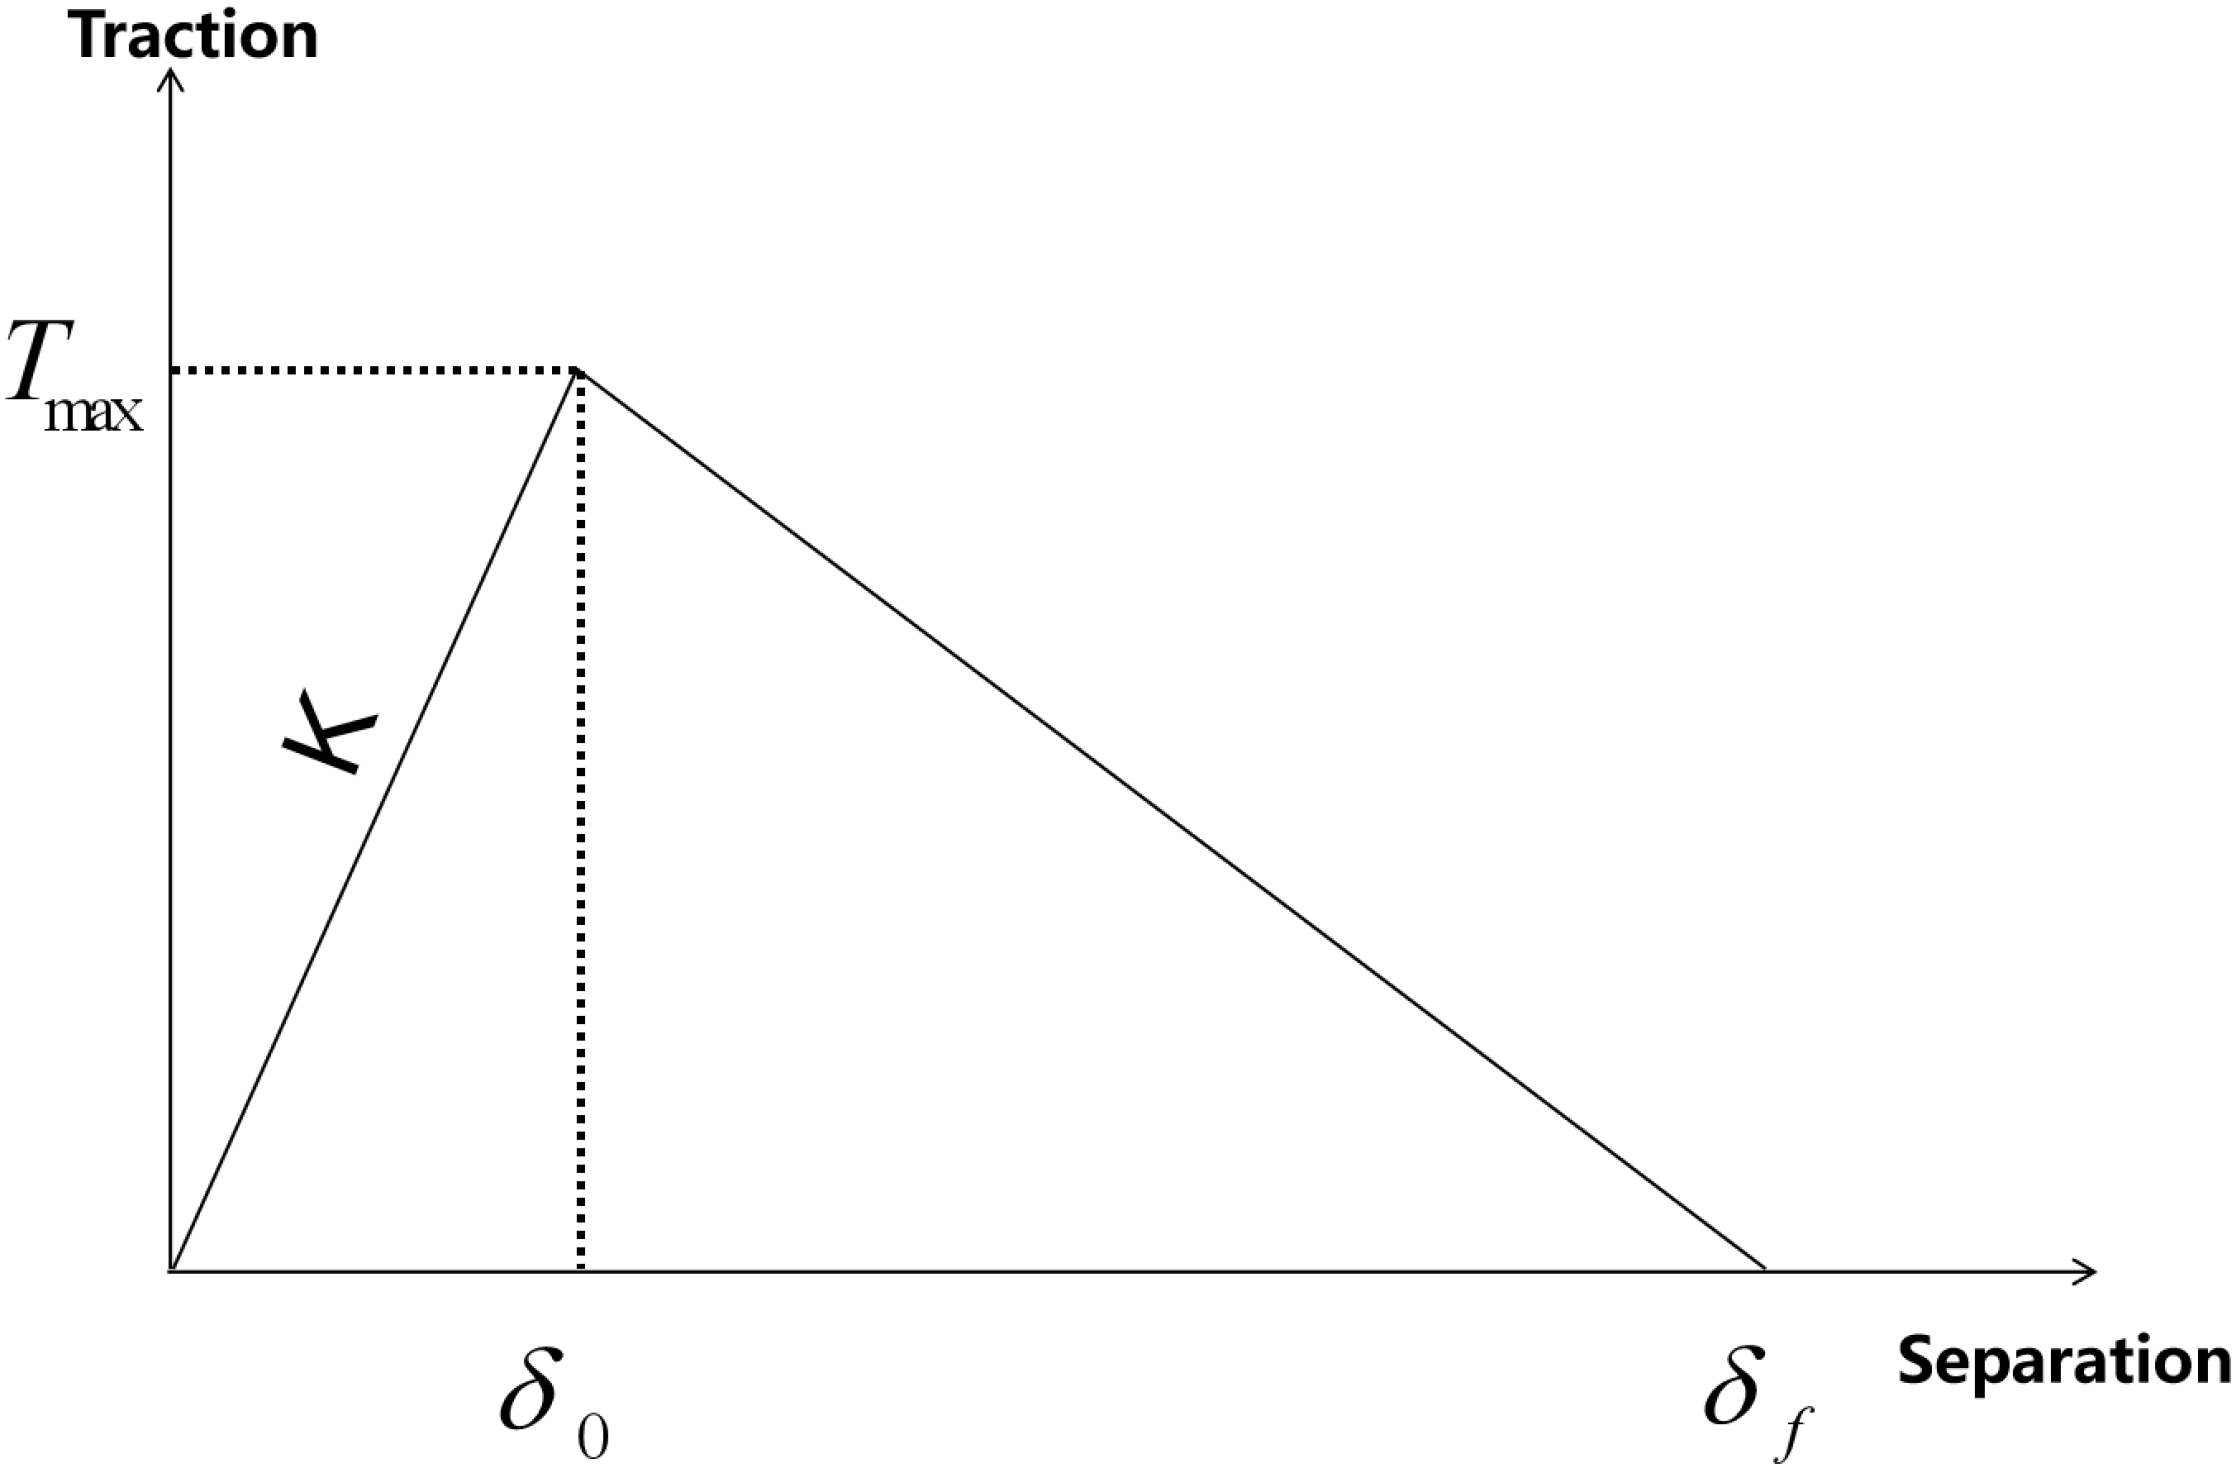
The cohesive force is governed by the interface damage factor. Figure 3 illustrates the damage evolution process based on the linear displacement criterion (with the horizontal axis δ representing the opening displacement of the cohesive element and the vertical axis T representing the stress). T 0 is the initial damage stress. After the onset of element damage, the damage variable D increases linearly from 0 to 1, and its expression is given by the following:
D = δ f ( δ m δ 0 ) δ m ( δ f δ 0 )
where
  • δ 0 and δ f represent the initial and final damage displacements,
  • δ m represents the maximum displacement.
Figure 3. Traction–separation response.
Processes 12 02375 g003

3.1.3. The Fluid Flow Equation Within Fractures

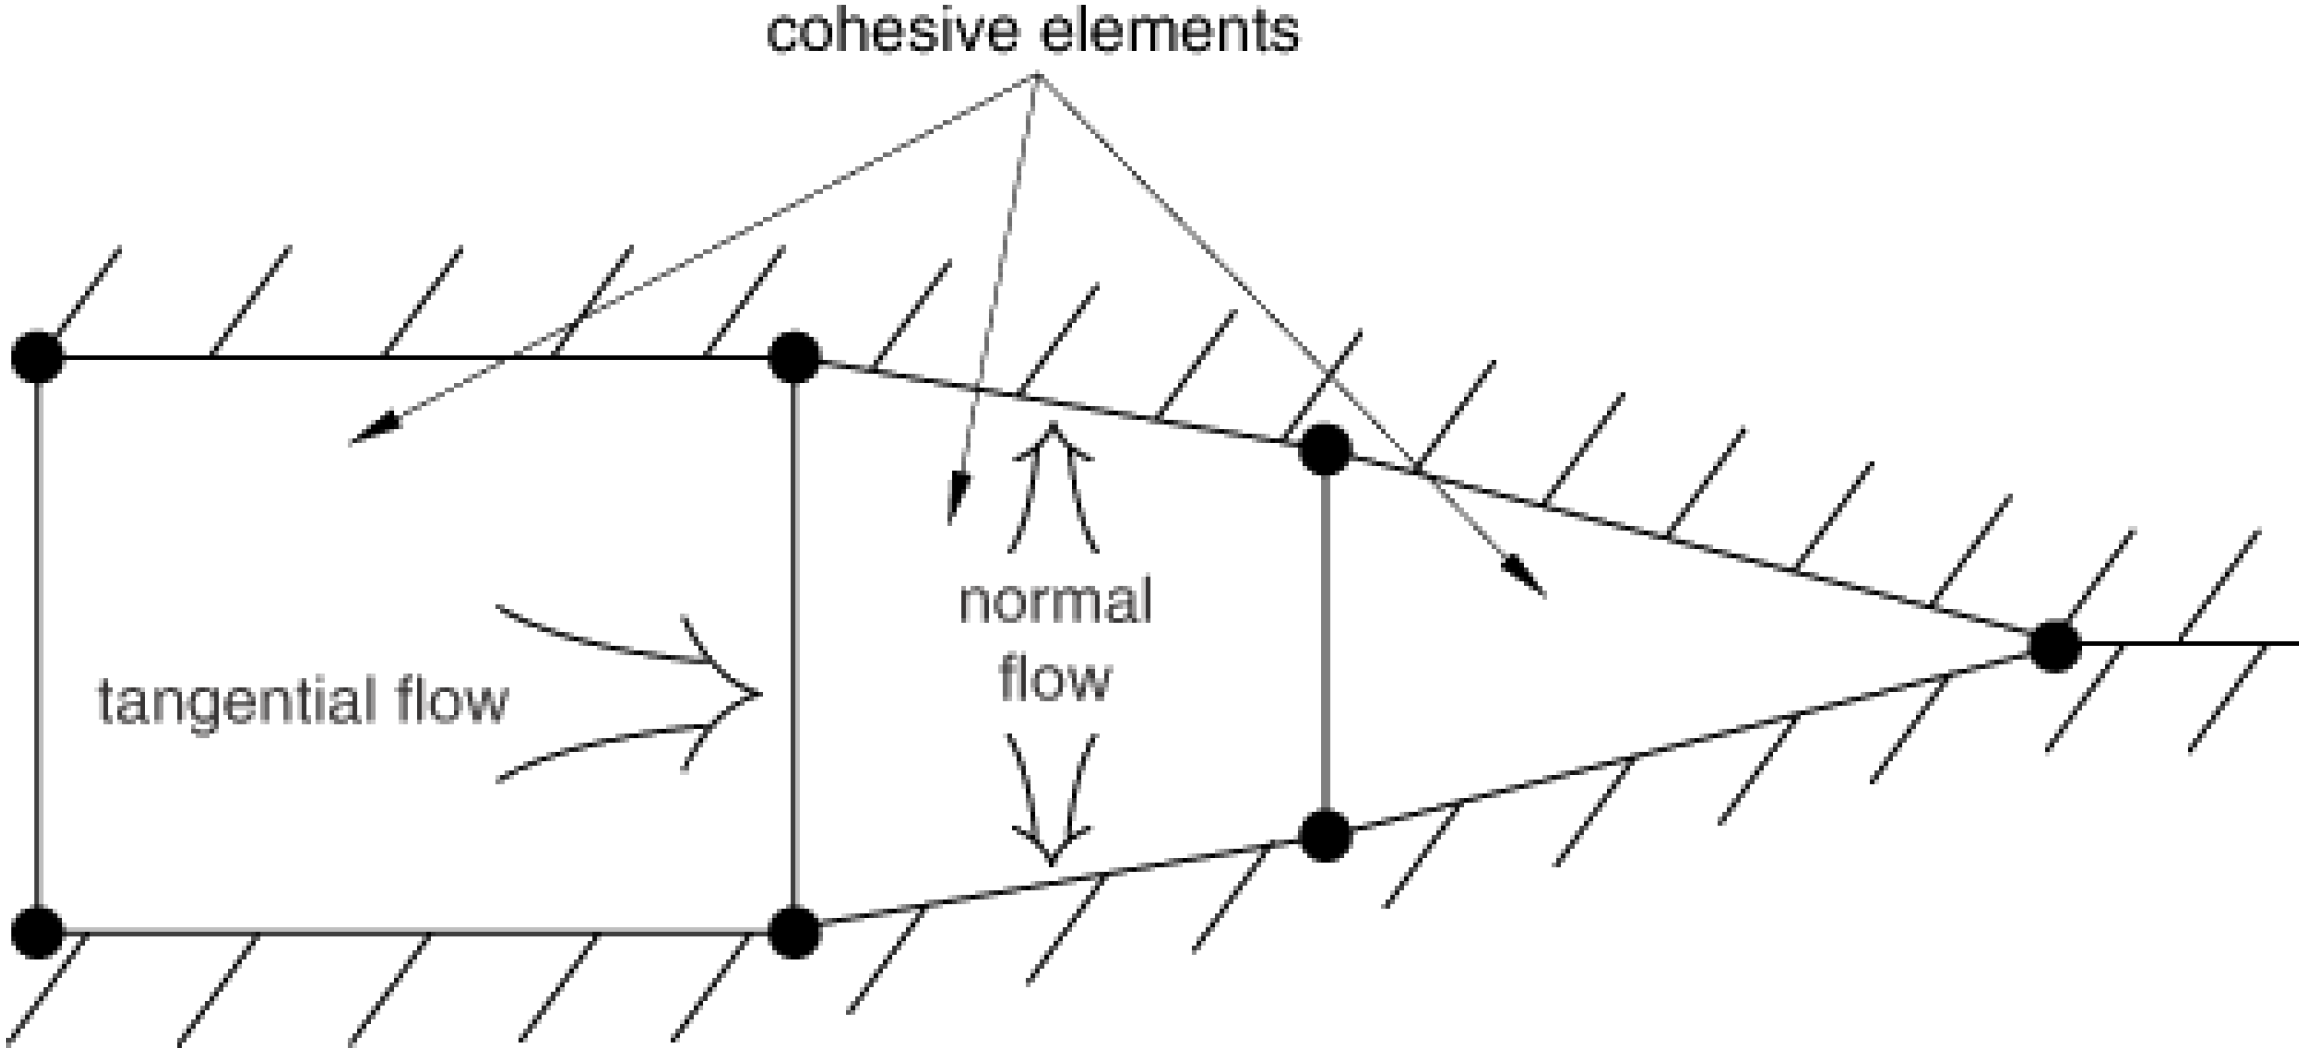
The fluid described by the cohesive elements is an incompressible, continuous fluid. In the simulation of hydraulic fracturing, there are two main flow modes of the fracturing fluid: tangential flow along the fracture propagation direction and normal flow along the fracture opening direction, as shown in Figure 4:
Typically, tangential flow is described using either Newtonian fluid or power-law models. This paper uses a Newtonian fluid, whose flow characteristics satisfy the following equation:
q = d 3 12 μ p
where
  • q represents the tangential flow rate;
  • d is the fracture width;
  • μ is the viscosity of the fracturing fluid;
  • p is the fluid pressure gradient.
Normal flow is primarily used to describe the fluid loss from the cohesive element to the upper and lower surfaces of the rock, and its characteristics are given by the following equation:
q t = c t ( p i p t )
q b = c b ( p i p b )
where
  • q t and q b represent the flow rates at the upper and lower surfaces, respectively;
  • c t and c b are the leakage coefficients at the upper and lower surfaces, respectively;
  • p i is the fluid pressure within the hydraulic fracture;
  • p t and p b are the pore pressures at the upper and lower surfaces, respectively.

3.2. Numerical Model

Geological and well-logging data from fractured wells reveal that the primary reservoir in the Bohai central oilfield lies at depths between 3200 and 3900 m, with low-permeability layers accounting for 64% of the geological reserves. The average sand thickness ranges from 3.3 to 7.2 m and is characterized by thin vertical layers interbedded with significant sand–mudstone layers. The reservoir sandstone exhibits moderate brittleness, with an average elastic modulus of 15 GPa. The Poisson’s ratio is 0.25 for sandstone and 0.30 for mudstone. The formation’s tensile strength is 3 MPa, while the fracture energy is 4000 J. Both sandstone and mudstone layers experience identical stress conditions, with a maximum horizontal stress of 70 MPa, a minimum horizontal stress of 62 MPa, and an overburden pressure of 80 MPa. Additional rock mechanics and operational parameters are summarized in Table 2.
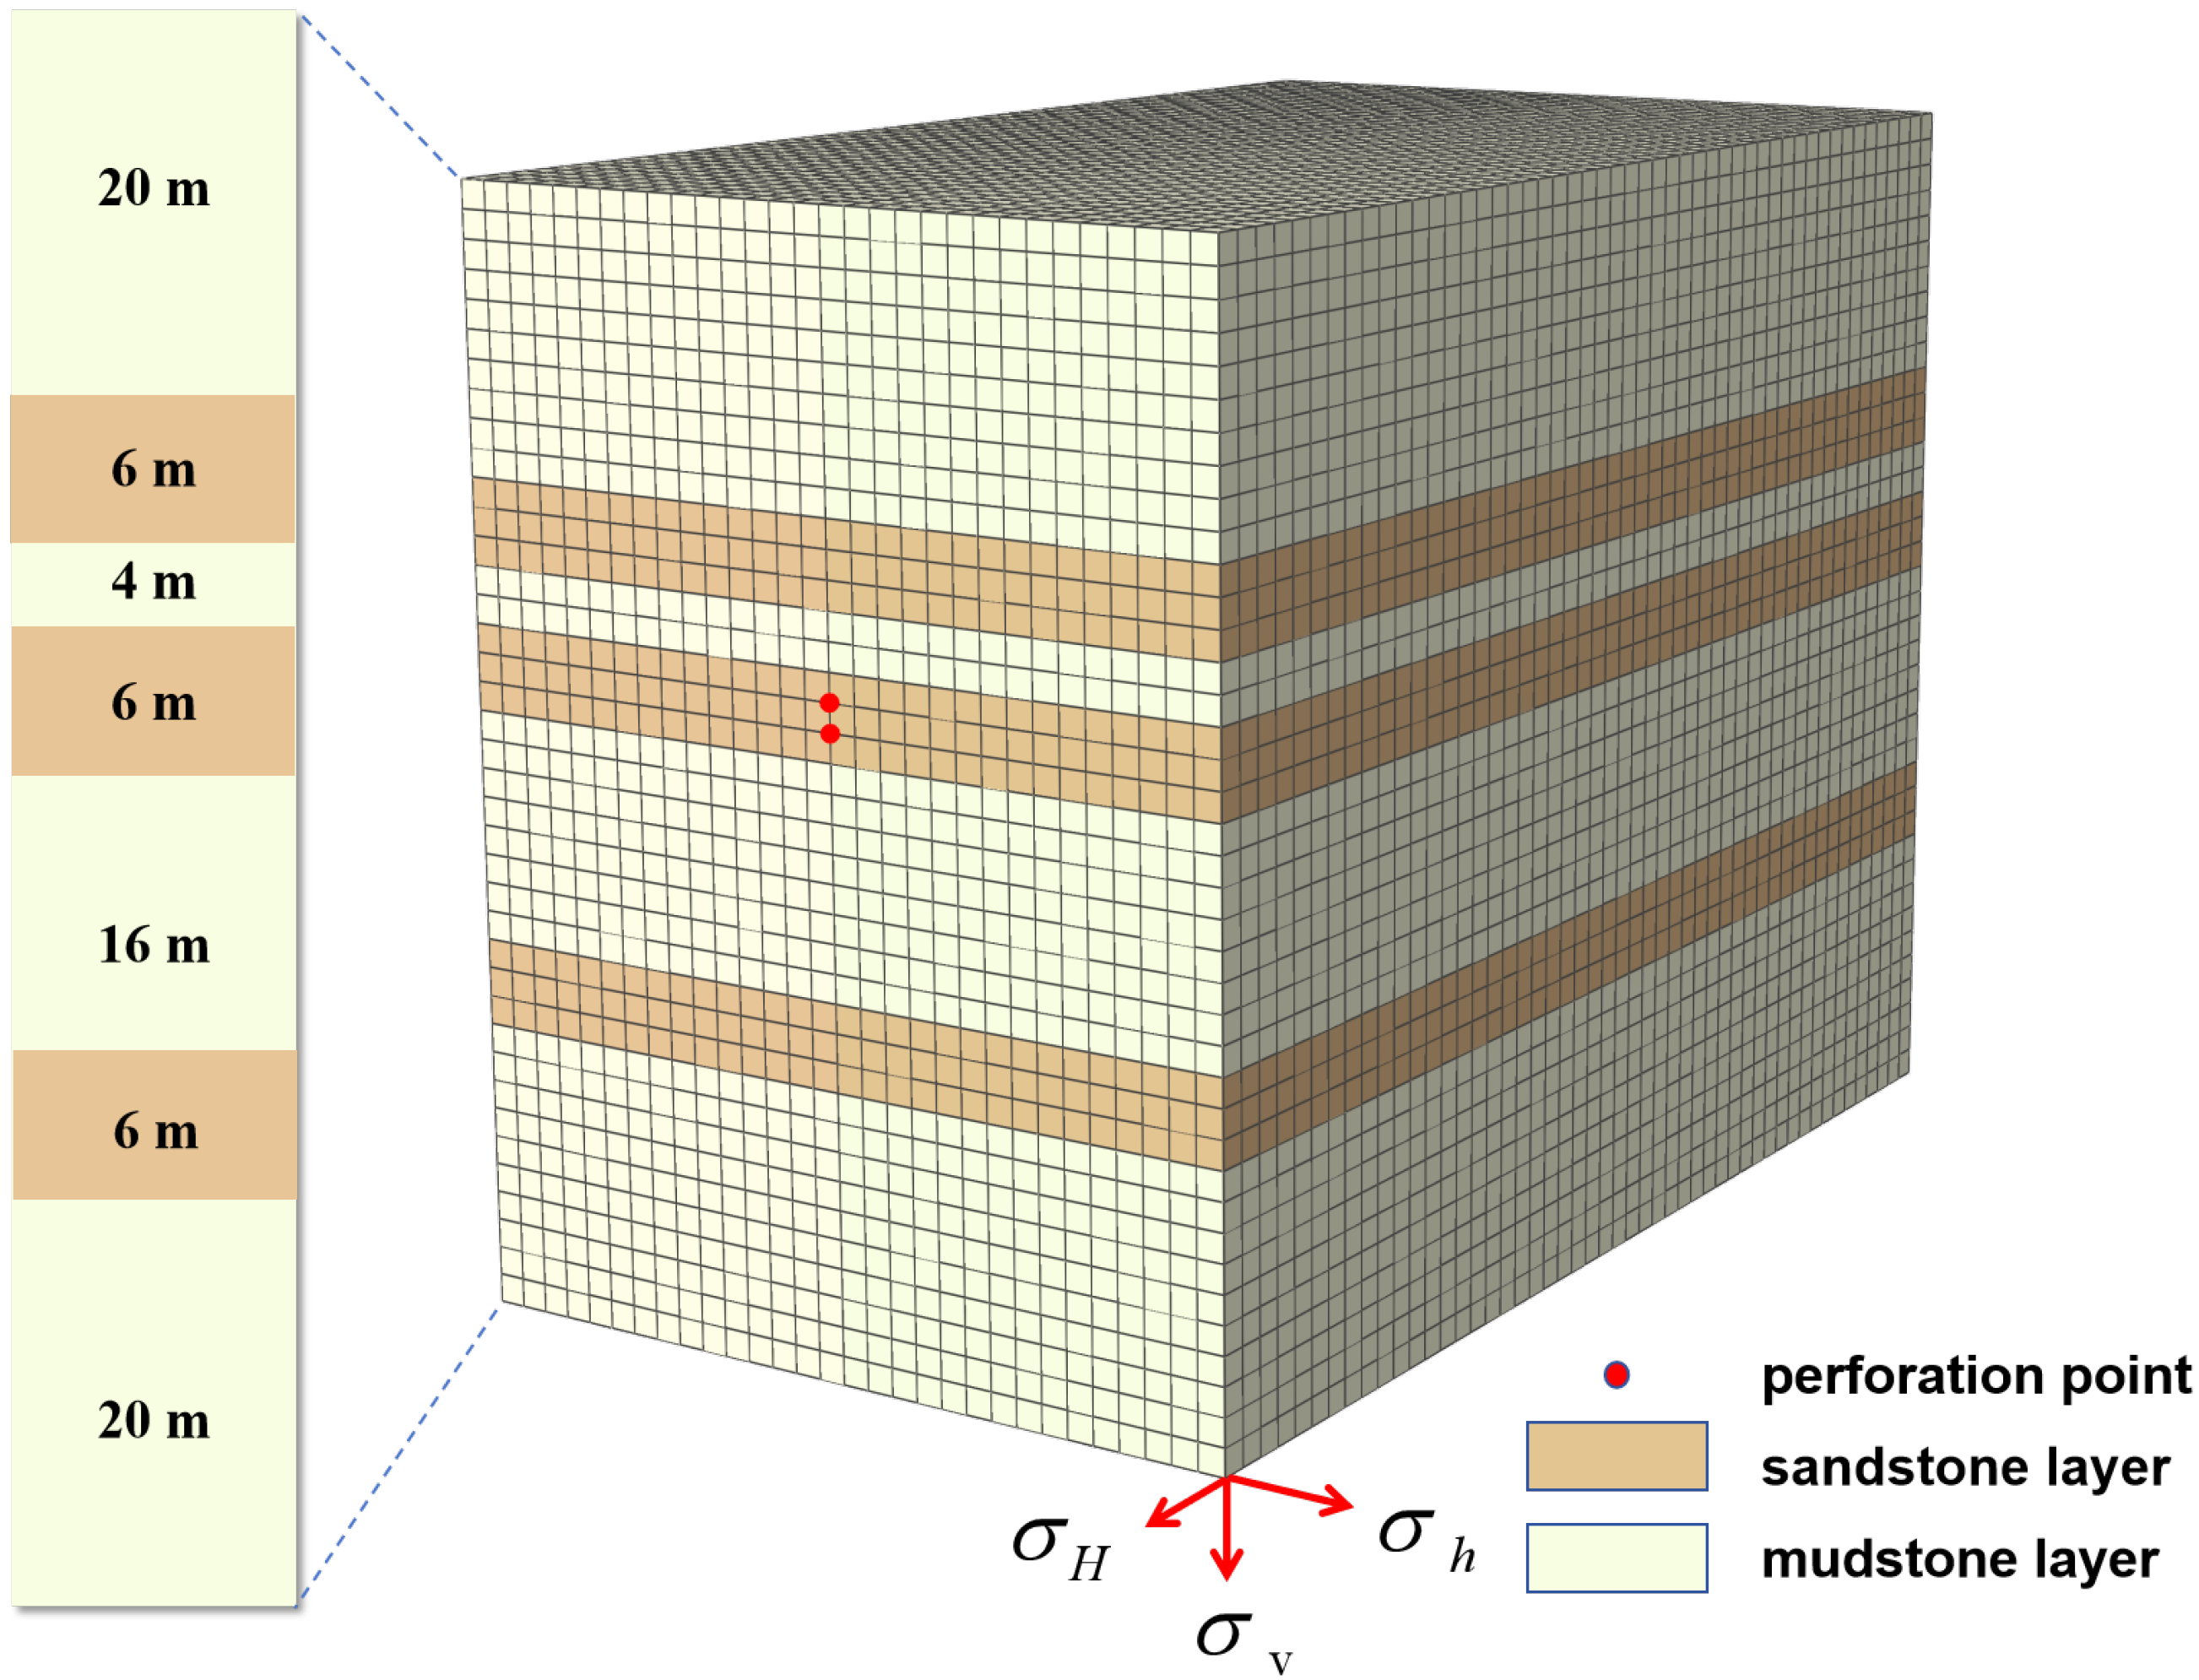
Given the deep burial, low permeability, and rapid production decline of the Bohai central oilfield, a numerical model of fracture propagation in thin interbedded sand–mud layers was developed using the finite element method to enhance the fracturing design for offshore low-permeability reservoirs. This model is depicted in Figure 5. σ h , σ H , σ V represents the directions of minimum horizontal principal stress, maximum horizontal principal stress, and vertical stress.
The three-dimensional finite element hydraulic fracture propagation model is simplified into a three-dimensional solid. The interbedded layers, from top to bottom, have thicknesses of 20 m, 6 m, 4 m, 6 m, 16 m, 6 m, and 20 m, respectively. The mechanical properties of the reservoir and barrier layers remain uniform throughout the model. The cohesive element method was used to simulate the hydraulic fracture propagation path.
The model dimensions are 60 m in the minimum horizontal principal stress direction, 100 m in the maximum horizontal principal stress direction, and 78 m in the vertical stress direction, with a mesh step size of 2 m. The mesh type is C3D8P, while COH3D8P is used for the cohesive elements (COH: cohesive elements; 3D: three-dimensional model; 8: eight nodes; P: pore pressure). The geometric model and lithology profile, tailored to the target block’s physical characteristics, are shown in Figure 5.
Based on the numerical model established above, this study investigates the impact of various geological factors, such as the stress differential between the reservoir and barrier layers, the thickness of these layers, and the rock properties, as well as engineering factors like fracturing fluid viscosity and pumping rate, on the cross-layer propagation of fractures. The parameters analyzed in this study and their respective ranges of variation are listed in Table 3.

4. Result and Discussion

4.1. Interlayer Stress Contrast

Interlayer stress contrast denotes the difference in minimum horizontal stress between sandstone and mudstone layers, defined as the minimum horizontal stress in the mudstone layer minus that in the sandstone layer. By systematically varying the minimum horizontal stress in the mudstone barrier layer, this study evaluates how different stress contrasts between the reservoir and barrier layers impact vertical fracture propagation. The findings are illustrated in Figure 6 (In the figure, PFOPEN represents the opening width of the fracture).
As depicted in Figure 6, a minimum horizontal stress differential of 0 MPa results in symmetrical vertical fracture extension, with equal upward and downward propagation heights. However, as the stress differential increases, the total height of the fracture progressively diminishes.
The study reveals that a higher stress differential between the reservoir and barrier layers intensifies the barrier layer’s resistance to vertical fracture propagation, making it increasingly challenging for the fracture to traverse vertically across layers. When the volume of fracturing fluid remains constant, the fracture tends to extend more along its length, leading to an increased fracture length.
In the target block, a stress differential of 2 MPa allows the barrier layer to partially restrict vertical fracture propagation, although the fracture can still penetrate the sandstone layer, achieving a cross-layer thickness of 6 m. At a stress differential of 8 MPa, the barrier layer provides maximum resistance to vertical fracture propagation, effectively confining the fracture entirely within the reservoir layer.

4.2. Interlayer Elastic Modulus Contrast

The elastic modulus contrast between reservoir and barrier layers is defined as the difference in elastic modulus between the sandstone and mudstone layers, specifically calculated as the modulus of the mudstone layer minus that of the sandstone layer. By systematically varying the elastic modulus of the mudstone barrier layer, this study evaluates the impact of these variations on vertical fracture propagation.
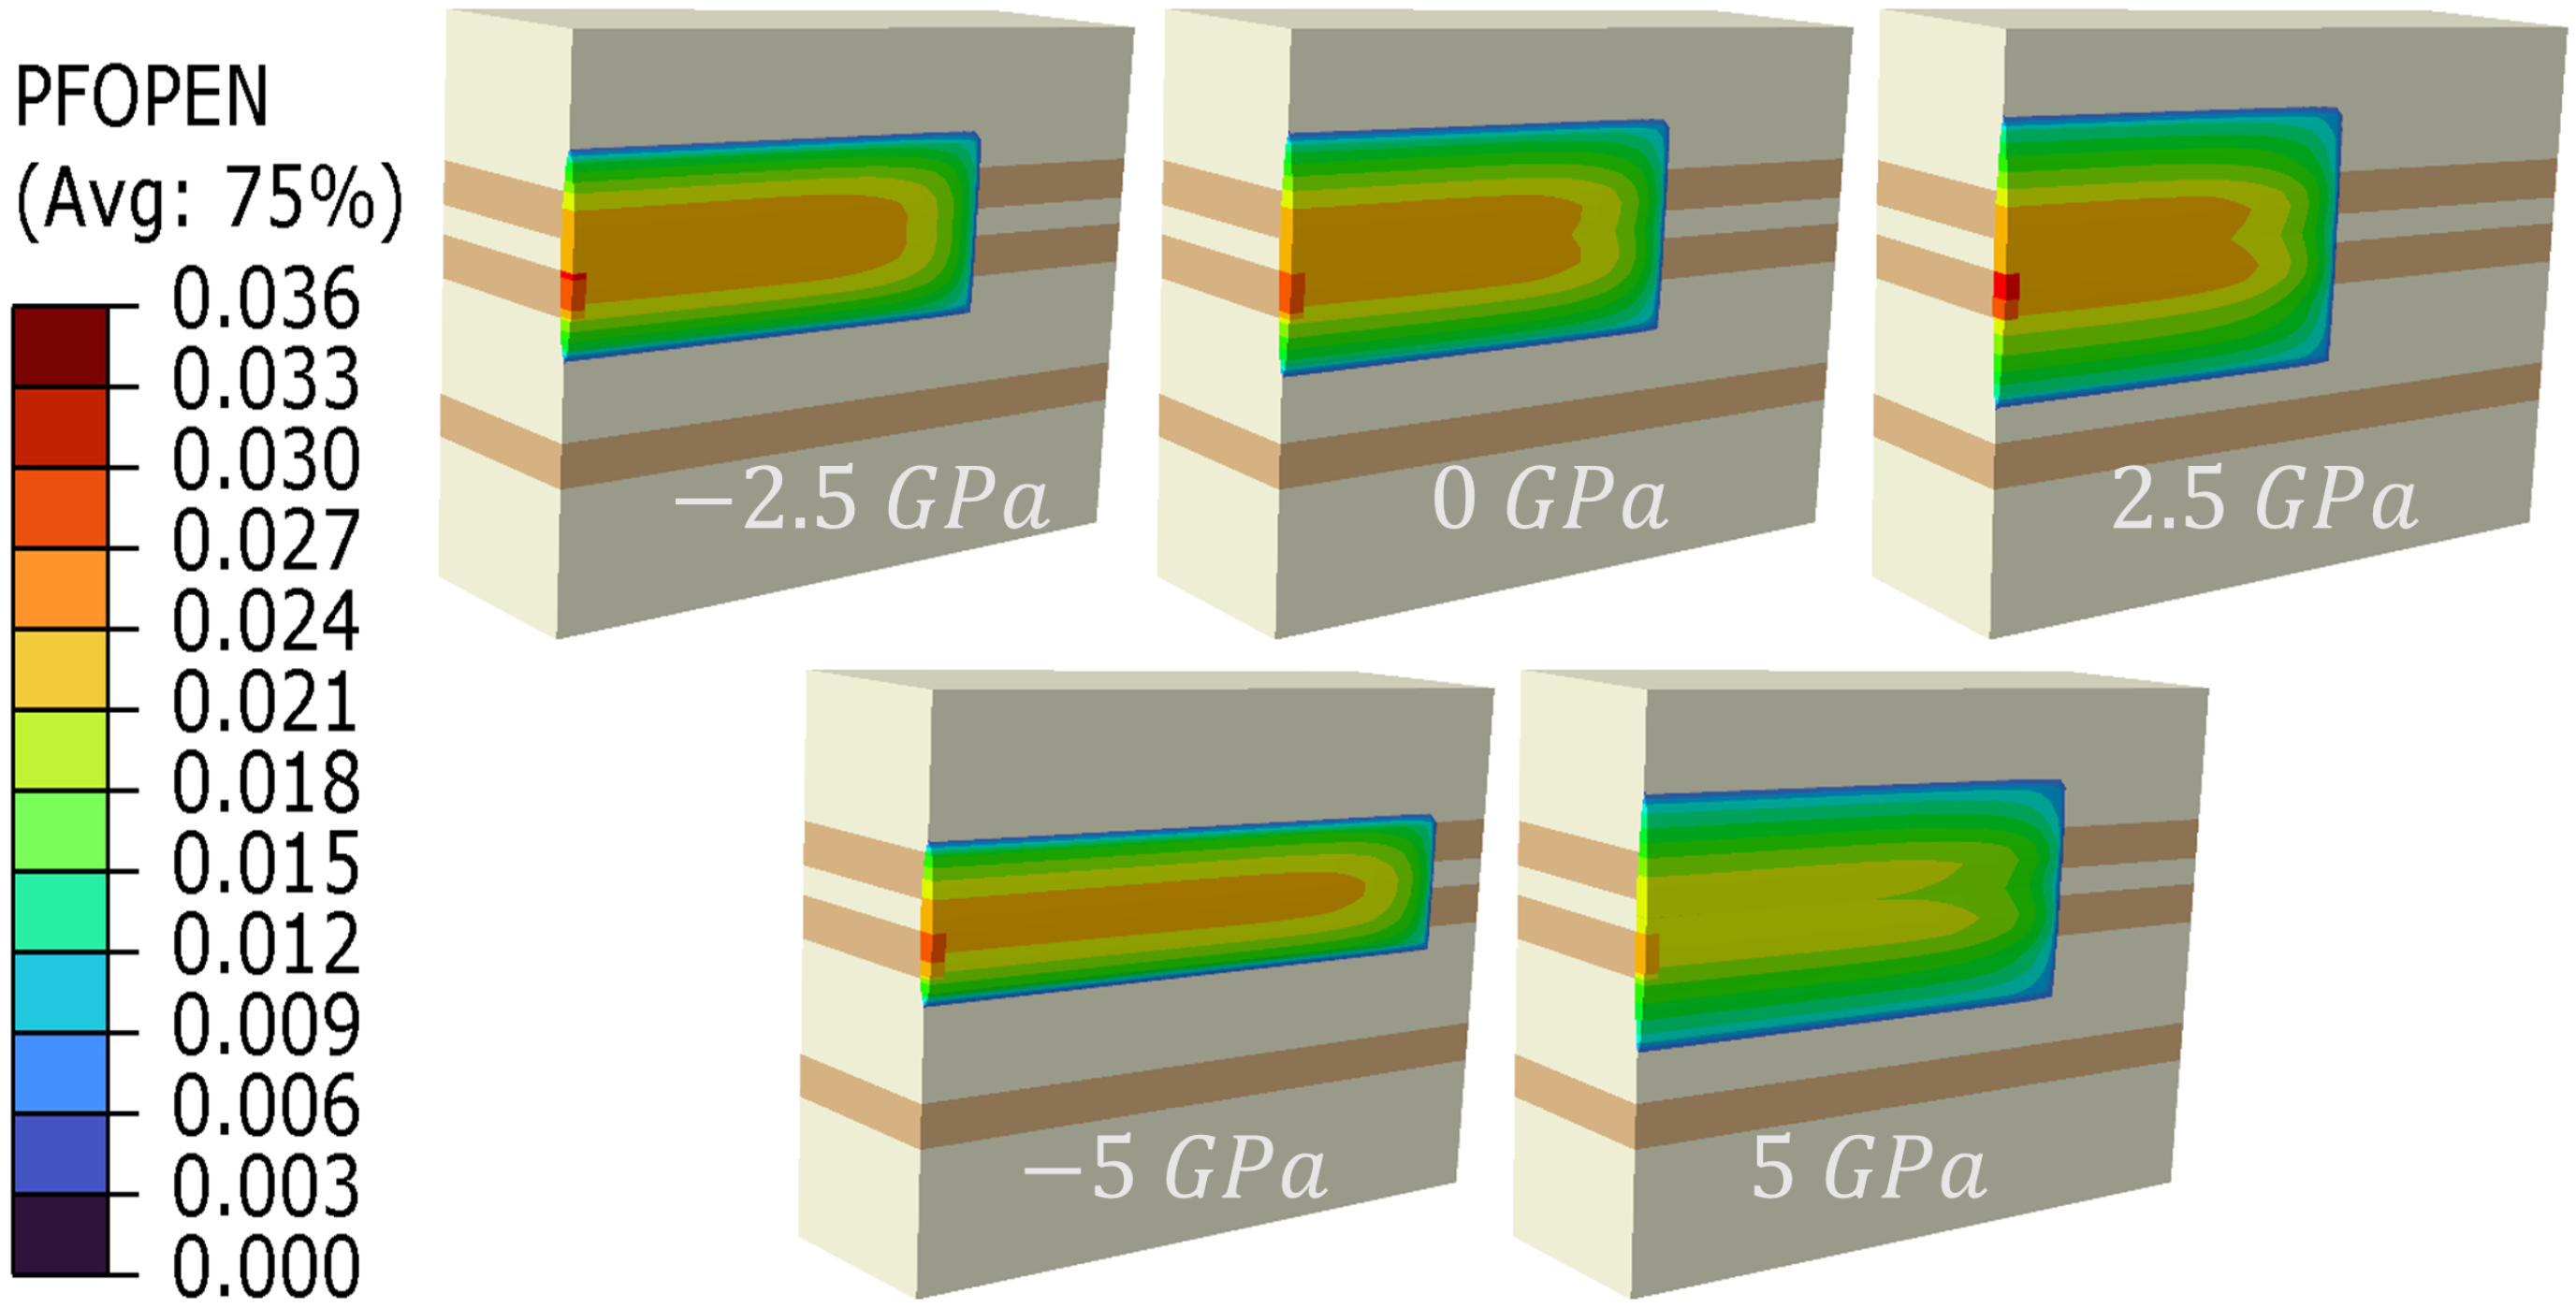
As depicted in Figure 7, under a stress differential of 0 MPa:
  • Elastic Modulus Contrast = 0 GPa: The fracture propagates uniformly, extending equally in both upward and downward directions.
  • Elastic Modulus Contrast = 2.5 GPa: The fracture penetrates the upper reservoir layer completely but does not extend into the lower reservoir.
  • Elastic Modulus Contrast = 5 GPa: The fracture reaches both the upper and lower reservoir layers but does not fully penetrate either layer; propagation occurs predominantly along the fracture length.
  • Elastic Modulus Contrast = −2.5 GPa: The fracture penetrates the upper reservoir layer but does not reach the lower layer.
  • Elastic Modulus Contrast = −5 GPa: The fracture minimally penetrates the upper reservoir layer and does not continue upward, primarily extending along its length.
Figure 7. Fracture propagation patterns with varying elastic moduli under an interlayer stress contrast of 0 MPa.
Processes 12 02375 g007
The study shows that fractures tend to propagate in the direction of higher elastic modulus, meaning a higher elastic modulus promotes vertical fracture growth, while a lower modulus inhibits it. When the elastic modulus of the barrier layer is lower than that of the reservoir, the barrier restricts fracture penetration. However, when the elastic modulus difference between the layers is zero, the barrier facilitates fracture propagation.
With a 2.5 GPa difference in elastic modulus, fractures can penetrate the upper reservoir layer, whereas a 5 GPa difference prevents penetration. This suggests that an elastic modulus difference of −2.5 GPa (reservoir minus barrier) is insufficient to fully restrict vertical fracture propagation, allowing the fracture to break through the layers. In contrast, a difference of −5 GPa effectively confines the fracture within the barrier, limiting vertical propagation and favoring horizontal extension.
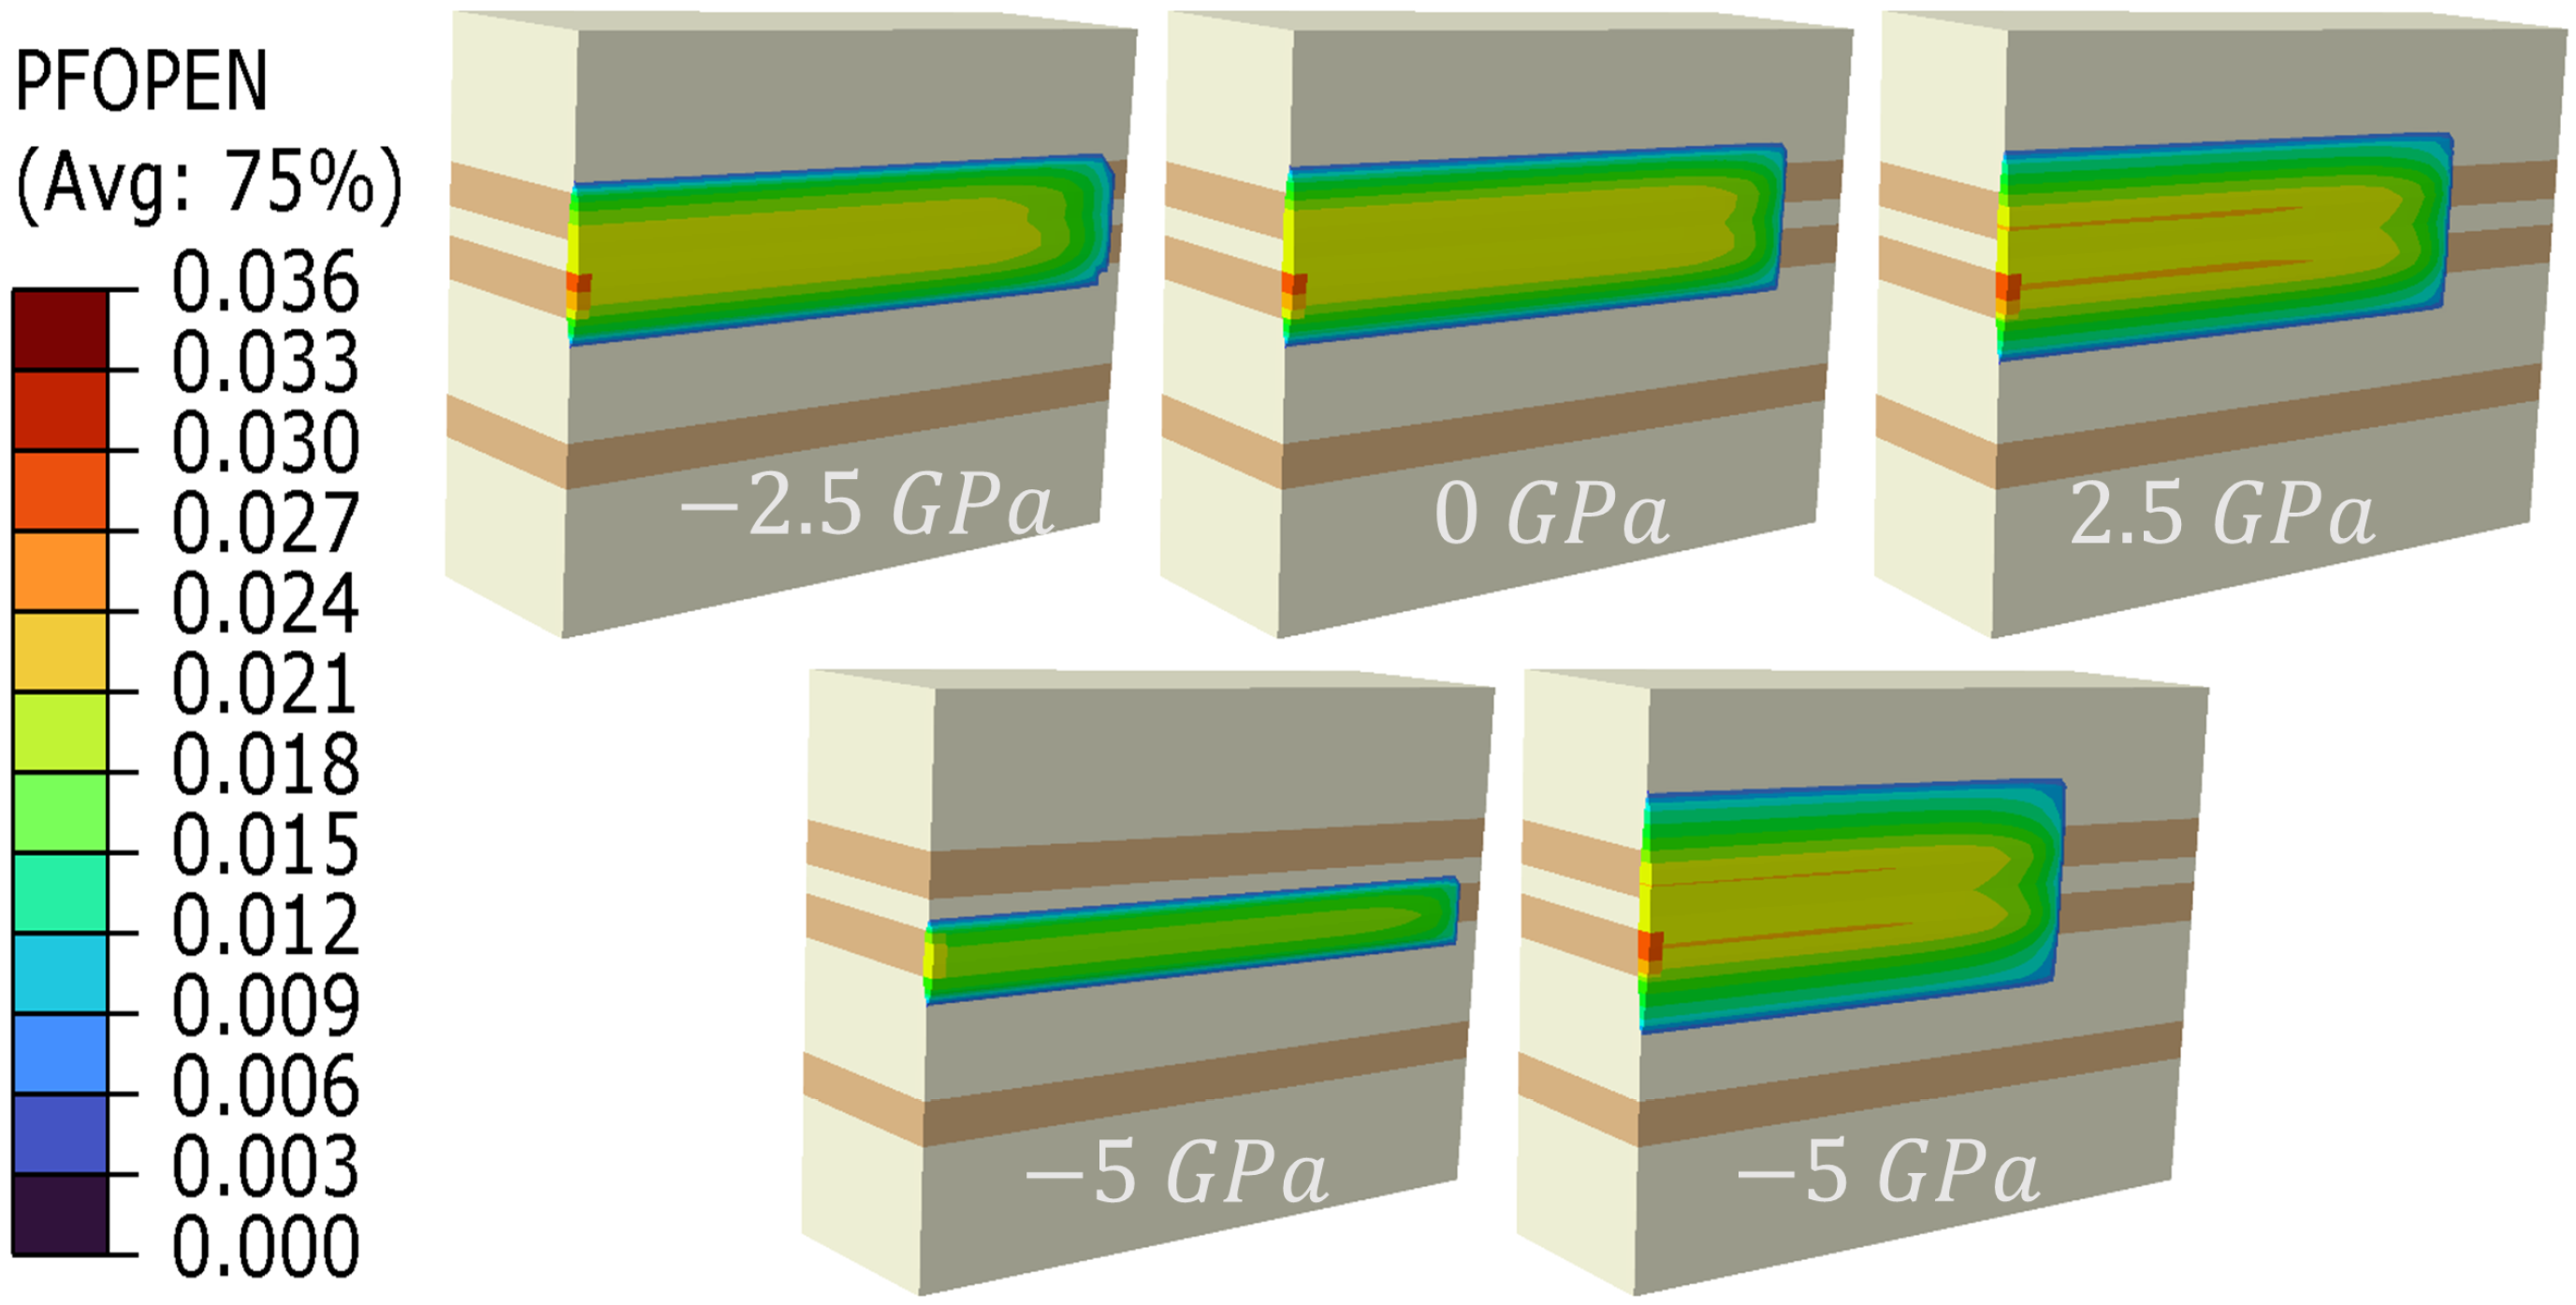
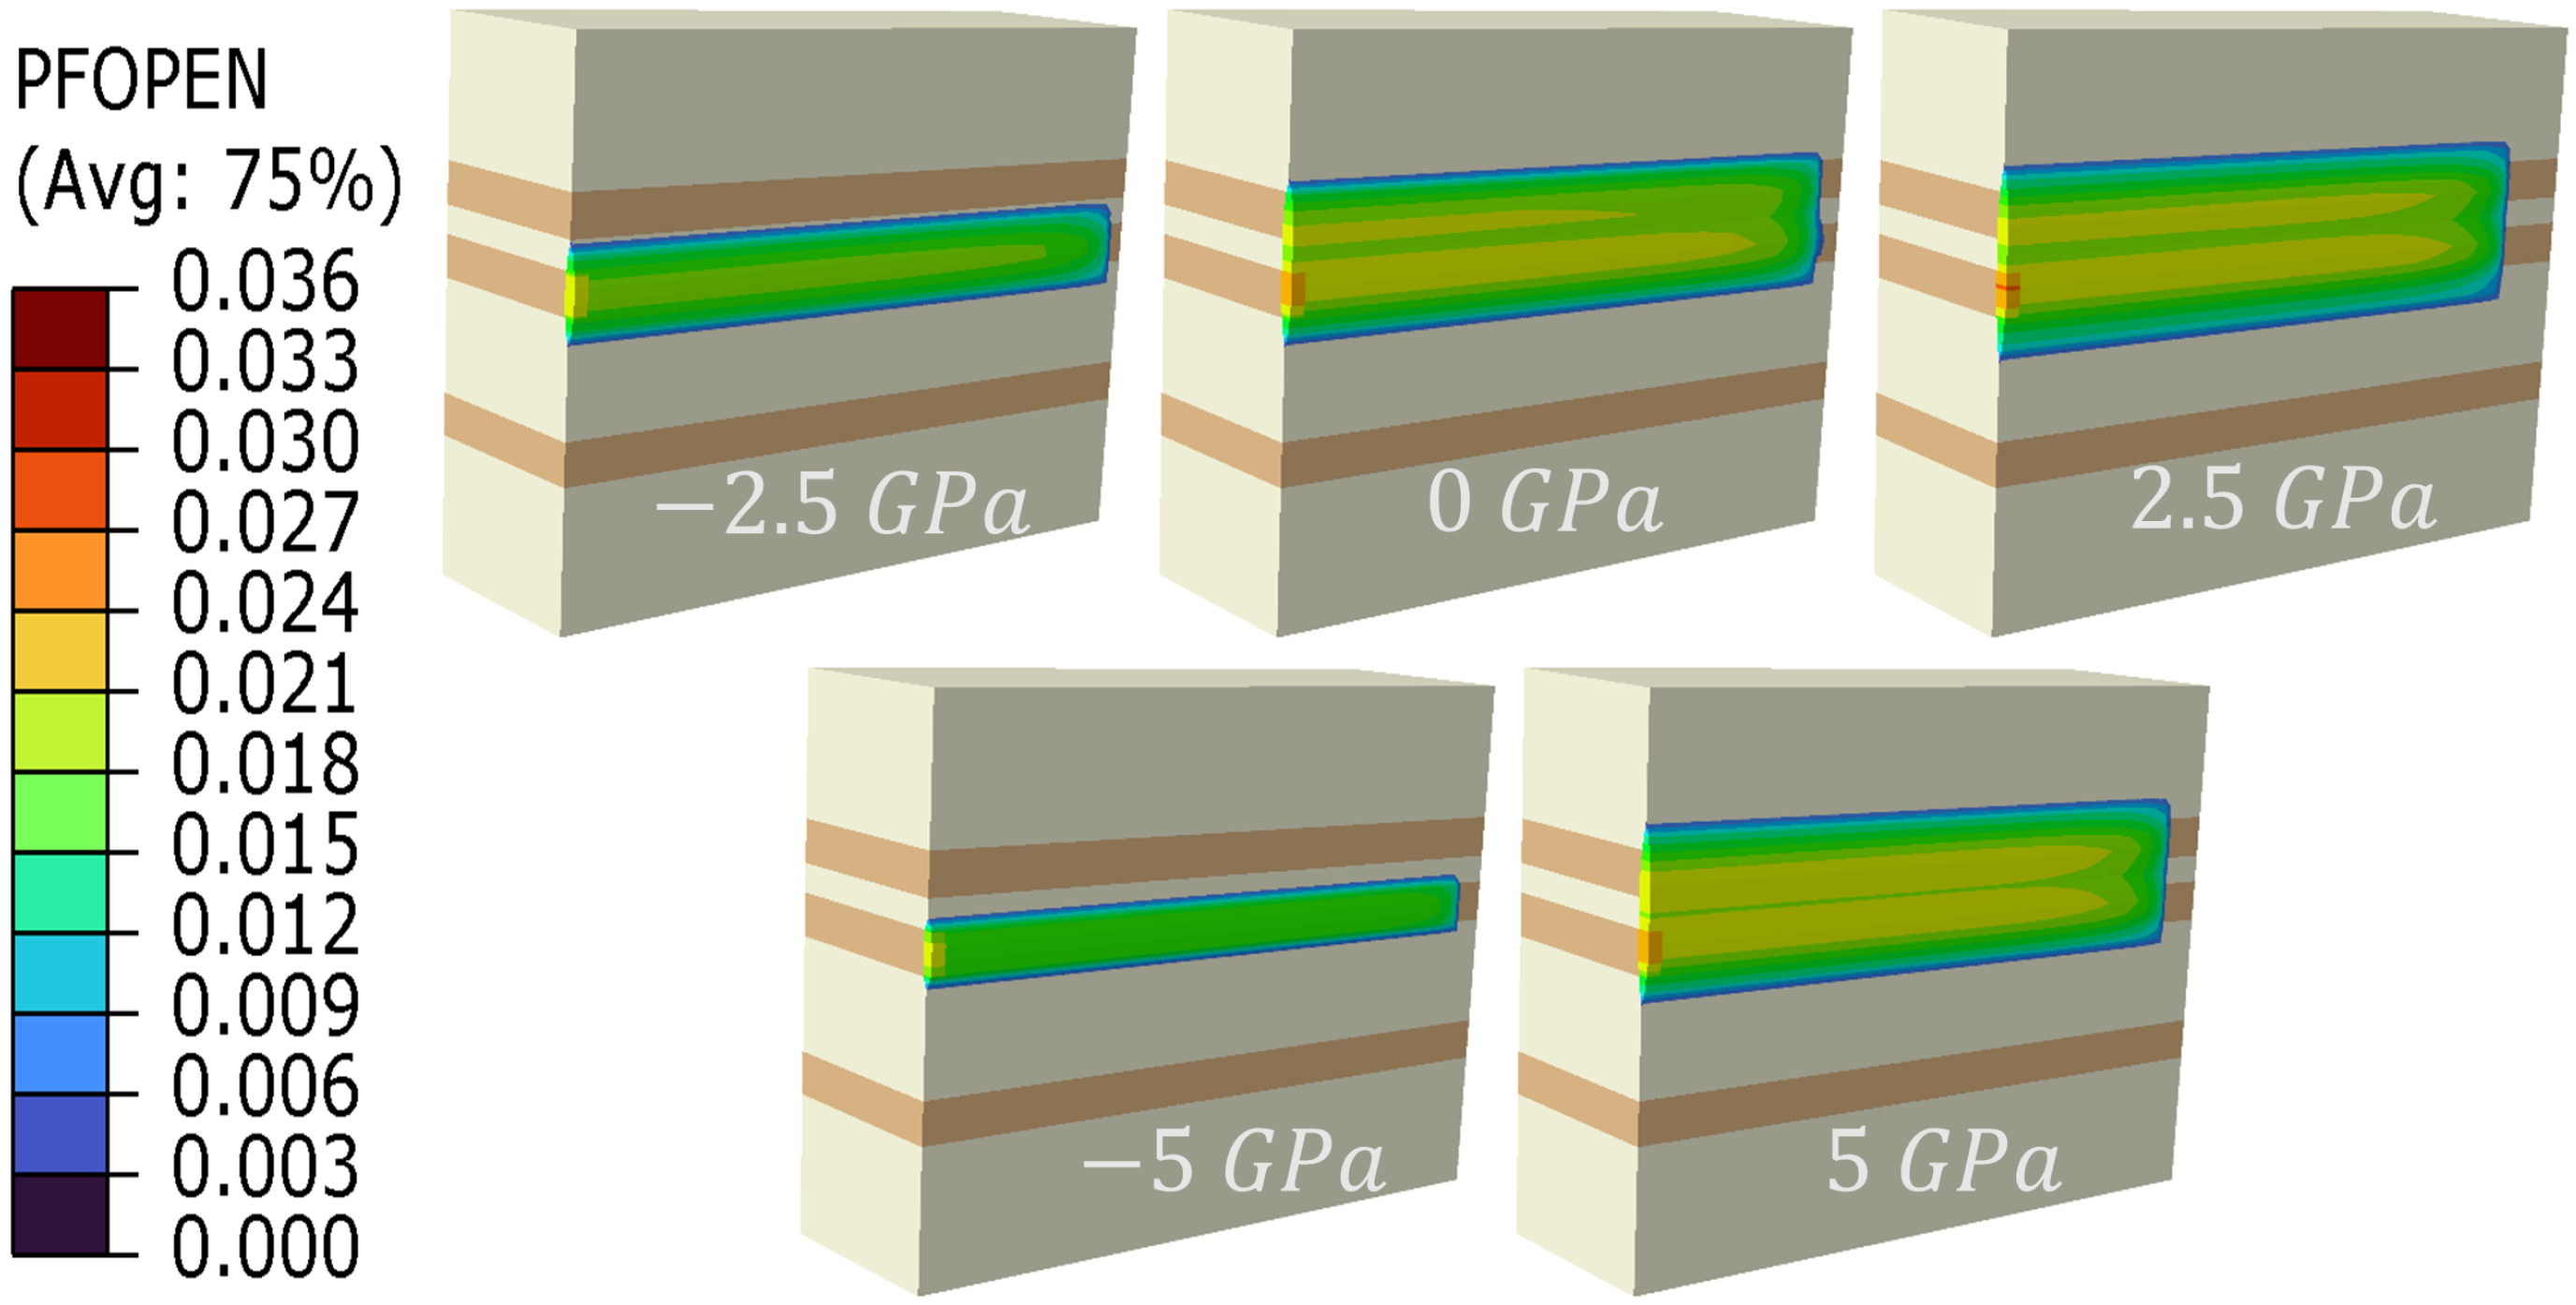
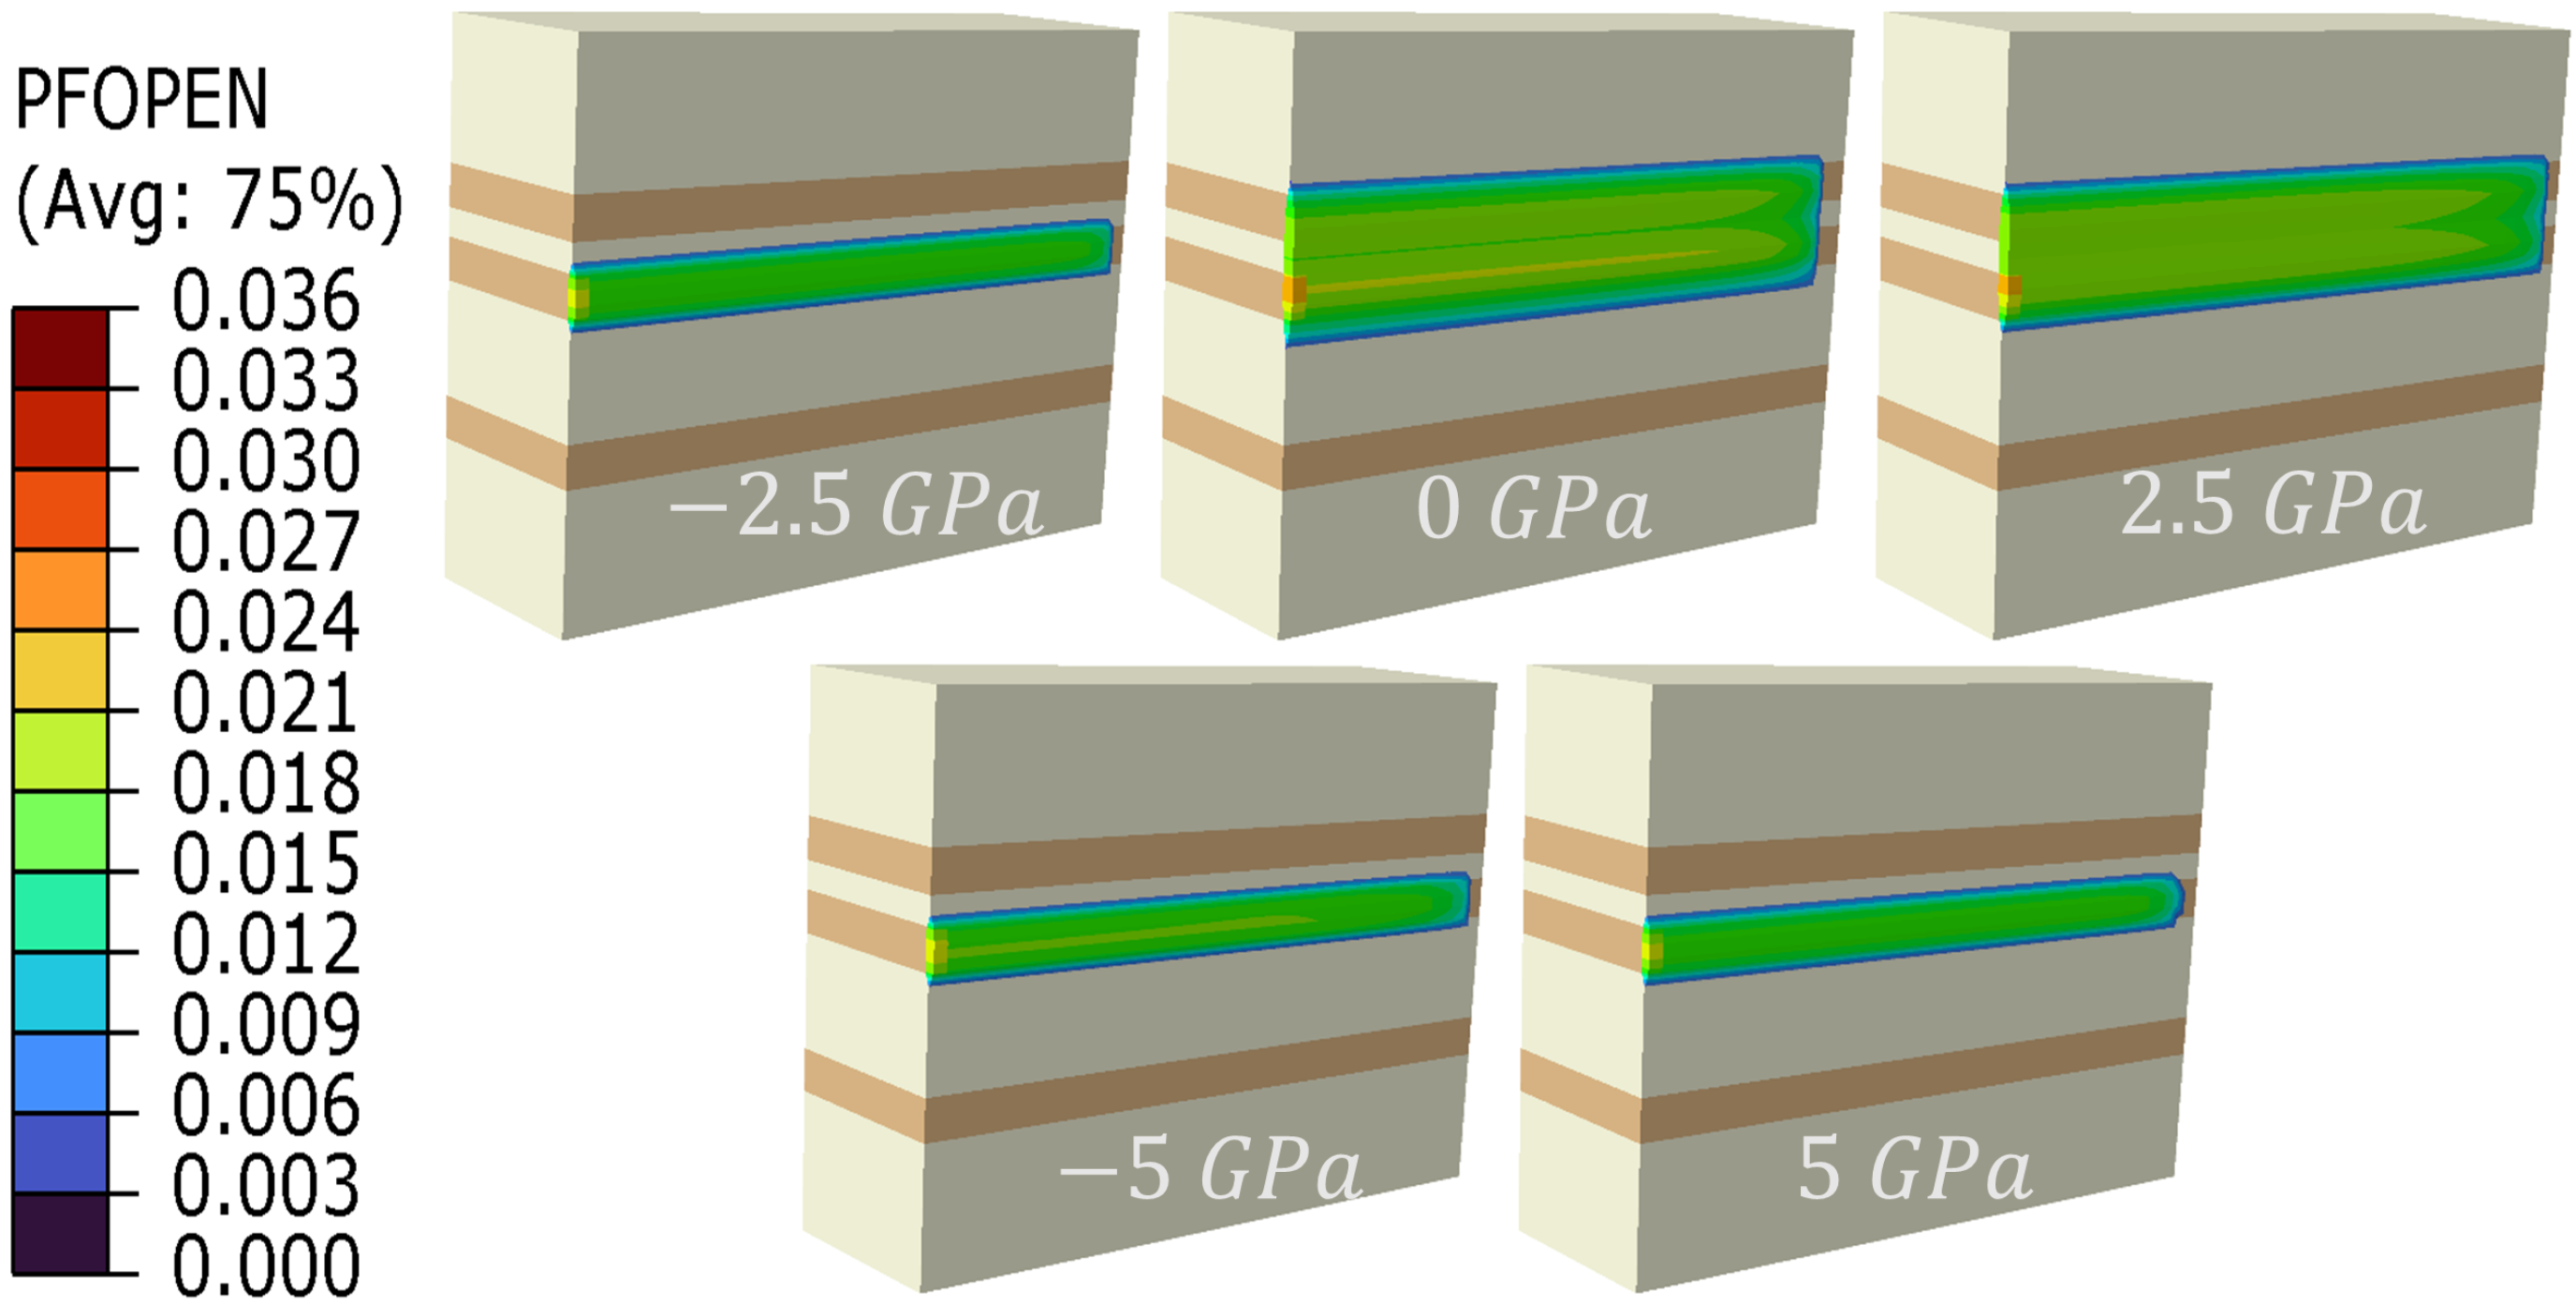
As the interlayer stress contrast increases (see Figure 8, Figure 9, Figure 10 and Figure 11), the fracture height gradually decreases. At an interlayer stress contrast of 6 MPa and an elastic modulus difference of −5 GPa, the fracture becomes fully confined within the reservoir, extending only horizontally. When the interlayer stress contrast reaches 8 MPa, a notable change in fracture morphology occurs, and fractures with interlayer elastic modulus contrast of −5 GPa, −2.5 GPa, and 0 GPa are unable to penetrate the reservoir layer.
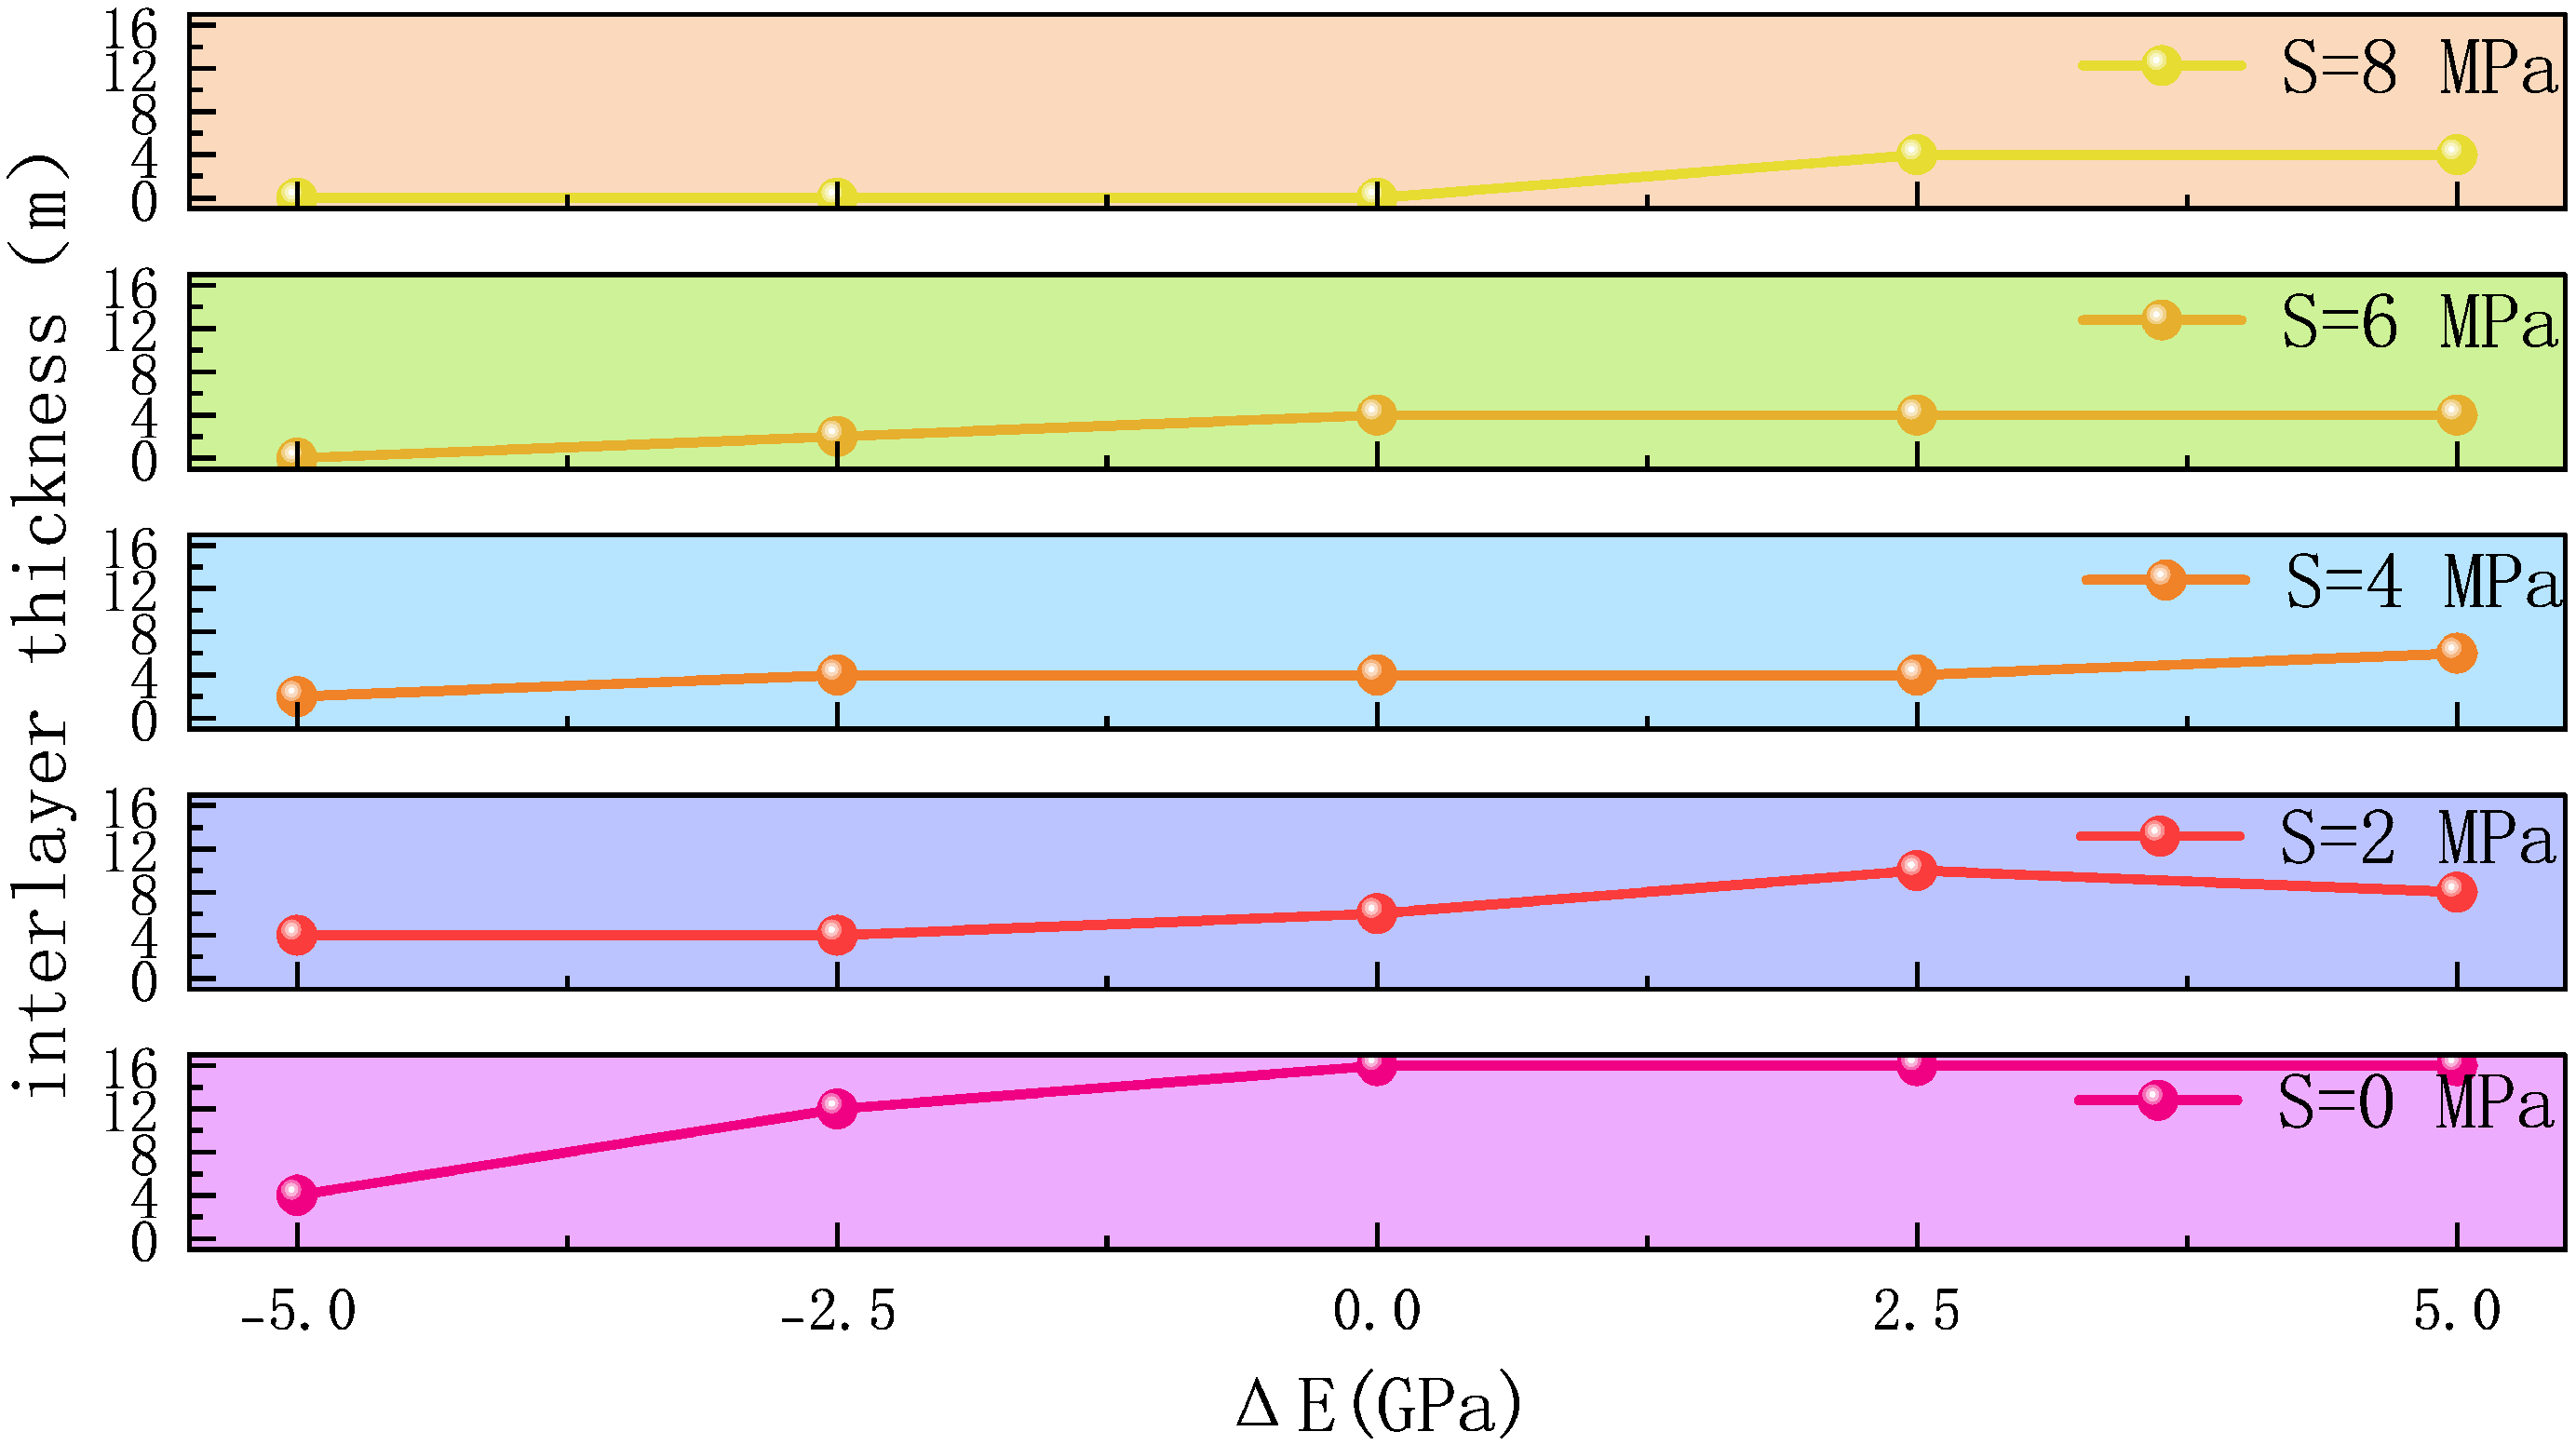
The fracture penetration thickness was analyzed by selecting the maximum heights of penetration in both the upper and lower layers, as shown in Figure 12. The results indicate that, when the stress differential is 0, fracture penetration thickness increases with the elastic modulus difference. However, when the elastic modulus difference is 0, further increasing the modulus of the barrier layer does not promote additional vertical fracture propagation.
As the stress differential between the reservoir and barrier layers increases, the overall fracture penetration thickness decreases. Conversely, as the elastic modulus difference between the reservoir and barrier layers increases, the penetration thickness also increases. When the stress differential is 2 MPa and the elastic modulus difference is 5 GPa, the fracture penetration thickness begins to decrease. At a stress differential of 8 MPa and an elastic modulus difference below 0 GPa, the fracture penetration thickness reduces to zero.
The results indicate that fracture penetration height is influenced by both the interlayer stress contrast and the elastic modulus contrast between the reservoir and barrier layers. High interlayer stress contrasts restrict fracture propagation, while low stress contrasts also suppress vertical extension. A high elastic modulus contrast promotes fracture growth, whereas a low elastic modulus contrast inhibits it. Specifically, a higher minimum horizontal principal stress in the barrier layer limits vertical fracture extension, while a higher elastic modulus contrast enhances it. At an interlayer stress contrast of 0 MPa, the fracture penetration height reaches its maximum. Reducing the stress contrast causes a sharp decrease in fracture penetration height, while increasing the elastic modulus contrast results in a more gradual change. Thus, the interlayer stress contrast is the primary factor controlling fracture propagation.
When the interlayer stress contrast is 2 MPa and the elastic modulus contrast is 5 GPa, the barrier layer exhibits both promoting and inhibiting effects on fracture propagation within the reservoir. The penetration height shows a decreasing trend, indicating that the promoting effect of the elastic modulus contrast is outweighed by the inhibiting effect of the interlayer stress contrast.

4.3. Pumping Rate Variation

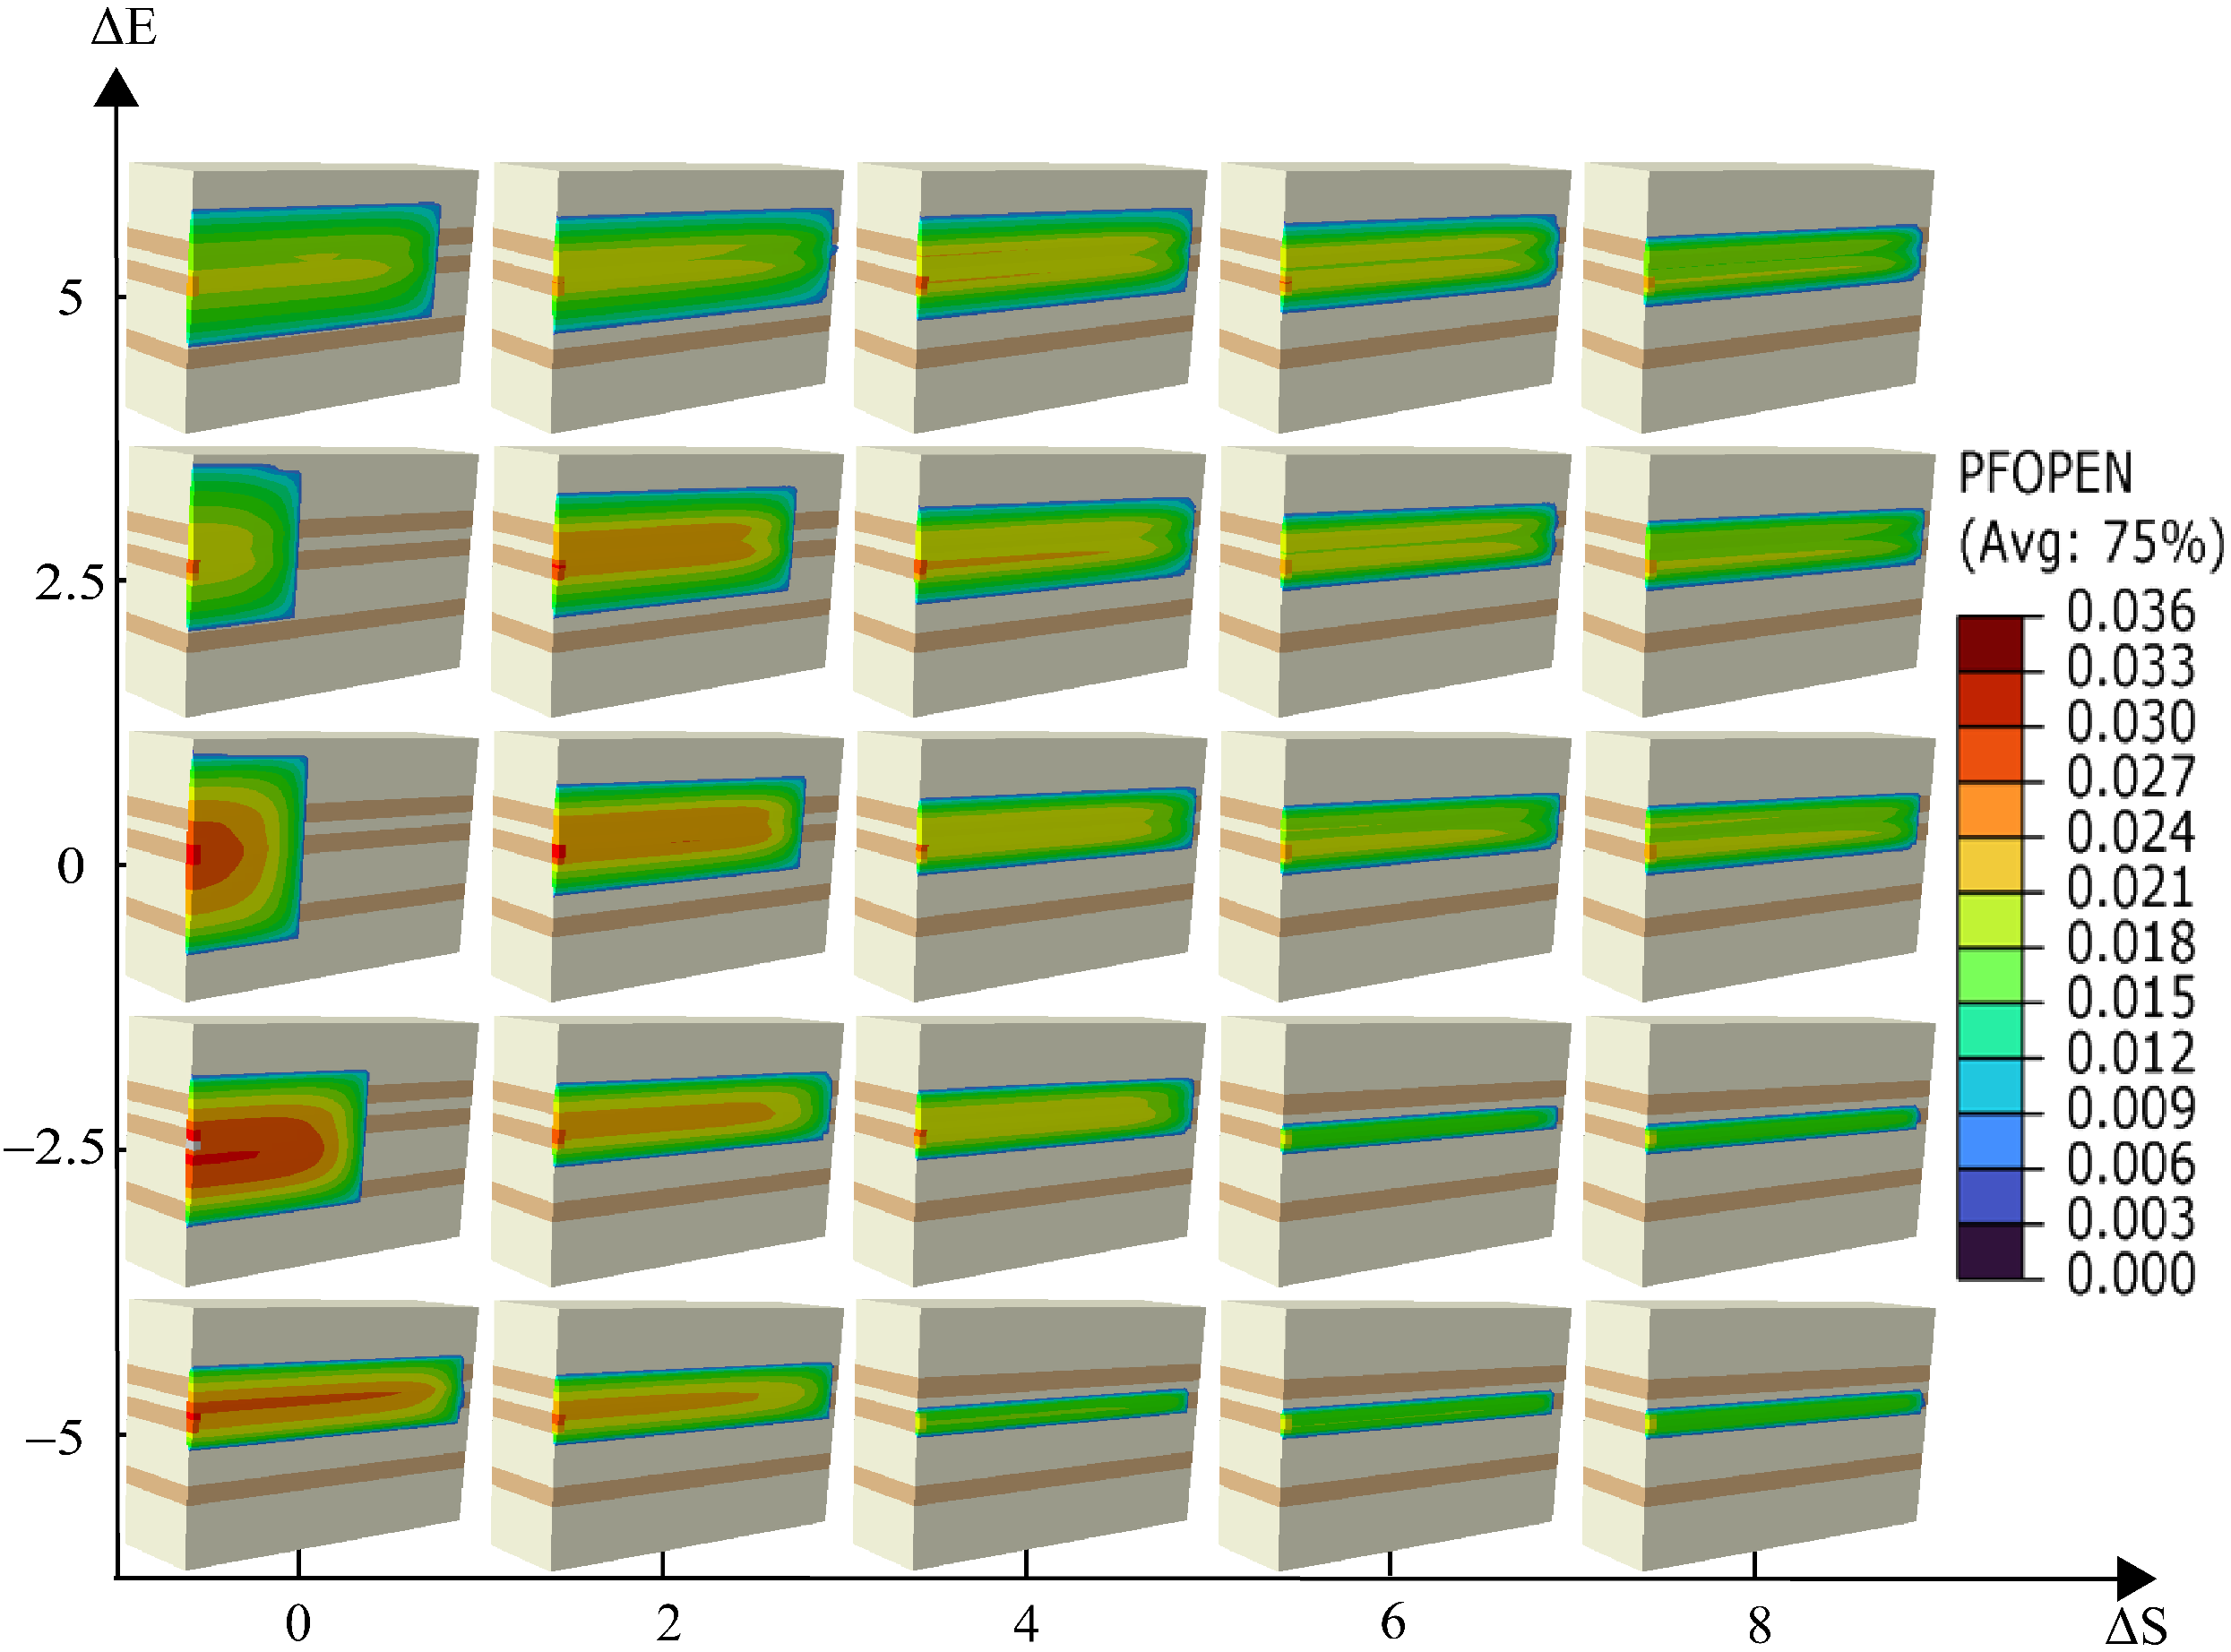
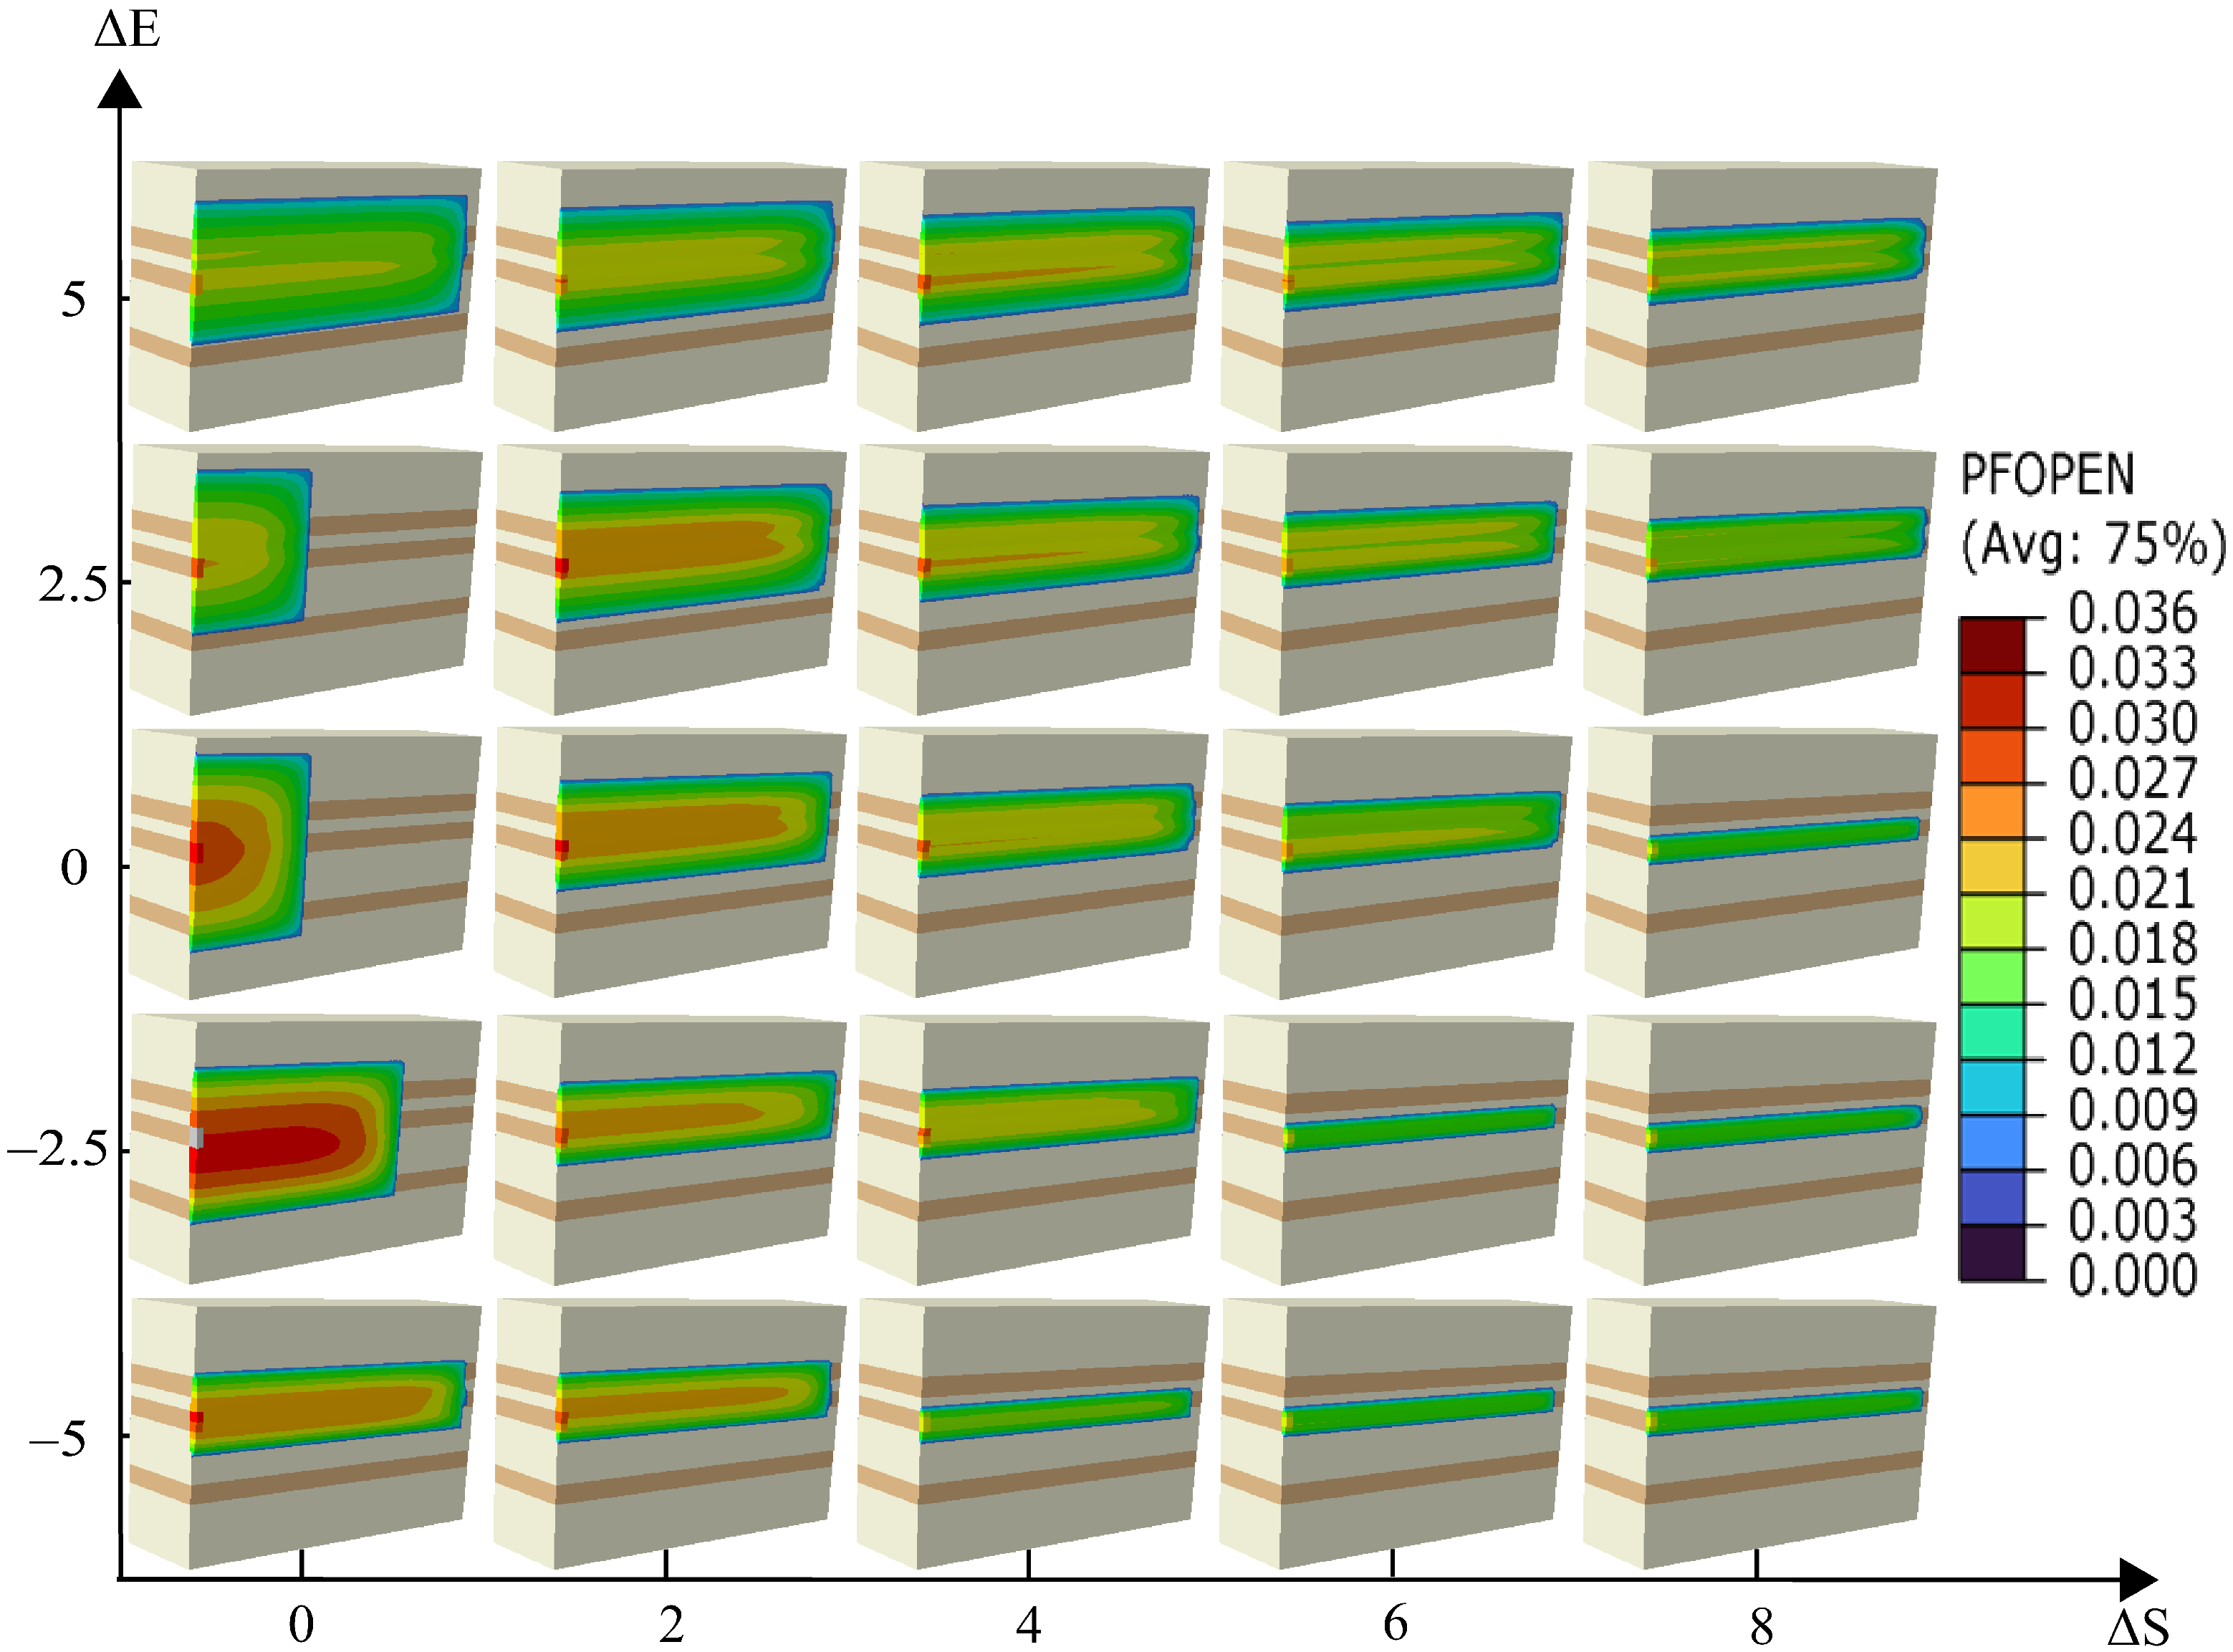
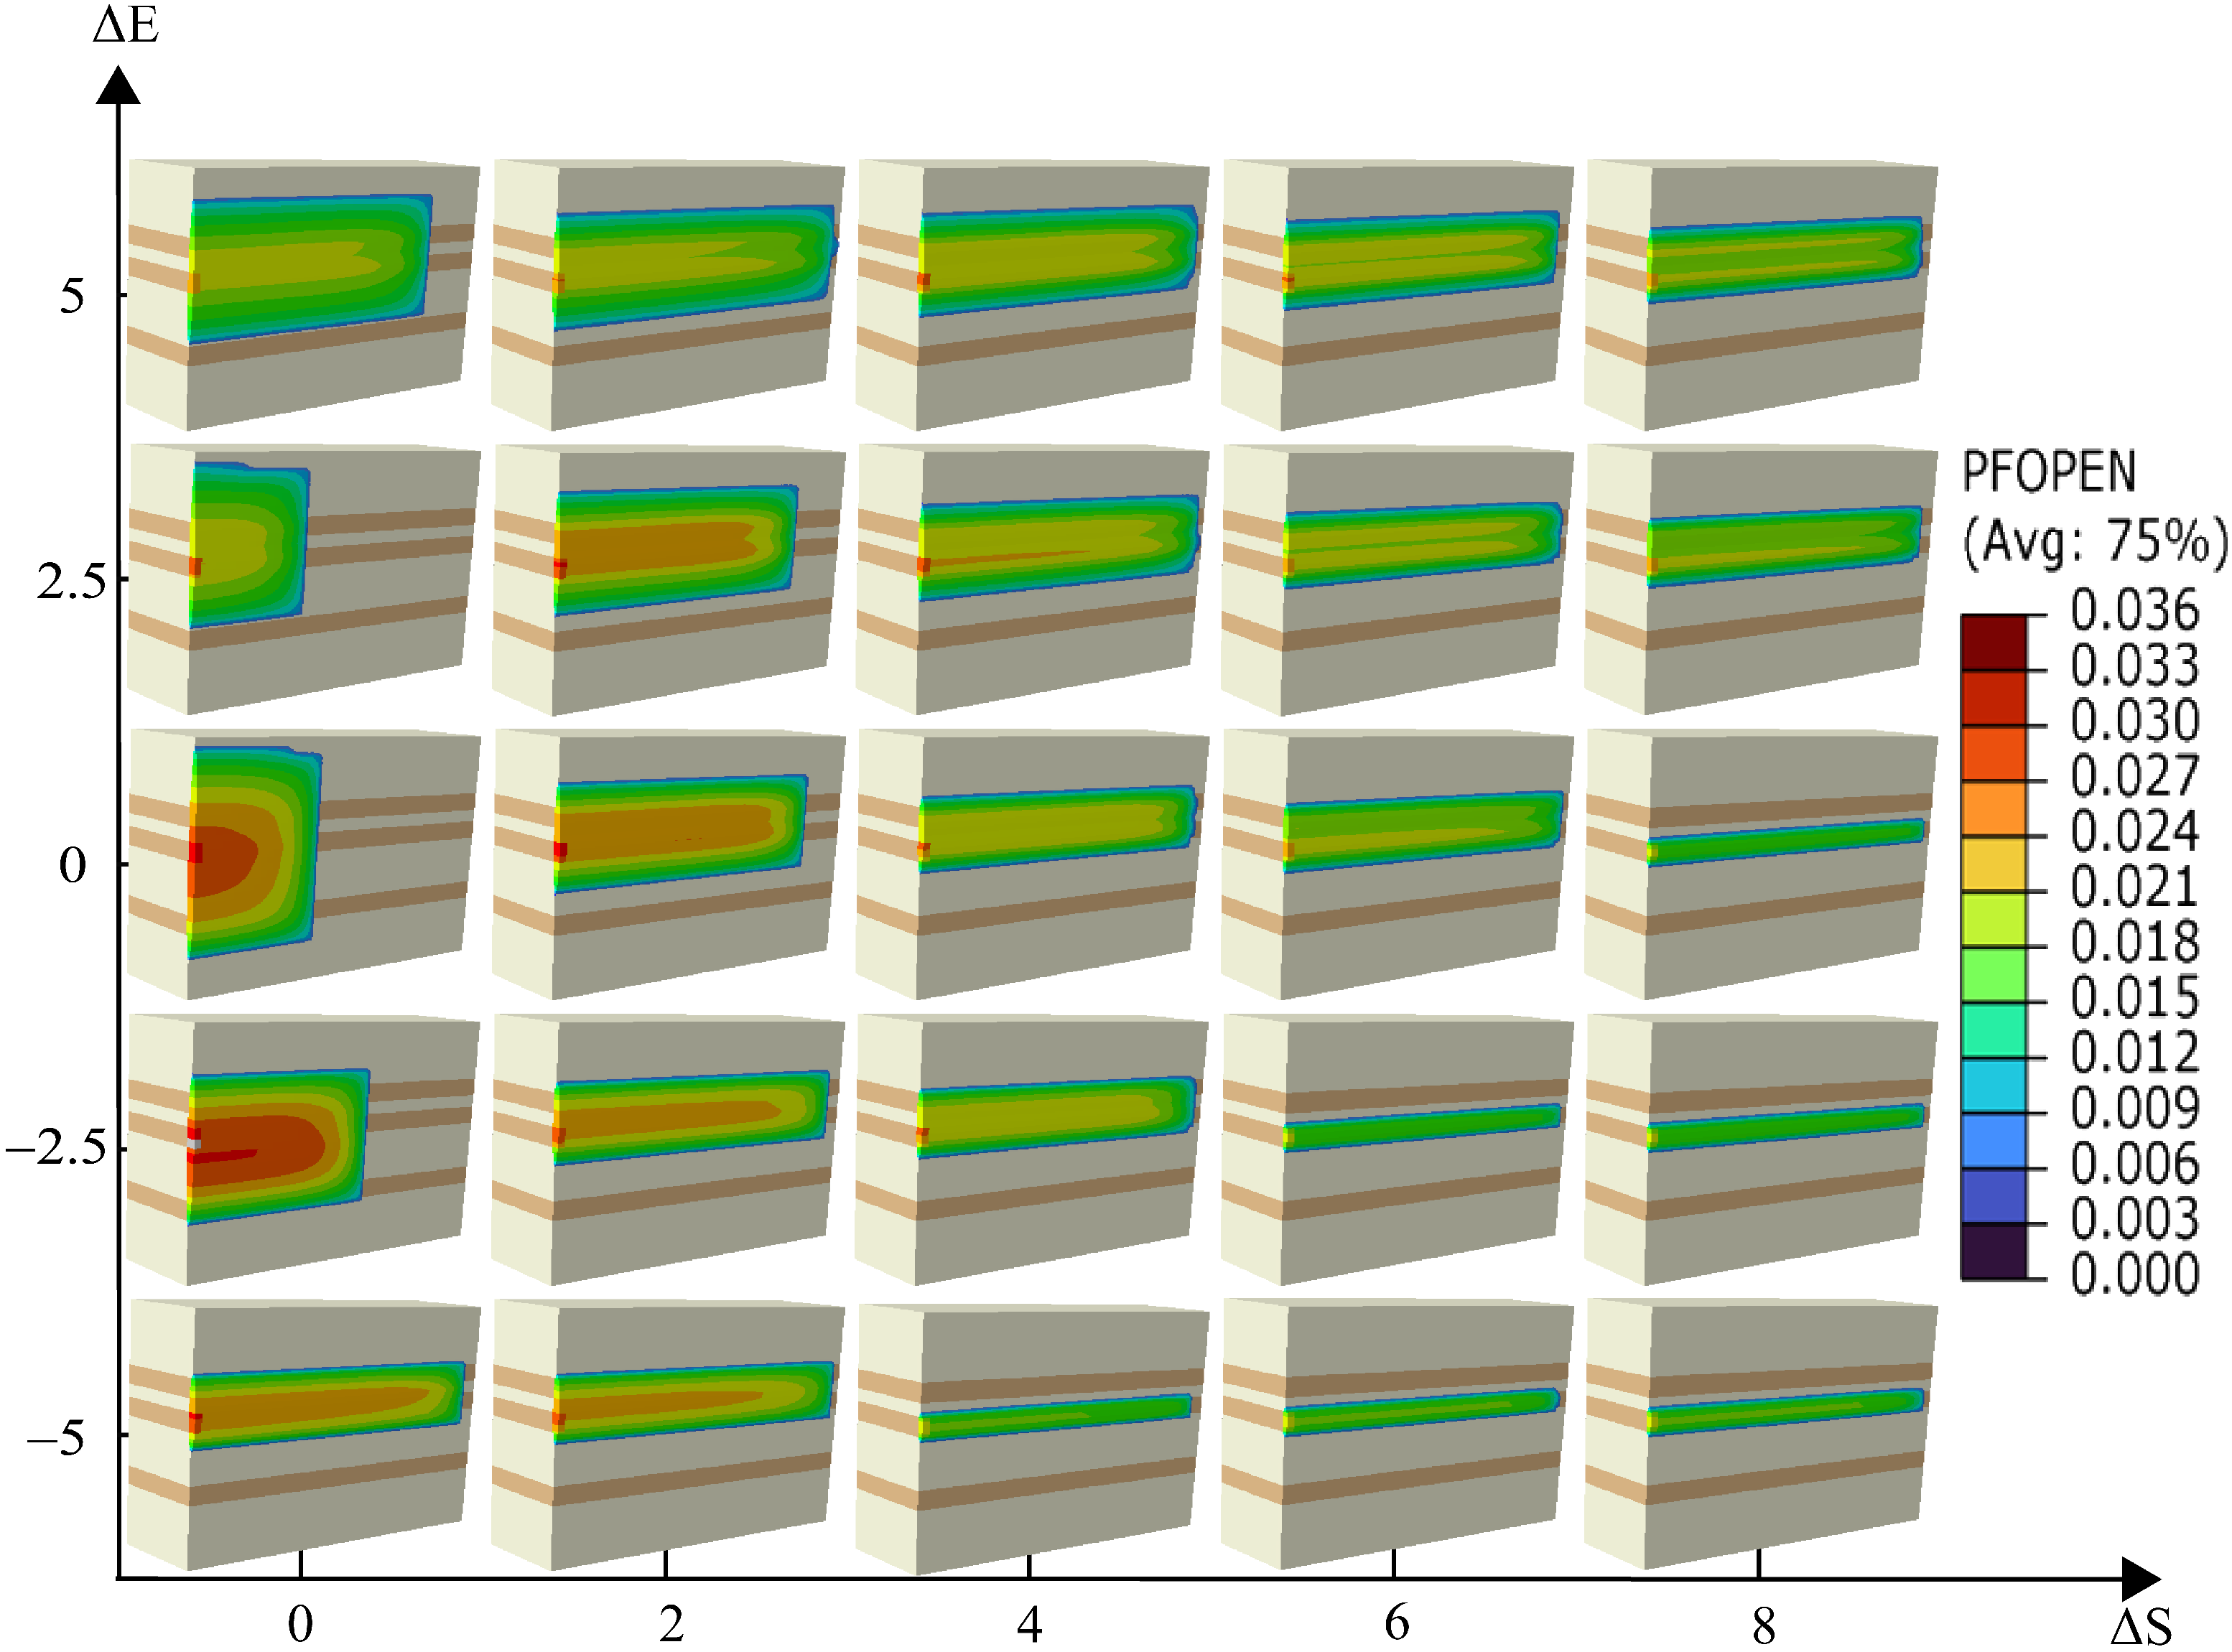
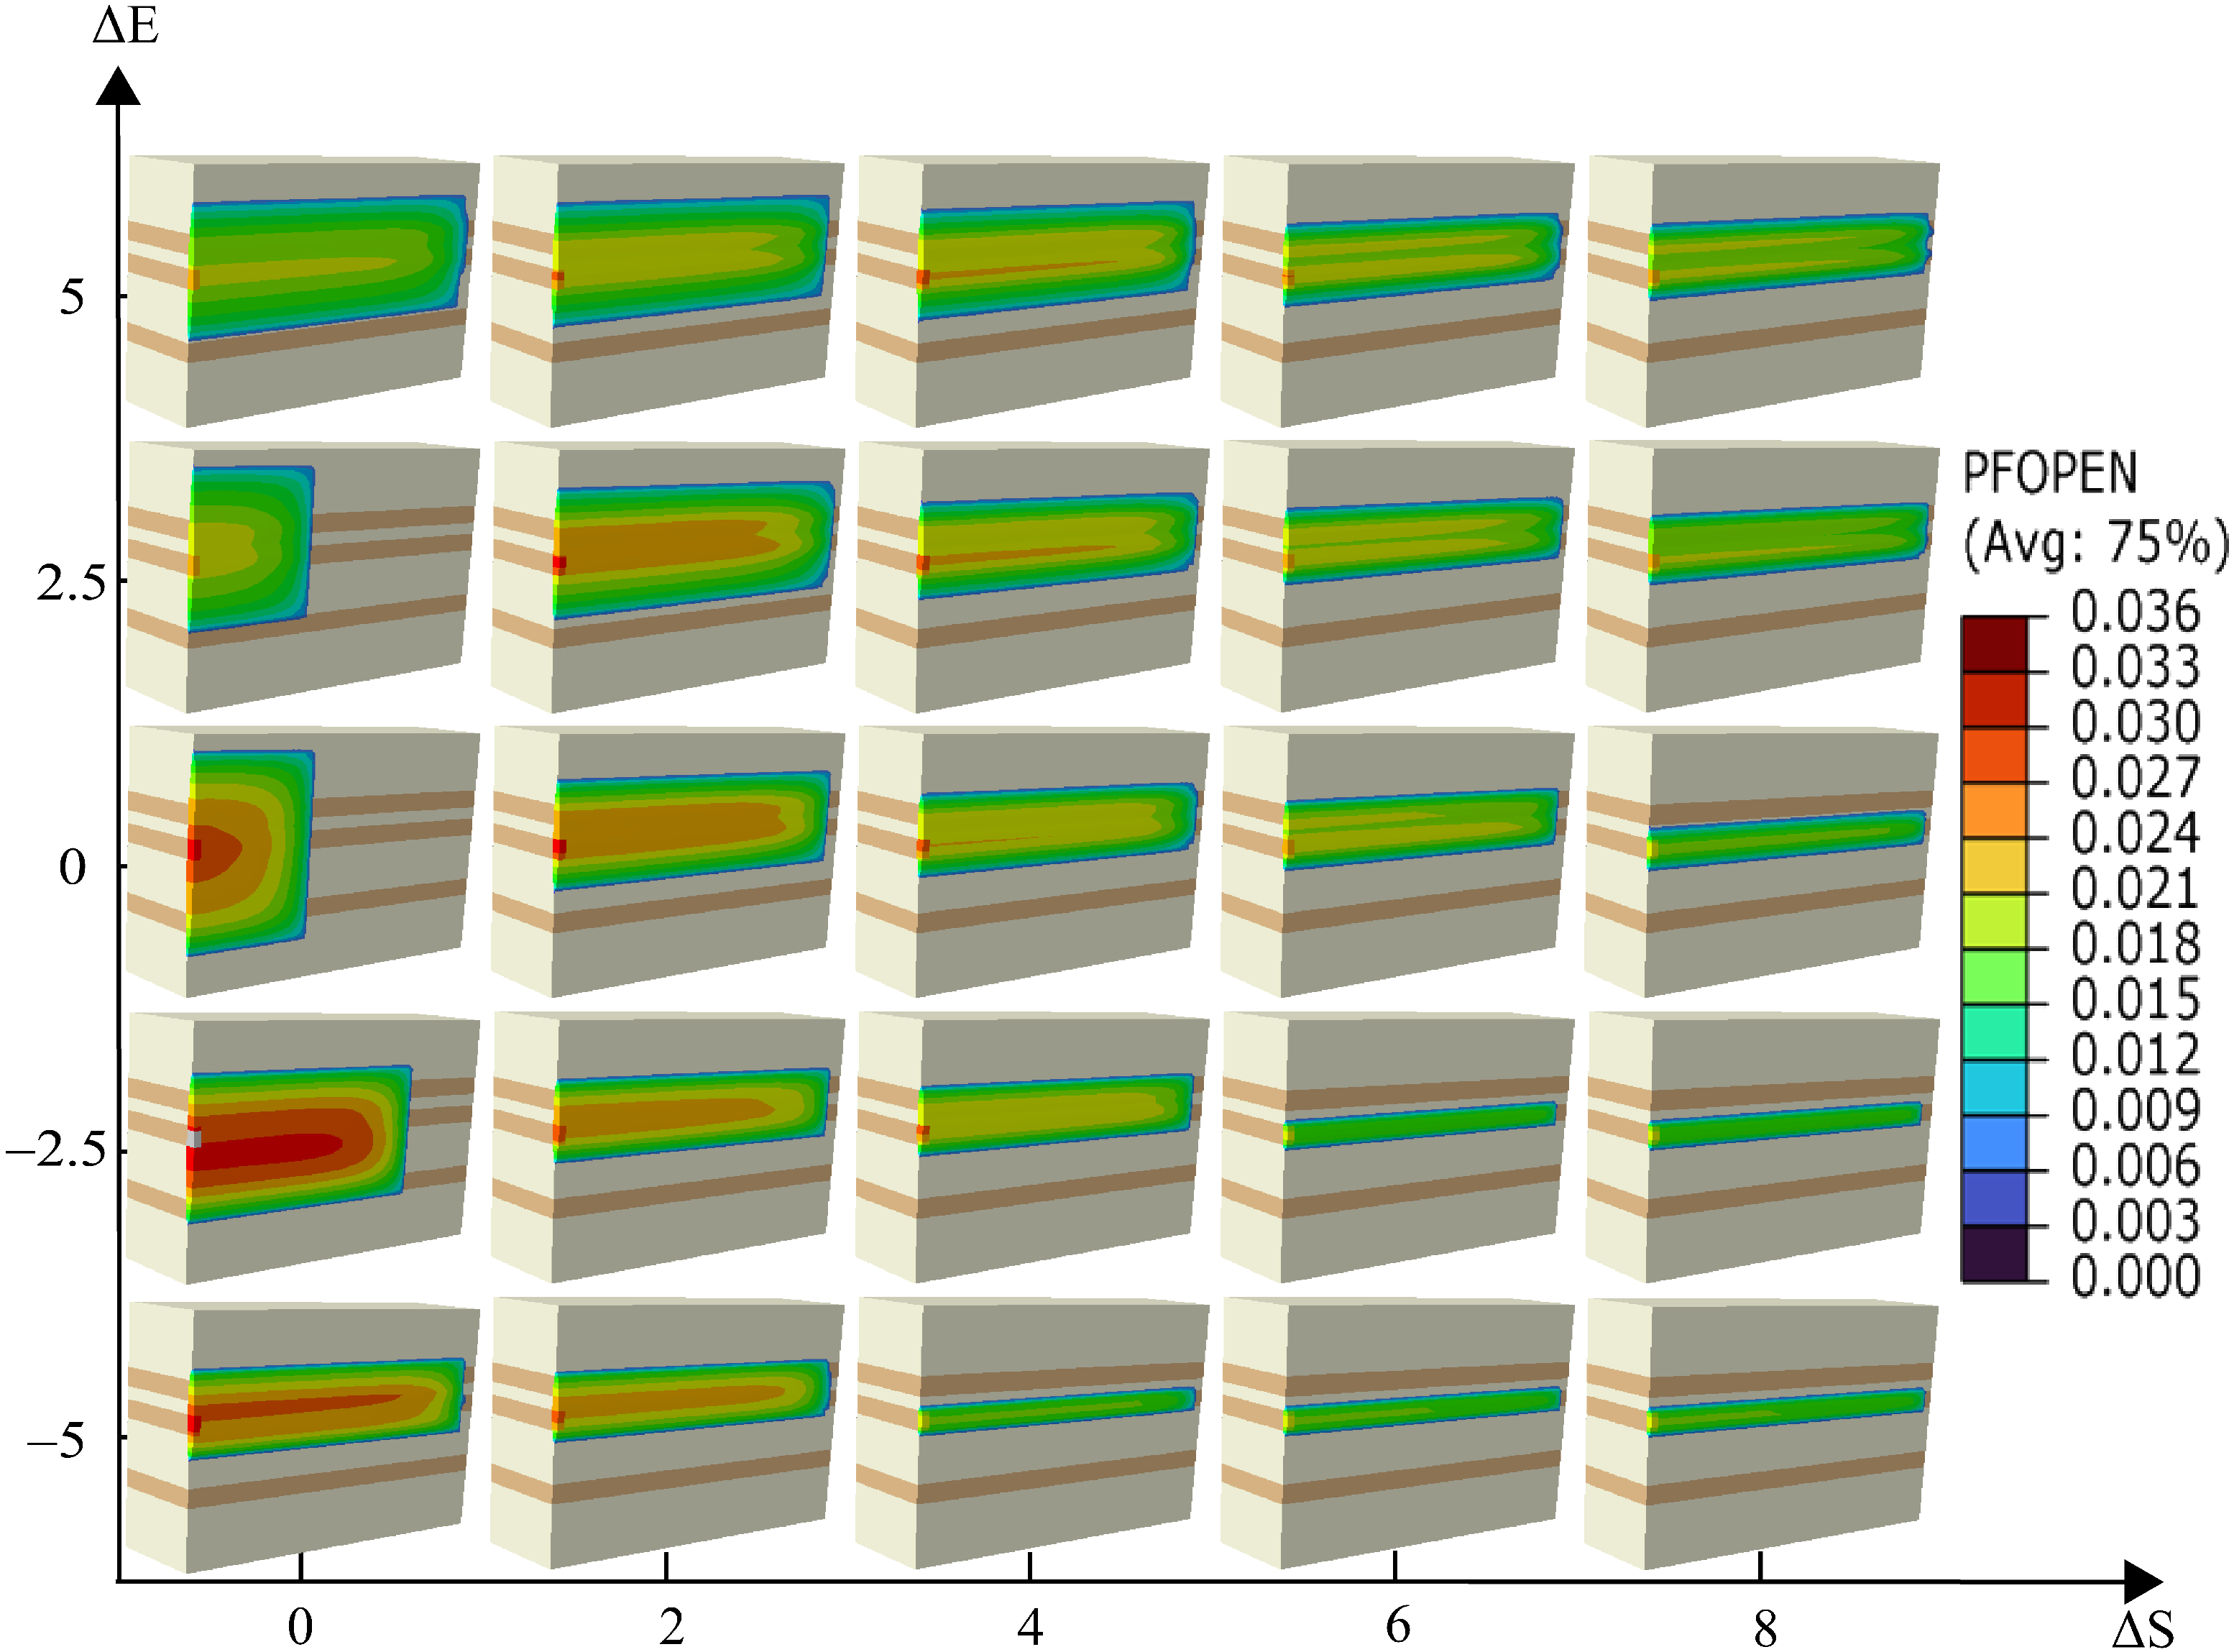
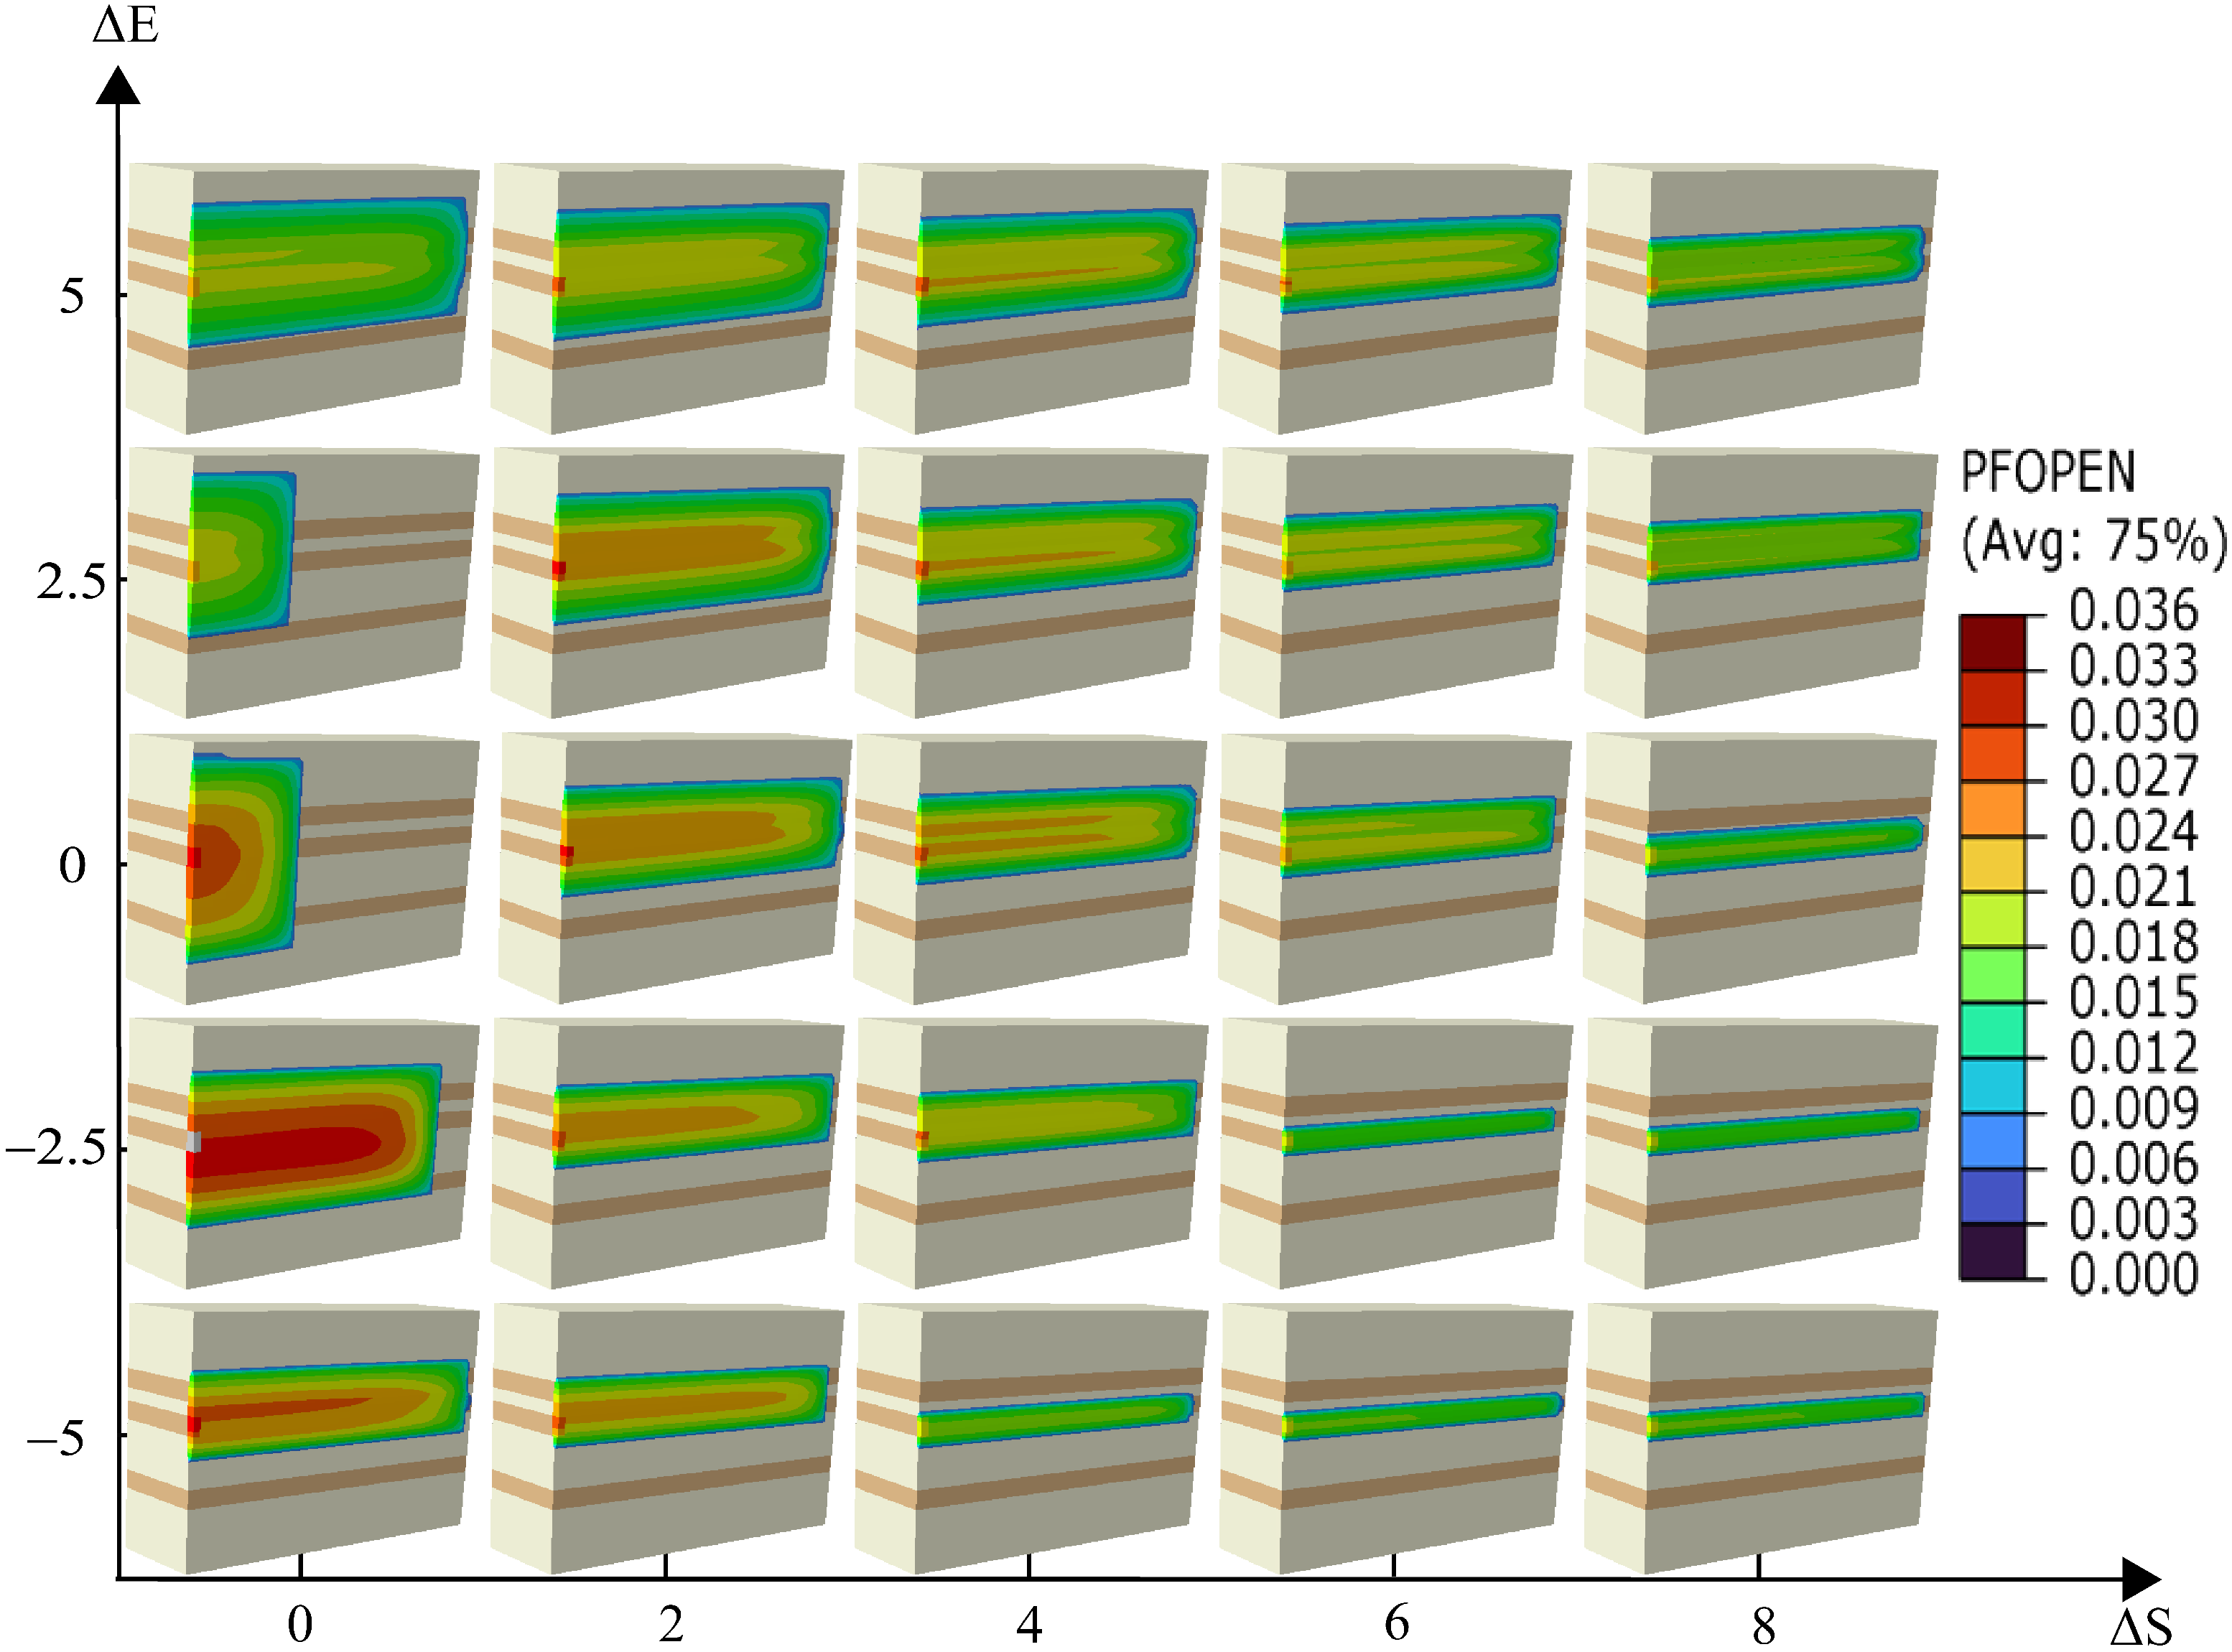
The effect of gradually increasing the pumping rate on vertical fracture extension was investigated, as shown in Figure 13, Figure 14, Figure 15 and Figure 16.
As depicted in Figure 13, Figure 14, Figure 15 and Figure 16, increasing the pumping rate from 2 m³/min to 10 m³/min results in greater fracture height and length, while the variation in fracture penetration thickness remains minimal. The figures below illustrate the penetration height for each set of fractures. (In the Figure 17, Δ S represents the interlayer stress contrast, and Δ E represents the interlayer elastic modulus contrast).
The results show that increasing the pumping rate has a limited effect on improving fracture penetration. Key geological factors, such as interlayer stress contrast and elastic modulus contrast between the reservoir and barrier layers, primarily control fracture propagation. Effective fracture propagation can only be achieved when the pumping rate is adjusted in alignment with favorable geological conditions.

4.4. Fracturing Fluid Viscosity Variation

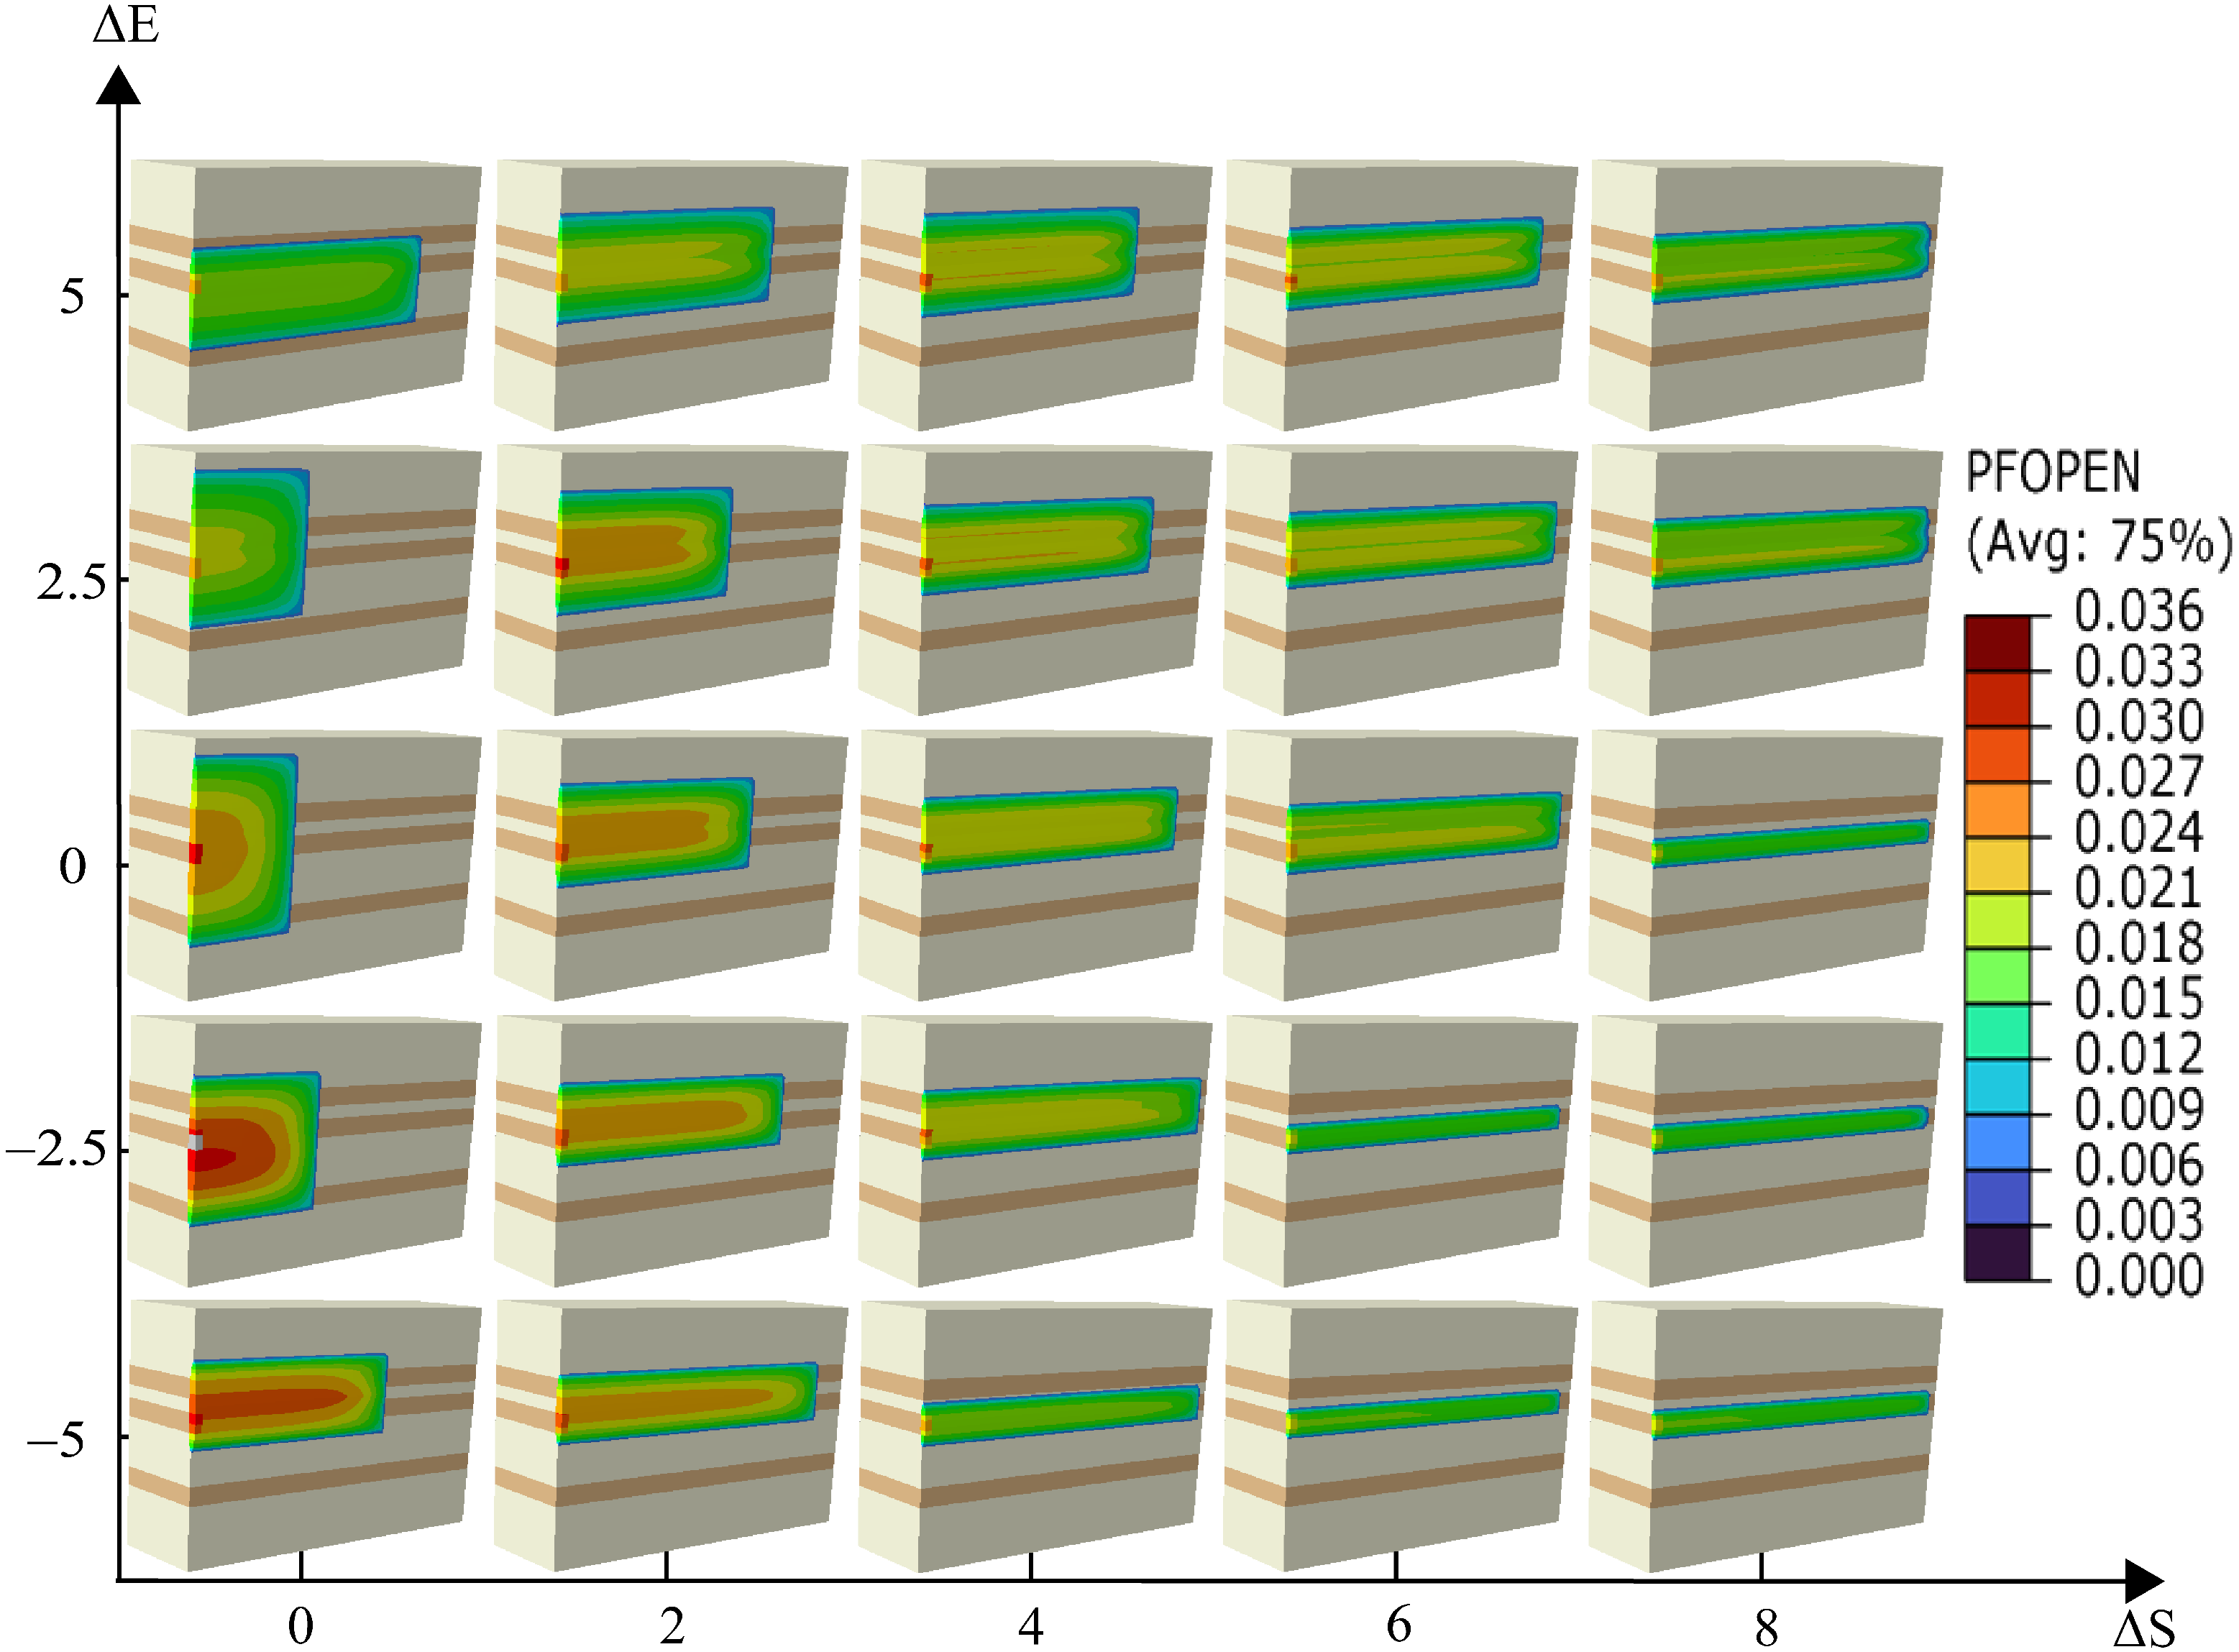
The viscosity of the fracturing fluid was adjusted from 0.01 Pa·s to 0.2 Pa·s to evaluate its impact on vertical fracture propagation. The results are illustrated in Figure 18, Figure 19, Figure 20 and Figure 21. A comparison with Figure 13, Figure 14, Figure 15 and Figure 16 shows minimal changes in fracture propagation patterns. This study indicates that variations in fracturing fluid viscosity do not significantly affect fracture penetration thickness. Consequently, increasing the viscosity of the fracturing fluid alone is inadequate for achieving effective reservoir stimulation in field applications.
The penetration height of each fracture group was analyzed, and the resulting figures are shown below (Figure 22):

5. Conclusions

This study, focused on hydraulic fracturing stimulation in a central Bohai oilfield, uses the finite element method to model fracture propagation in thin interlayered tight sandstone formations. It investigates the patterns of vertical fracture propagation under various geological and operational factors, including interlayer stress contrast, differences in elastic modulus, pumping rate, and fracturing fluid viscosity. The study offers valuable insights for designing hydraulic fracturing in low-permeability offshore reservoirs and presents figures illustrating the effects of these factors on fracture behavior.
The key research findings are as follows:
  • Interlayer stress contrast is the most critical factor influencing fracture propagation. When the stress differential reaches 8 MPa, fractures are entirely confined within the reservoir, which can be strategically used in field operations to prevent connecting with water-bearing zones.
  • Elastic modulus contrast between reservoir and barrier layers significantly affects fracture propagation. Barrier layers with a higher elastic modulus are more susceptible to fracture penetration, while those with a lower modulus tend to inhibit vertical fracture growth.
  • Pumping rate and fracturing fluid viscosity have minimal impact on the fracture propagation pattern and do not significantly improve fracture penetration. These operational parameters should be optimized alongside geological factors to achieve effective reservoir stimulation.
  • When the interlayer stress contrast is low, multi-layer reservoir fracturing can result in substantial fracture connectivity. However, when stress contrasts exist, even after perforation, the reservoir with lower stress may still fail to develop fractures.

Author Contributions

Methodology, L.Z. and W.L.; Formal analysis, L.Z., A.Z., G.W., Z.C. and J.W.; Data curation, A.Z.; Writing—original draft, L.Z.; Writing—review and editing, W.L.; Visualization, G.W.; Supervision, W.L.; Project administration, W.L. All authors have read and agreed to the published version of the manuscript.

Funding

The authors wish to acknowledge the financial support from the Natural Science Foundation of China (No. 52074313).

Data Availability Statement

The data that support the findings of this study are available on request from the corresponding author. The data are not publicly available due to privacy restrictions.

Conflicts of Interest

The authors declare no conflicts of interest.

References

  1. Roche, V.; Van Der Baan, M.; Preisig, G. A Study of 3D Modeling of Hydraulic Fracturing and Stress Perturbations during Fluid Injection. J. Pet. Sci. Eng. 2018, 170, 829–843. [Google Scholar] [CrossRef]
  2. Heng, S.; Liu, X.; Li, X.; Zhang, X.; Yang, C. Experimental and Numerical Study on the Non-Planar Propagation of Hydraulic Fractures in Shale. J. Pet. Sci. Eng. 2019, 179, 410–426. [Google Scholar] [CrossRef]
  3. Wu, S.; Li, T.; Ge, H.; Wang, X.; Li, N.; Zou, Y. Shear-Tensile Fractures in Hydraulic Fracturing Network of Layered Shale. J. Pet. Sci. Eng. 2019, 183, 106428. [Google Scholar] [CrossRef]
  4. Yang, Y.; Li, X.; Yang, X.; Li, X. Influence of reservoirs/interlayers thickness on hydraulic fracture propagation laws in low-permeability layered rocks. J. Pet. Sci. Eng. 2022, 219, 111081. [Google Scholar] [CrossRef]
  5. Yang, F.; Mei, W.; Li, L.; Sun, Z.; An, Q.; Yang, Q.; Lu, M.; Yang, R. Propagation of hydraulic fractures in thin interbedded tight sandstones. Coal Geol. Explor. 2023, 51, 61–71. [Google Scholar]
  6. Jia, A.; Wei, Y.; Guo, Z.; Wang, G.; Meng, D.; Huang, S. Development status and prospect of tight sandstone gas in China. Nat. Gas Ind. 2022, 42, 83–92. [Google Scholar] [CrossRef]
  7. Du, J.; Zhu, G.; Li, Y.; Wu, P.; Gao, J.; Zhu, Y. Exploration and development challenges and technological countermeasures for tight sandstone gas reservoirs in Ordos basin margin: A case study of Linxing—Shenfu Gas Field. Nat. Gas Ind. 2022, 42, 114–124. [Google Scholar]
  8. Li, A. Study of Influence Factors for Horizontal Well Layer-Penetration Fracturing in Thin Interbed Tight Sand Reservoirs. J. Jianghan Pet. Univ. Staff. Work. 2020, 33, 10–13. [Google Scholar]
  9. Yang, L. Numerical Simulation of Hydraulic Fracturing in Tight Sand Reservoirs. Ph.D. Thesis, China University of Petroleum, Beijing, China, 2019. [Google Scholar]
  10. Wu, R.; Deng, J.; Mao, S.; Yu, B.; Liu, W.; Li, Y. Numerical Modeling of Hydraulic Fracture Containment of Tight Sandstone Gas Reservoir. In Proceedings of the 51st U.S. Rock Mechanics/Geomechanics Symposium, San Francisco, CA, USA, 25–28 June 2017; p. ARMA–2017–0050. [Google Scholar]
  11. Wu, R.; Deng, J.; Yu, B.; Liu, W.; Li, Y.; Li, M.; Peng, C. Numerical modeling of hydraulic fracture containment of tight gas reservoir in Shihezi Formation, Linxing Block. J. China Coal Soc. 2017, 42, 2393–2401. [Google Scholar] [CrossRef]
  12. Pu, C.; Chen, Q.; Wu, F.; He, Y.; Sun, W. Staged Fracturing Pattern and Parameter Optimization of Horizontal Wells in Tight Sandstone Oil Reservoir. Pet. Drill. Tech. 2014, 42, 73–79. [Google Scholar]
  13. Guo, X.; Zhu, H.; Zhao, P.; Jiang, H.; Wu, G.; Tao, L.; Liu, C.; Chen, S.; Chen, J. Numerical Simulation on Cross-Layer Propagation of Hydraulic Fracture in Sand–Mud Interbedded Layers: Taking the Shahejie Formation in BZ 25–1 Offshore Oilfield as an Example. Rock Mech. Rock Eng. 2024, 1–21. [Google Scholar] [CrossRef]
  14. Wang, Y. Study on the Rules of Fracture Initiation and Propagation in Longitudinal Multilayer Hydraulic Fracturing. Master’s Thesis, China University of Petroleum, Beijing, China, 2021. [Google Scholar]
  15. Taleghani, A.D.; Gonzalez, M.; Shojaei, A. Overview of Numerical Models for Interactions between Hydraulic Fractures and Natural Fractures: Challenges and Limitations. Comput. Geotech. 2016, 71, 361–368. [Google Scholar] [CrossRef]
  16. Adachi, J.I.; Detournay, E.; Peirce, A.P. Analysis of the Classical Pseudo-3D Model for Hydraulic Fracture with Equilibrium Height Growth across Stress Barriers. Int. J. Rock Mech. Min. Sci. 2010, 47, 625–639. [Google Scholar] [CrossRef]
  17. Fisher, K.; Warpinski, N. Hydraulic-Fracture-Height Growth: Real Data. SPE Prod. Oper. 2012, 27, 8–19. [Google Scholar] [CrossRef]
  18. Chen, Z.; Jeffrey, R.G.; Zhang, X.; Kear, J. Finite-Element Simulation of a Hydraulic Fracture Interacting with a Natural Fracture. SPE J. 2017, 22, 219–234. [Google Scholar] [CrossRef]
  19. Gonzalez-Chavez, M.; Taleghani, A.D.; Olson, J.E. A Cohesive Model for Modeling Hydraulic Fractures in Naturally Fractured Formations. In Proceedings of the SPE Hydraulic Fracturing Technology Conference, The Woodlands, TX, USA, 3–5 February 2015. [Google Scholar] [CrossRef]
  20. Zhu, H.; Zhang, X.; Guo, J.; Xu, Y.; Chen, L.; Yuan, S.; Wang, Y.; Huang, J. Stress Field Interference of Hydraulic Fractures in Layered Formation. Geomech. Eng. 2015, 9, 645–667. [Google Scholar] [CrossRef]
  21. Gutierrez, R.E.; Sanchez, E.C.M.; Roehl, D.; Romanel, C. Numerical Modeling of Fracture Containment in Multi-Layered Formations Using a Cohesive Zone Model. In Proceedings of the VII Simpósio Brasileiro de Mecânica Das Rochas, Belo Horizonte, Brazil, 19–22 October 2016. [Google Scholar] [CrossRef]
  22. Guo, J.; Luo, B.; Lu, C.; Lai, J.; Ren, J. Numerical Investigation of Hydraulic Fracture Propagation in a Layered Reservoir Using the Cohesive Zone Method. Eng. Fract. Mech. 2017, 186, 195–207. [Google Scholar] [CrossRef]
  23. Lyu, Z.; Pan, L.; Hao, L.; Zou, N.; Zou, Z. Numerical Simulation of Factors Influencing Hydraulic Fracture Propagation in Sandstone-Mudstone Interbedded Reservoirs. Xinjiang Pet. Geol. 2023, 44, 729–738. [Google Scholar]
  24. Tan, P.; Chen, Z.-W.; Huang, L.-K.; Zhao, Q.; Shao, S.-R. Evaluation of the Combined Influence of Geological Layer Property and In-Situ Stresses on Fracture Height Growth for Layered Formations. Pet. Sci. 2024, S1995822624001985. [Google Scholar] [CrossRef]
  25. Chitrala, Y.; Moreno, C.; Sondergeld, C.; Rai, C. An Experimental Investigation into Hydraulic Fracture Propagation under Different Applied Stresses in Tight Sands Using Acoustic Emissions. J. Pet. Sci. Eng. 2013, 108, 151–161. [Google Scholar] [CrossRef]
  26. Zhang, Y.; Okere, C.J.; Su, G. Effect of Loading Rates on Accurate In-Situ Stress Determination in Different Lithologies via Kaiser Effect. Arab. J. Geosci. 2021, 14, 1304. [Google Scholar] [CrossRef]
  27. Zhang, J.; Yu, Q.; Li, Y.; Pan, Z.; Liu, B. Hydraulic Fracture Vertical Propagation Mechanism in Interlayered Brittle Shale Formations: An Experimental Investigation. Rock Mech. Rock Eng. 2023, 56, 199–220. [Google Scholar] [CrossRef]
  28. Liu, S.; Valkó, P.P. An Improved Equilibrium-Height Model for Predicting Hydraulic Fracture Height Migration in Multi-Layer Formations. In Proceedings of the SPE Hydraulic Fracturing Technology Conference, The Woodlands, TX, USA, 3–5 February 2015; p. D012S012R001. [Google Scholar] [CrossRef]
  29. Ju, Y.; Liu, P.; Chen, J.; Yang, Y.; Ranjith, P.G. CDEM-based Analysis of the 3D Initiation and Propagation of Hydrofracturing Cracks in Heterogeneous Glutenites. J. Nat. Gas Sci. Eng. 2016, 35, 614–623. [Google Scholar] [CrossRef]
  30. Zhang, B.; Guo, T.; Chen, M.; Wang, J.; Cao, J.; Wang, H.; Qu, Z. Effect of Bedding Planes and Property Contrast between Layers on the Propagation Mechanism of Hydraulic Fracture Height in Shale Reservoirs. Comput. Geotech. 2024, 175, 106715. [Google Scholar] [CrossRef]
  31. Zou, Y.; Ma, X.; Zhang, S.; Zhou, T.; Li, H. Numerical Investigation into the Influence of Bedding Plane on Hydraulic Fracture Network Propagation in Shale Formations. Rock Mech. Rock Eng. 2016, 49, 3597–3614. [Google Scholar] [CrossRef]
  32. Gao, Q.; Cheng, Y.; Yan, C. A 3D Numerical Model for Investigation of Hydraulic Fracture Configuration in Multilayered Tight Sandstone Gas Reservoirs. J. Pet. Explor. Prod. Technol. 2018, 8, 1413–1424. [Google Scholar] [CrossRef]
  33. Li, H.; Jiang, Z.; Shu, J.; Fan, Y.; Du, T. Numerical simulation of layer-crossing propagation behavior of hydraulic fractures at coal-rock interface. Coal Geol. Explor. 2020, 48, 106–113. [Google Scholar]
  34. Wang, Y.; Hou, B.; Wang, D.; Jia, Z. Features of Fracture Height Propagation in Cross-Layer Fracturing of Shale Oil Reservoirs. Pet. Explor. Dev. 2021, 48, 469–479. [Google Scholar] [CrossRef]
  35. Liao, S.; Hu, J.; Zhang, Y. Mechanism of Hydraulic Fracture Vertical Propagation in Deep Shale Formation Based on Elastic–Plastic Model. Eng. Fract. Mech. 2024, 295, 109806. [Google Scholar] [CrossRef]
  36. Zhang, S.; Liao, S.; Li, S.; Hu, J. Influence of Engineering Parameters on Fracture Vertical Propagation in Deep Shale Reservoir: A Numerical Study Based on FEM. ACS Omega 2024, 9, 4635–4646. [Google Scholar] [CrossRef]
  37. Tan, P.; Jin, Y.; Xiong, Z.; Mian, C.; Hou, B. Effect of Interface Property on Hydraulic Fracture Vertical Propagation Behavior in Layered Formation Based on Discrete Element Modeling. J. Geophys. Eng. 2018, 15, 1542–1550. [Google Scholar] [CrossRef]
  38. Huang, L.; Dontsov, E.; Fu, H.; Lei, Y.; Weng, D.; Zhang, F. Hydraulic Fracture Height Growth in Layered Rocks: Perspective from DEM Simulation of Different Propagation Regimes. Int. J. Solids Struct. 2022, 238, 111395. [Google Scholar] [CrossRef]
  39. Tan, P.; Jin, Y.; Han, K.; Hou, B.; Chen, M.; Guo, X.; Gao, J. Analysis of Hydraulic Fracture Initiation and Vertical Propagation Behavior in Laminated Shale Formation. Fuel 2017, 206, 482–493. [Google Scholar] [CrossRef]
  40. Gao, J.; Hou, B.; Tan, P.; Guo, X.; Chang, Z. Propagation Mechanism of Hydraulic Fracture in Sand Coal Interbedding. J. China Coal Soc. 2017, 42, 430–435. [Google Scholar] [CrossRef]
  41. Ouchi, H.; Foster, J.T.; Sharma, M.M. Effect of Reservoir Heterogeneity on the Vertical Migration of Hydraulic Fractures. J. Pet. Sci. Eng. 2017, 151, 384–408. [Google Scholar] [CrossRef]
  42. Xing, P.; Yoshioka, K.; Adachi, J.; El-Fayoumi, A.; Bunger, A.P. Laboratory Measurement of Tip and Global Behavior for Zero-Toughness Hydraulic Fractures with Circular and Blade-Shaped (PKN) Geometry. J. Mech. Phys. Solids 2017, 104, 172–186. [Google Scholar] [CrossRef]
  43. Xing, P.; Yoshioka, K.; Adachi, J.; El-Fayoumi, A.; Damjanac, B.; Bunger, A.P. Lattice Simulation of Laboratory Hydraulic Fracture Containment in Layered Reservoirs. Comput. Geotech. 2018, 100, 62–75. [Google Scholar] [CrossRef]
  44. Huang, B.; Liu, J. Fully Three-Dimensional Propagation Model of Horizontal Borehole Hydraulic Fractures in Strata under the Effect of Bedding Planes. Energy Explor. Exploit. 2018, 36, 1189–1209. [Google Scholar] [CrossRef]
  45. Cao, S.; Li, X.; Zhou, Z.; Wang, Y.; Ding, H. Investigation of Hydraulic Fracturing Crack Propagation Behavior in Multi-Layered Coal Seams. Appl. Sci. 2020, 10, 1153. [Google Scholar] [CrossRef]
  46. Cui, Z.; Hou, B.; Fu, S.; L, J. Fractures cross-layer propagation characteristics of integrated fracturing in shale oil tight reservoir. Fault-Block Oil Gas Field 2022, 29, 111–117. [Google Scholar]
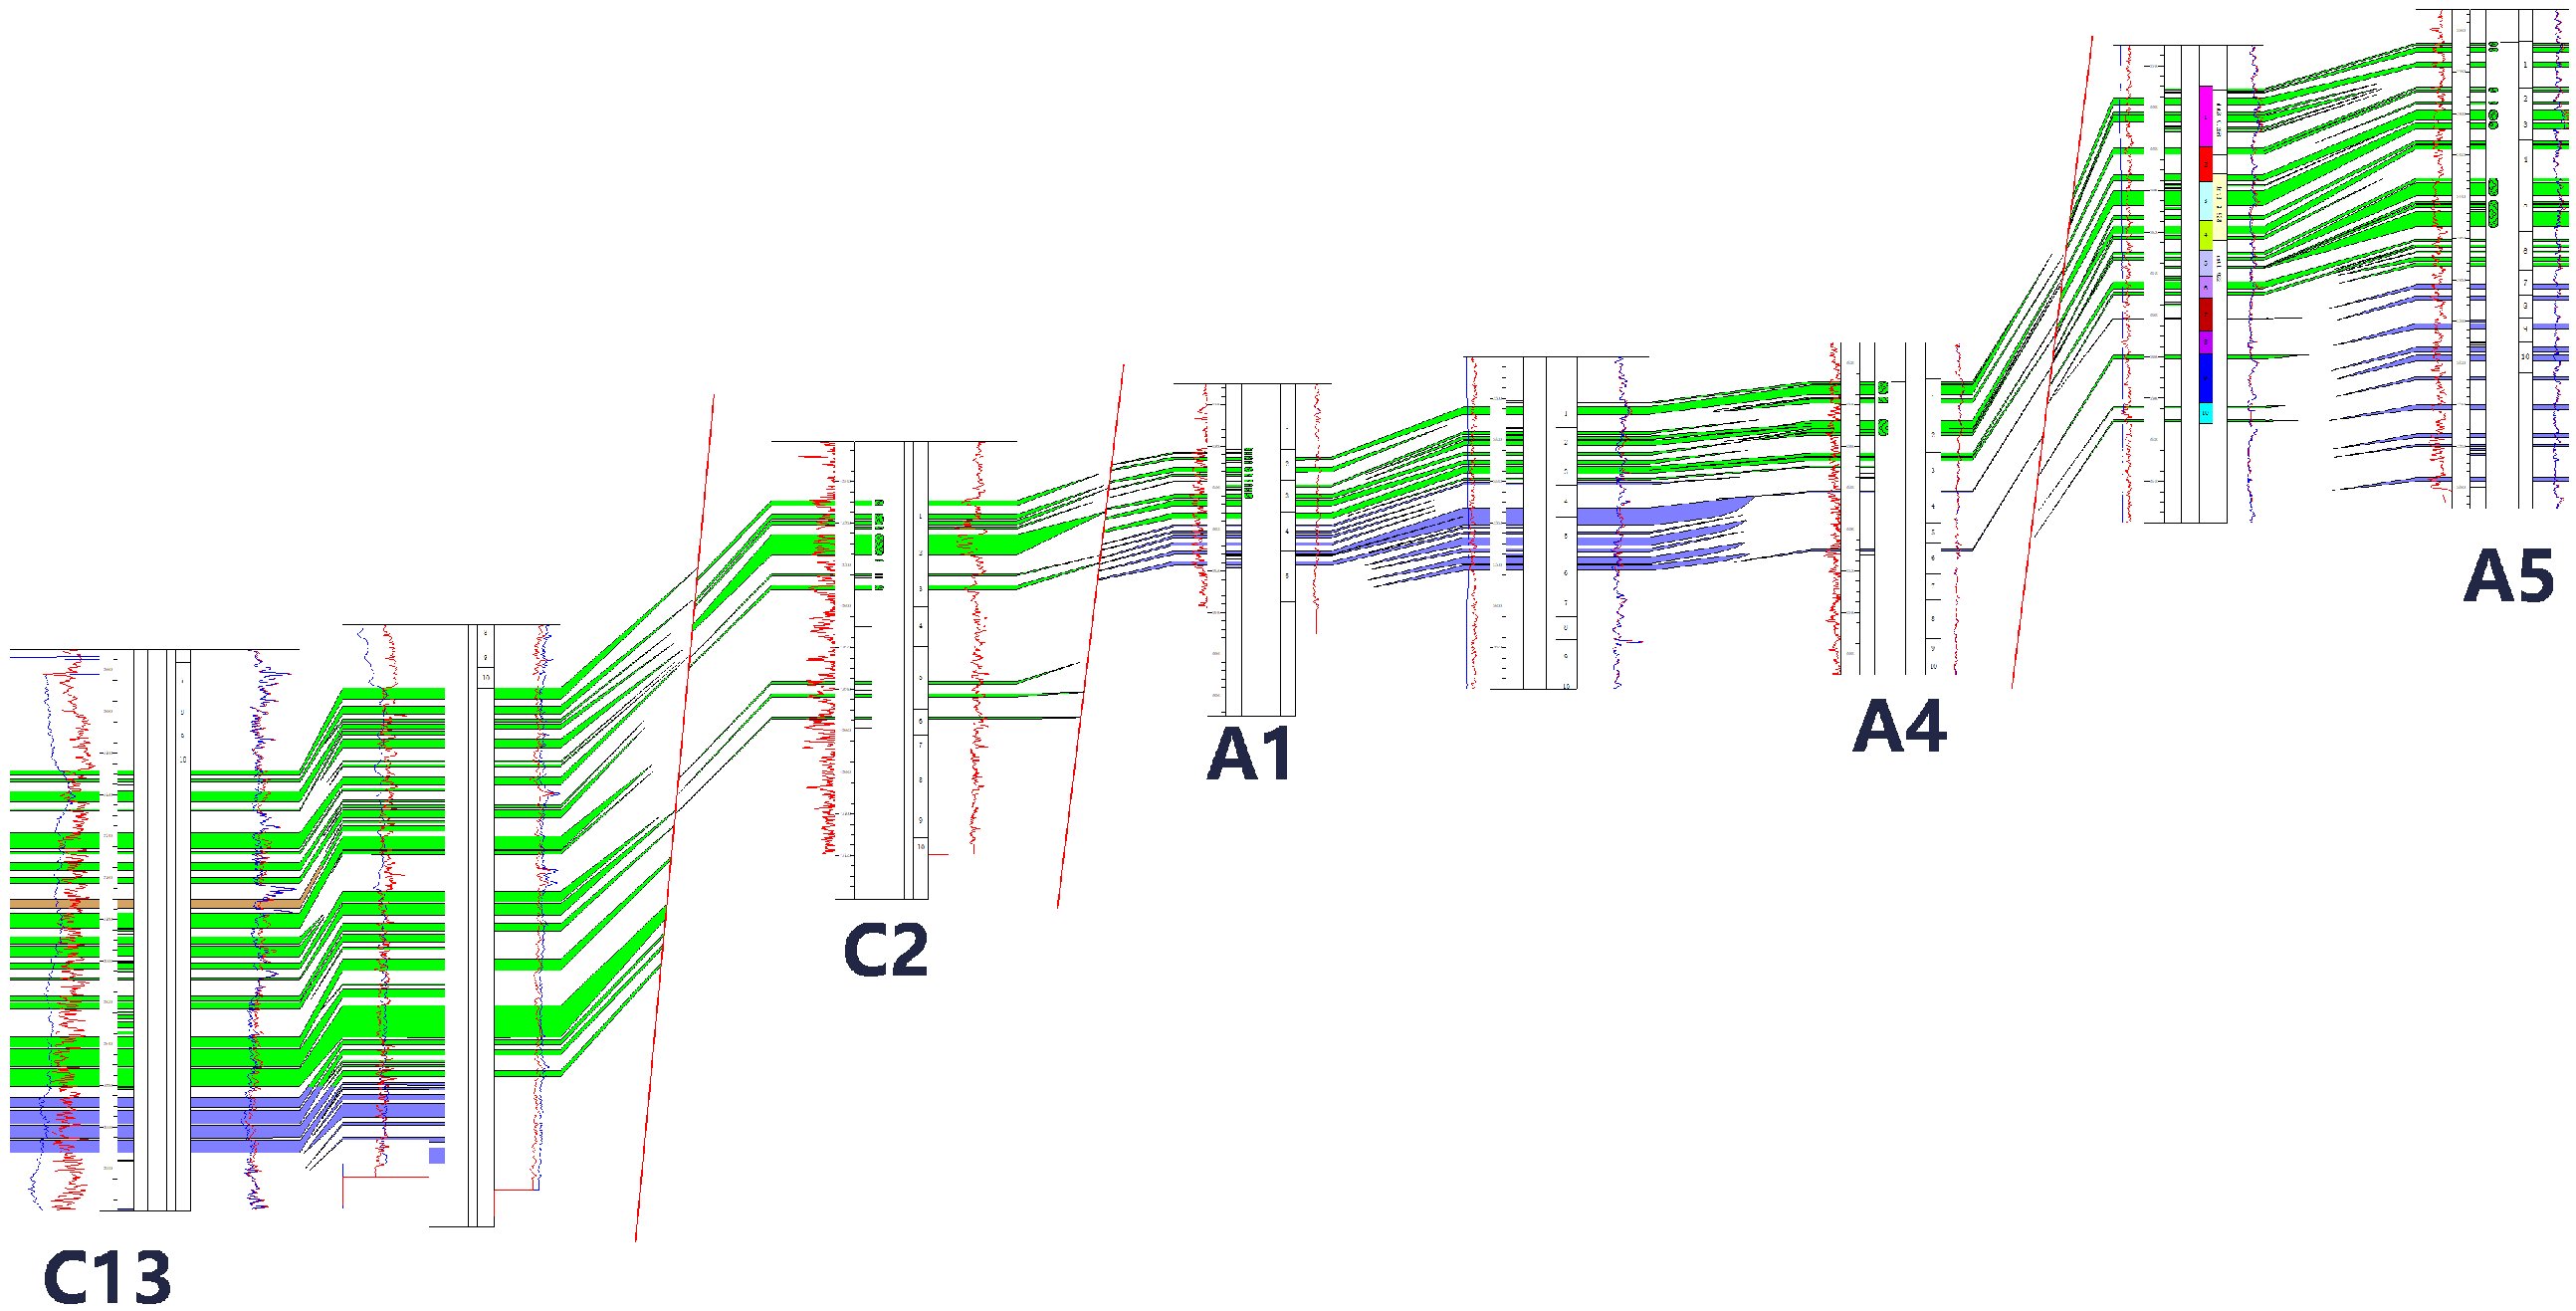
Figure 1. The stratigraphic distribution at each well site.
Processes 12 02375 g001
Figure 2. Prediction results based on well-logging data. GR: Natural Gamma Ray, DT: Delta T, DEN: Density, Es: elastic modulus, us: Poisson’s ratio, Pp: pore pressure, Sh_min: minimum horizontal stress.
Processes 12 02375 g002
Figure 4. Flow within cohesive elements.
Processes 12 02375 g004
Figure 5. Lithology profile and geometric model.
Processes 12 02375 g005
Figure 6. Fracture propagation patterns under various interlayer stress contrasts.
Processes 12 02375 g006
Figure 8. Fracture propagation patterns with varying elastic moduli under an interlayer stress contrast of 2 MPa.
Processes 12 02375 g008
Figure 9. Fracture propagation patterns with varying elastic moduli under an interlayer stress contrast of 4 MPa.
Processes 12 02375 g009
Figure 10. Fracture propagation patterns with varying elastic moduli under an interlayer stress contrast of 6 MPa.
Processes 12 02375 g010
Figure 11. Fracture propagation patterns with varying elastic moduli under an interlayer stress contrast of 8 MPa.
Processes 12 02375 g011
Figure 12. The influence of elastic modulus contrast on fracture propagation under different interlayer stress contrasts.
Processes 12 02375 g012
Figure 13. The fracture propagation at a pumping rate of 4 m³/min.
Processes 12 02375 g013
Figure 14. The fracture propagation at a pumping rate of 6 m³/min.
Processes 12 02375 g014
Figure 15. The fracture propagation at a pumping rate of 8 m³/min.
Processes 12 02375 g015
Figure 16. The fracture propagation at a pumping rate of 10 m³/min.
Processes 12 02375 g016
Figure 17. The impact of different pumping rates on fracture penetration height.
Processes 12 02375 g017
Figure 18. Fracture propagation pattern at a pumping rate of 4 m³/min and a viscosity of 0.2 Pa·s.
Processes 12 02375 g018
Figure 19. Fracture propagation pattern at a pumping rate of 6 m³/min and a viscosity of 0.2 Pa·s.
Processes 12 02375 g019
Figure 20. Fracture propagation pattern at a pumping rate of 8 m³/min and a viscosity of 0.2 Pa·s.
Processes 12 02375 g020
Figure 21. Fracture propagation pattern at a pumping rate of 10 m³/min and a viscosity of 0.2 Pa·s.
Processes 12 02375 g021
Figure 22. The impact of different pumping rates on fracture penetration height when the viscosity is 0.2 Pa·s.
Processes 12 02375 g022
Table 1. Fracture half-length.
Well NameDesigned Fracture
Half-Length (m)
Created Fracture
Half-Length
Interpretation (m)
Dynamic Interpreted
Fracture Half-
Length (m)
Fracture Half-
Length Ratio
(Dynamic/Created)
A2010981800.99
A2279.790530.59
C2510573680.43
C37H120160400.25
C38H123155580.37
A48078130.16
Table 2. Numerical model parameters.
ParameterValue
Sandstone Layer Elastic Modulus (GPa)15
Mudstone Layer Elastic Modulus (GPa)15
Poisson’s Ratio of Sandstone Layer0.25
Poisson’s Ratio of Mudstone Layer0.3
Tensile Strength (MPa)3
Fracture Energy (J)4000
Maximum Horizontal Stress in Mudstone Layer (MPa)70
Minimum Horizontal Stress in Mudstone Layer (MPa)62
Overburden Pressure in Mudstone Layer (MPa)80
Maximum Horizontal Stress in Sandstone Layer (MPa)70
Minimum Horizontal Stress in Sandstone Layer (MPa)62
Overburden Pressure in Sandstone Layer (MPa)80
Fracturing Fluid Viscosity (Pa·s)0.01
Pumping Rate (m3·min−1)2
Table 3. Operational parameters.
Operating Condition ParametersRange of Variation
Interlayer stress contrast (MPa)0~8
Interlayer elastic modulus contrast (GPa)−5~5
Pumping Rate (m³/min)4~10
Fracturing Fluid Viscosity (Pa·s)0.01~0.2
Disclaimer/Publisher’s Note: The statements, opinions and data contained in all publications are solely those of the individual author(s) and contributor(s) and not of MDPI and/or the editor(s). MDPI and/or the editor(s) disclaim responsibility for any injury to people or property resulting from any ideas, methods, instructions or products referred to in the content.