
On the Feasibility of Deep Geothermal Wells Using Numerical Reservoir Simulation


Abstract
1. Introduction
Geothermal Well Configurations
2. Methodology
2.1. Numerical Reservoir Simulation Approach
2.2. Well Configurations and Fluid Dynamics
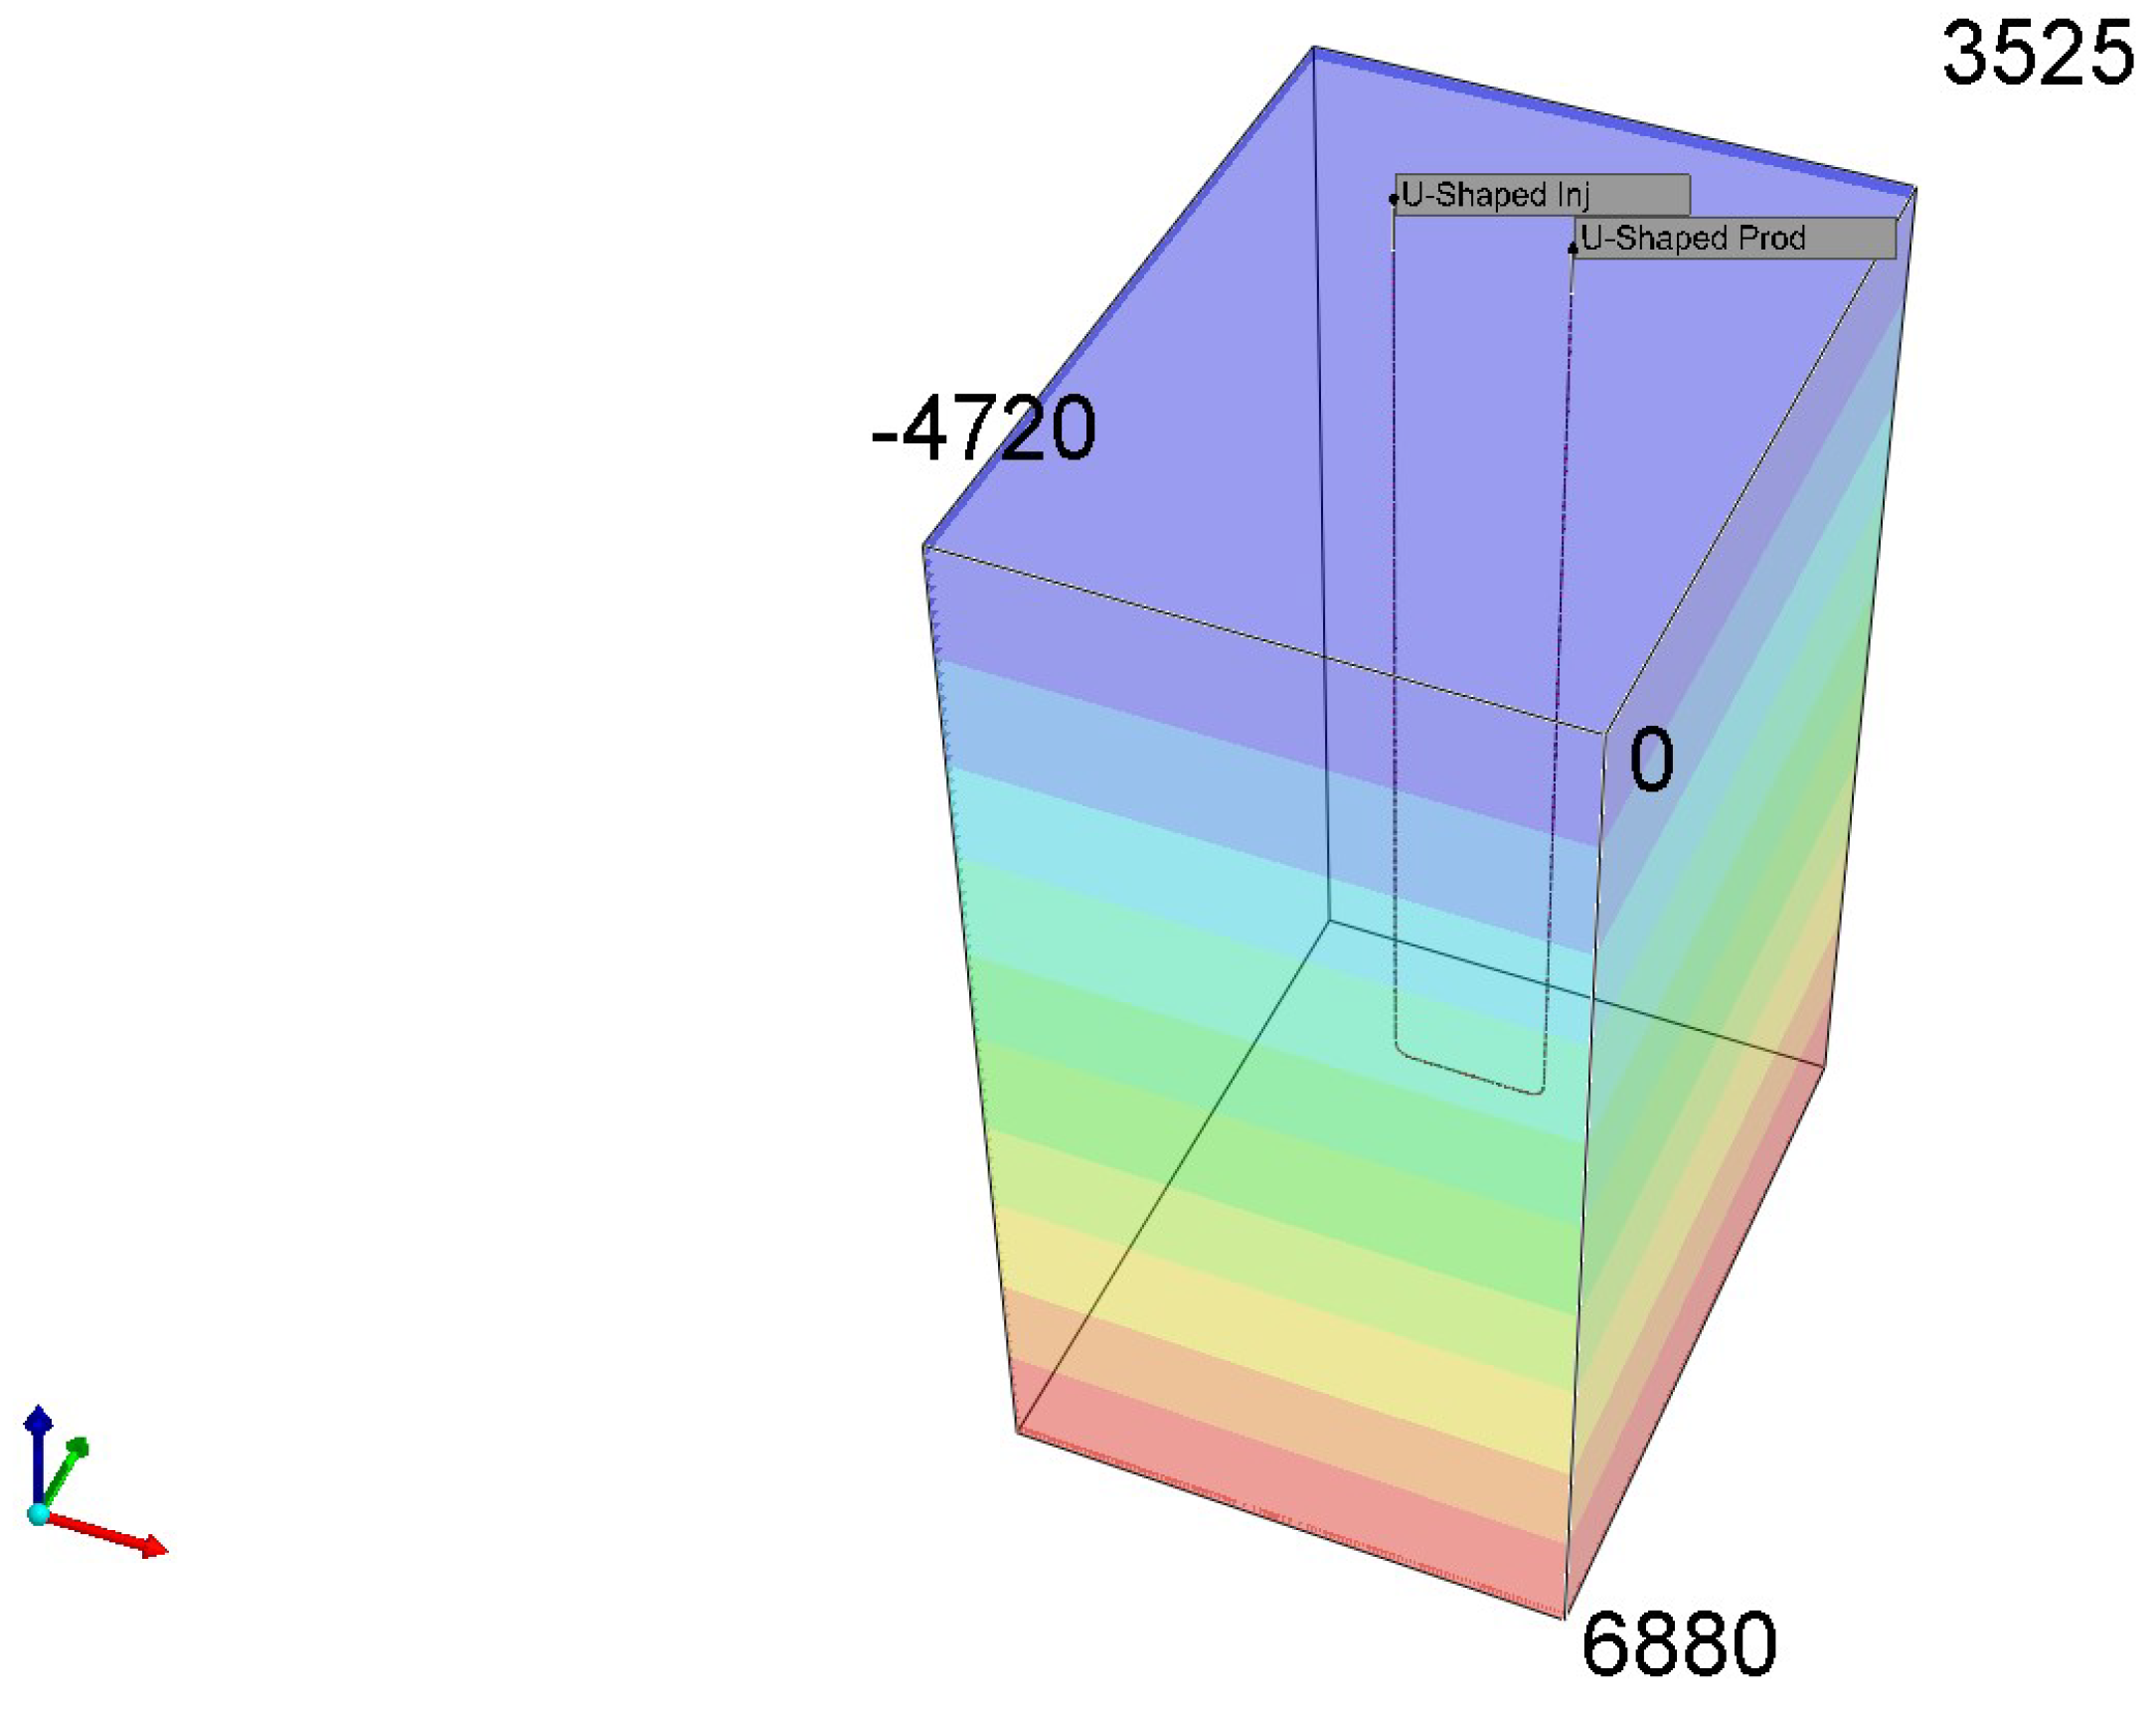
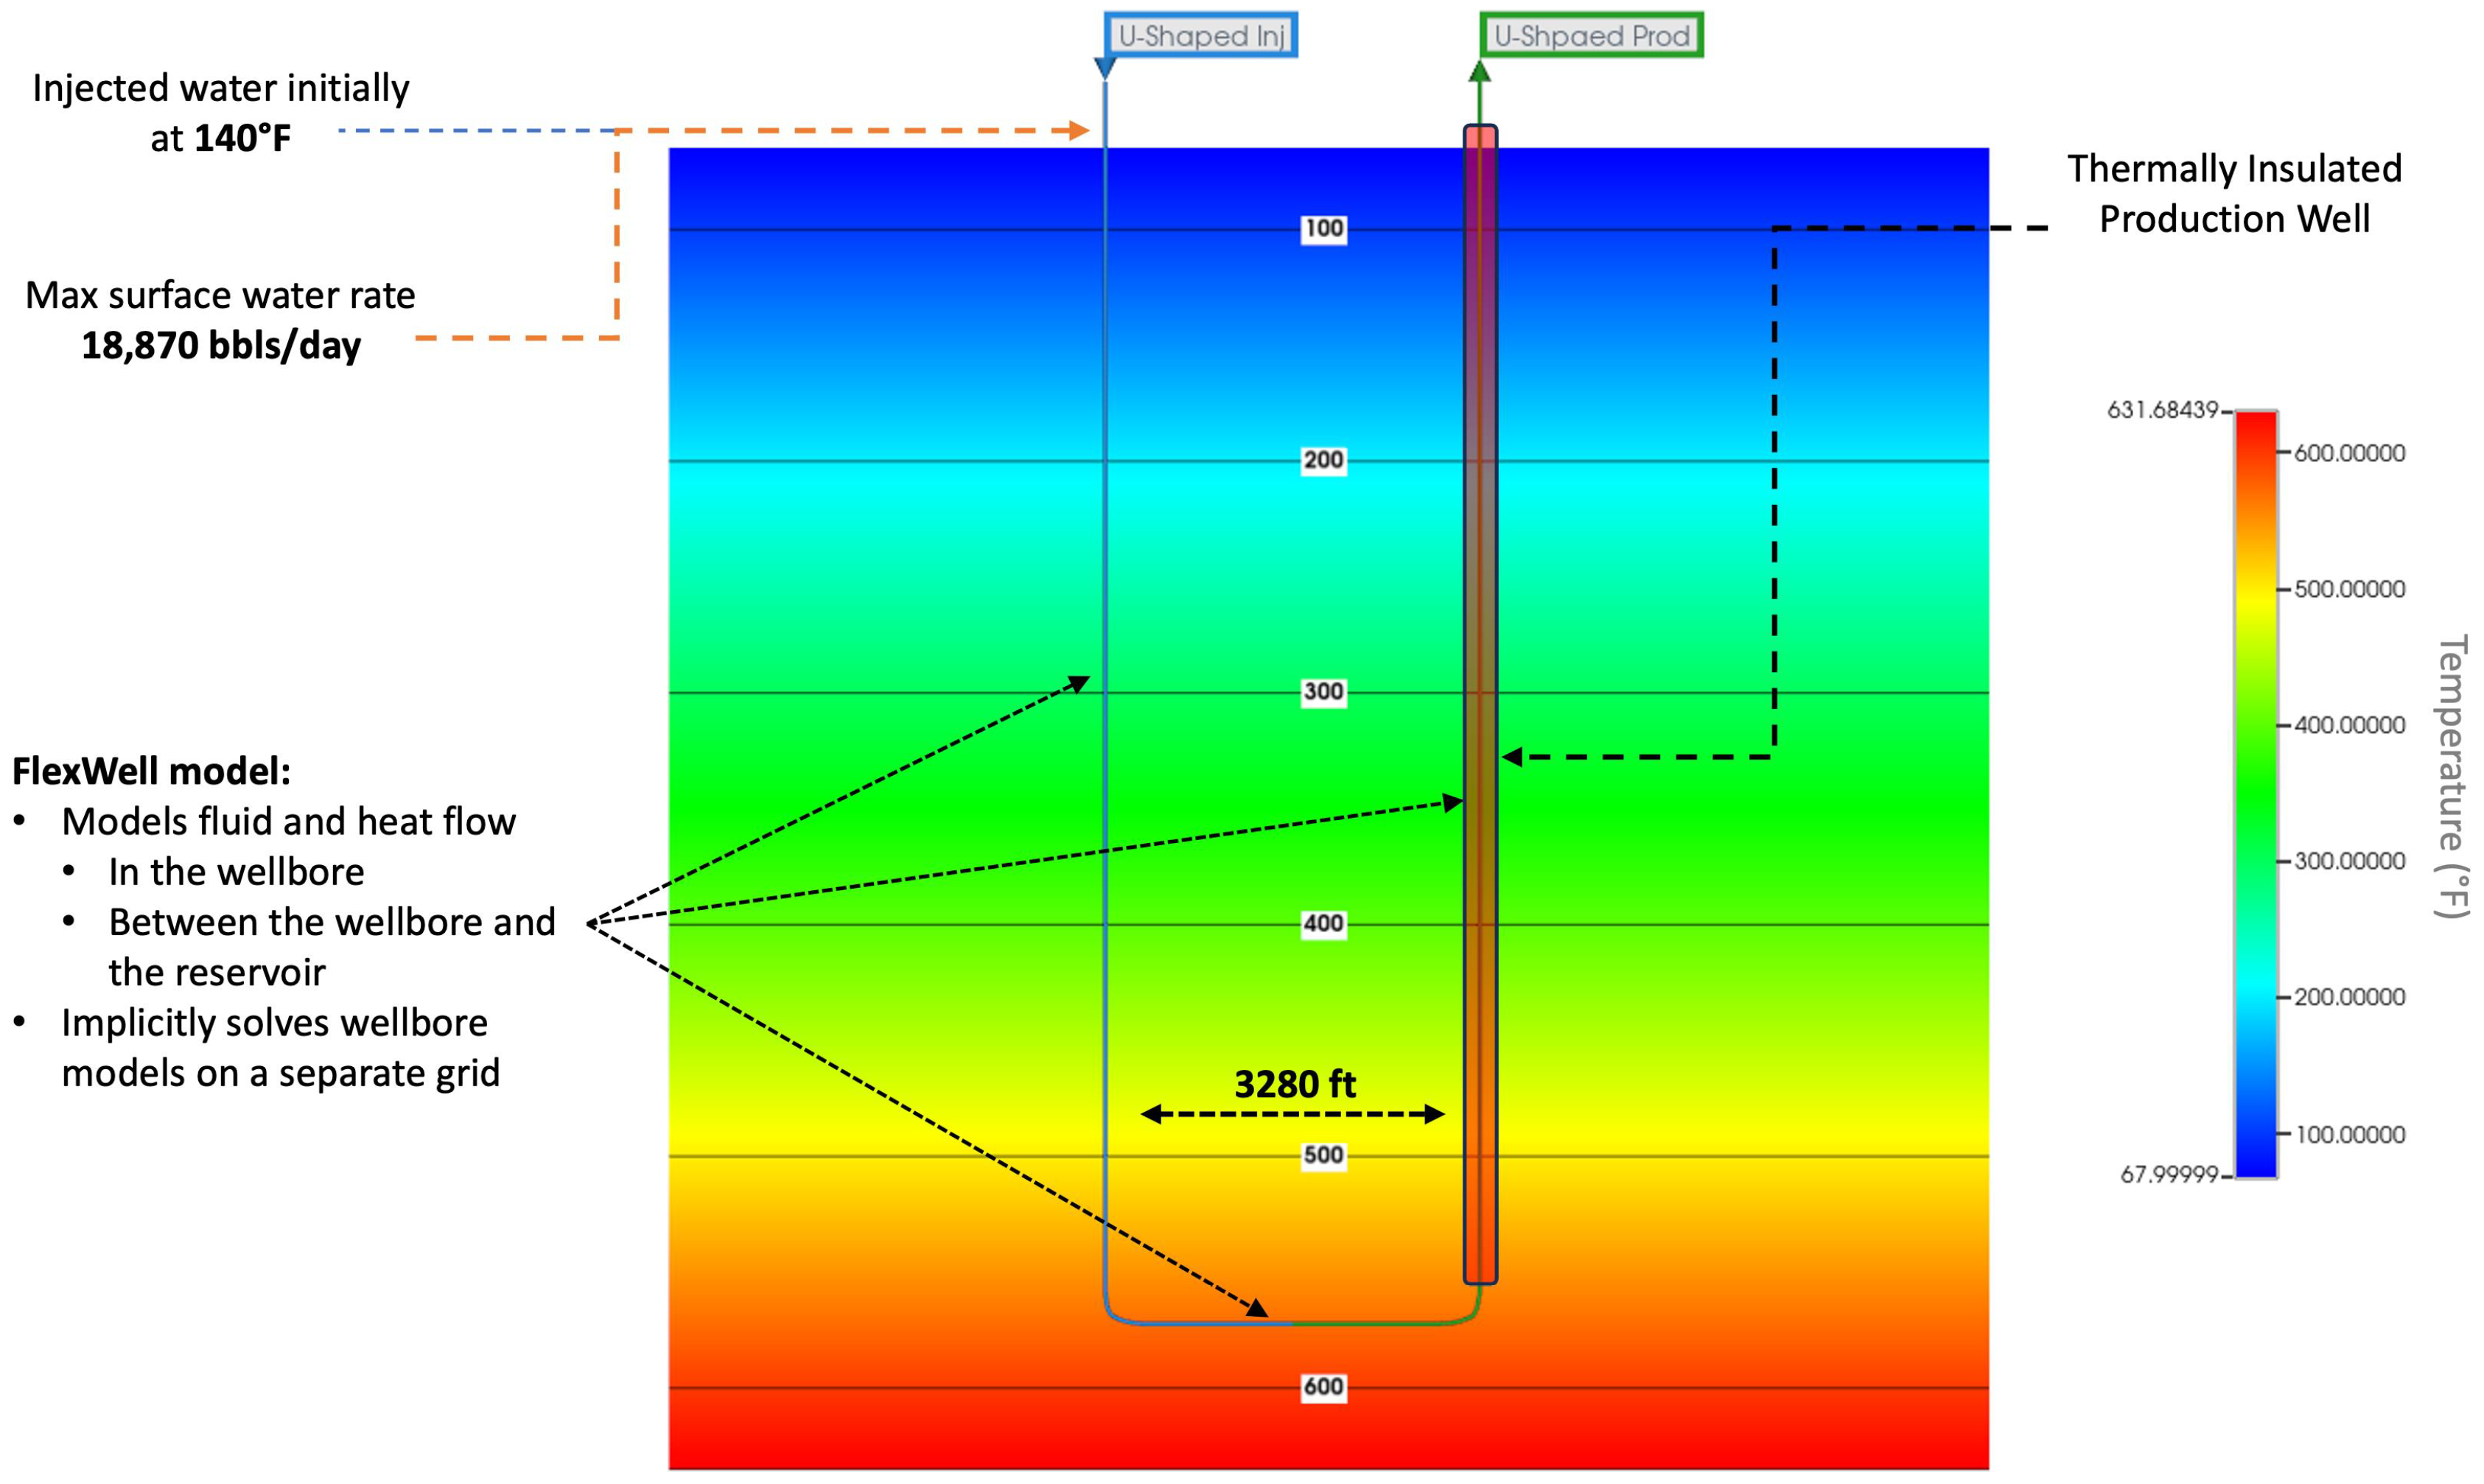
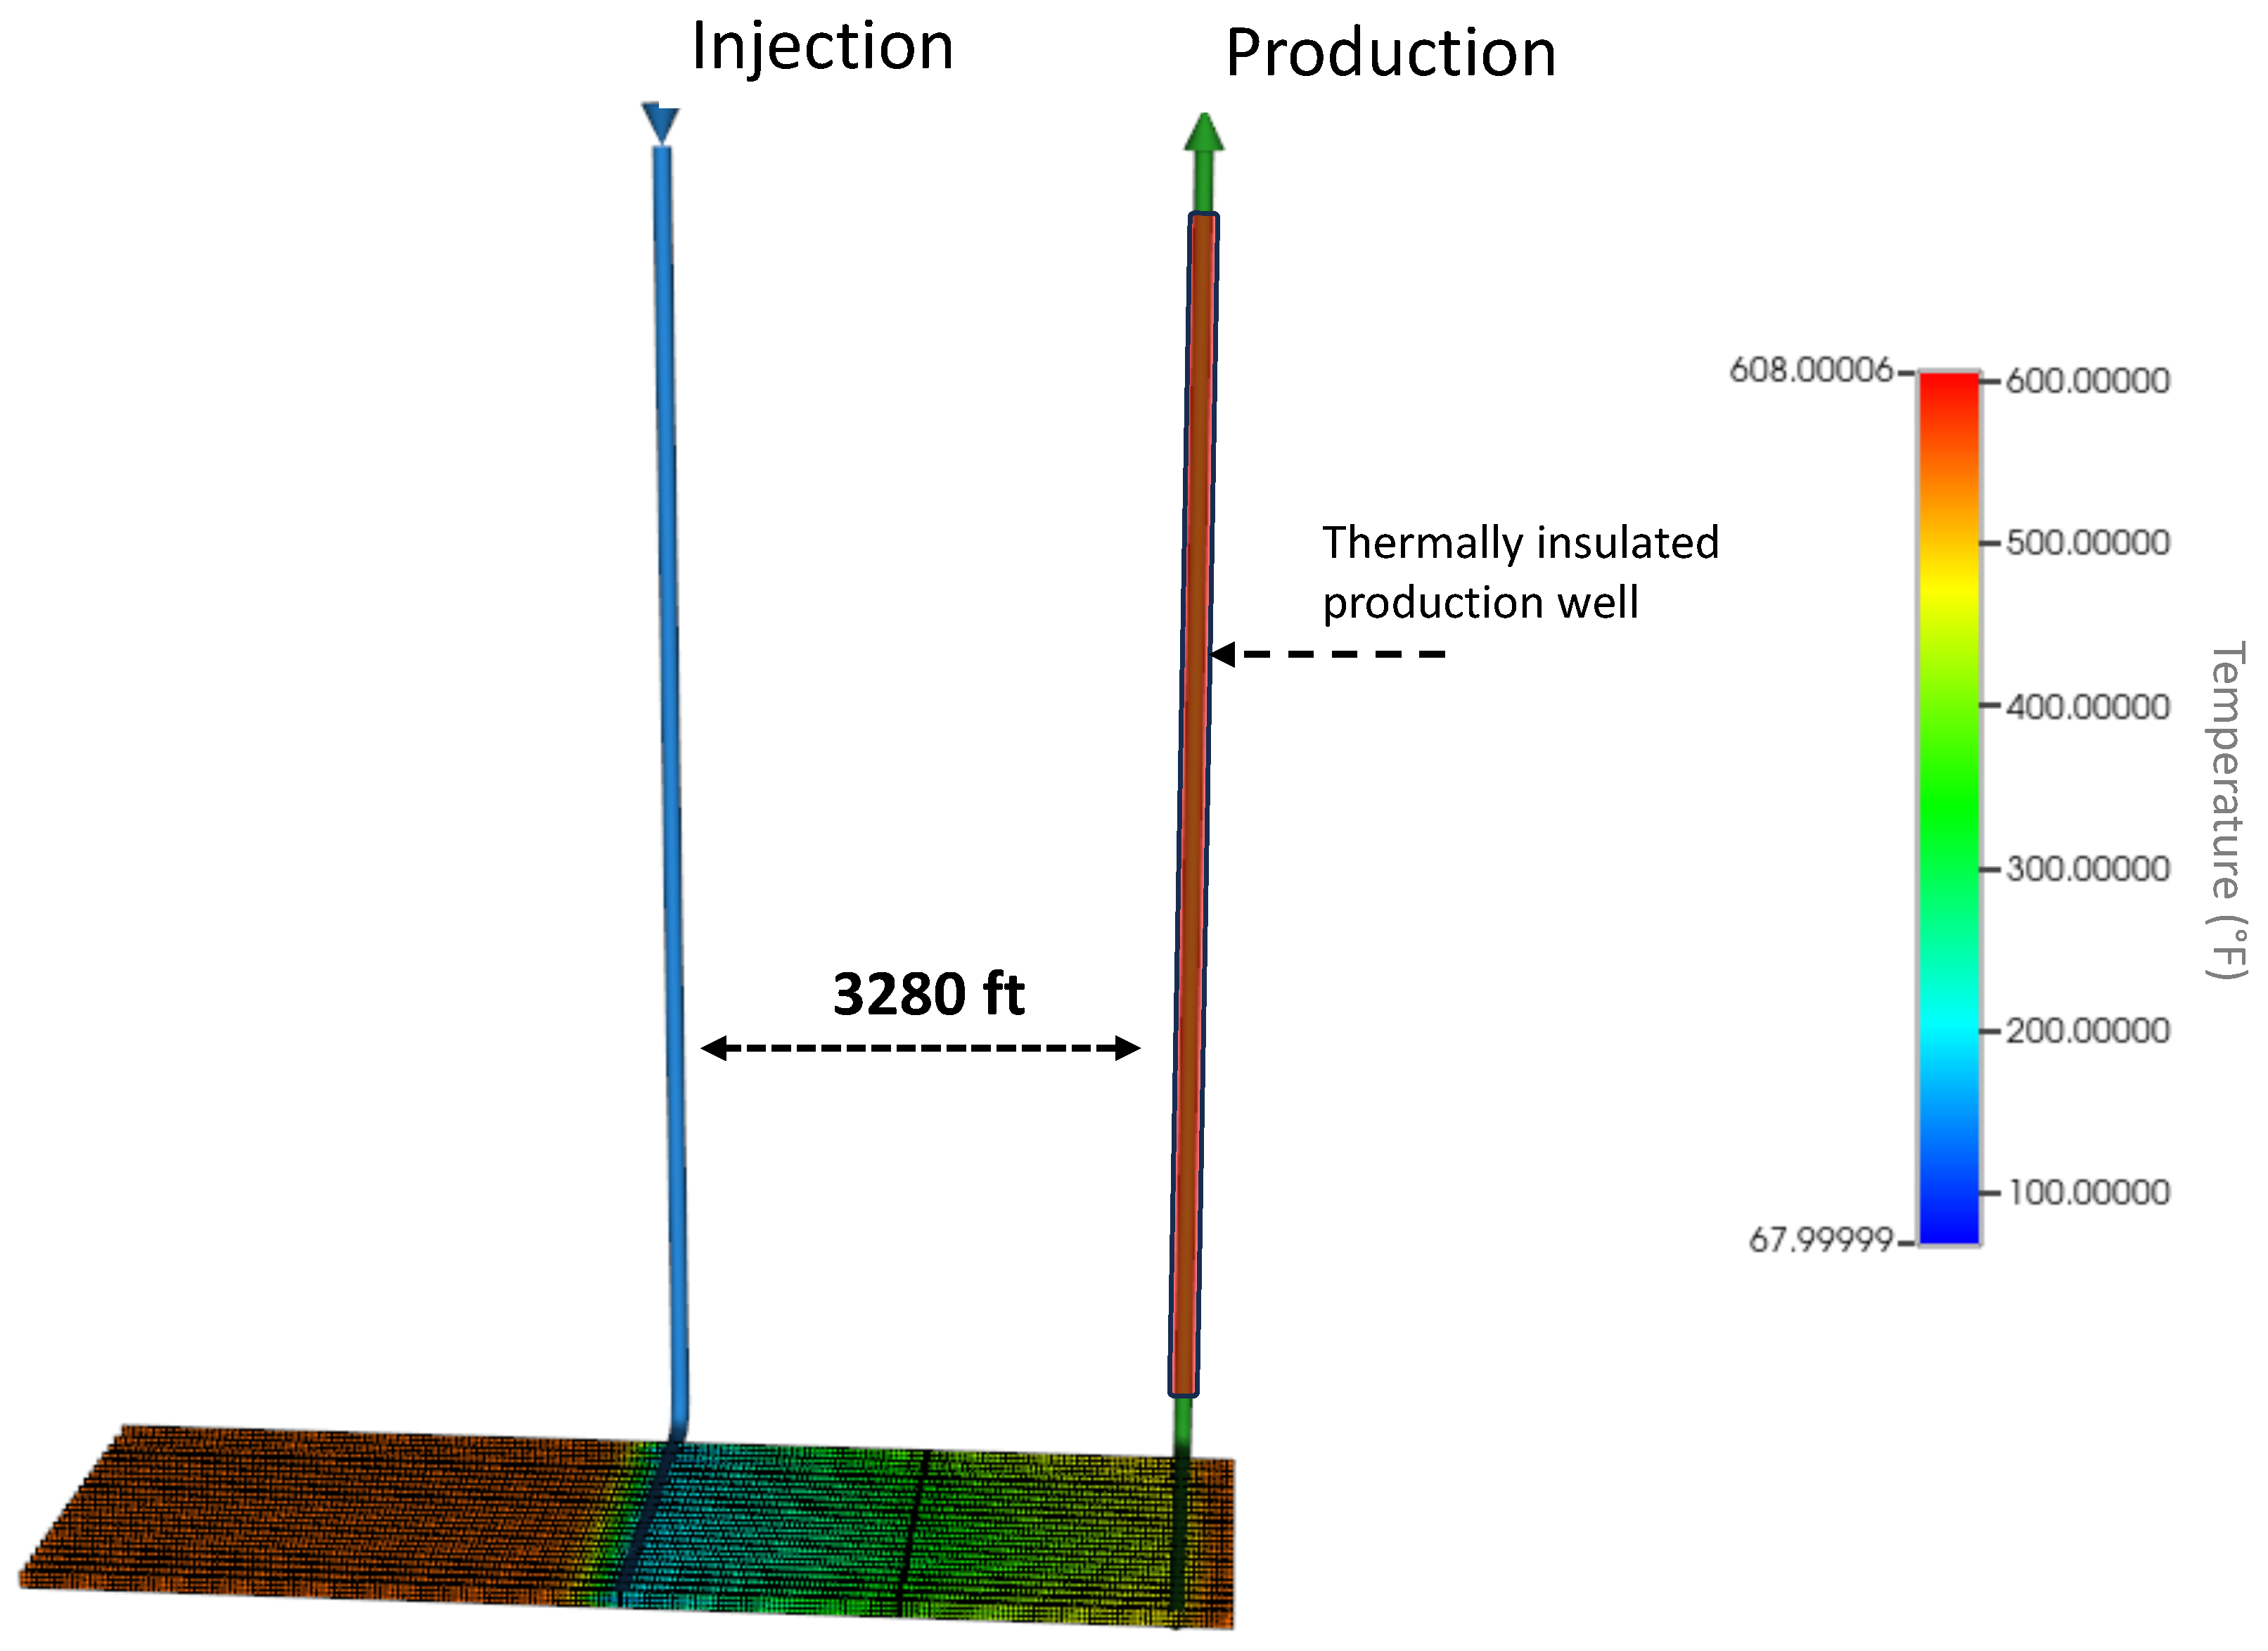
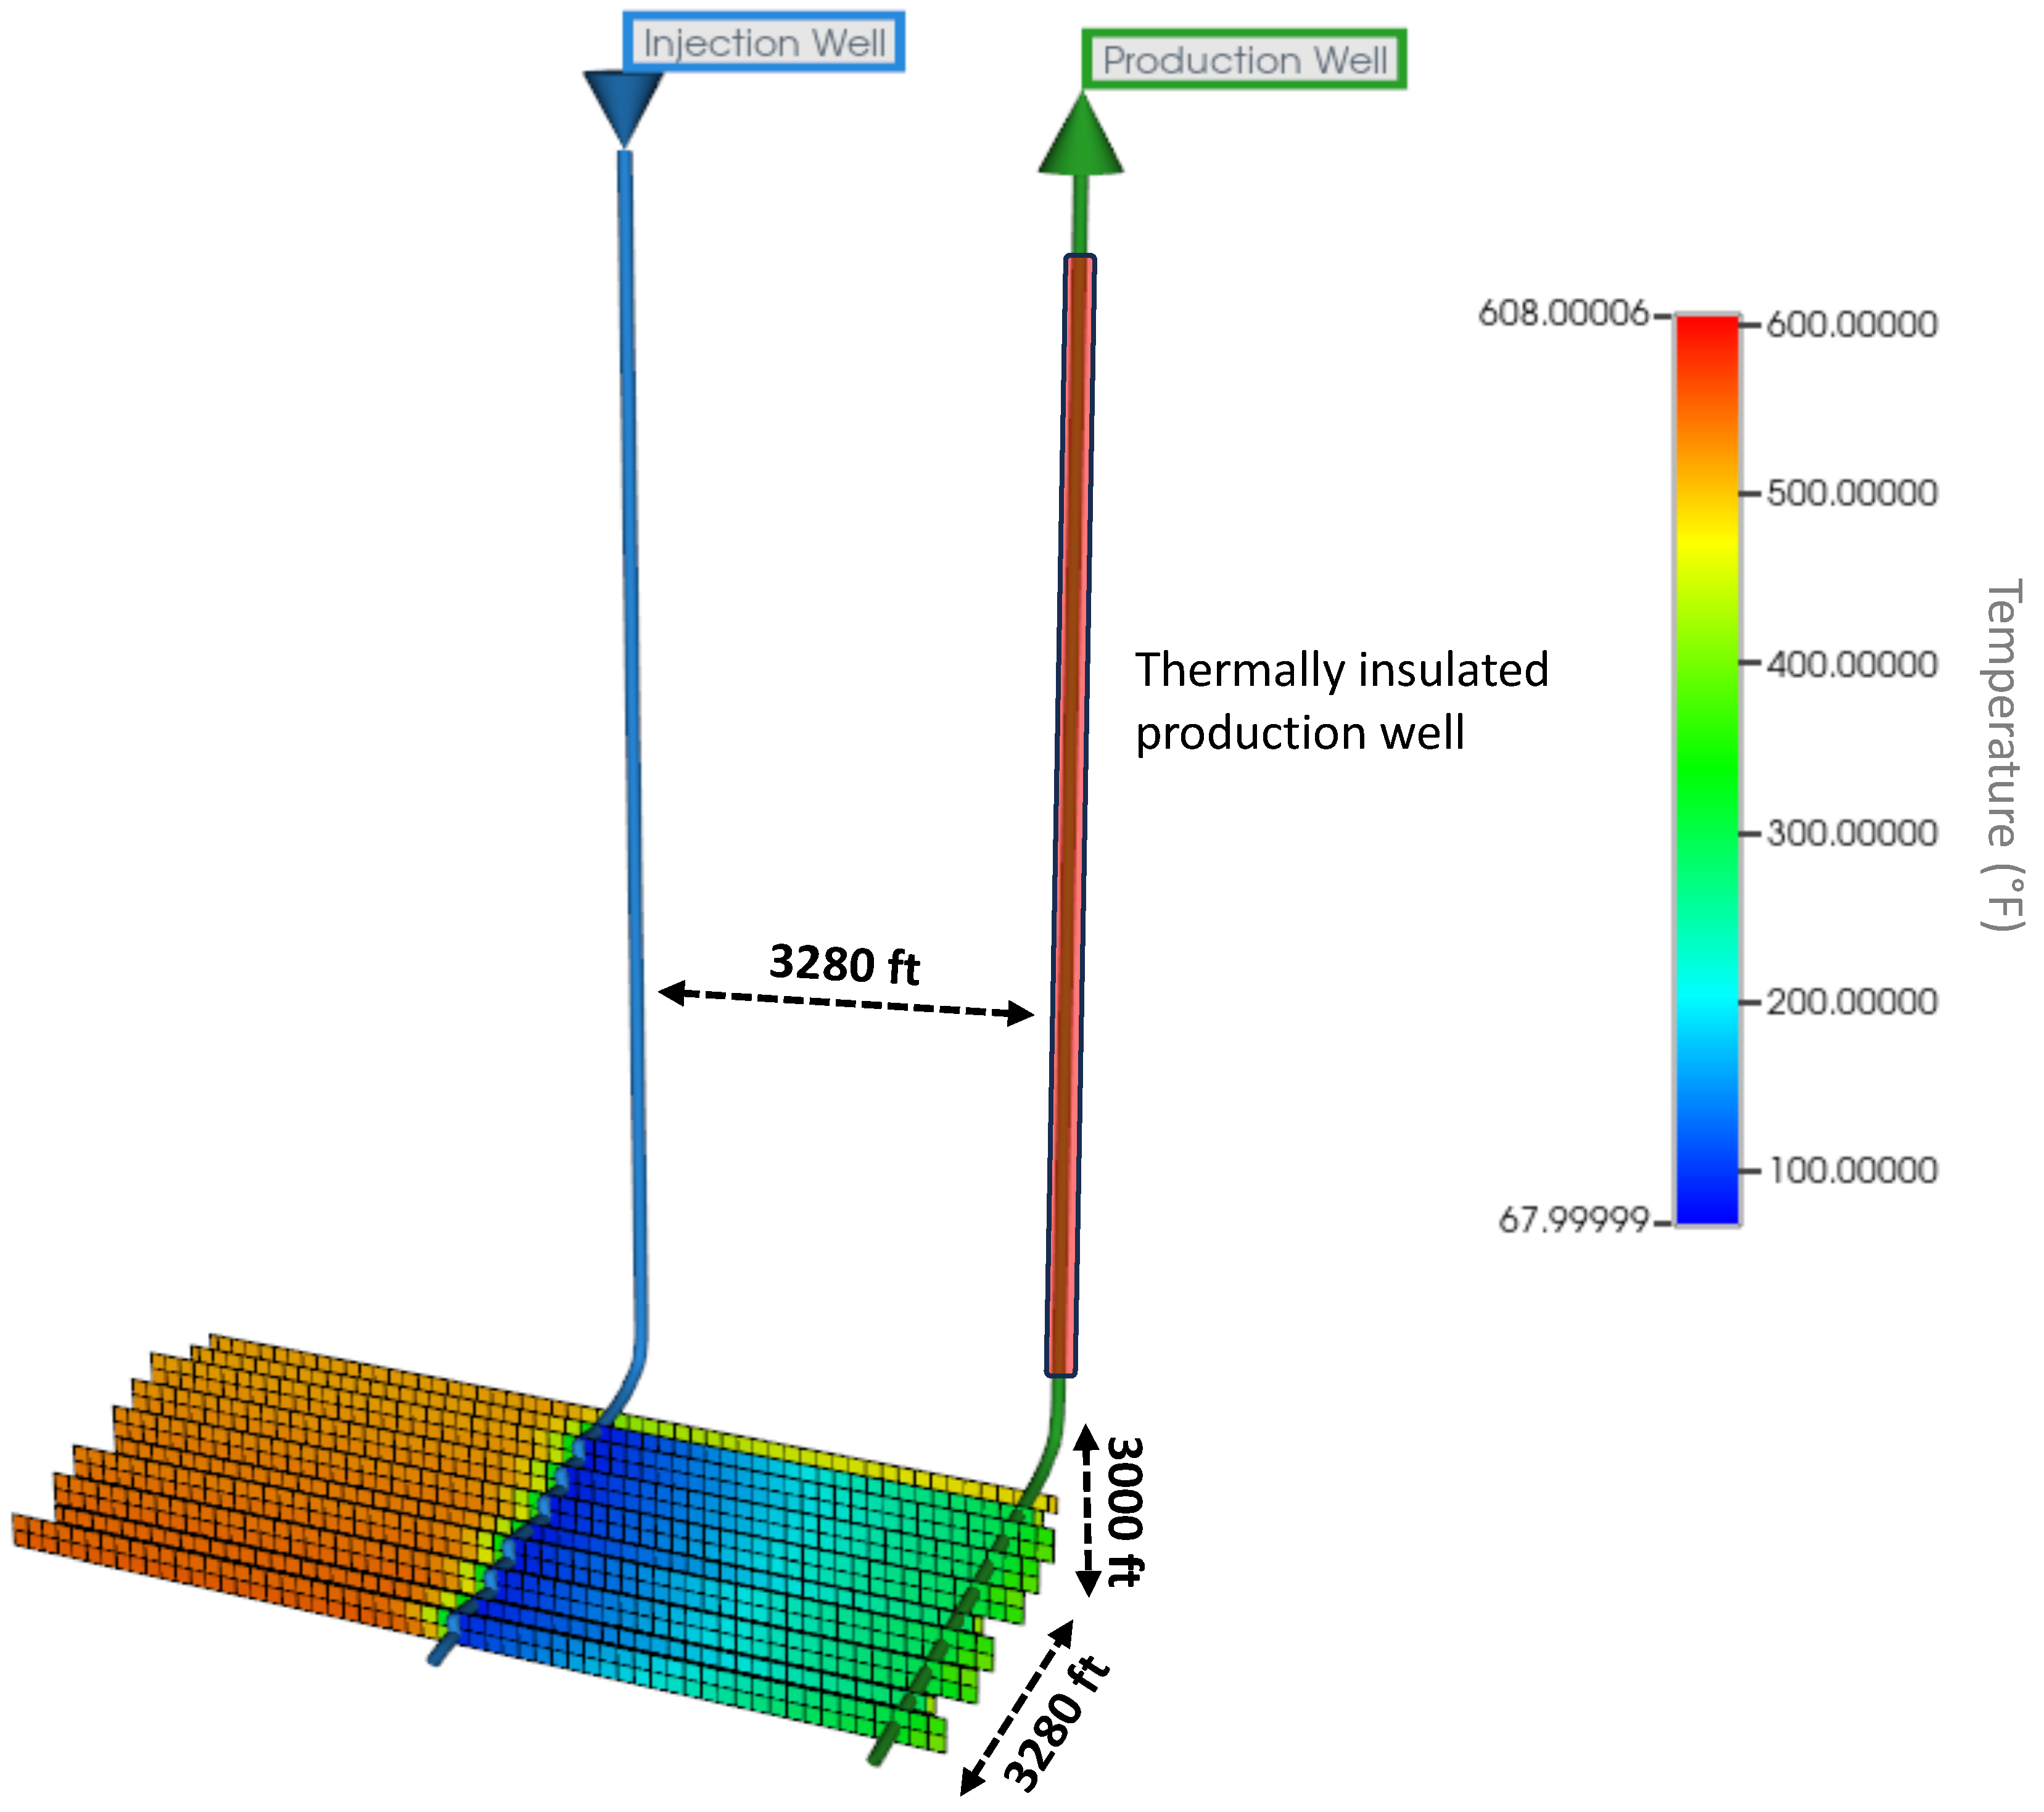
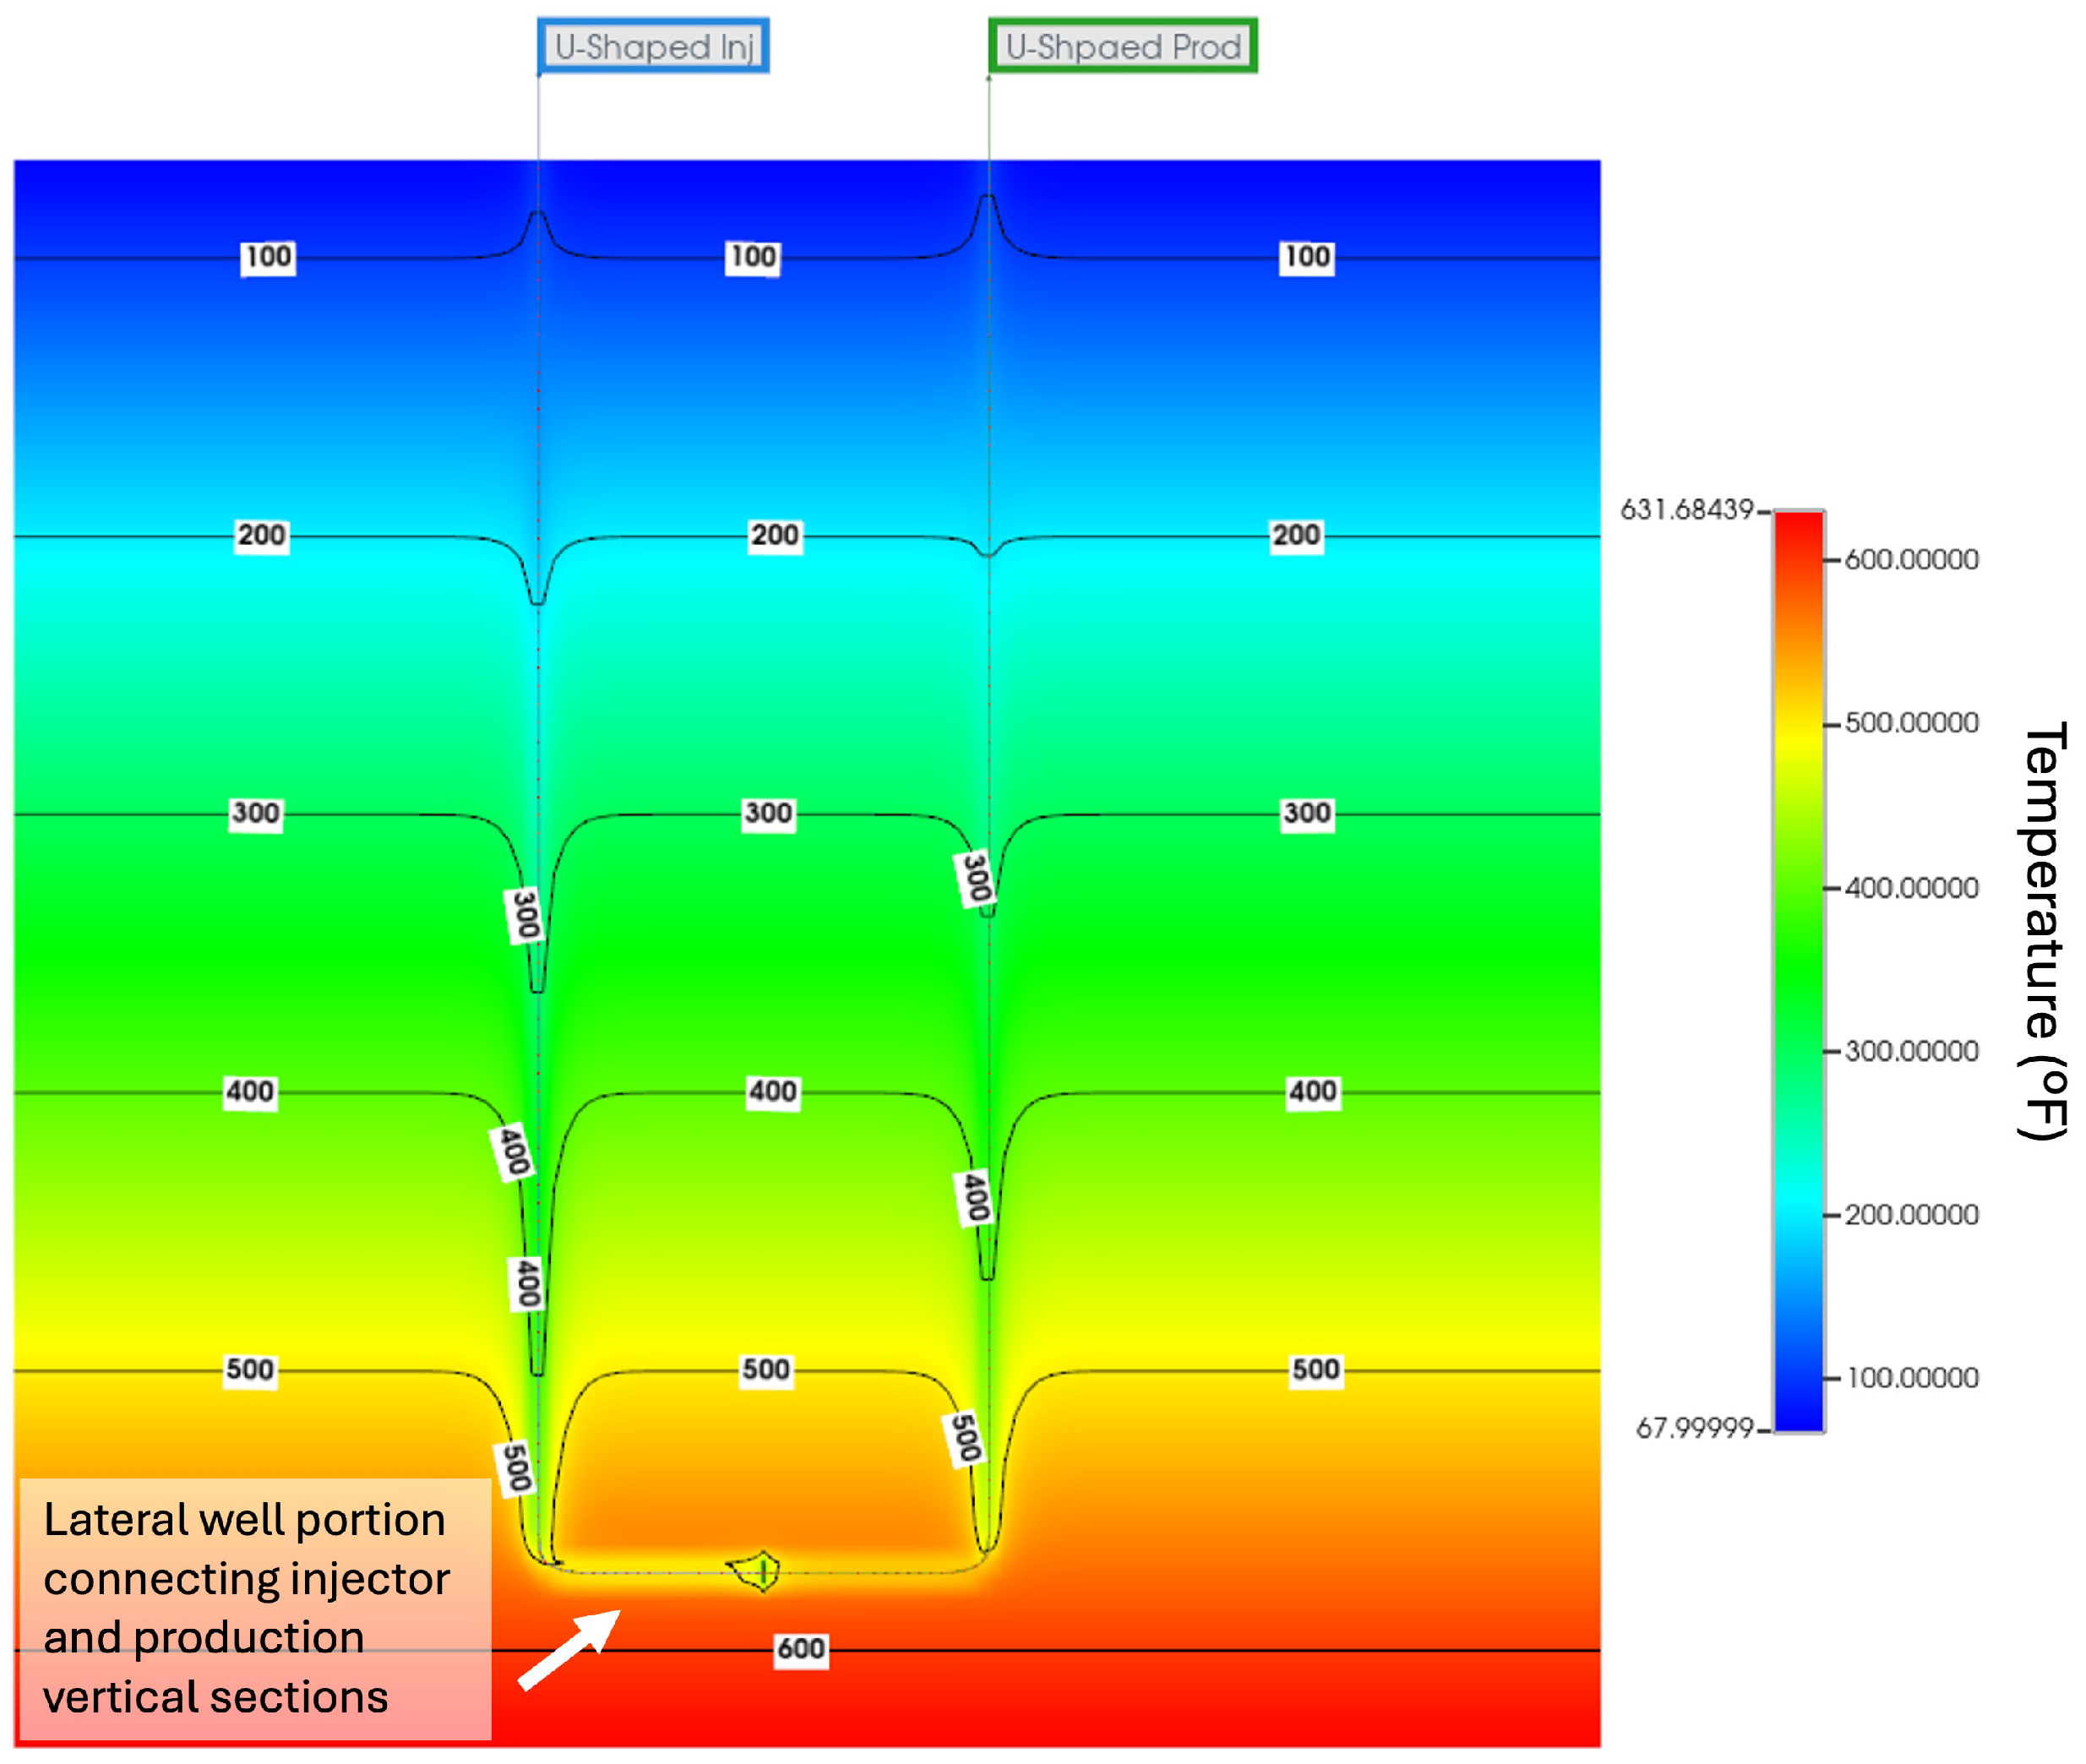
2.2.1. U-Shaped Closed-Loop Geothermal System (CLGS) Model Description
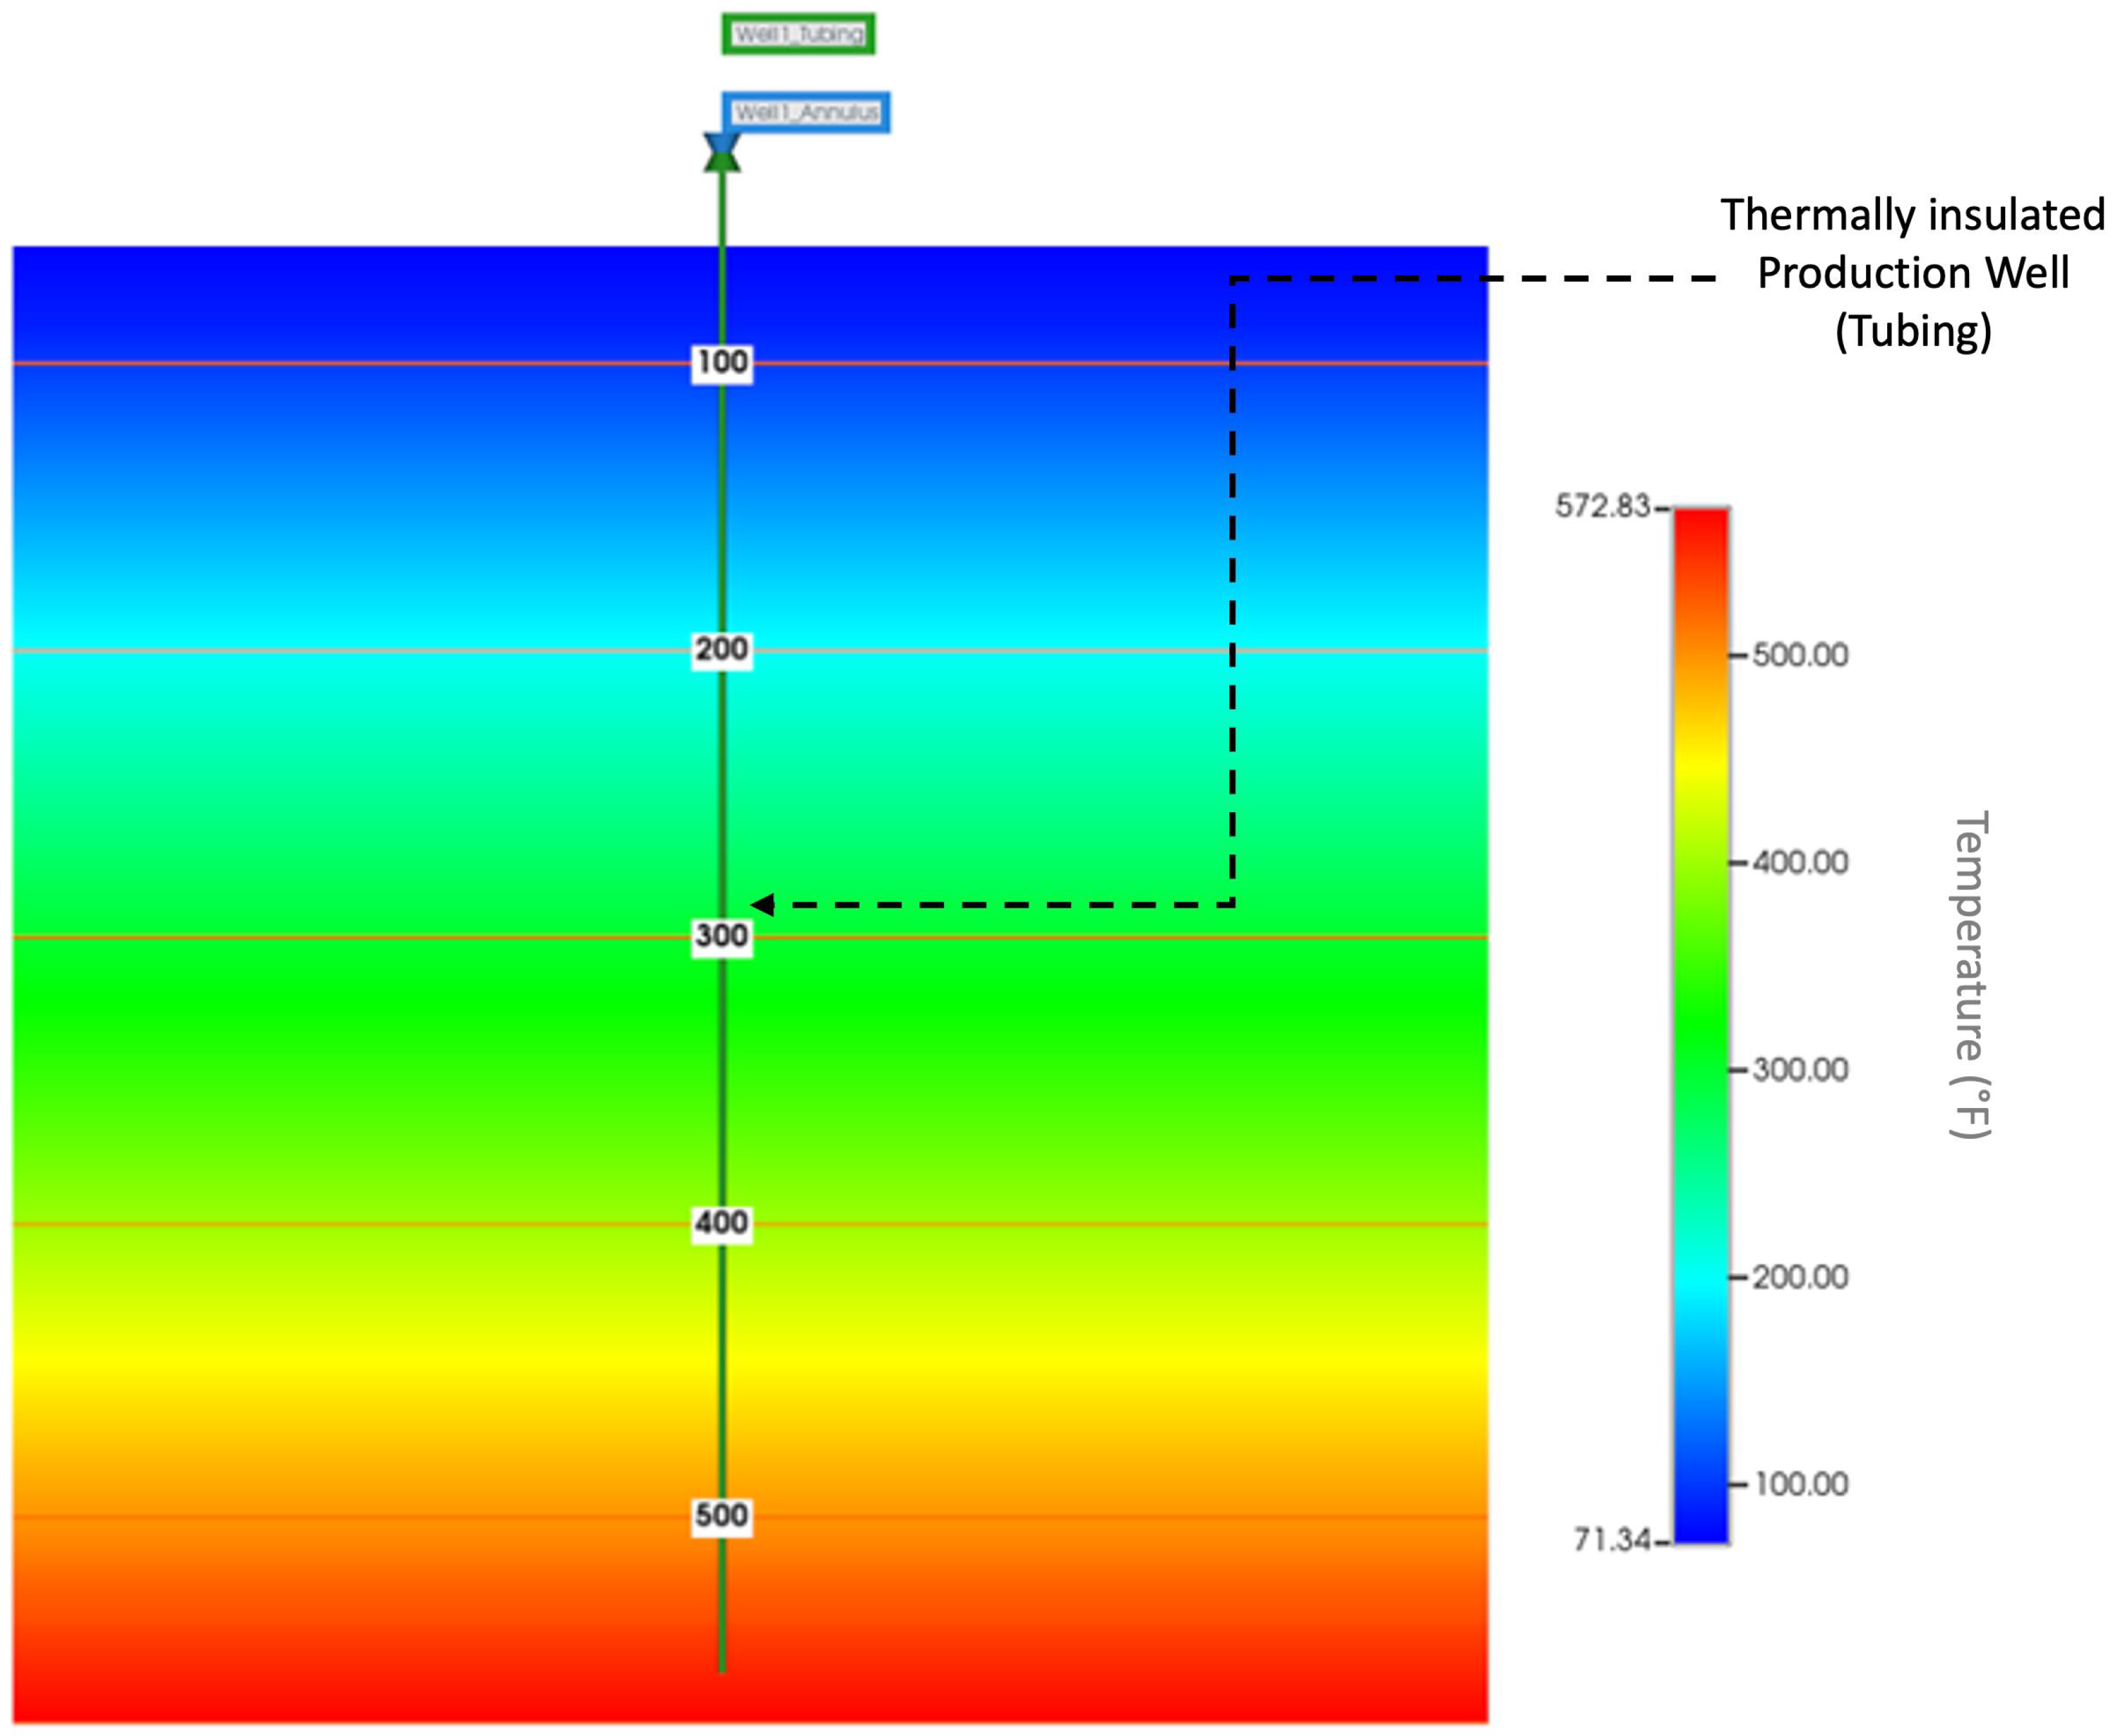
2.2.2. Pipe-In-Pipe (PIP) Closed-Loop System Model Description
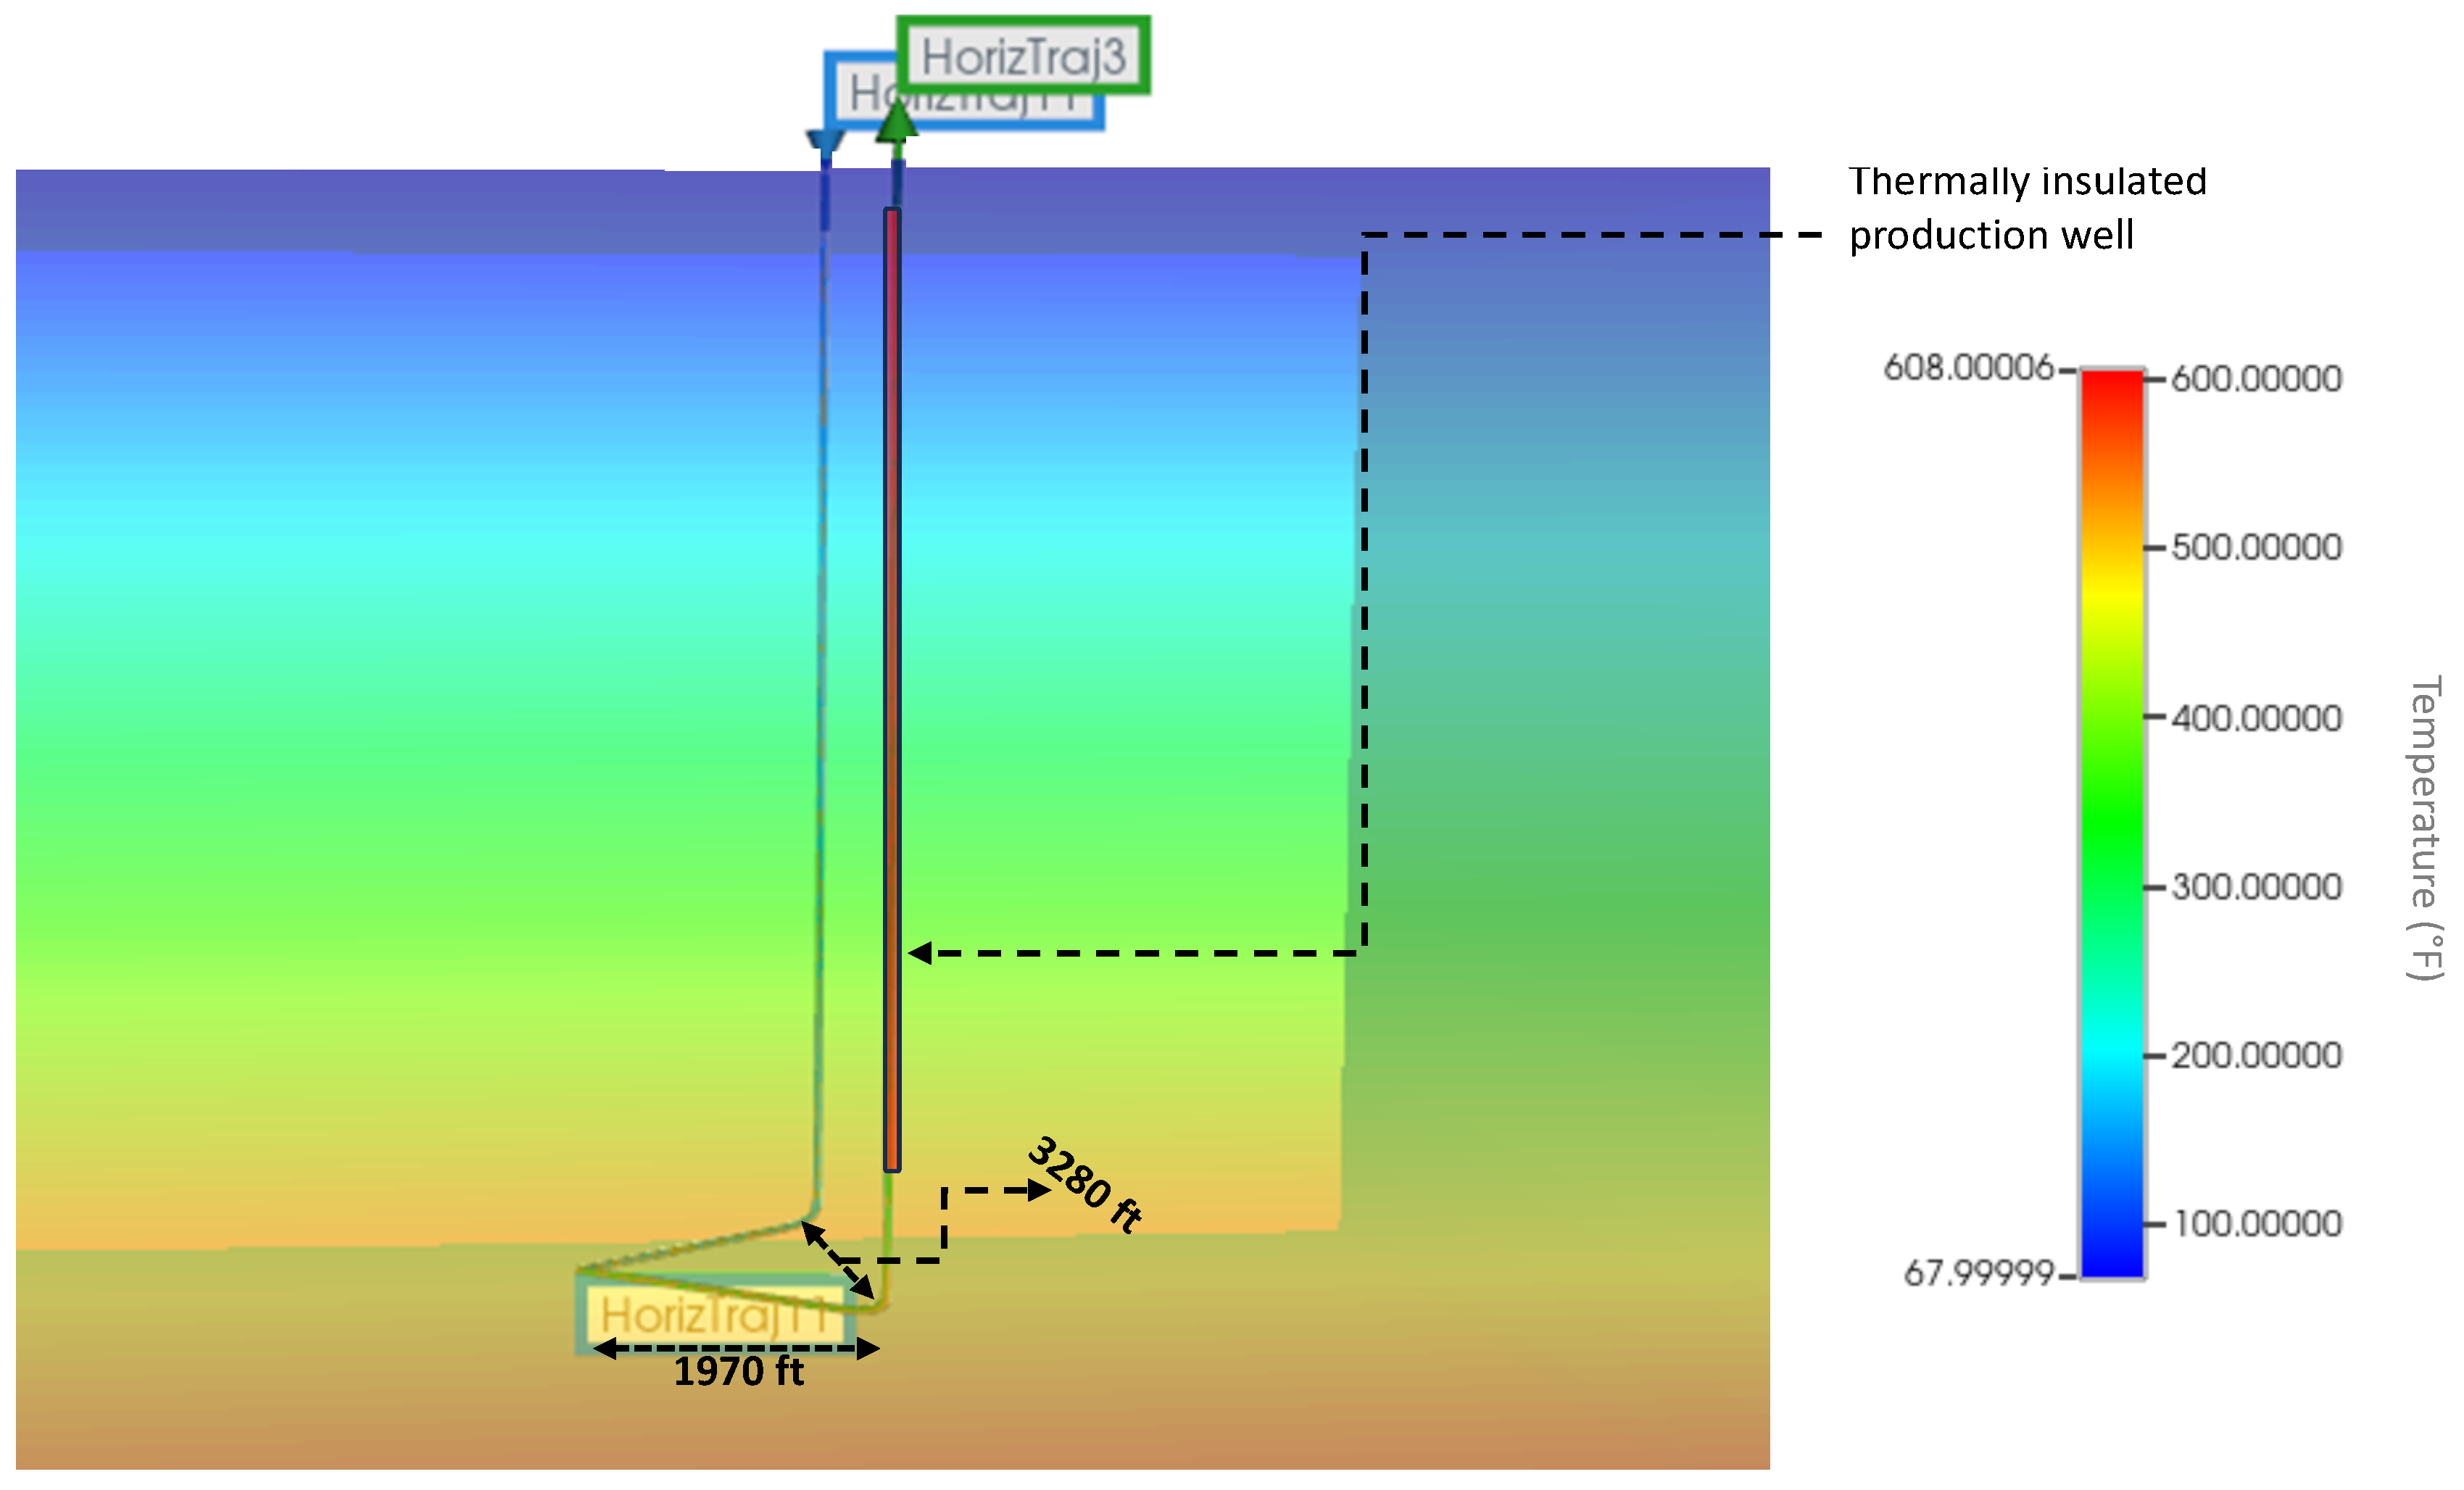
2.2.3. V-Shaped Closed-Loop System Model Description
2.2.4. Inclined V-Shaped Closed-Loop System Model Description
2.2.5. Enhanced Geothermal System (EGS) Model Description
2.2.6. Inclined Enhanced Geothermal System (EGS) Model Description
3. Results
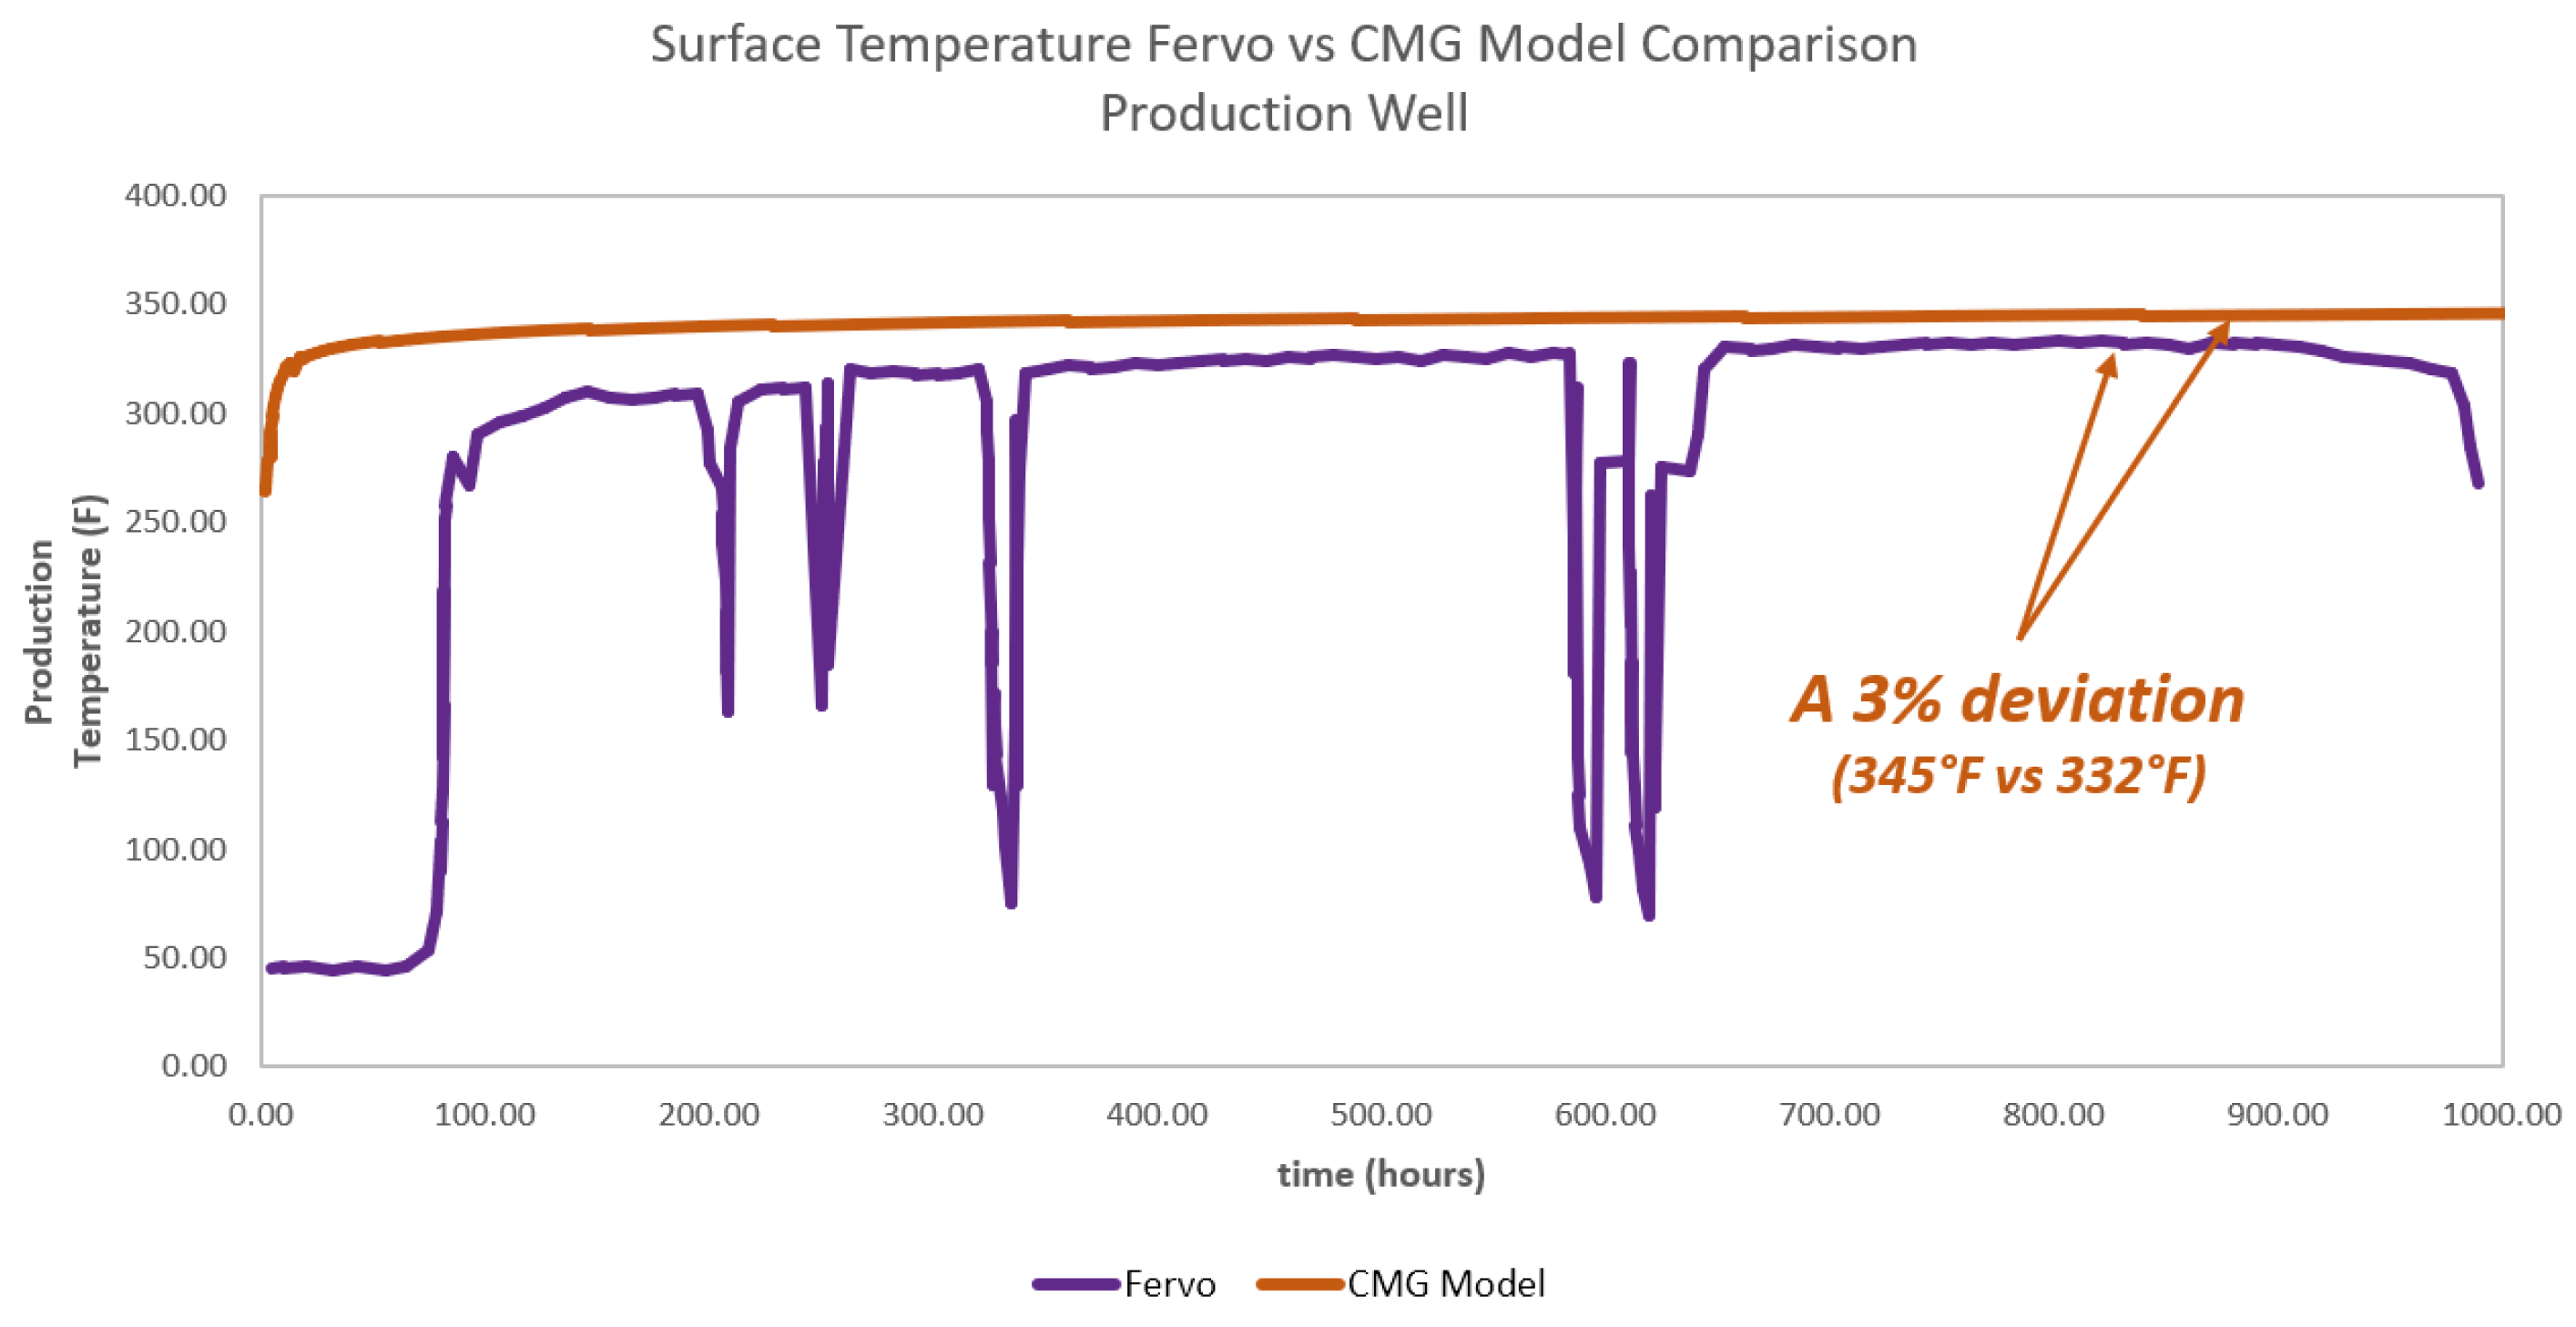
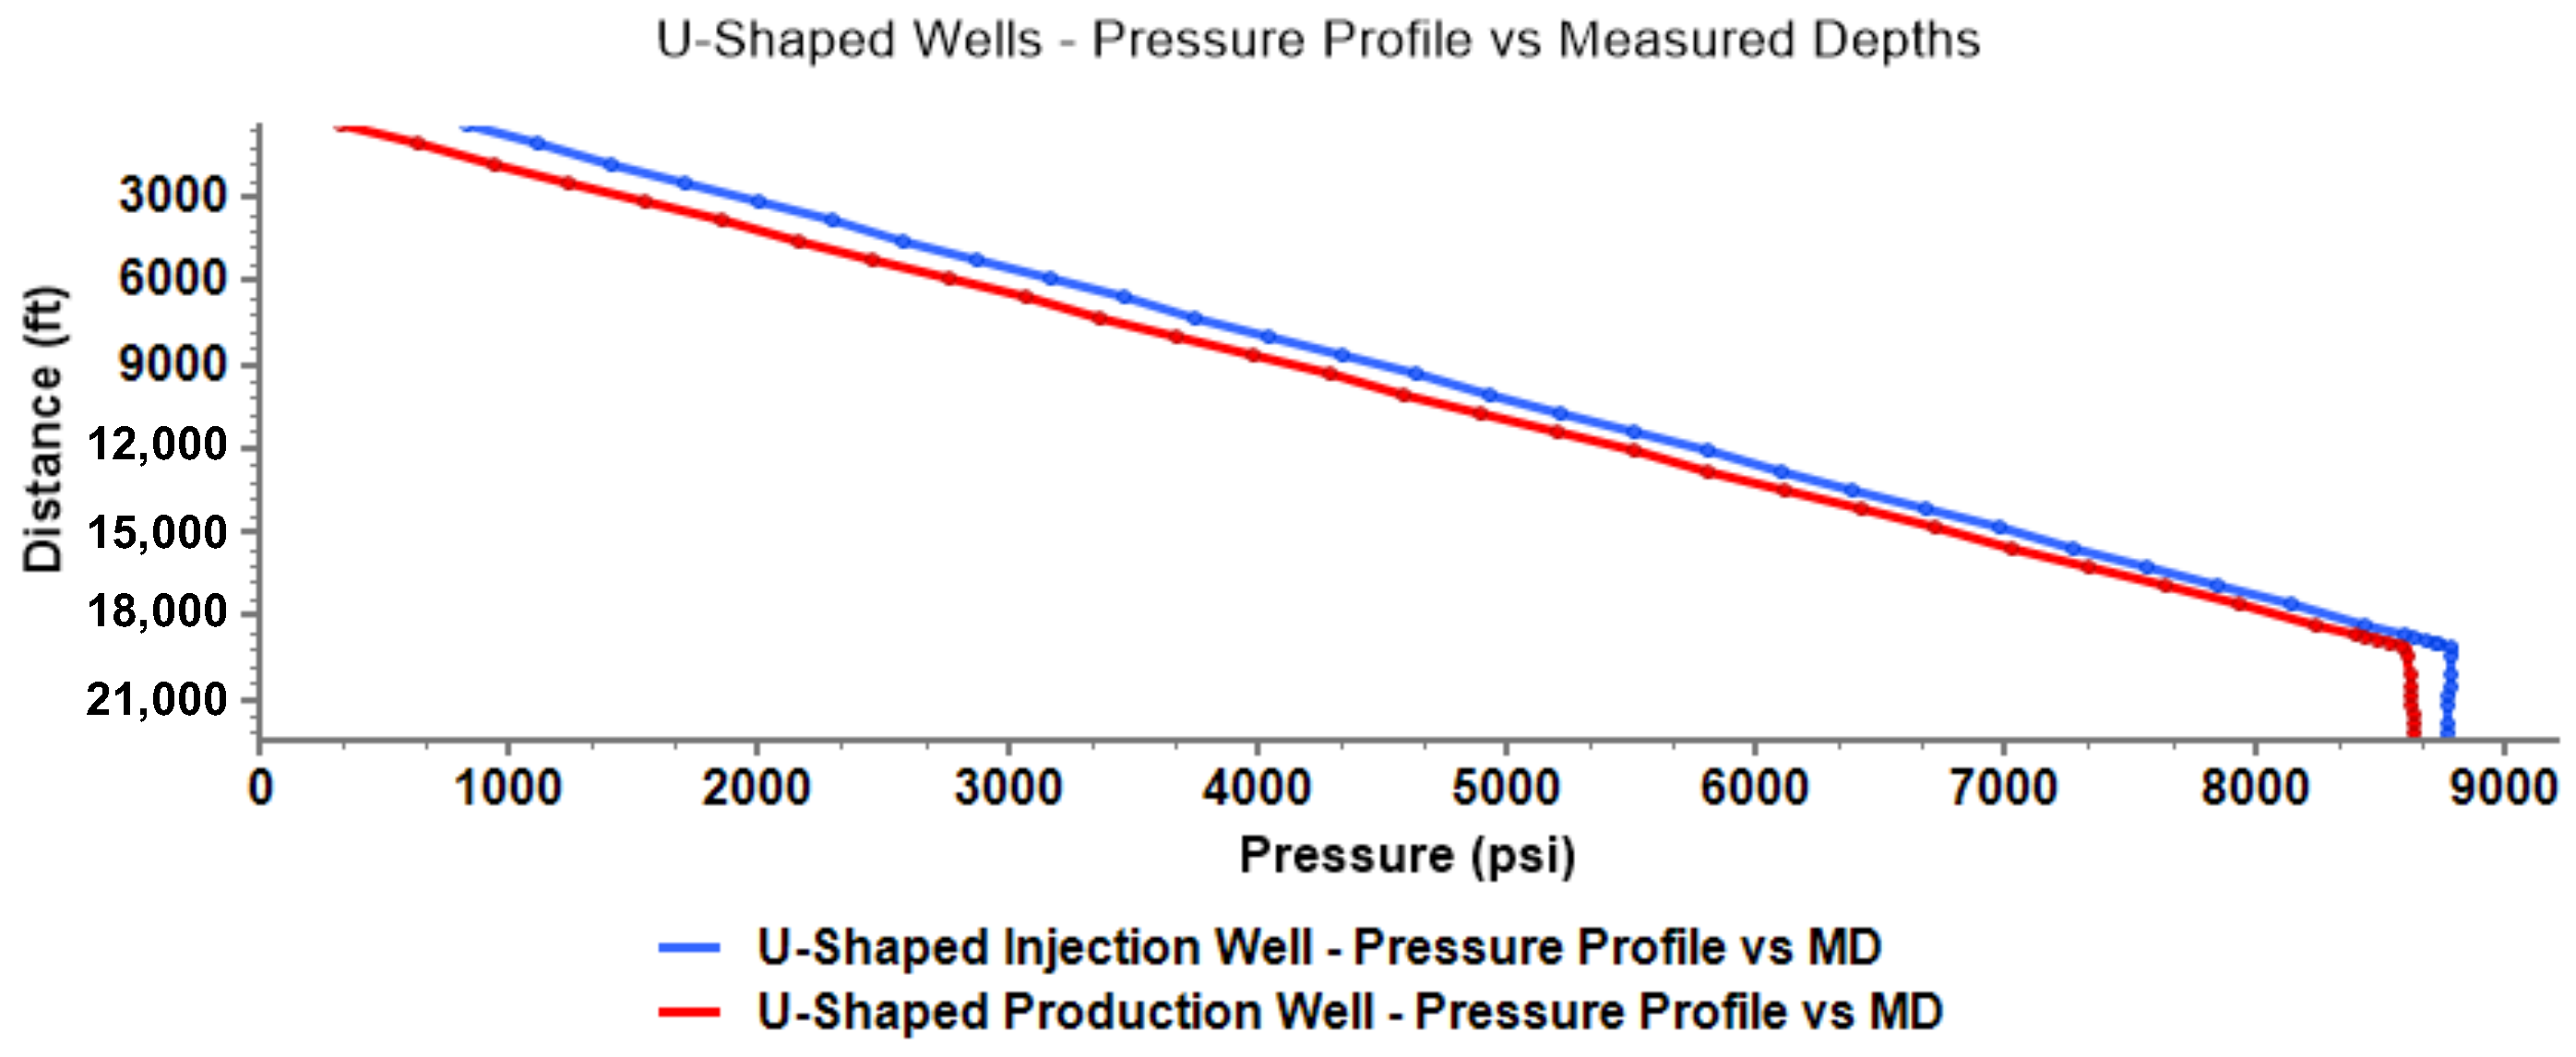
3.1. Long-Term Performance Analysis of U-Shaped CLGS Well Model
3.2. Long-Term Performance Analysis of the Fractured U-Shaped CLGS Model
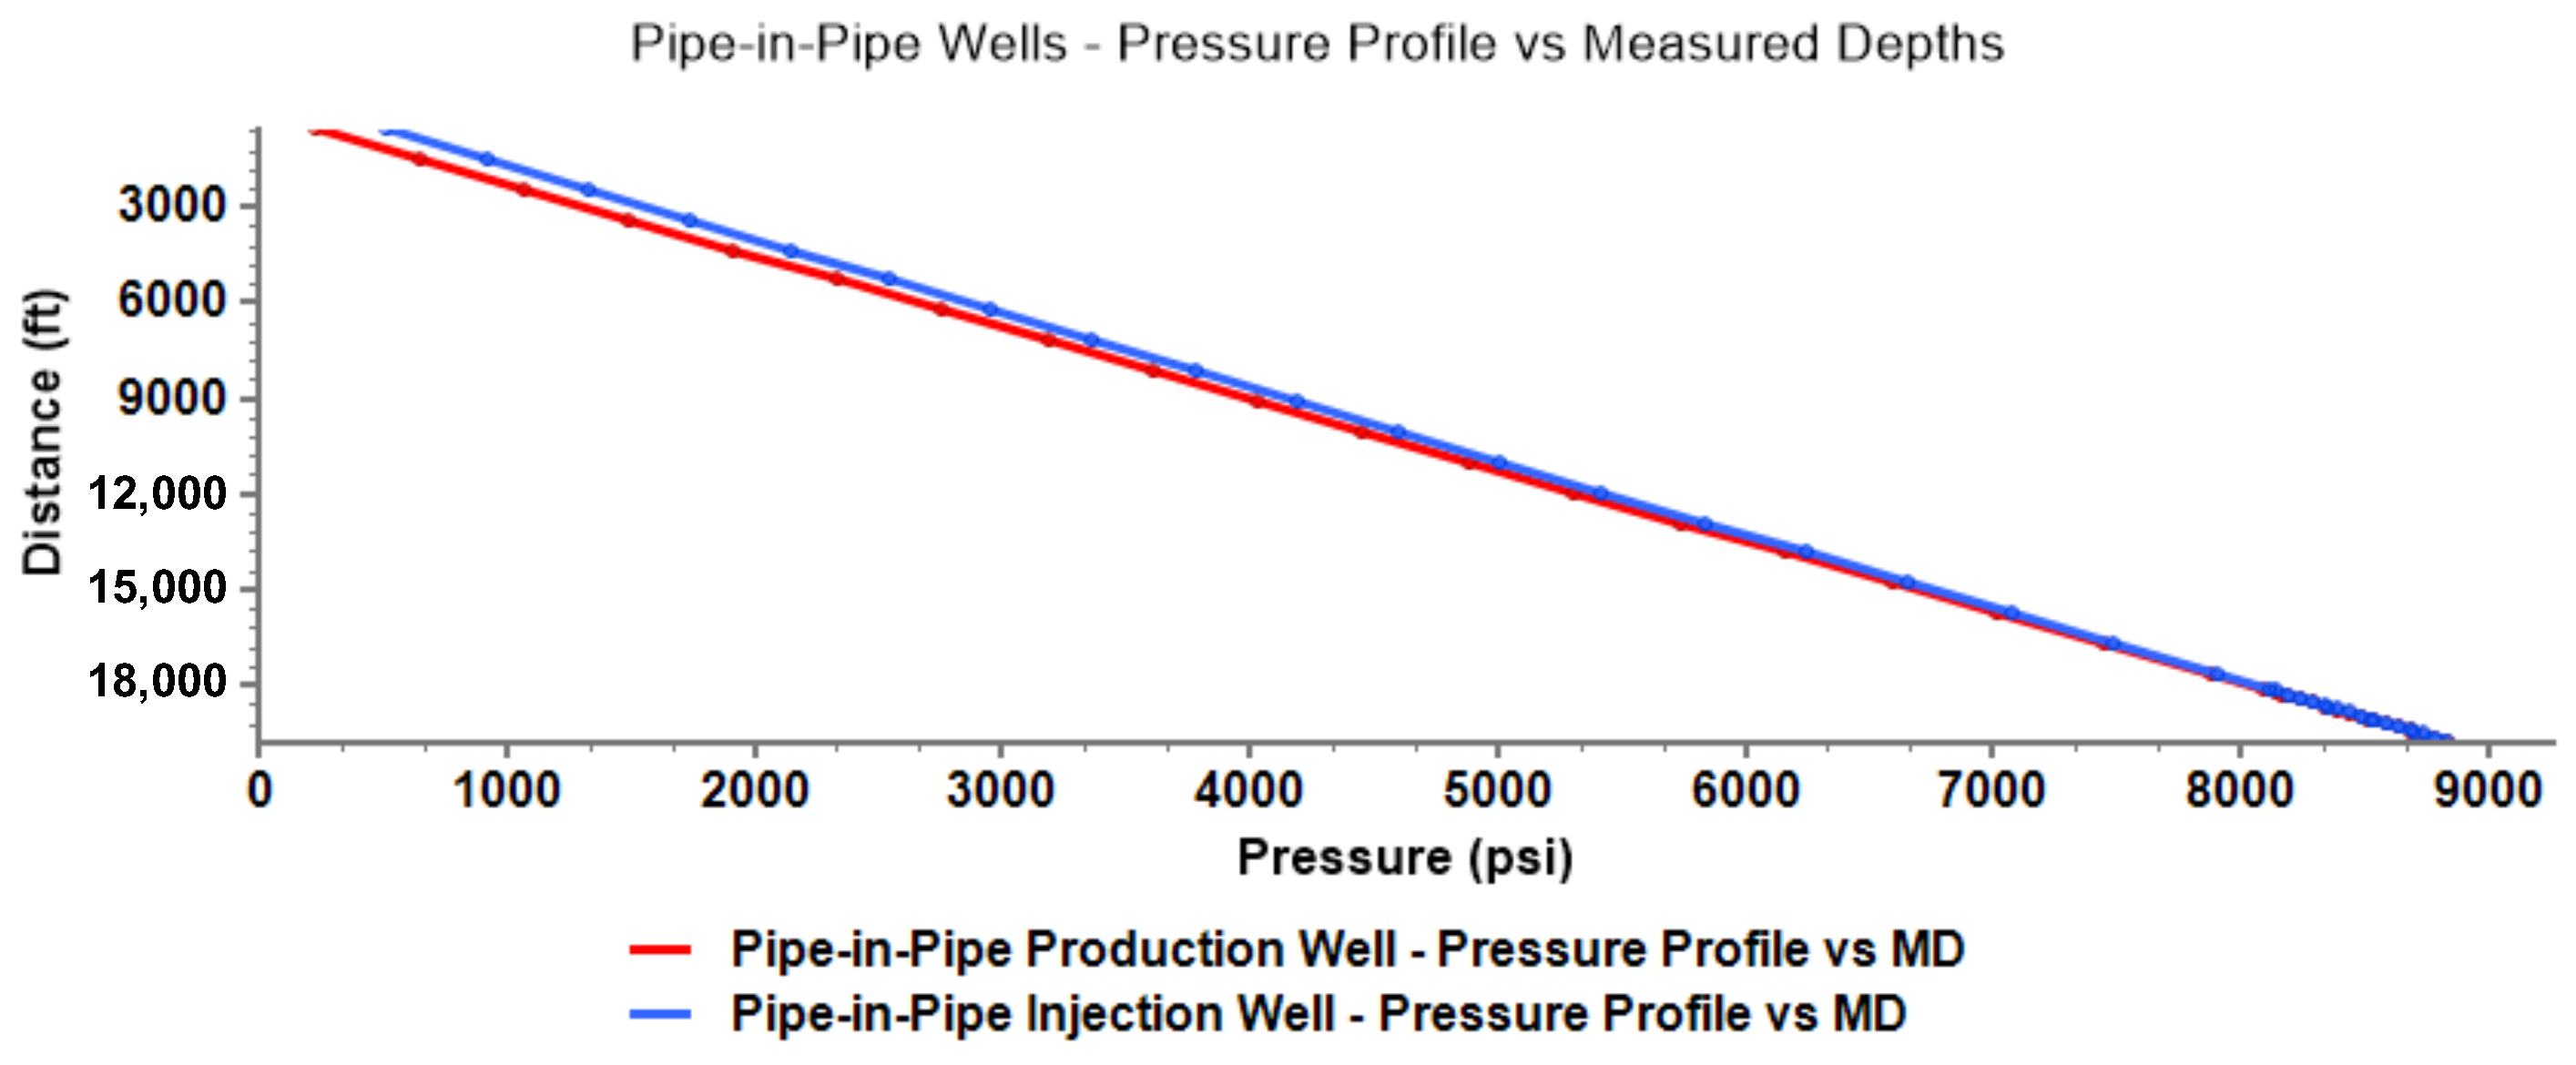
3.3. Long-Term Performance Analysis of Pipe-In-Pipe (PIP) Geothermal Well Models
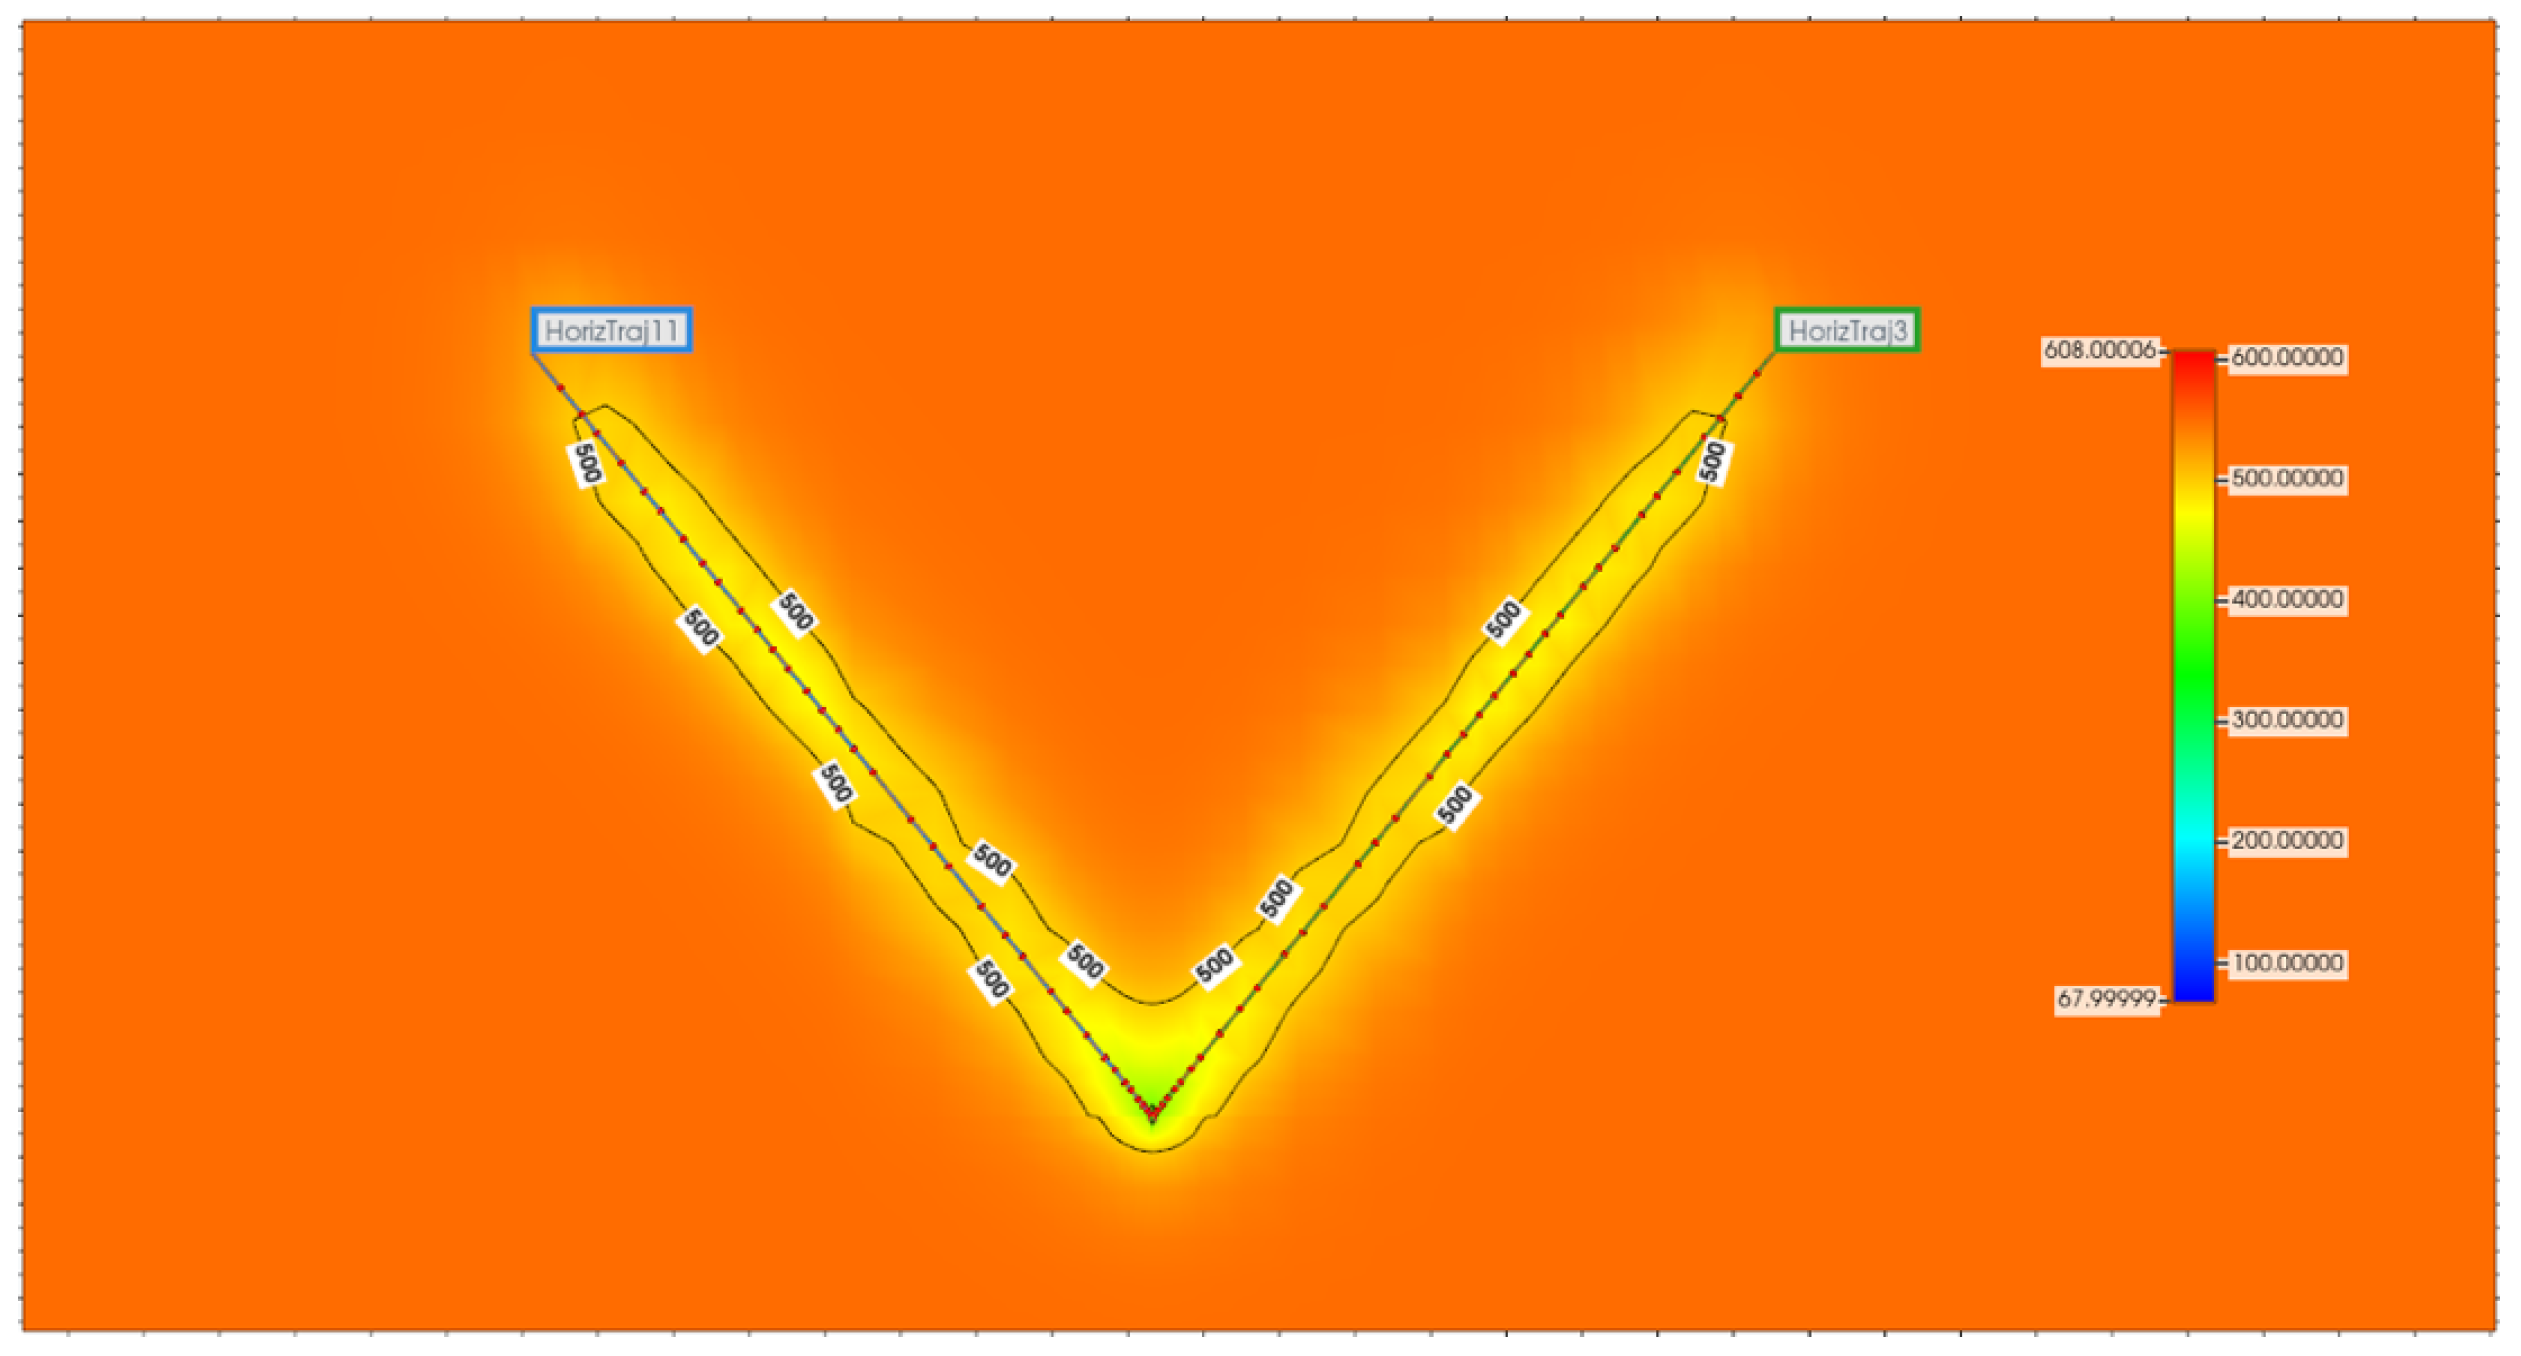
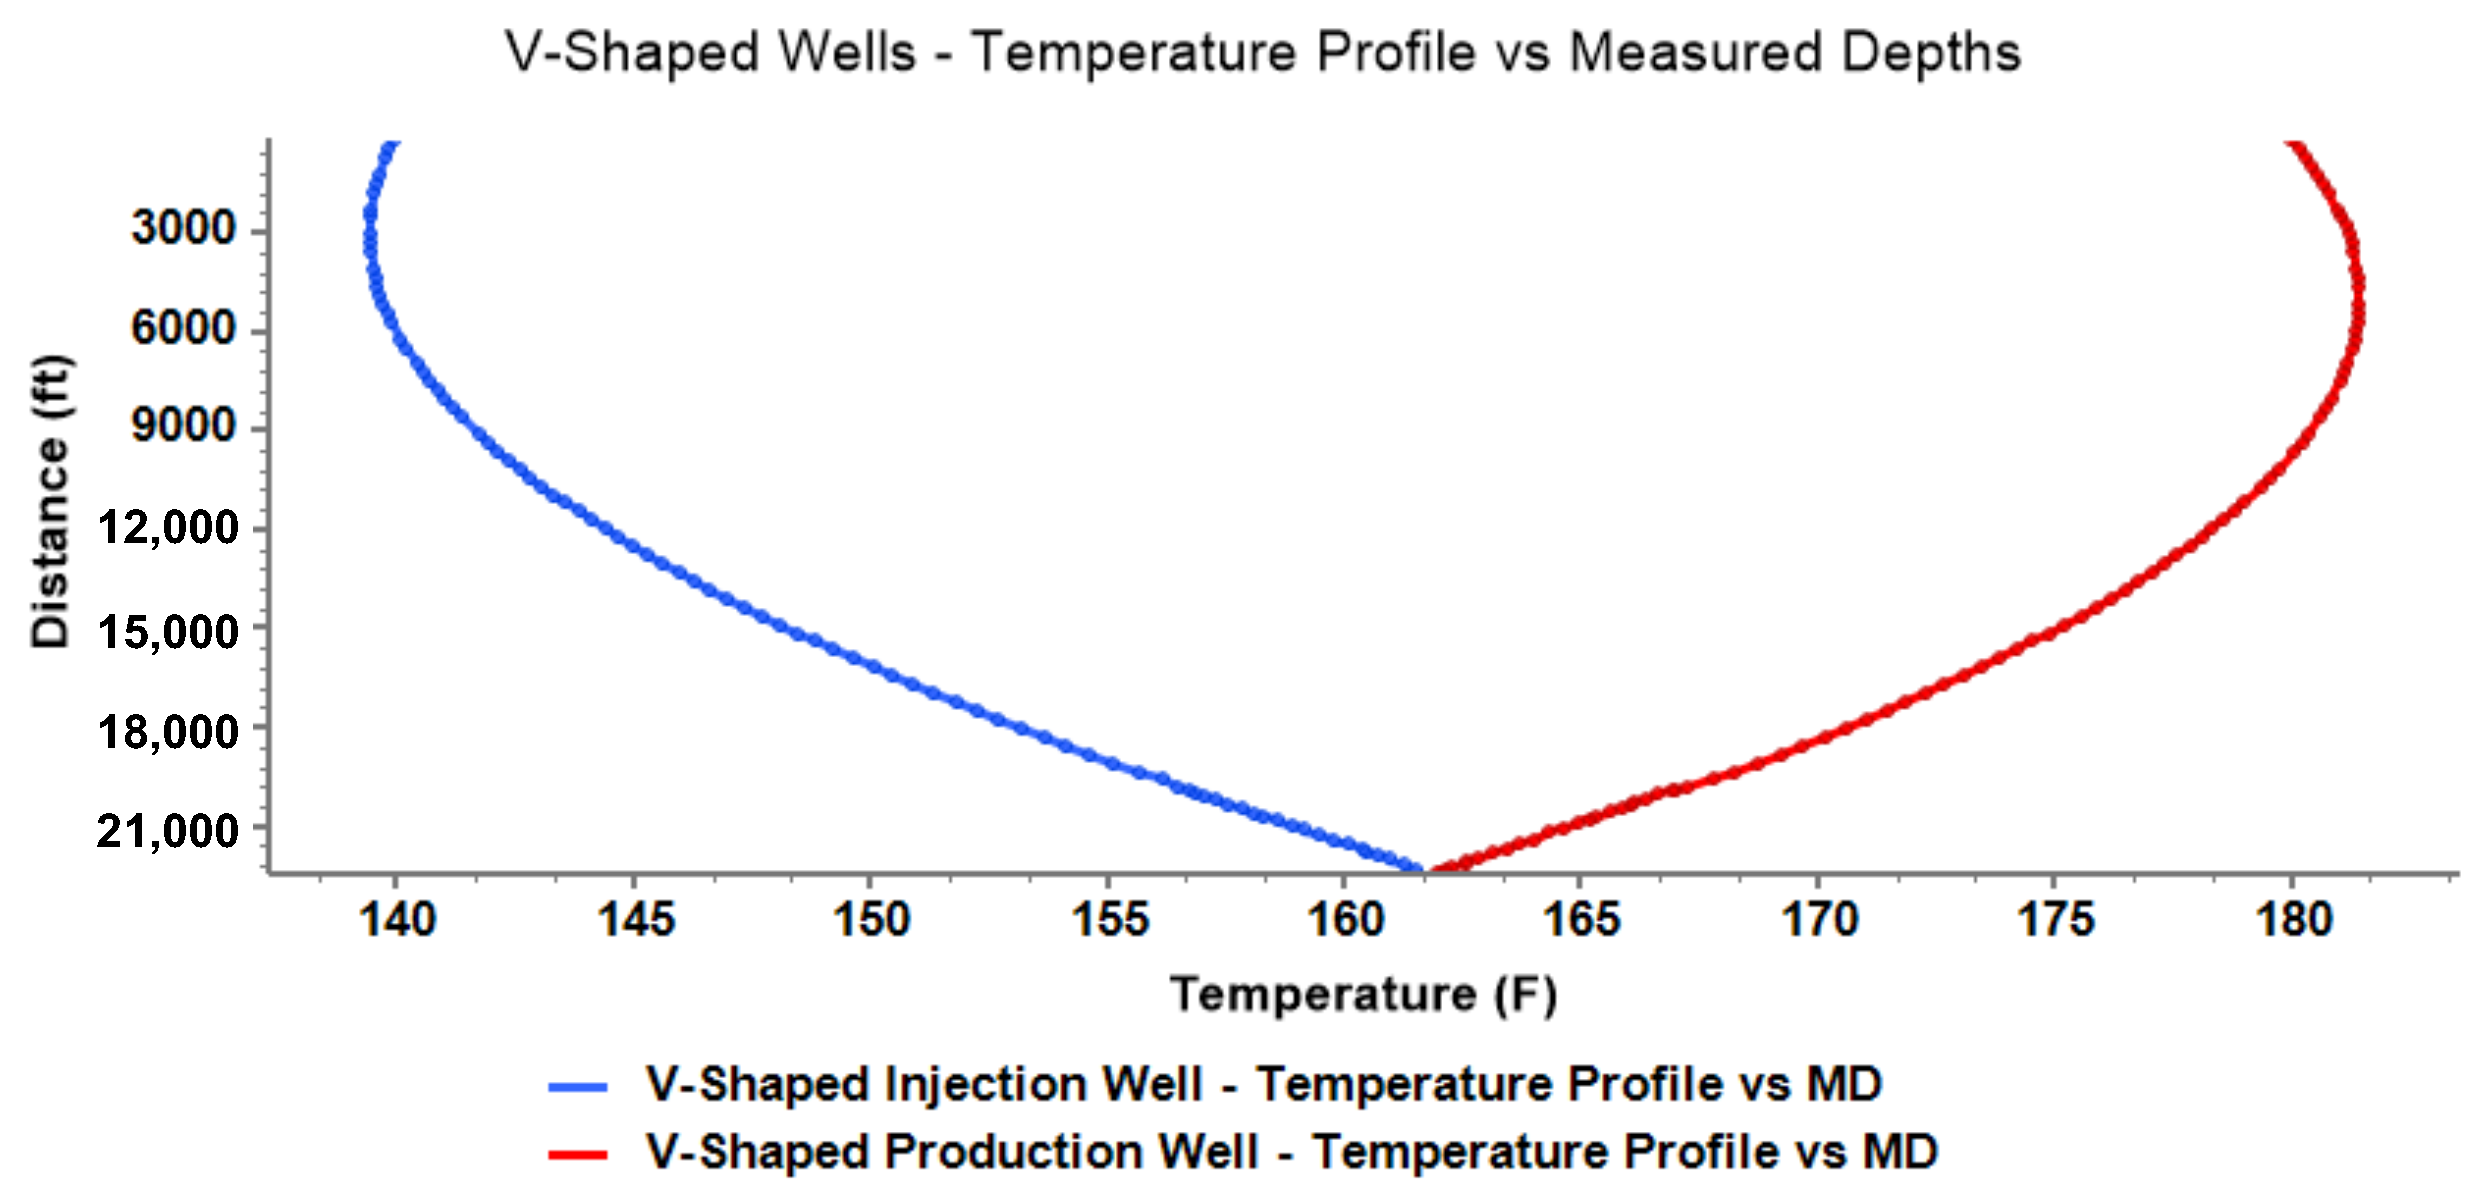
3.4. Long-Term Performance Analysis of V-Shaped Closed-Loop Model
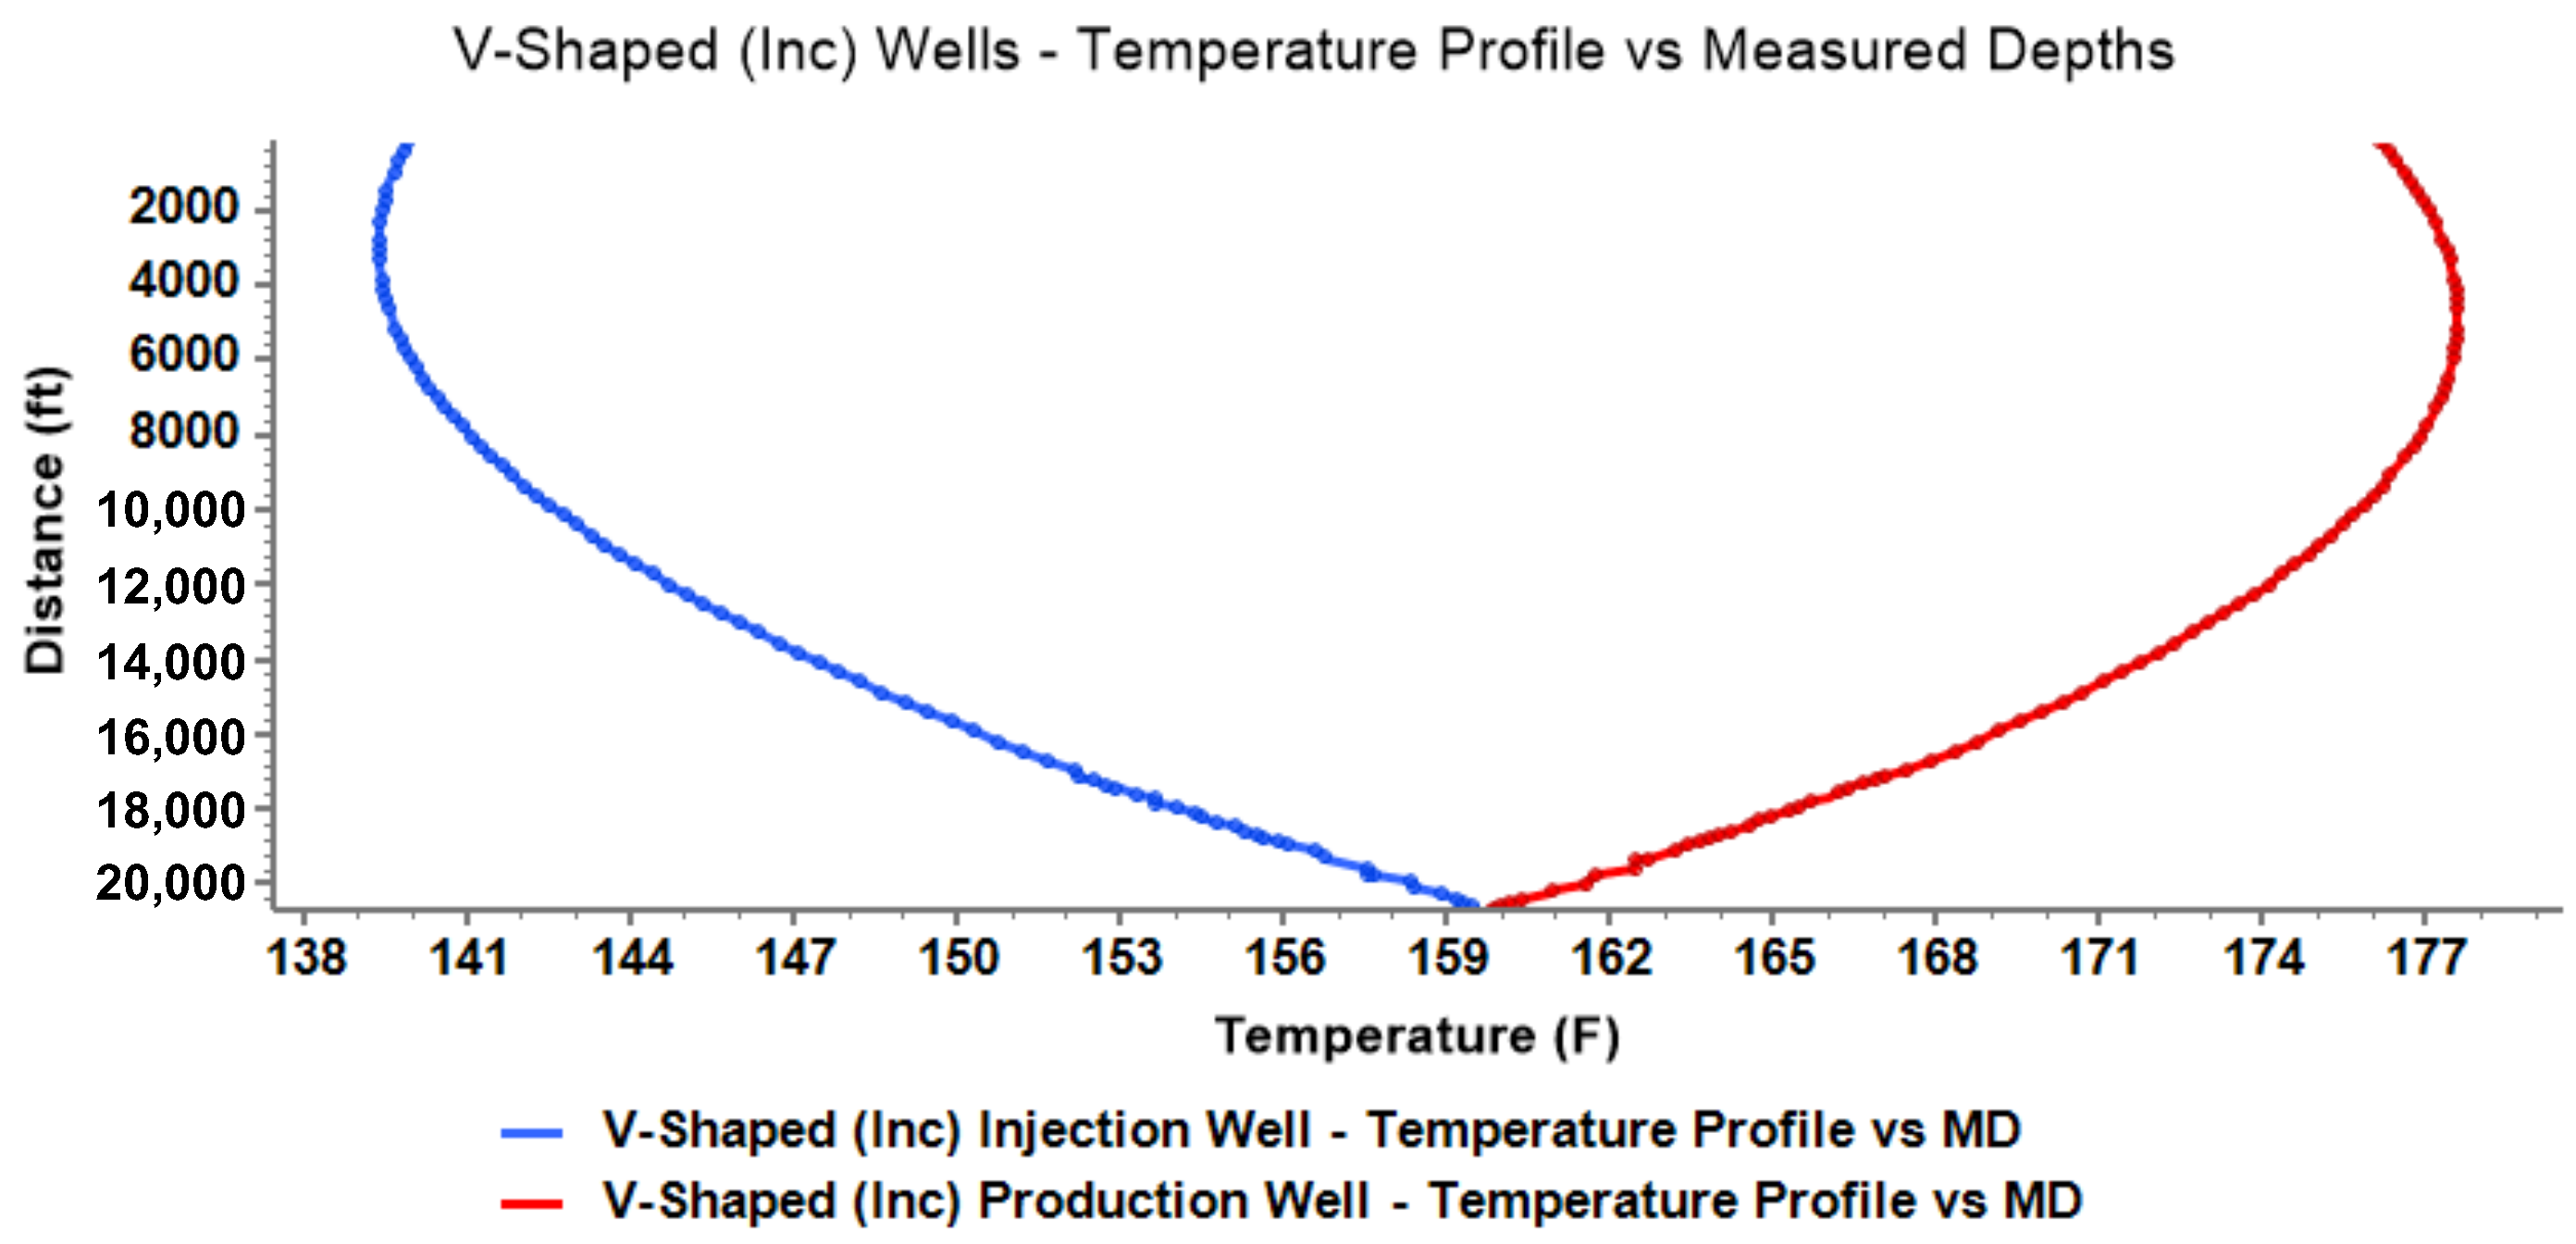
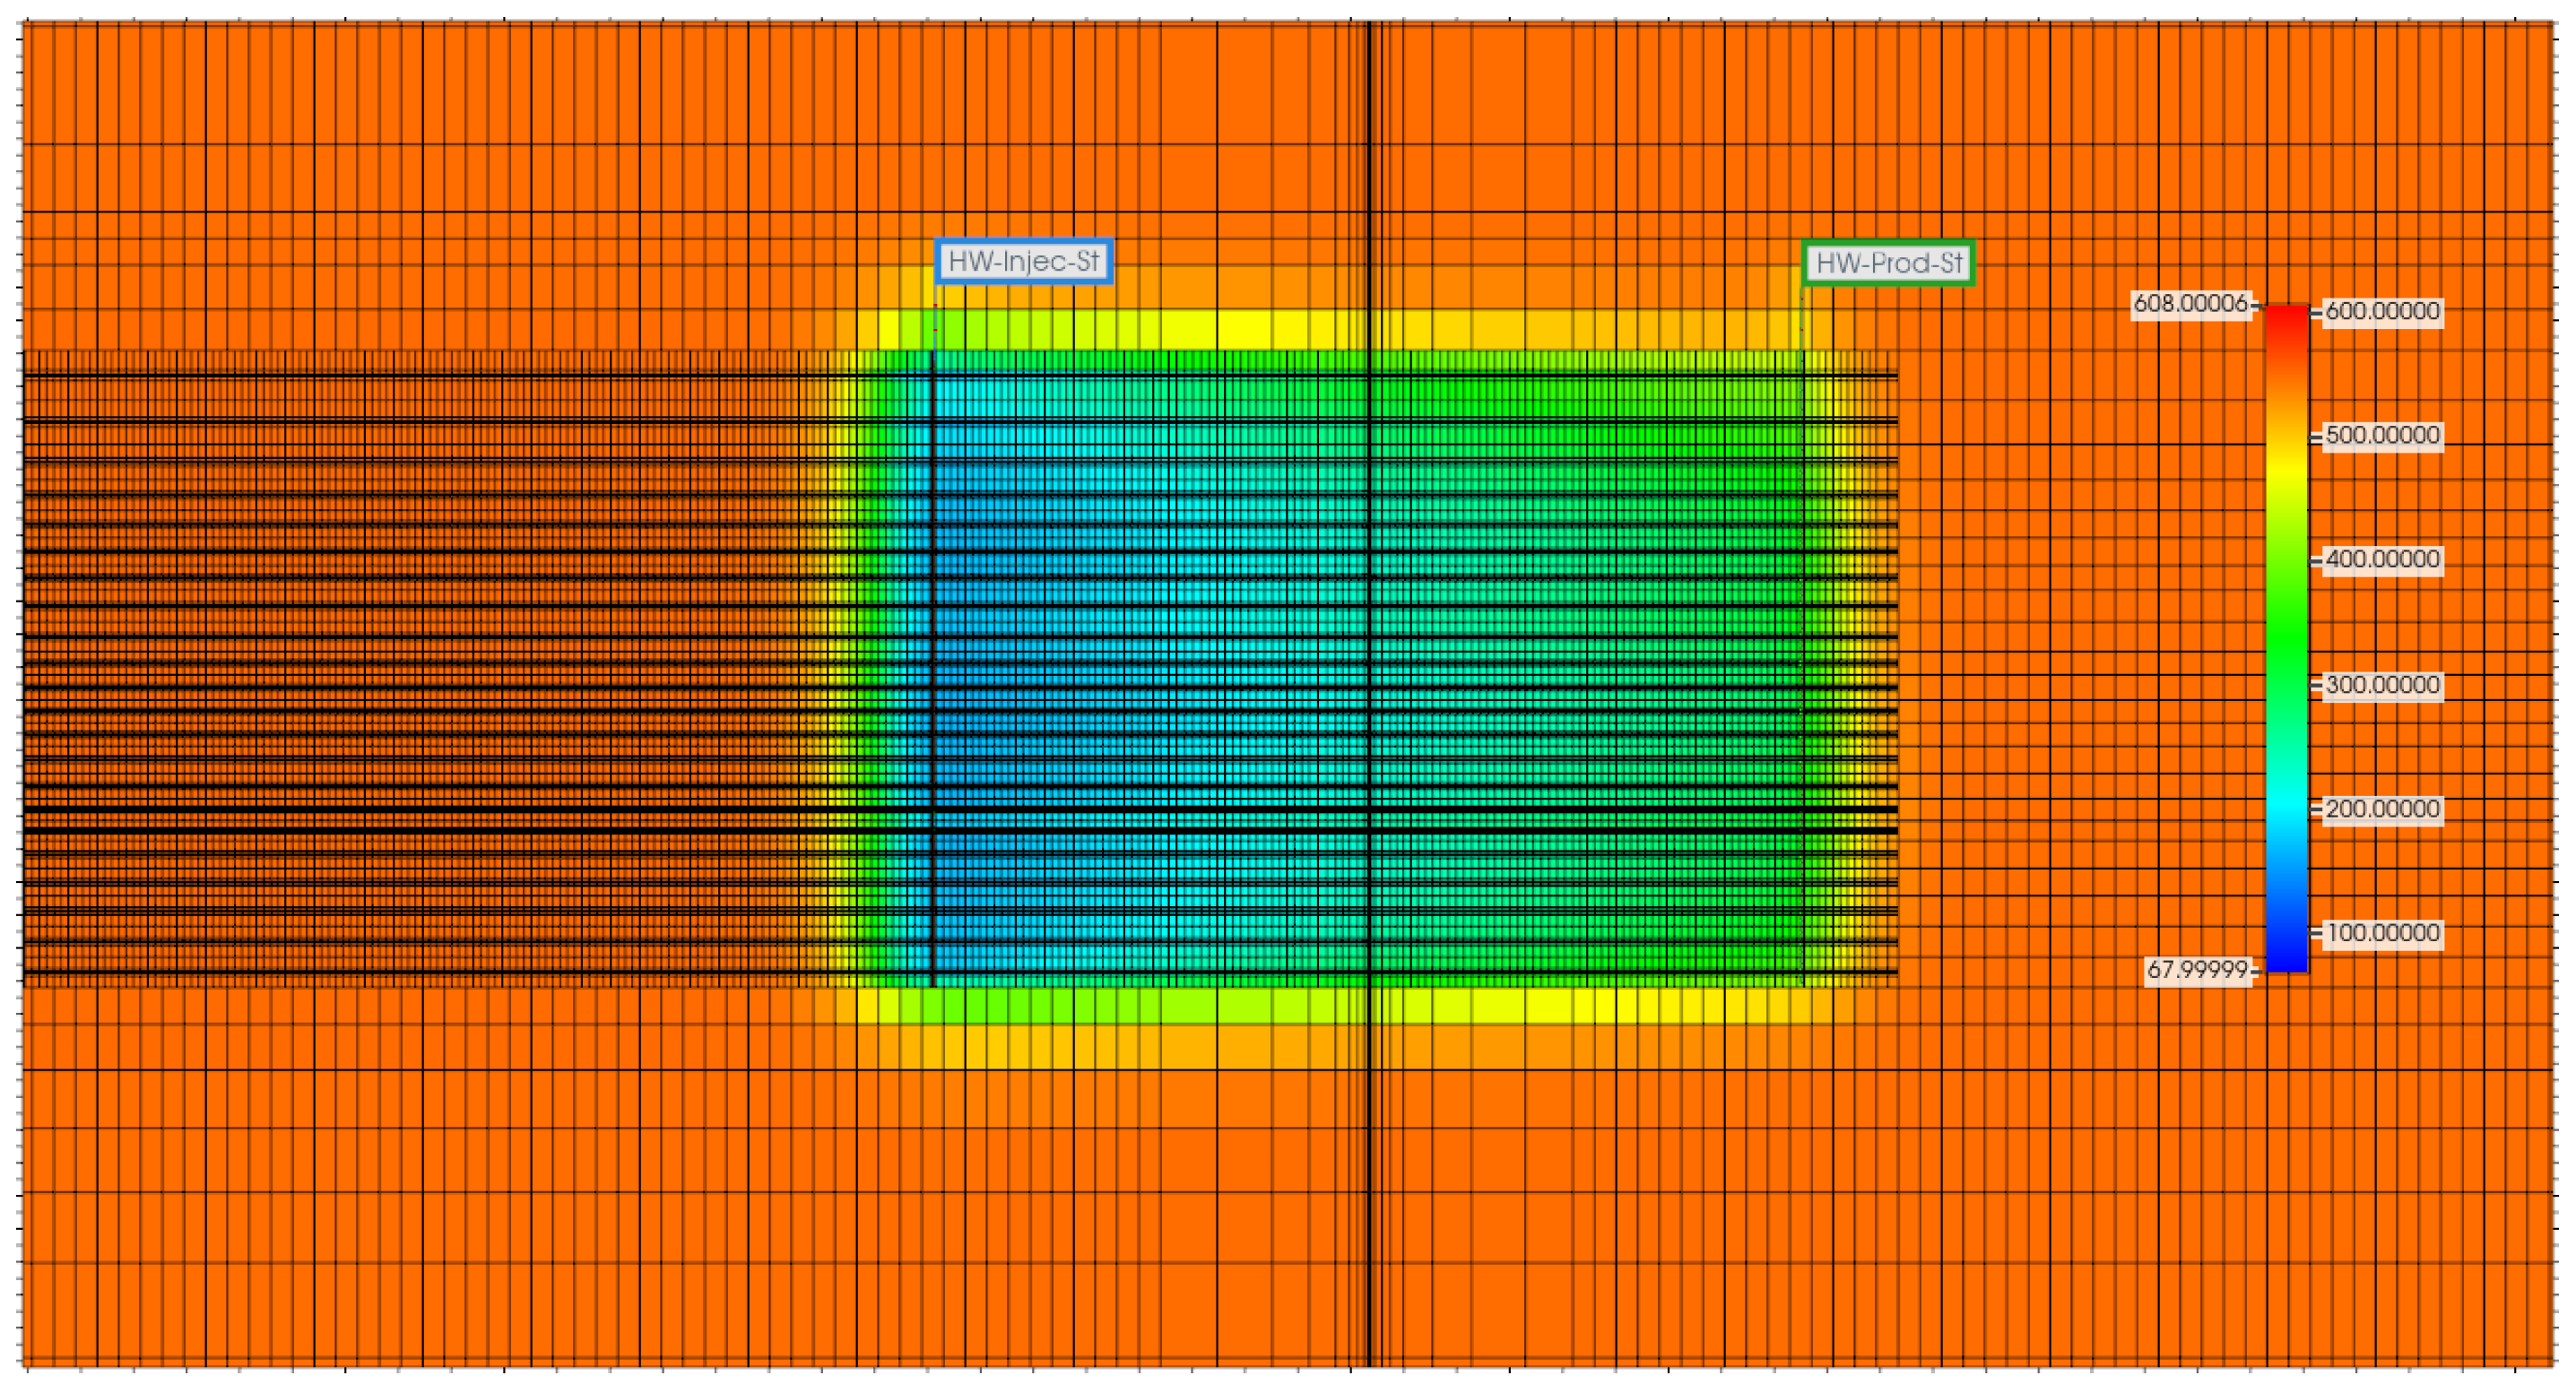
3.5. Long-Term Performance Analysis of Inclined V-Shaped Geothermal Well Models
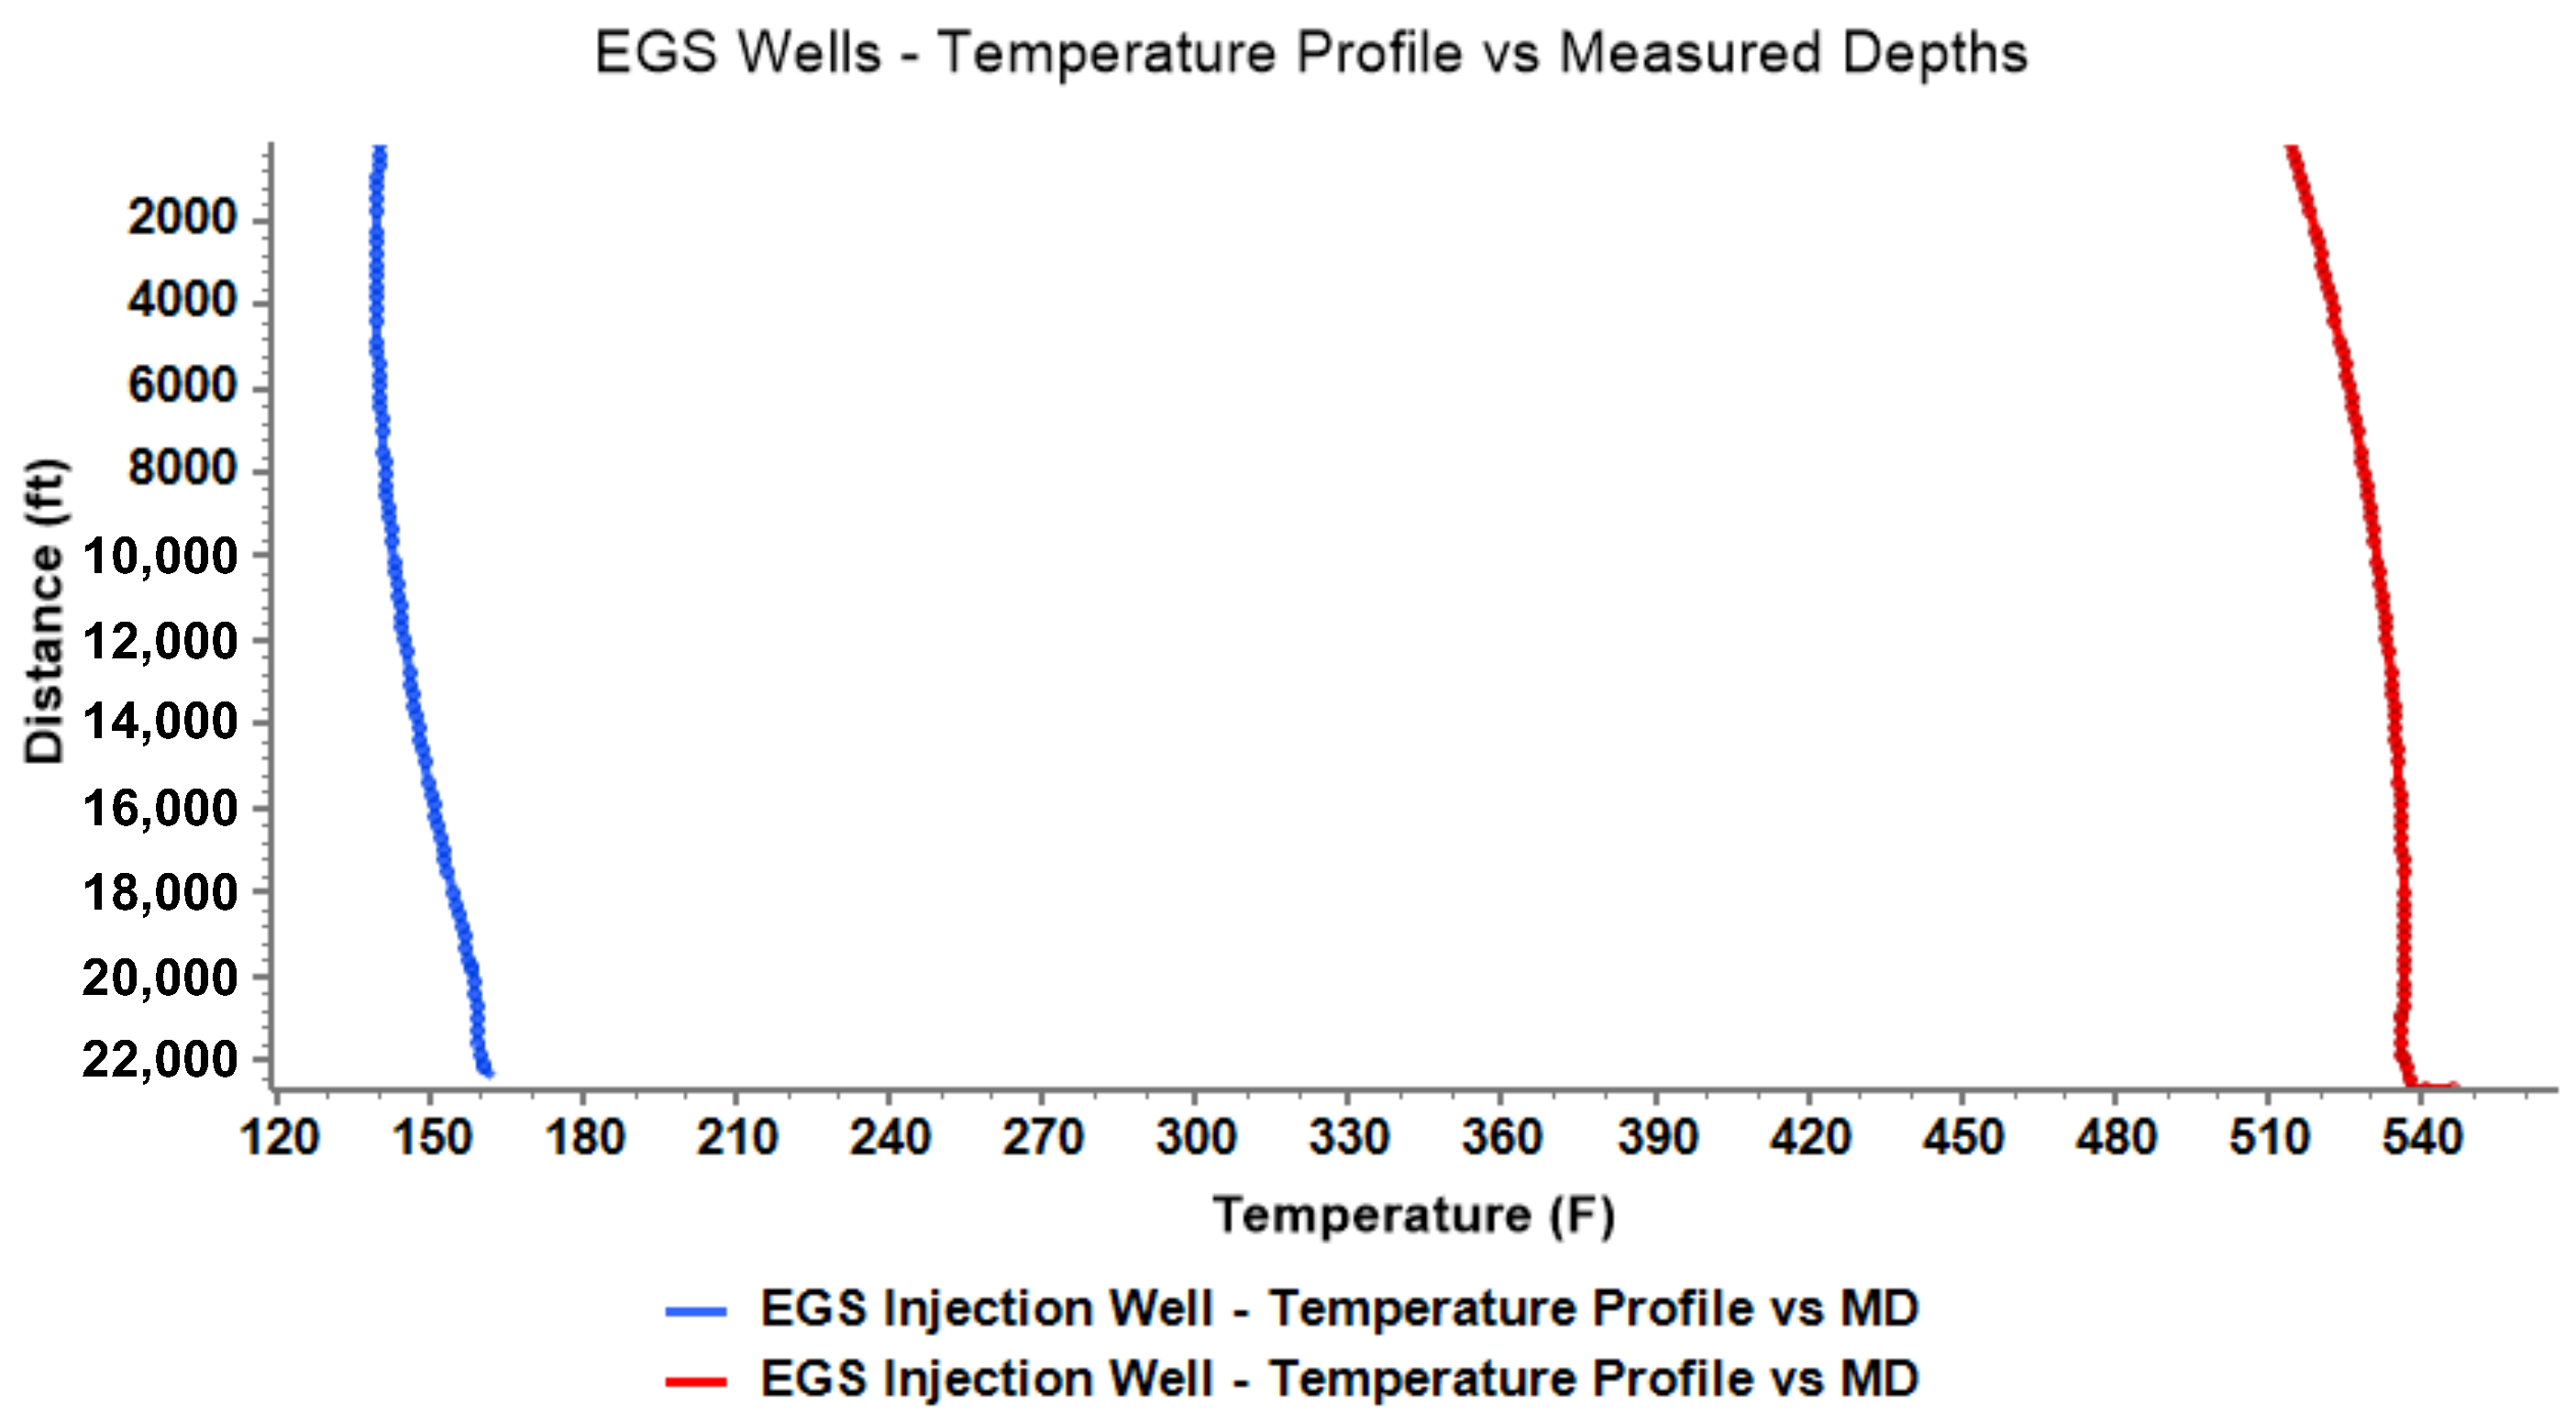
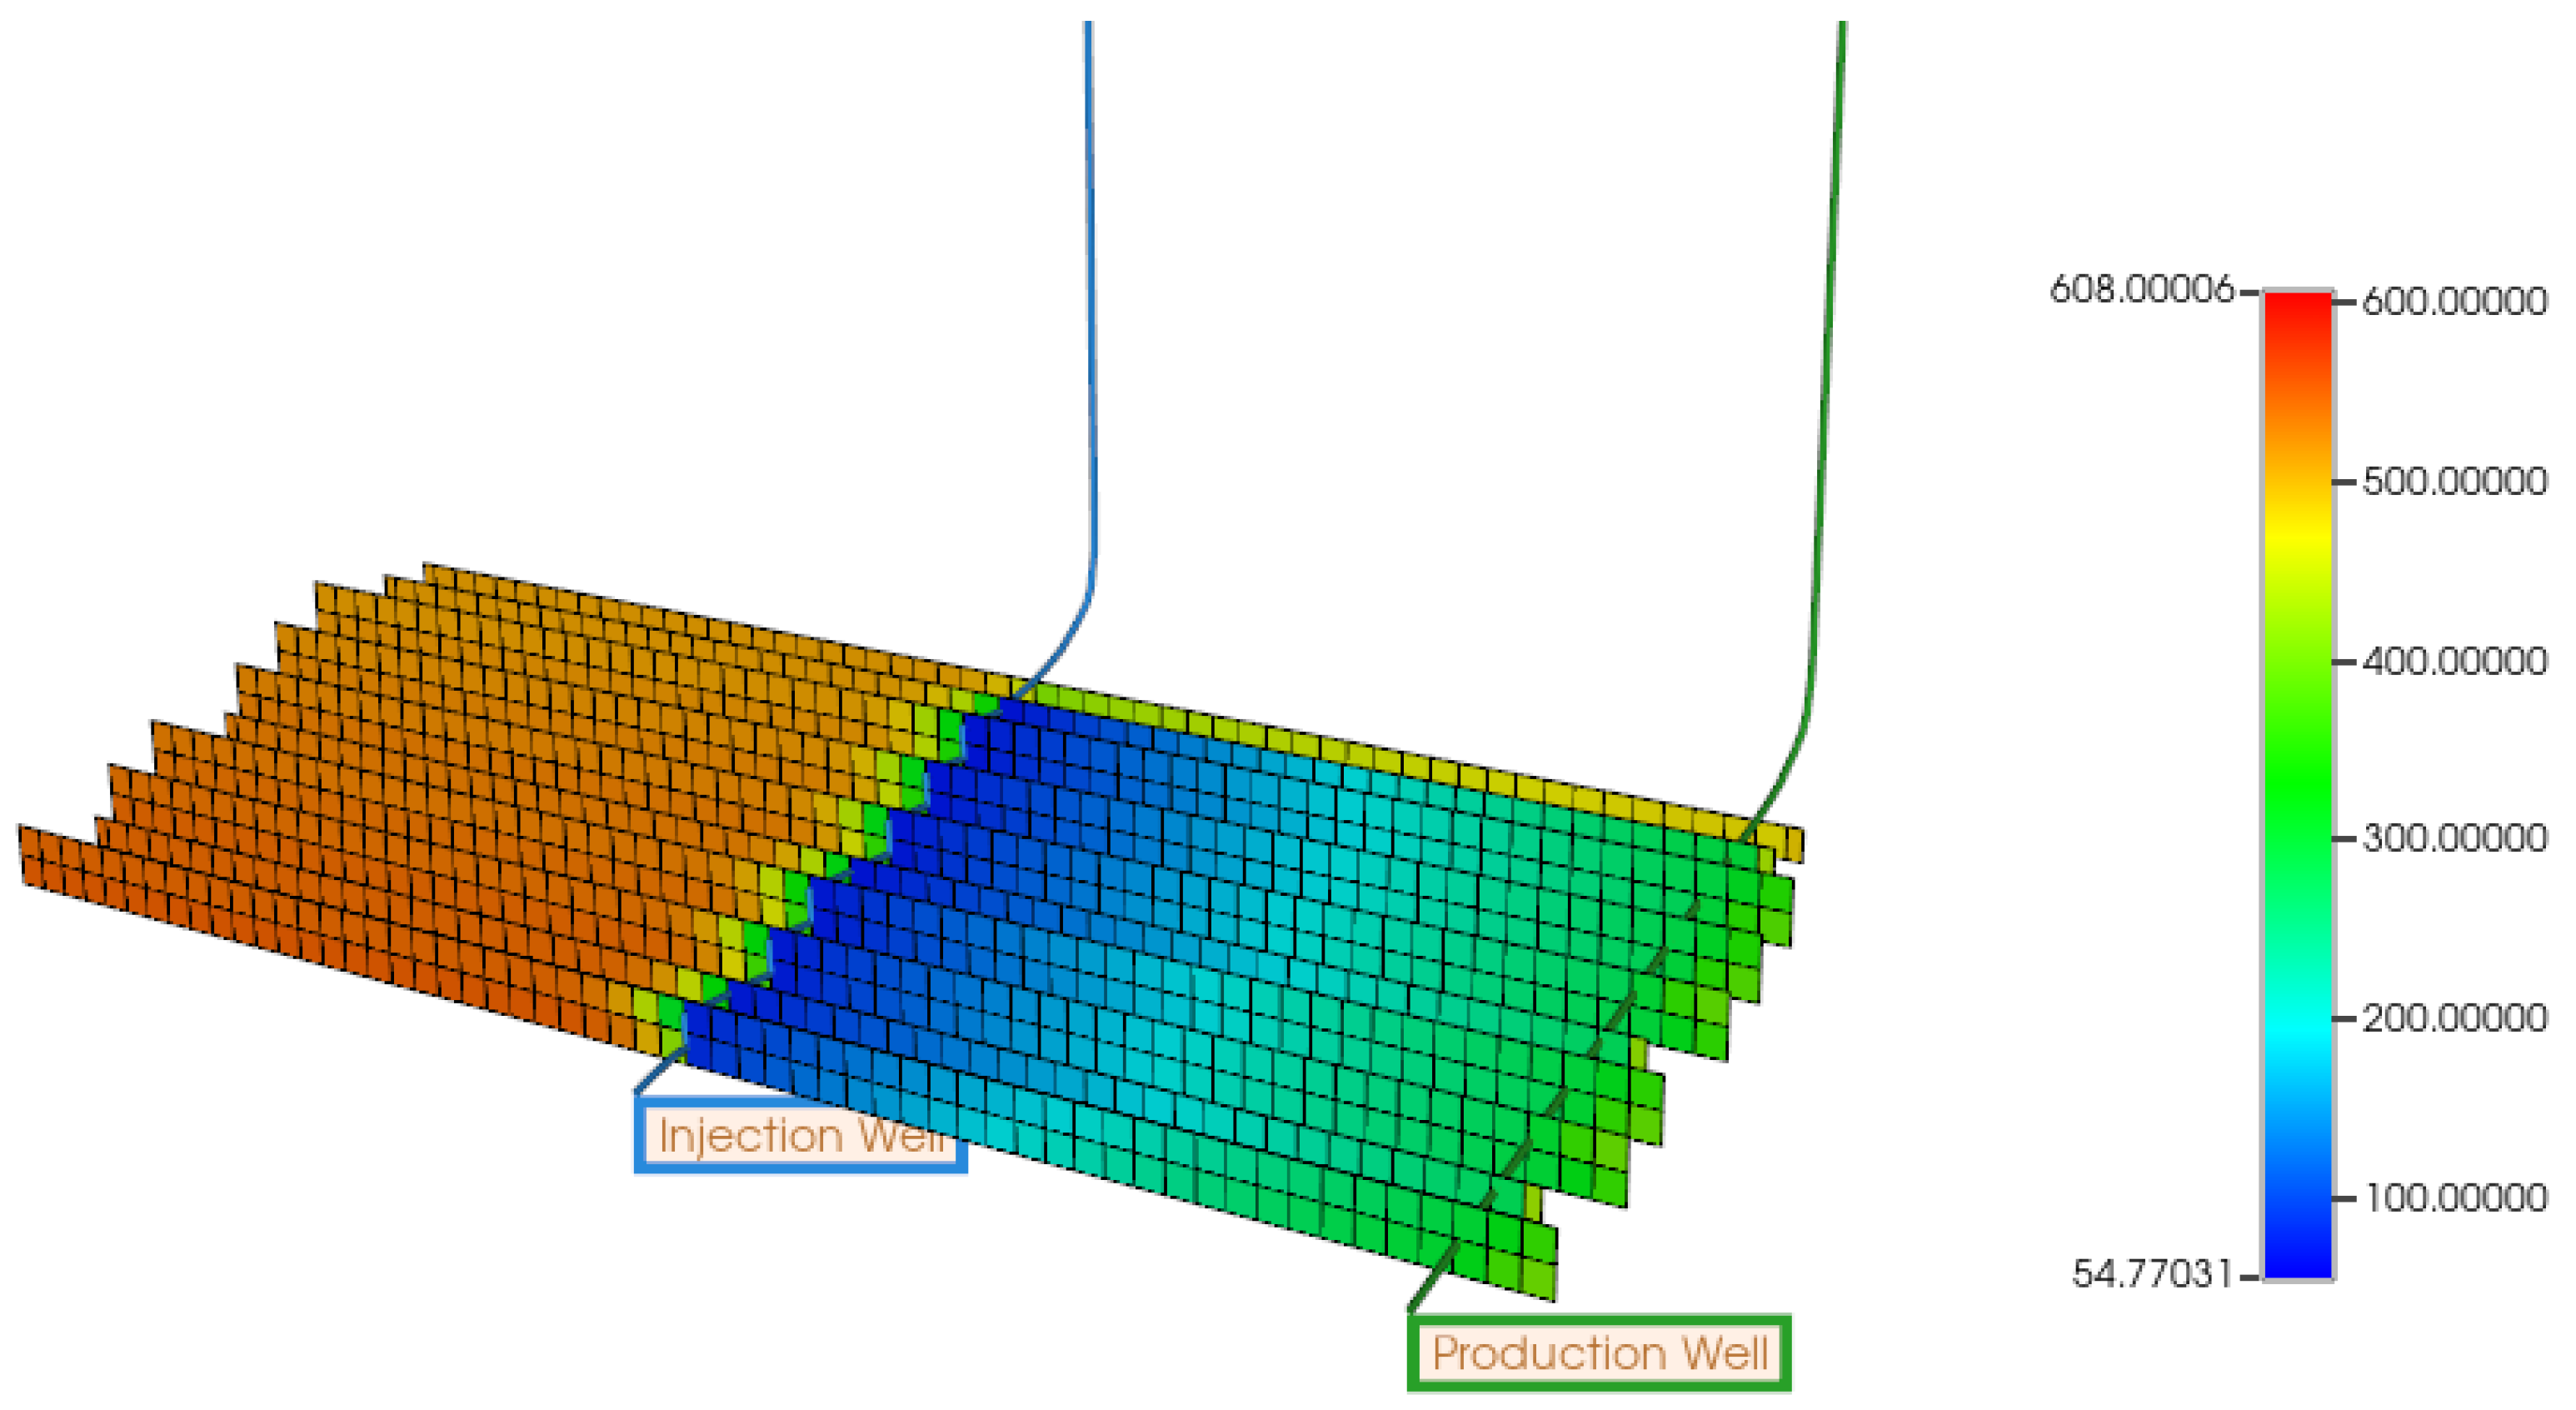
3.6. Long-Term Performance Analysis of EGS Well Model
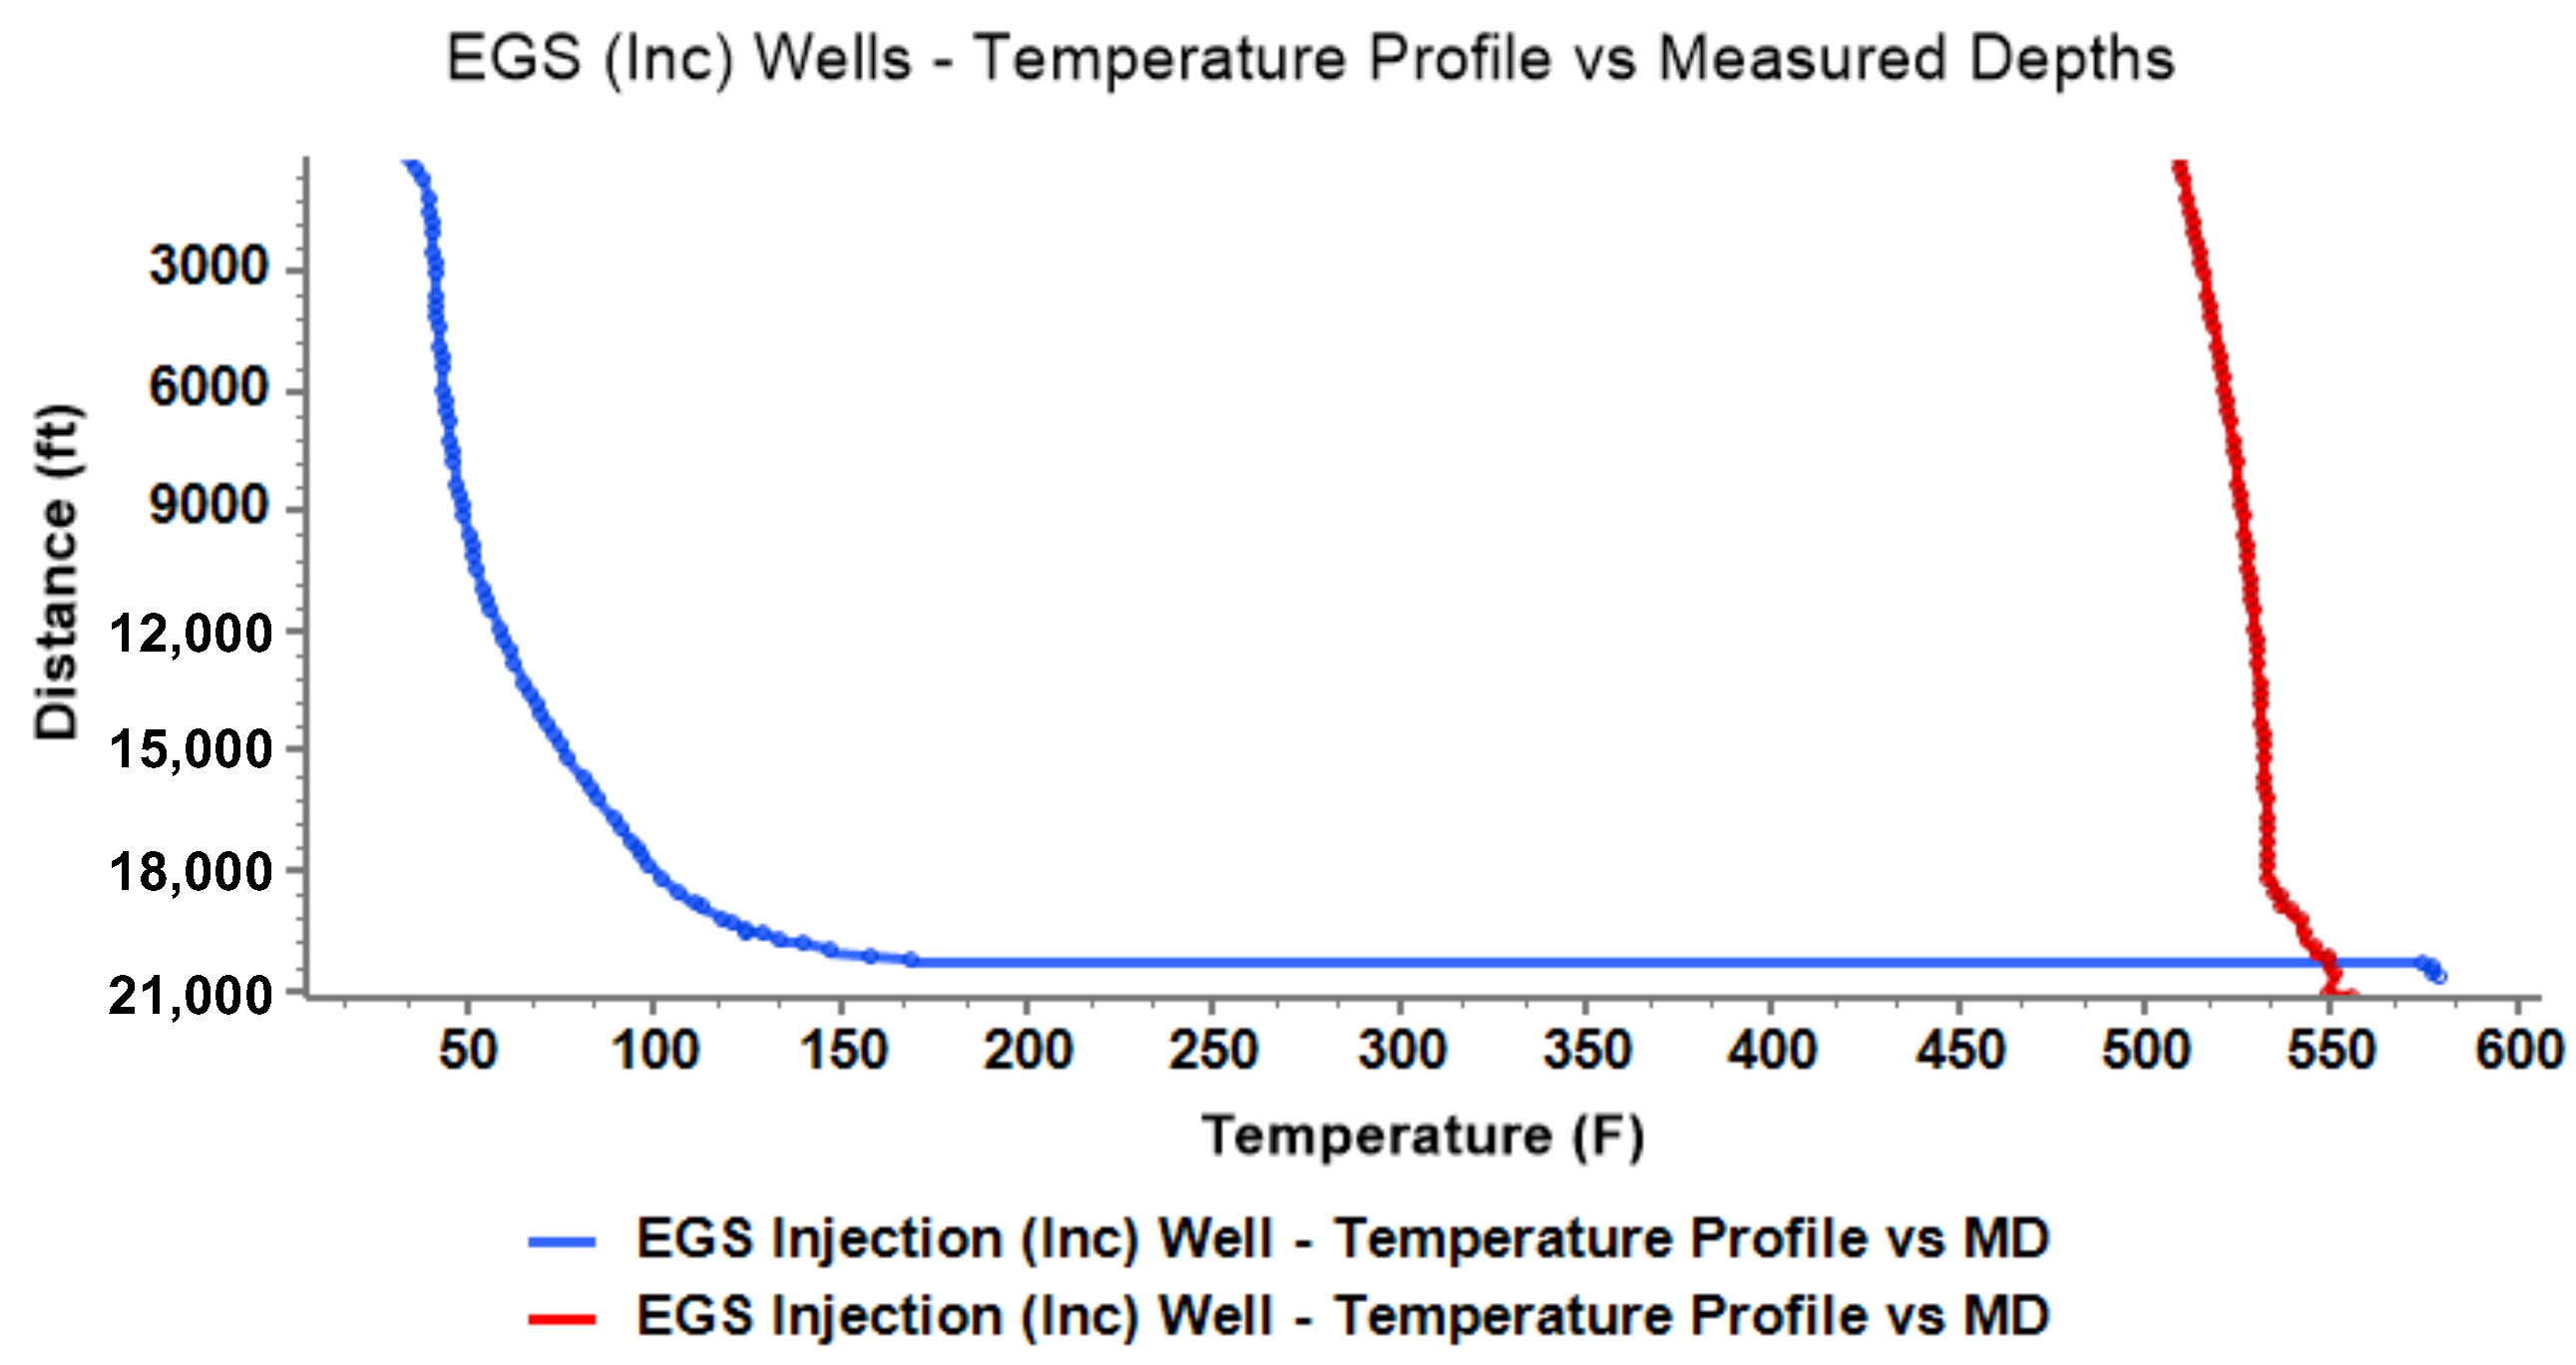
3.7. Long-Term Performance Analysis of Inclined EGS Well Model
Model Discussion
4. Summary and Conclusions
Author Contributions
Funding
Data Availability Statement
Conflicts of Interest
Abbreviations
| CLGS | Closed-loop geothermal system |
| CMG | Computer Modeling Group |
| DJ | Denver-Julesburg |
| EGSs | Enhanced geothermal systems |
| HDR | Hot Dry Rock |
| PIP | Pipe-in-pipe |
| UBA | User Block Address |
References
- Cheng, Y.; Zhang, Y.; Yu, Z.; Hu, Z.; Ma, Y.; Yang, Y. Experimental and numerical studies on hydraulic fracturing characteristics with different injection flow rates in granite geothermal reservoir. Energy Sci. Eng. 2021, 9, 142–168. [Google Scholar] [CrossRef]
- Pratama, H.B.; Saptadji, N.M. Study of Production-Injection Strategies for Sustainable Production in Geothermal Reservoir Two-Phase by Numerical Simulation. Indones. J. Geosci. 2021, 8, 25–38. [Google Scholar]
- Simmons, S.F.; Allis, R.G.; Kirby, S.M.; Moore, J.N.; Fischer, T.P. Interpretation of hydrothermal conditions, production-injection induced effects, and evidence for enhanced geothermal system-type heat exchange in response to 30 years of production at Roosevelt Hot Springs, Utah, USA. Geosphere 2021, 17, 1997–2026. [Google Scholar] [CrossRef]
- Xu, T.; Zhao, Y.; Zhao, J.; Zhang, L.; Liu, S.; Liu, Z.; Feng, B.; Feng, G.; Yue, G. Heat Extraction Performance and Optimization for a Doublet-well Geothermal System in Dezhou, China. Energy Explor. Exploit. 2022, 40, 619–638. [Google Scholar] [CrossRef]
- Chen, G.; Jiao, J.J.; Jiang, C.; Luo, X. Surrogate-assisted level-based learning evolutionary search for geothermal heat extraction optimization. Renew. Sustain. Energy Rev. 2024, 189, 113860. [Google Scholar] [CrossRef]
- Majer, E.L.; Baria, R.; Stark, M.; Oates, S.; Bommer, J.; Smith, B.; Asanuma, H. Induced seismicity associated with Enhanced Geothermal Systems. Geothermics 2007, 36, 185–222. [Google Scholar] [CrossRef]
- Abdelrahman, K.; Ekwok, S.E.; Ulem, C.A.; Eldosouky, A.M.; Al-Otaibi, N.; Hazaea, B.Y.; Hazaea, S.A.; Andráš, P.; Akpan, A.E. Exploratory mapping of the geothermal anomalies in the neoproterozoic Arabian Shield, Saudi Arabia, using magnetic data. Minerals 2023, 13, 694. [Google Scholar] [CrossRef]
- Zhang, C.; Feng, Q.; Zhang, L.; Qin, S.; Jiang, G.; Hu, J.; Hu, S.; Huang, R.; Zhang, H. Characteristics of Radiogenic Heat Production of Widely Distributed Granitoids in Western Sichuan, Southeast Tibetan Plateau. Lithosphere 2022, 2022, 4165618. [Google Scholar] [CrossRef]
- Robson, S.G.; Banta, E.R. Geology and Hydrology of the Deep Bedrock Aquifers in Eastern Colorado; Report 85-4240; US Geological Survey: Reston, VA, USA, 1987.
- Schulz, S.U. Investigations on the Improvement of the Energy Output of a Closed Loop Geothermal System (CLGS); Technische University: Berlin, Germany, 2008. [Google Scholar]
- Cui, G.; Ren, S.; Zhang, L.; Ezekiel, J.; Enechukwu, C.; Wang, Y.; Zhang, R. Geothermal exploitation from hot dry rocks via recycling heat transmission fluid in a horizontal well. Energy 2017, 128, 366–377. [Google Scholar] [CrossRef]
- Song, X.; Shi, Y.; Li, G.; Yang, R.; Wang, G.; Zheng, R.; Li, J.; Lyu, Z. Numerical simulation of heat extraction performance in enhanced geothermal system with multilateral wells. Appl. Energy 2018, 218, 325–337. [Google Scholar] [CrossRef]
- Jiang, H.; Guo, L.; Kang, F.; Wang, F.; Cao, Y.; Sun, Z.; Shi, M. Geothermal Characteristics and Productivity Potential of a Super-Thick Shallow Granite-Type Enhanced Geothermal System: A Case Study in Wendeng Geothermal Field, China. Sustainability 2023, 15, 3551. [Google Scholar] [CrossRef]
- Kazemi, A.; Mahbaz, S.; Dehghani-Sanij, A.; Dusseault, M.; Fraser, R. Performance Evaluation of an Enhanced Geothermal System in the Western Canada Sedimentary Basin. Renew. Sustain. Energy Rev. 2019, 113, 109278. [Google Scholar] [CrossRef]
- Song, X.; Shi, Y.; Li, G.; Shen, Z.; Hu, X.; Lyu, Z.; Zheng, R.; Wang, G. Numerical analysis of the heat production performance of a closed loop geothermal system. Renew. Energy 2018, 120, 365–378. [Google Scholar] [CrossRef]
- Bu, X.; Jiang, K.; Li, H. Performance of geothermal single well for intermittent heating. Energy 2019, 186, 115858. [Google Scholar] [CrossRef]
- Zhang, Y.; Yu, C.; Li, G.; Guo, X.; Wang, G.; Shi, Y.; Peng, C.; Tan, Y. Performance analysis of a downhole coaxial heat exchanger geothermal system with various working fluids. Appl. Therm. Eng. 2019, 163, 114317. [Google Scholar] [CrossRef]
- Wang, G.; Song, X.; Shi, Y.; Zheng, R.; Li, J.; Li, Z. Production performance of a novel open loop geothermal system in a horizontal well. Energy Convers. Manag. 2020, 206, 112478. [Google Scholar] [CrossRef]
- Frash, L.P.; Meng, M.; Bijay, K. Greenfield Reservoir Engineering for the Wattenberg Field with Comparison of Advanced, Enhanced, and Caged Geothermal Systems. In Proceedings of the 49th Workshop on Geothermal Reservoir Engineering Stanford University, Stanford, CA, USA, 12–14 February 2024. [Google Scholar]
- Won, J.; Choi, H.J.; Lee, H.; Choi, H. Numerical investigation on the effect of cementing properties on the thermal and mechanical stability of geothermal wells. Energies 2016, 9, 1016. [Google Scholar] [CrossRef]
- Norbeck, J.; Latimer, T. Commercial-Scale Demonstration of a First-of-a-Kind Enhanced Geothermal System. arXiv 2023. [Google Scholar] [CrossRef]


| Parameter | Value |
|---|---|
| Porosity | 0.01 |
| Permeability | md |
| Water saturation | 100% |
| Hydrostatic gradient | 10 kPa/m |
| Rock compressibility | |
| Formation thermal conductivity | 252,720 J/(m·day·°C) |
| Formation volume heat capacity | 2,667,500 J/(·°C) |
| Working fluid volume capacity | 53,500 J/(m·day·°C) |
| Temperature gradient | 50 °C/km |
| Parameter | Value |
|---|---|
| AVISC | 0.0047352 cp |
| BVISC | 2760.26 °F |
| Reference pressure | 8850 psi |
| Reference temperature | 572 °F |
| Surface pressure | 14.7 psi |
| Surface temperature | 68 °F |
| Parameter | Value |
|---|---|
| Reference pressure | 8850 psi |
| Reference depth | 20,000 ft |
| Well | Wall Inner Diameter (ID) | Wall Outer Diameter (OD) |
|---|---|---|
| Injector | 0.14 m | 0.152 m |
| Producer | 0.14 m | 0.152 m |
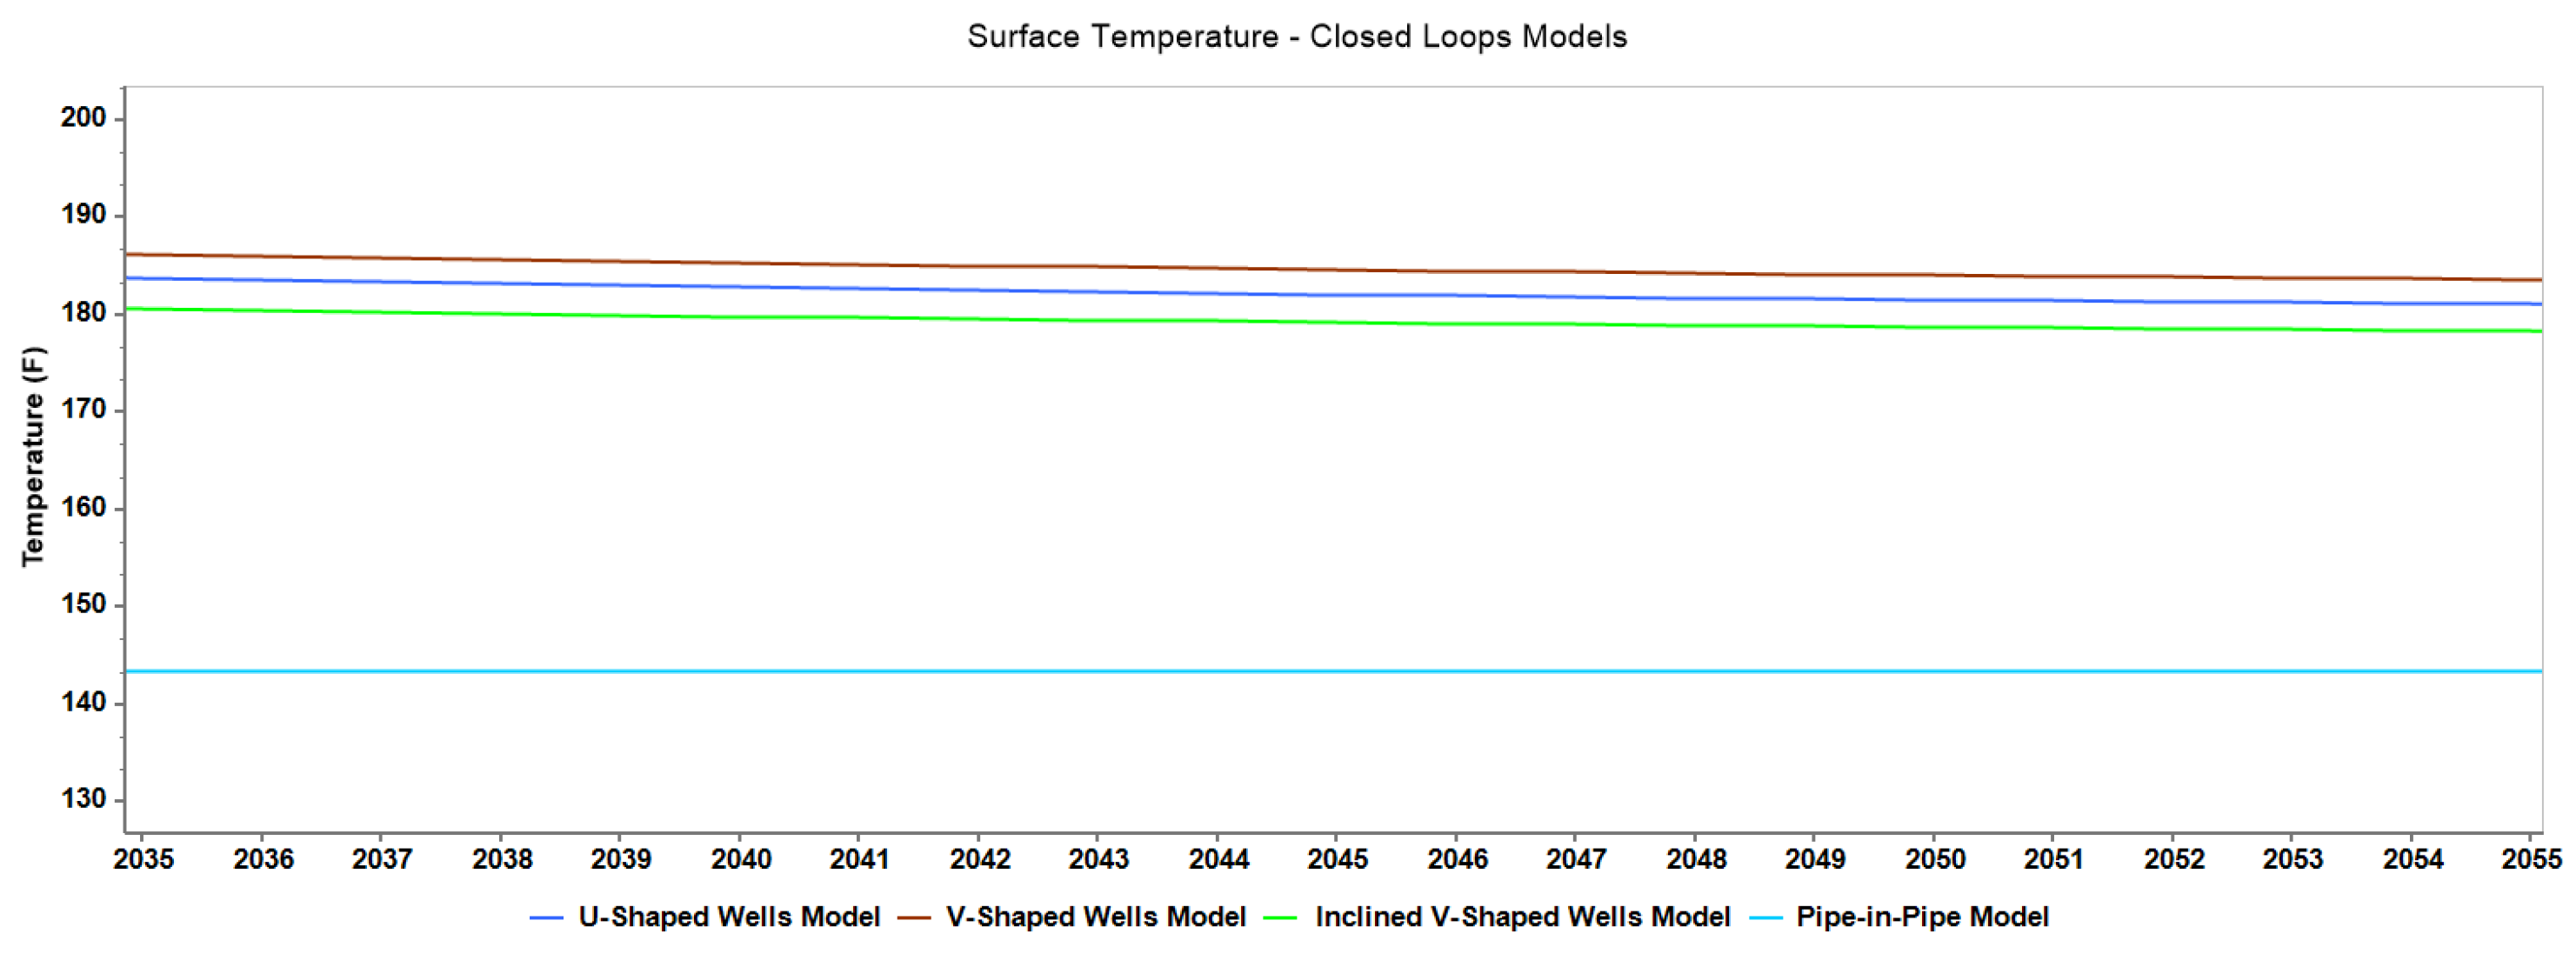
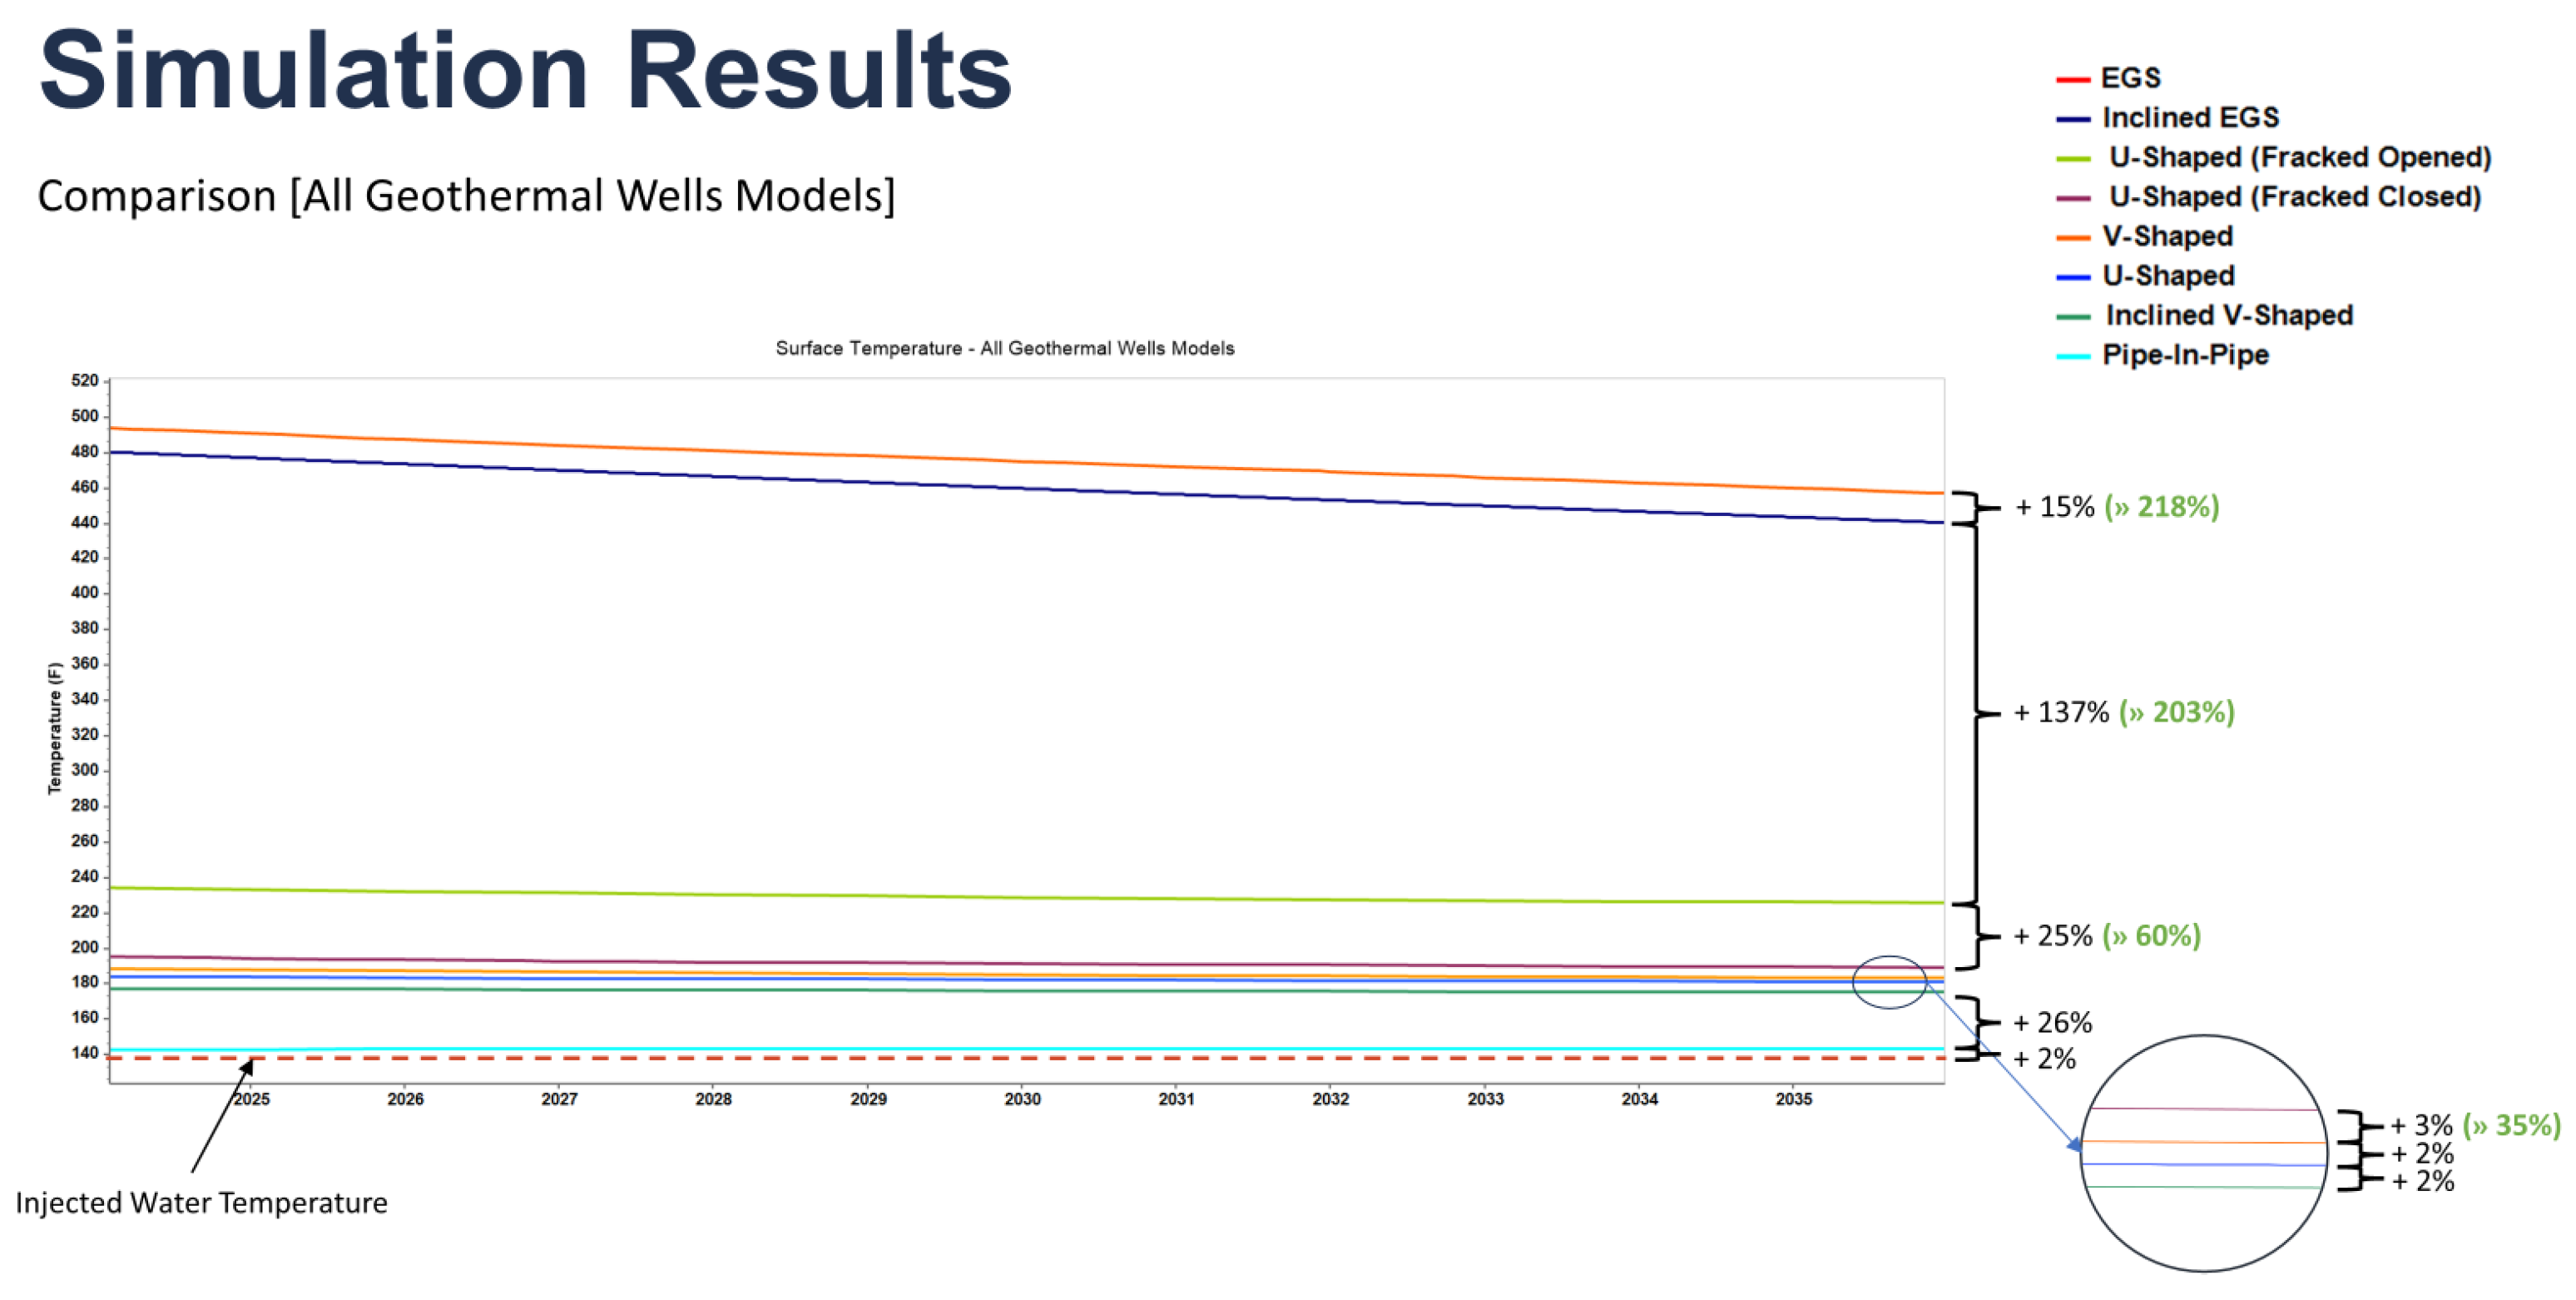
| Well Model | Surface Temperature (°F) | (°F) |
|---|---|---|
| Pipe-in-Pipe | 143 | +3 |
| Inclined V-Shaped | 179 | +39 |
| U-Shaped | 182 | +42 |
| V-Shaped | 185 | +45 |
| U-Shaped (Fracked Closed) | 189 | +49 |
| U-Shaped (Fracked Opened) | 225 | +85 |
| Inclined EGS | 425 | +285 |
| EGS | 446 | +306 |
Disclaimer/Publisher’s Note: The statements, opinions and data contained in all publications are solely those of the individual author(s) and contributor(s) and not of MDPI and/or the editor(s). MDPI and/or the editor(s) disclaim responsibility for any injury to people or property resulting from any ideas, methods, instructions or products referred to in the content. |
© 2024 by the authors. Licensee MDPI, Basel, Switzerland. This article is an open access article distributed under the terms and conditions of the Creative Commons Attribution (CC BY) license (https://creativecommons.org/licenses/by/4.0/).
Share and Cite
Nassereddine, A.; Zerpa, L.E. On the Feasibility of Deep Geothermal Wells Using Numerical Reservoir Simulation. Processes 2024, 12, 1369. https://doi.org/10.3390/pr12071369
Nassereddine A, Zerpa LE. On the Feasibility of Deep Geothermal Wells Using Numerical Reservoir Simulation. Processes. 2024; 12(7):1369. https://doi.org/10.3390/pr12071369
Chicago/Turabian StyleNassereddine, Ali, and Luis E. Zerpa. 2024. "On the Feasibility of Deep Geothermal Wells Using Numerical Reservoir Simulation" Processes 12, no. 7: 1369. https://doi.org/10.3390/pr12071369
APA StyleNassereddine, A., & Zerpa, L. E. (2024). On the Feasibility of Deep Geothermal Wells Using Numerical Reservoir Simulation. Processes, 12(7), 1369. https://doi.org/10.3390/pr12071369