
Towards Achieving Circular Economy in the Production of Silica from Rice Husk as a Sustainable Adsorbent

 , , ,
, , ,  , ,
, ,  ,
, 
Abstract
:1. Introduction
2. Materials and Methods
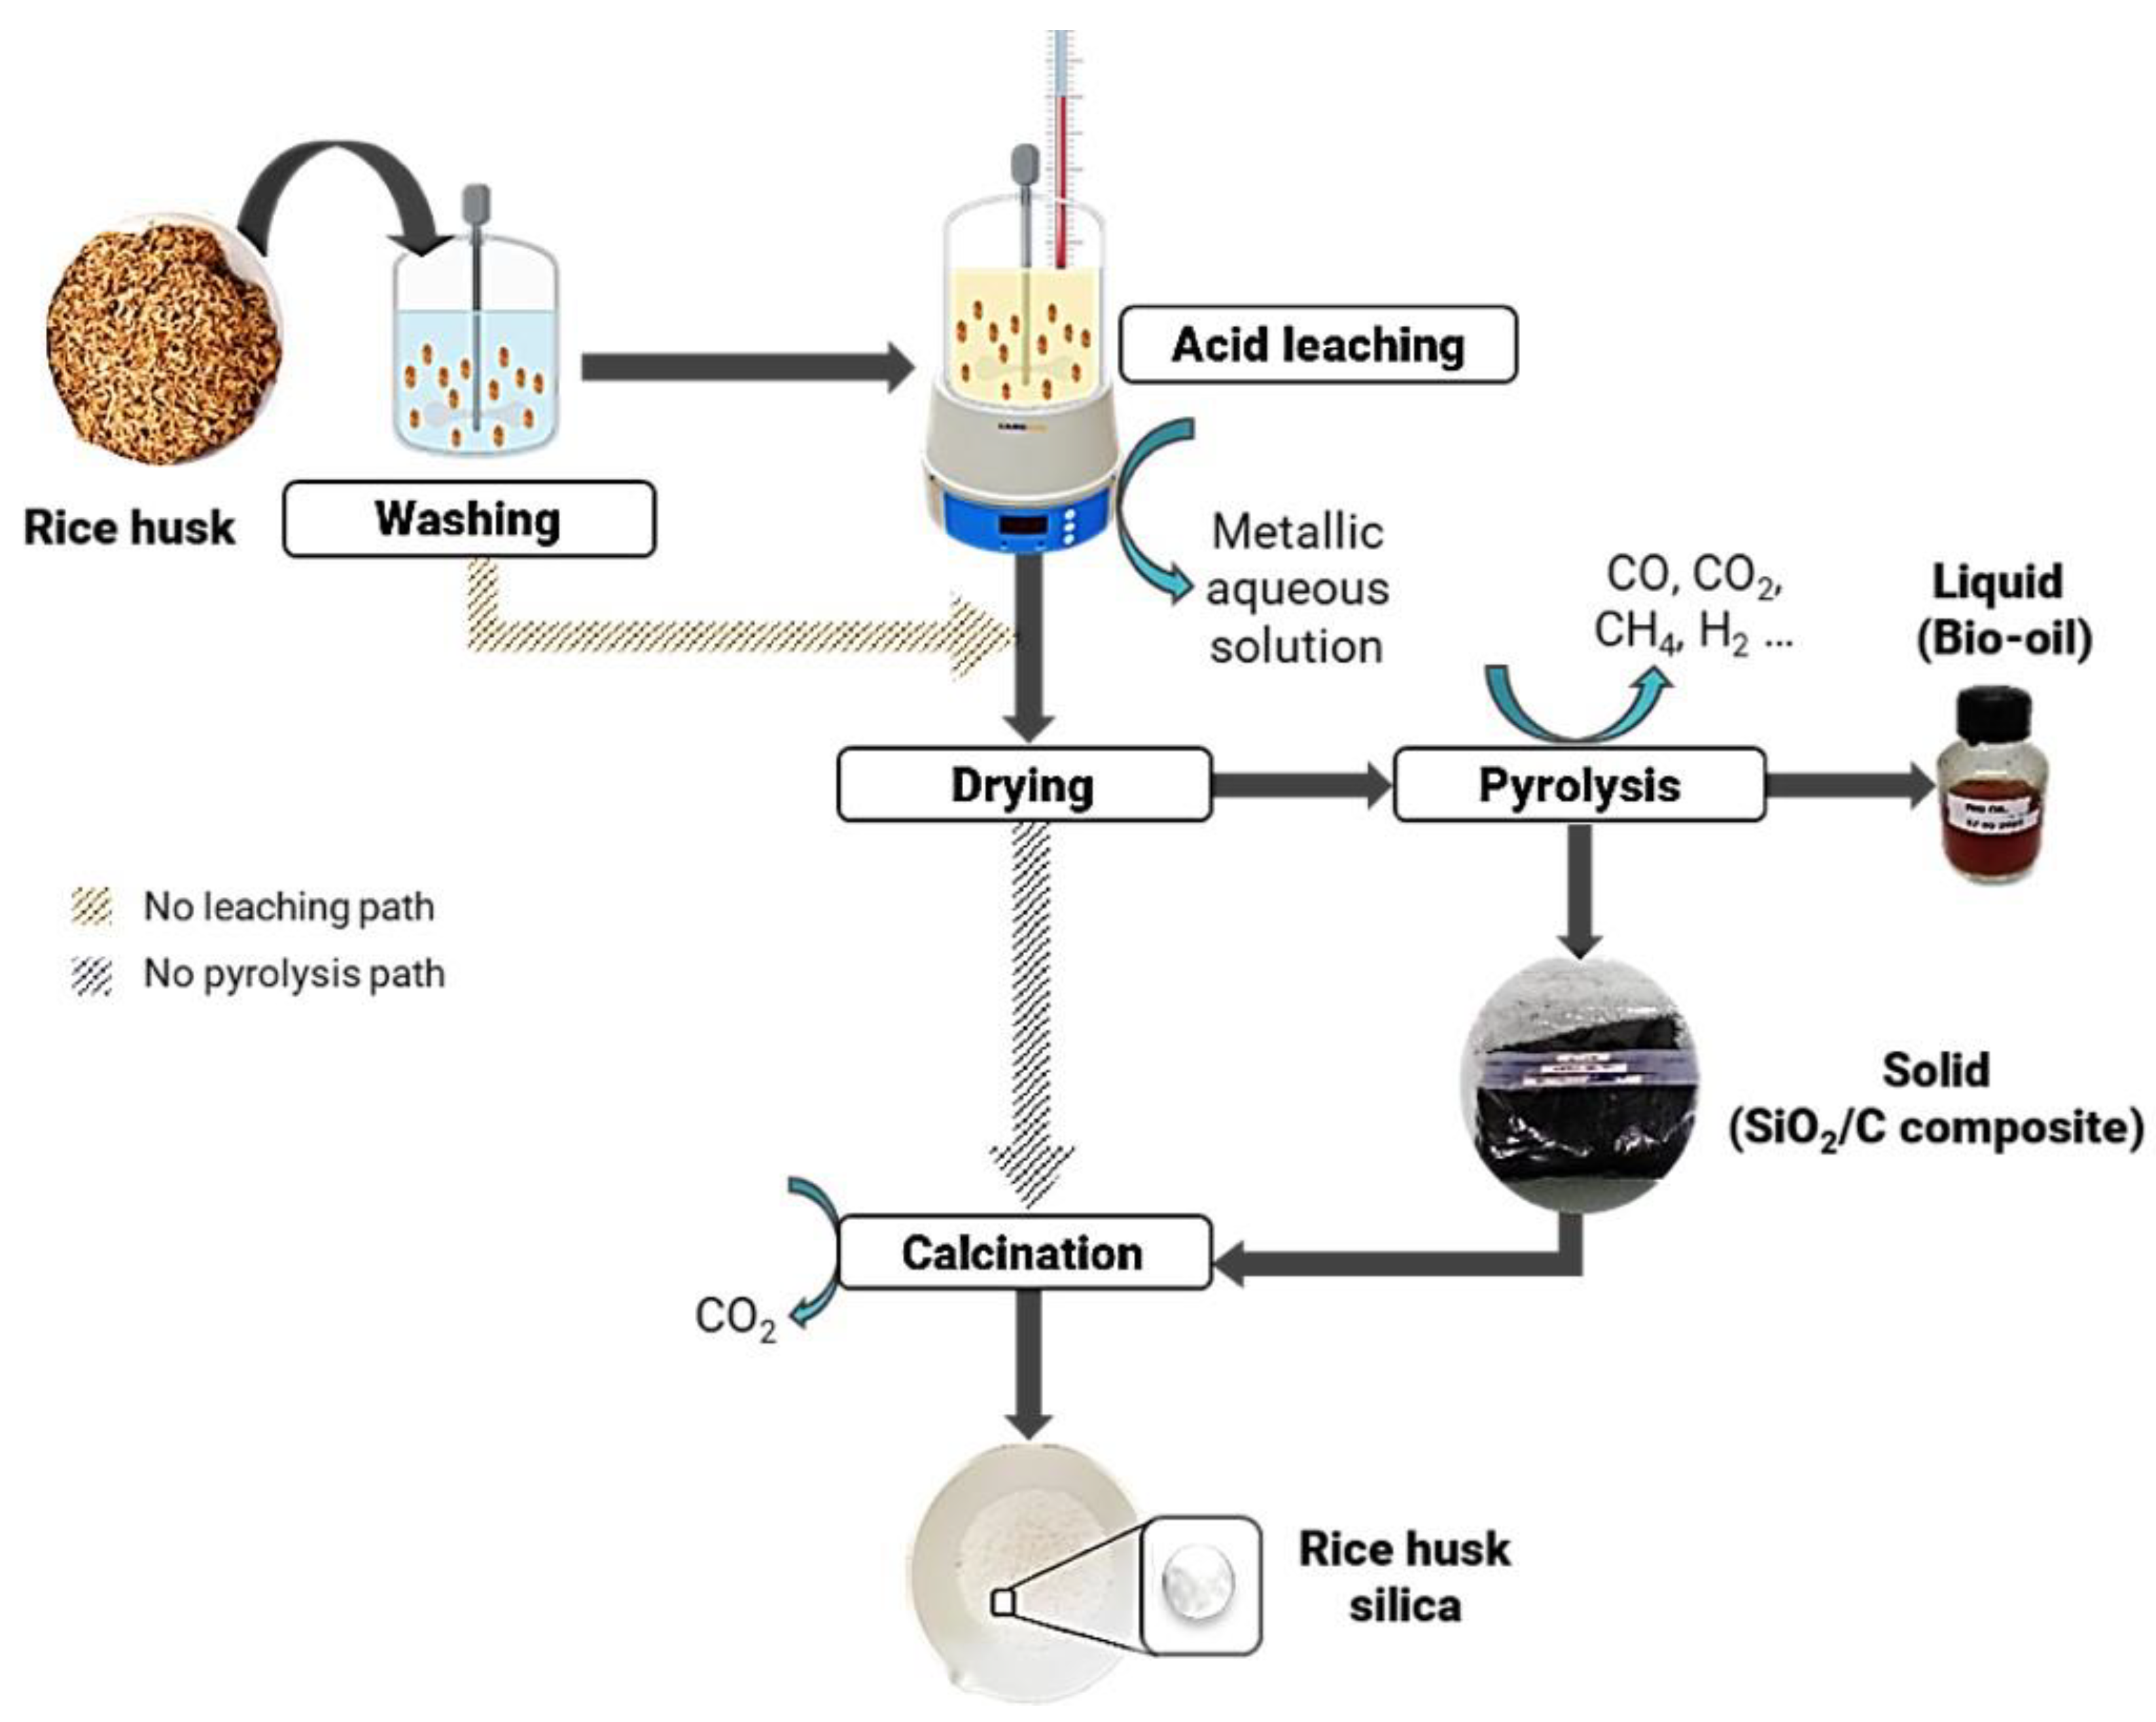
2.1. Rice-Husk-Silica Production
2.2. Rice-Husk-Silica Characterization
2.3. Bio-Oil Characterization by GC-MS Analysis
2.4. RH2-SiO2 Application for Adsorption of Cadmium in Batch
3. Results and Discussion
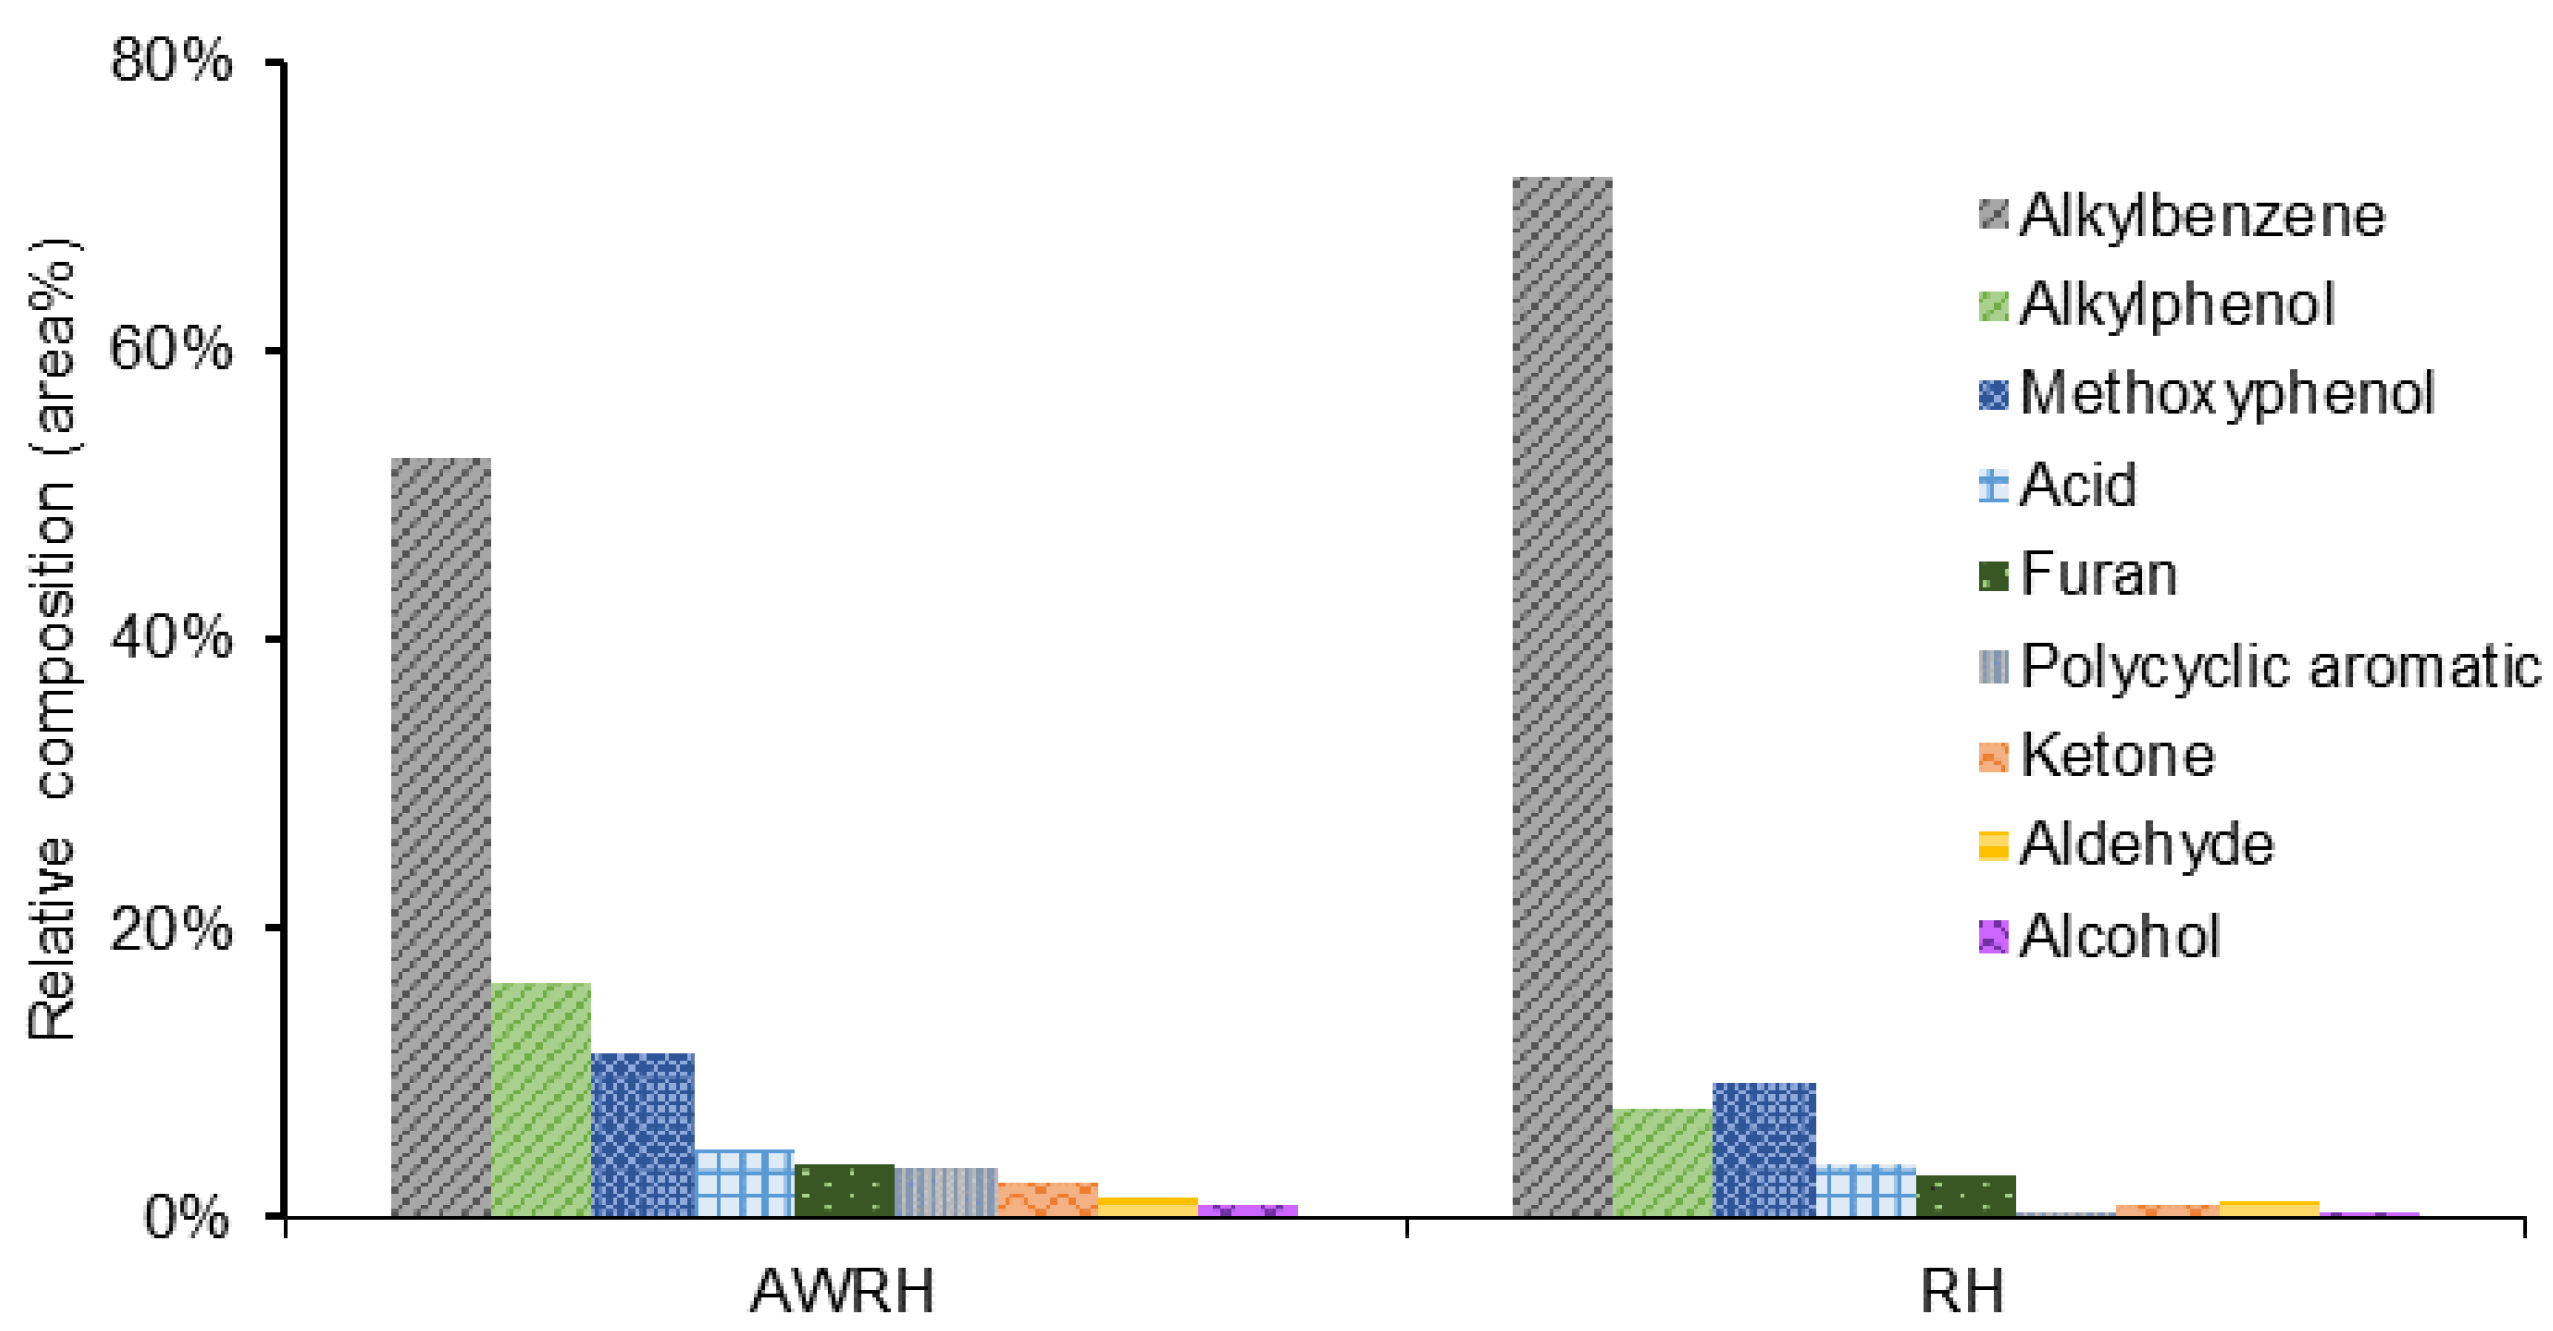
3.1. Effects of Acid Washing of Rice Husk on Pyrolysis By-Products
3.1.1. Characterization of Pyrolysis By-Products
3.1.2. Calcination of AWRH and RH Ashes
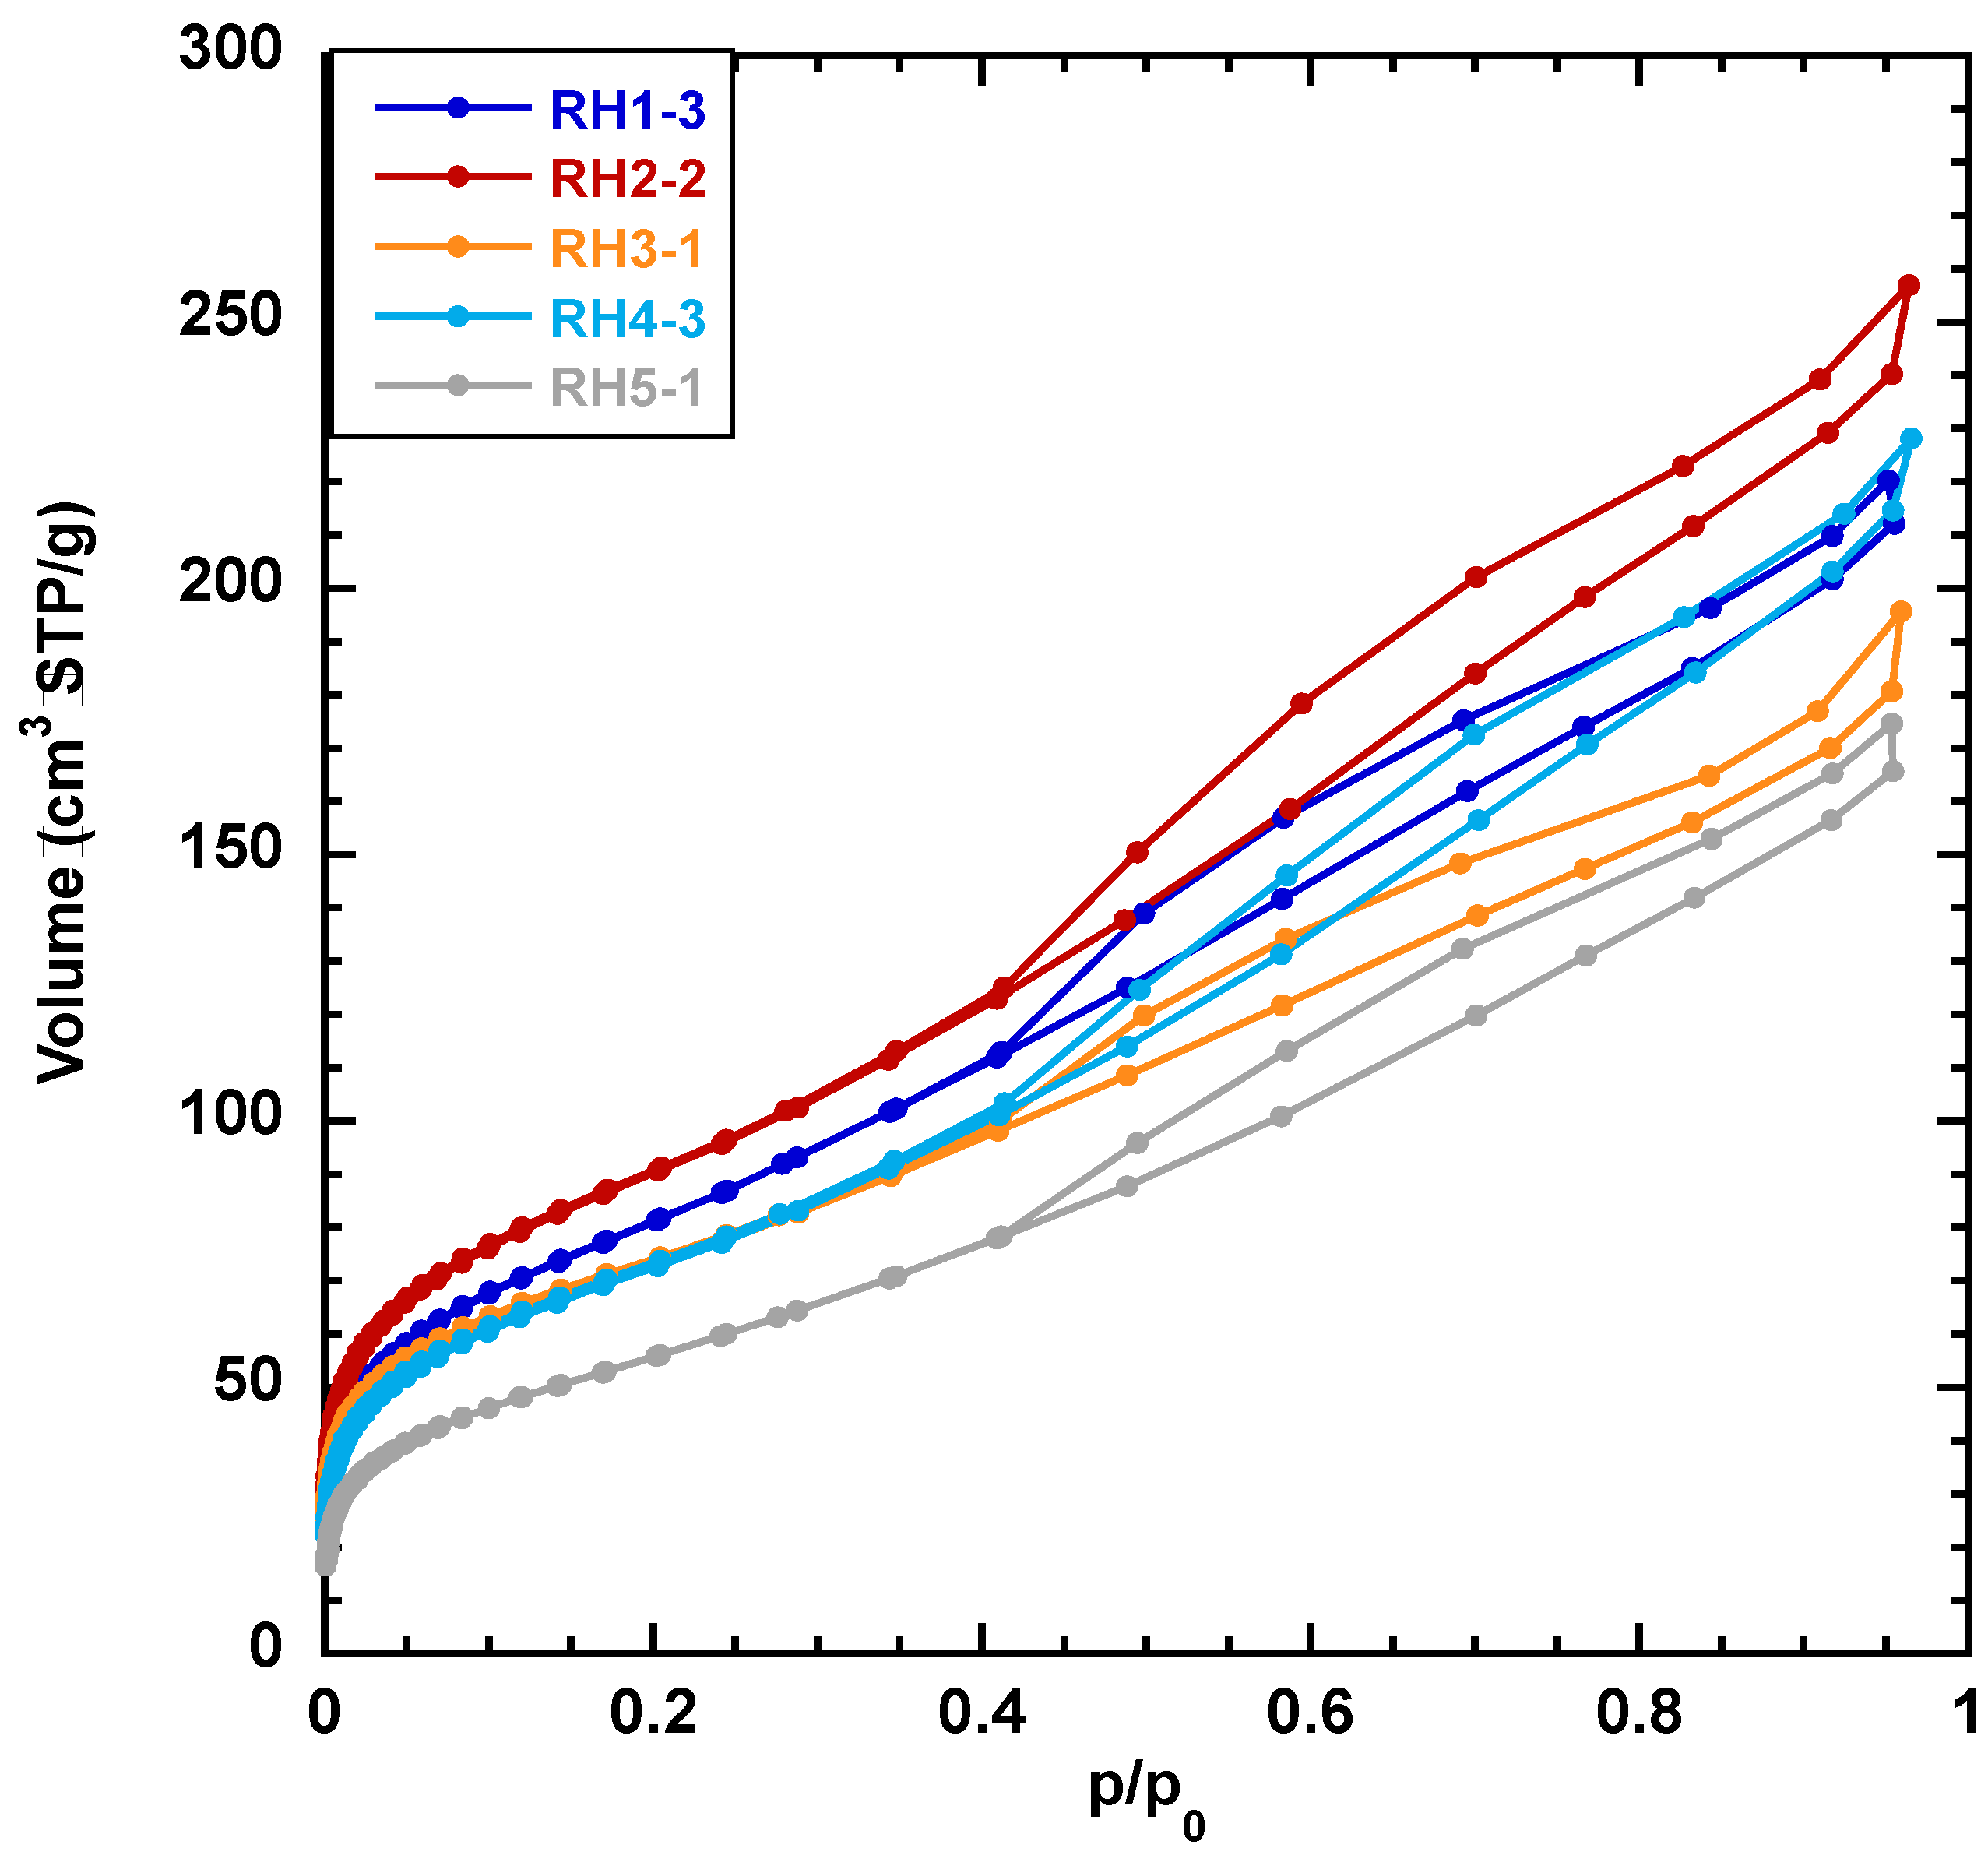
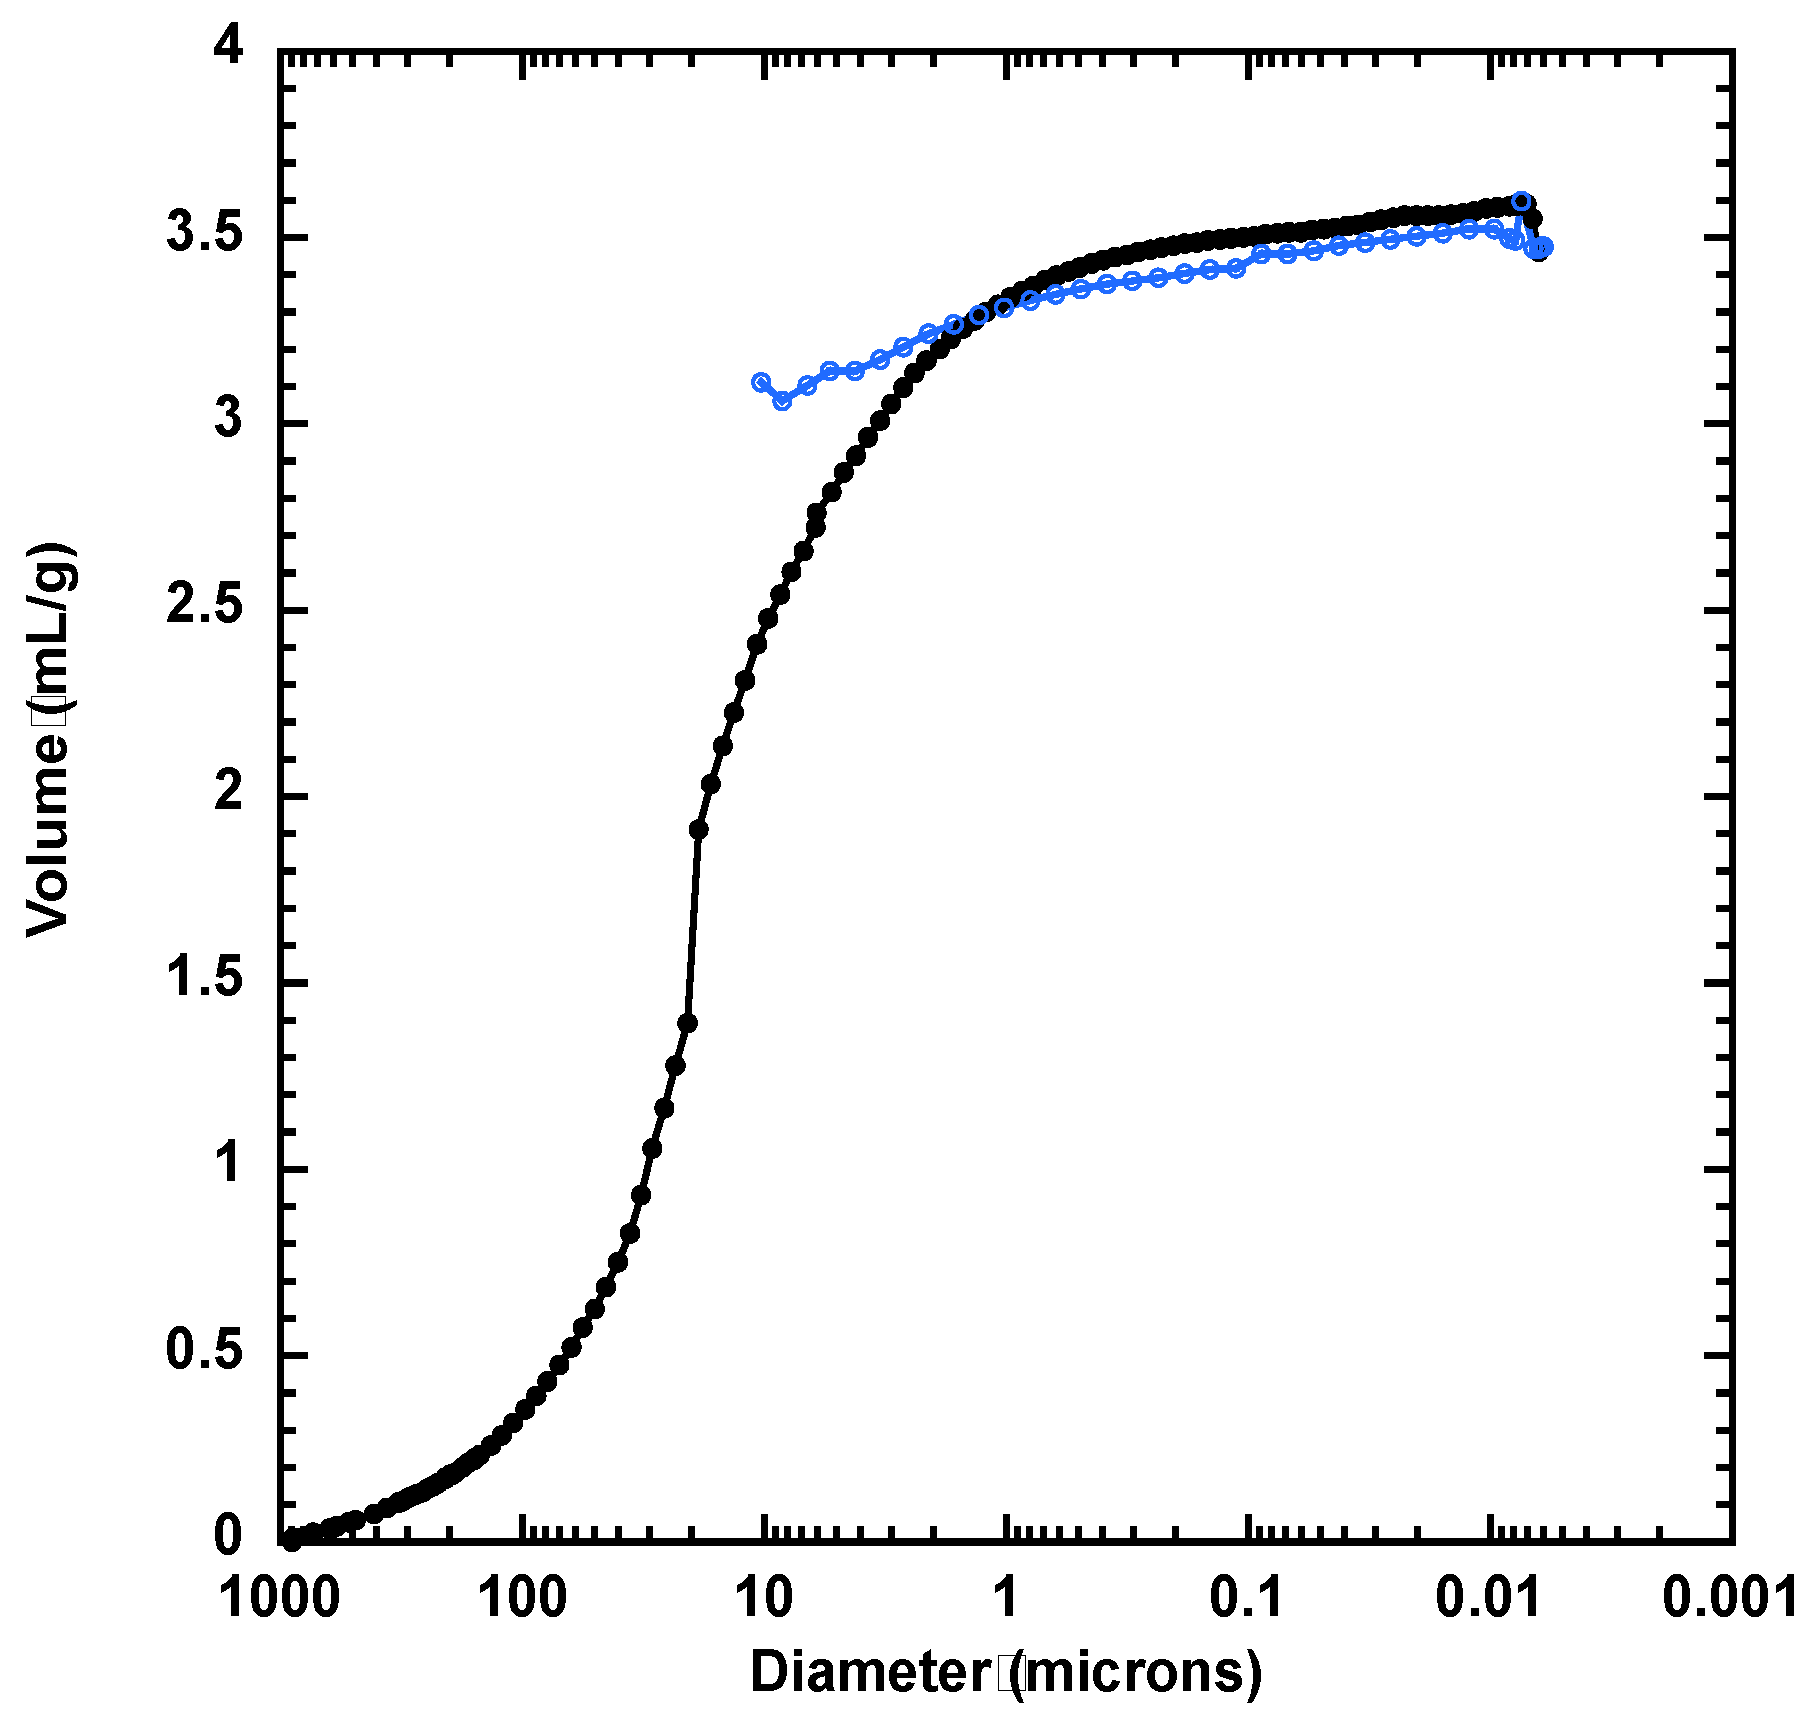
3.2. Textural Characteristics of Silica Materials from RH
RH2-SiO2 Adsorption of Metals in Aqueous Solution

| Adsorbent | SBET (m2/g) | pH | qe (mg/g) | te (min) | C0 (mg/L) Metal | Dosage (g/L) | Author |
|---|---|---|---|---|---|---|---|
| Nanosilica | 307 | 6 | 72.1 | (72 h) | 200 | 2 | [48] |
| SBA-15 | 964 | 6.6 | 5.6 | 120 | 3025 | 10 | [49] |
| SBA-GSH | 187 | 6.6 | 112.3 | 120 | 3025 | 10 | |
| PT@MSBA | 390 | 8 | 34.7 | 15 | 3.36 | 0.13 | [50] |
| MCM-41 | 1174 | 5 | 20.9 | 120 | 100 | 2 | [51] |
| NH2-50-magMCM-41 | 571 | 5 | 493.2 | 150 | 0.1 | ||
| Commercial Resin MPX-310 | - | 3 | 48.8 | 720 | 100 | 1 | [52] |
| Commercial Resin MPX-317 | - | 3 | 106.4 | 720 | 100 | 1 | |
| Commercial Resin TP-214 | - | 3 | 116.3 | 720 | 100 | 1 | |
| pPEI-MCF | 270 | 5 | 625 | - | 400 | - | [53] |
| MCCR-350 | 16 | 5.5 | 821 | 720 | 200 | 0.2 | [54] |
| RH2-SiO2 | 329 | 8 | 407.1 | 180 | 100 | 0.2 | This work |
4. Conclusions and Future Recommendations
Supplementary Materials
Author Contributions
Funding
Data Availability Statement
Acknowledgments
Conflicts of Interest
References
- European Commission. Communication from the Commission to the European Parliament, the Council, the European Economic and Social Committee and the Committee of the Regions. A New Circular Economy Action Plan For a Cleaner and More Competitive Europe COM/2020/98 Final. Available online: https://eur-lex.europa.eu/legal-content/EN/TXT/?qid=1583933814386&uri=COM:2020:98:FIN (accessed on 27 June 2024).
- European Commission. Agriculture and Rural Development. Agri-Food Data Portal. Rice Production. Available online: https://agridata.ec.europa.eu/extensions/DashboardRice/RiceProduction.html (accessed on 27 June 2024).
- Chen, H.; Wang, W.; Martin, J.C.; Oliphant, A.J.; Doerr, P.A.; Xu, J.F.; DeBorn, K.M.; Chen, C.; Sun, L. Extraction of Lignocellulose and Synthesis of Porous Silica Nanoparticles from Rice Husks: A Comprehensive Utilization of Rice Husk Biomass. ACS Sustain. Chem. Eng. 2013, 1, 254–259. [Google Scholar] [CrossRef]
- Mahdi, S.N.; Babu RD, V.; Shivakumar, M.; Abdullah, M.M.A.B. Mitigation of environmental problems using brick kiln rice husk ash in geopolymer composites for sustainable development. Curr. Res. Green Sustain. Chem. 2021, 4, 100193. [Google Scholar] [CrossRef]
- Overturf, E.; Ravasio, N.; Zaccheria, F.; Tonin, C.; Patrucco, A.; Bertini, F.; Canetti, M.; Avramidou, K.; Speranza, G.; Bavaro, T.; et al. Towards a more sustainable circular bioeconomy. Innovative approaches to rice residue valorization: The RiceRes case study. Bioresour. Technol. Rep. 2020, 11, 100427. [Google Scholar] [CrossRef]
- Eksambekar, S. Silica Extracted from Rice Husk for Greener Tires, The Economist. Available online: https://www.economist.com/science-and-technology/2013/01/05/hysterectomy (accessed on 17 July 2024).
- Solvay (2023, January 17). Solvay Launches Bio-Circular Silica in Europe, with Expansion Plans in North America. Available online: https://www.solvay.com/en/press-release/solvay-launches-bio-circular-silica-europe-expansion-plans-north-america (accessed on 17 July 2024).
- Nguyen, T.T.; Ma, H.T.; Avti, P.; Bashir MJ, K.; Ng, C.A.; Wong, L.Y.; Jun, H.K.; Ngo, Q.M.; Tran, N.Q. Adsorptive Removal of Iron Using SiO2 Nanoparticles Extracted from Rice Husk Ash. J. Anal. Chem. 2019, 2019, 6210240. [Google Scholar] [CrossRef] [PubMed]
- Amirhandeh, S.Z.H.; Salem, A.; Salem, S. Treatment of tannery wastewater by silica nanoparticles produced from rice husk ash via a green route. Environmental science and pollution research international. Environ. Sci. Pollut. Res. Int. 2023, 30, 13039–13047. [Google Scholar] [CrossRef]
- Porrang, S.; Rahemi, N.; Davaran, S.; Mahdavi, M.; Hassanzadeh, B. Preparation and in-vitro evaluation of mesoporous biogenic silica nanoparticles obtained from rice and wheat husk as a biocompatible carrier for anti-cancer drug delivery. Eur. J. Pharm. Sci. 2021, 163, 105866. [Google Scholar] [CrossRef]
- Yalçin, N.; Sevinç, V. Studies on silica obtained from rice husk. Ceram. Int. 2021, 27, 219–224. [Google Scholar] [CrossRef]
- Alyosef, H.A.; Eilert, A.; Welscher, J.; Ibrahim, S.S.; Denecke, R.; Schwieger, W.; Enke, D. Characterization of Biogenic Silica Generated by Thermo Chemical Treatment of Rice Husk. Part. Sci. Technol. 2013, 31, 524–532. [Google Scholar] [CrossRef]
- Bakar, R.; Yahya, R.; Gan, S.N. Production of High Purity Amorphous Silica from Rice Husk. Proc. Chem. 2016, 19, 189–195. [Google Scholar] [CrossRef]
- Chen, P.; Gu, W.; Fang, W.; Ji, X.; Bie, R. Removal of metal impurities in rice husk and characterization of rice husk ash under simplified acid pretreatment process. Environ. Prog. Sustain. 2017, 36, 830–837. [Google Scholar] [CrossRef]
- Xu, W.; Wei, J.; Chen, J.; Zhang, B.; Xu, P.; Ren, J.; Yu, Q. Comparative Study of Water-Leaching and Acid-Leaching Pretreatment on the Thermal Stability and Reactivity of Biomass Silica for Viability as a Pozzolanic Additive in Cement. Mater. 2017, 11, 1697. [Google Scholar] [CrossRef] [PubMed]
- Bakdash, R.S.; Aljundi, I.H.; Basheer, C.; Abdulazeez, I. Rice husk derived Aminated Silica for the efficient adsorption of different gases. Sci. Rep. 2020, 10, 19526. [Google Scholar] [CrossRef] [PubMed]
- Russo, B.; Causse, J.; Rey, C.; Lautru, J.; Rebiscoul, D.; Ayral, A. Biosourced adsorbent prepared with rice husk part 1: A complete understanding of the structure of materials, the major role of mineral impurities for metal extraction. Sustain. Mater. Techno. 2023, 36, e00601. [Google Scholar] [CrossRef]
- Sennoun, L.; Lee, C.C.; Fretel, Y.; Clavié, M.; Subra, G.; Ladner, Y.; Napoli, A.; Galarneau, A.; Hesemann, P.; Mehdi, A. Direct pseudomorphic transformation of silica from rice husk into organo-functionalized MCM-41. New J. Chem. 2024, 48, 7052–7069. [Google Scholar] [CrossRef]
- Liou, T.-H.; Yang, C.-C. Synthesis and surface characteristics of nanosilica produced from alkali-extracted rice husk ash. Mater. Sci. Eng. B 2011, 176, 521–529. [Google Scholar] [CrossRef]
- Gautam, N.; Rose, K.V.A.M.; Chaurasia, A.S. Study on chemical kinetics and characterization of nanosilica from rice husk and rice straw in the fixed-bed pyrolysis process. Biomass Convers. Biorefinery 2020, 12, 1435–1448. [Google Scholar] [CrossRef]
- Su, Y.; Liu, L.; Zhang, S.; Xu, D.; Du, H.; Cheng, Y.; Wang, Z.; Xiong, Y. A green route for pyrolysis poly-generation of typical high ash biomass, rice husk: Effects on simultaneous production of carbonic oxide-rich syngas, phenol-abundant bio-oil, high-adsorption porous carbon and amorphous silicon dioxide. Bioresour. Technol. 2020, 295, 122243. [Google Scholar] [CrossRef]
- Choudhary, P.; Sharma, R.; Kumar, V.; Singh, A.K.; Sharma, N. Synthesis, Characterization and Catalytic Activity of Bio-MCM-41 for Production of Bio Crude Oil via Pyrolysis of Rice Straw. Waste Biomass Valori. 2023, 14, 4173–4186. [Google Scholar] [CrossRef]
- Gu, S.; Zhou, J.; Luo, Z.; Wang, Q.; Ni, M. A detailed study of the effects of pyrolysis temperature and feedstock particle size on the preparation of nanosilica from rice husk. Ind. Crops Prod. 2013, 50, 540–549. [Google Scholar] [CrossRef]
- Gómez-Vásquez, R.; Fernández-Ballesteros, E.; Camargo-Trillos, D. Biogenic nanoporous oxides recovery from by-products of bioenergy production: Rice husks and corncob biochars. Biomass Bioenergy 2022, 161, 106455. [Google Scholar] [CrossRef]
- Jyothsna, G.; Bahurudeen, A.; Sahu, P.K. Sustainable utilisation of rice husk for cleaner energy: A circular economy between agricultural, energy and construction sectors. Mater. Today Sustain. 2024, 25, 100667. [Google Scholar] [CrossRef]
- Ahmaruzzaman, M.; Gupta, V.K. Rice Husk and Its Ash as Low-Cost Adsorbents in Water and Wastewater Treatment. Ind. Eng. Chem. Res. 2011, 50, 13589–13613. [Google Scholar] [CrossRef]
- Ghosh, N.; Das, S.; Biswas, G.; Haldar, P.K. Review on some metal oxide nanoparticles as effective adsorbent in wastewater treatment. Water Sci. Technol. 2022, 85, 3370–3395. [Google Scholar] [CrossRef] [PubMed]
- Rodriguez-Otero, A.; Vargas, V.; Galarneau, A.; Castillo, J.; Christensen, J.H.; Bouyssiere, B. Sustainable Harnessing of SiO2 Nanoparticles from Rice Husks: A Review of the Best Synthesis and Applications. Processes 2023, 11, 3373. [Google Scholar] [CrossRef]
- Saud, A.; Gupta, S.; Allal, A.; Preud’homme, H.; Shomar, B.; Zaidi, S.J. Progress in the Sustainable Development of Biobased (Nano)materials for Application in Water Treatment Technologies. ACS Omega 2024, 9, 29088–29113. [Google Scholar] [CrossRef]
- Zarezadeh-Mehrizi, M.; Badiei, A. Highly efficient removal of basic blue 41 with nanoporous silica. Water Resour. Ind. 2014, 5, 49–57. [Google Scholar] [CrossRef]
- Peres, E.C.; Slaviero, J.C.; Cunha, A.M.; Bandegharaei, A.H.; Dotto, G.L. Microwave synthesis of silica nanoparticles and its application for methylene blue adsorption. J. Environ. Chem. Eng. 2018, 6, 649–659. [Google Scholar] [CrossRef]
- Tsamo, C.; Kidwang, G.D.; Dahaina, D.C. Removal of Rhodamine B from aqueous solution using silica extracted from rice husk. SN Appl. Sci. 2020, 2, 256. [Google Scholar] [CrossRef]
- Grefa, D.D.A.; Sánchez, J.E.G.; Sánchez, L.R.B.; Alfonso, M.S.P.; Tagle, M.E.V. Rice husk ash as sorbent for solid phase extraction of diclofenac, ibuprofen and carboplatin residues from waters. Microchem. J. 2023, 195, 109361. [Google Scholar] [CrossRef]
- Mondal MI, H.; Chakraborty, S.C.; Rahman, M.S.; Marjuban SM, H.; Ahmed, F.; Zhou, J.L.; Zargar, M. Adsorbents from rice husk and shrimp shell for effective removal of heavy metals and reactive dyes in water. Environ. Pollut. 2024, 346, 123637. [Google Scholar] [CrossRef]
- Nandiyanto AB, D.; Nugraha, W.C.; Yustia, I.; Ragadhita, R.; Fiandini, M.; Meirinawati, H.; Wulan, D.R. Isotherm and kinetic adsorption of rice husk particles as a model adsorbent for solving issues in the sustainable gold mining environment from mercury leaching. J. Min. Inst. 2024, 265, 104–120. [Google Scholar]
- Chander, S.; Yadav, S.; Gupta, A.; Luhach, N. Sequestration of Ni (II), Pb (II), and Zn (II) utilizing biogenic synthesized Fe3O4/CLPC NCs and modified Fe3O4/CLPC@CS NCs: Process optimization, simulation modeling, and feasibility study. Environ. Sci. Pollut. Res. 2023, 30, 114056–114077. [Google Scholar] [CrossRef] [PubMed]
- Desmurs, L.; Galarneau, A.; Cammarano, C.; Hulea, V.; Vaulot, C.; Nouali, H.; Lebeau, B.; Daou, J.T.; Soares, C.V.; Maurin, G.; et al. Determination of Microporous and Mesoporous Surface Areas and Volumes of Mesoporous Zeolites by Corrected t-Plot Analysis. Chem. Nano Mat. 2022, 8, e202200051. [Google Scholar] [CrossRef]
- Spitzmüller, L.; Nitschke, F.; Rudolph, B.; Berson, J.; Schimmel, T.; Kohl, T. Dissolution control and stability improvement of silica nanoparticles in aqueous media. J. Nanoparticle Res. 2023, 25, 40. [Google Scholar] [CrossRef]
- Hu, S.; Jiang, L.; Wang, Y.; Su, S.; Sun, L.; Xu, B.; He, L.; Xiang, J. Effects of inherent alkali and alkaline earth metallic species on biomass pyrolysis at different temperatures. Bioresour. Technol. 2015, 192, 23–30. [Google Scholar] [CrossRef]
- Zhang, S.; Zhu, S.; Zhang, H.; Chen, T.; Xiong, Y. Catalytic fast pyrolysis of rice husk: Effect of coupling leaching with torrefaction pretreatment. J. Anal. Appl. Pyrolysis 2018, 133, 91–96. [Google Scholar] [CrossRef]
- Zhou, S.; Xue, Y.; Cai, J.; Cui, C.; Ni, Z.; Zhou, Z. An understanding for improved biomass pyrolysis: Toward a systematic comparison of different acid pretreatments. Chem. Eng. J. 2021, 411, 128513. [Google Scholar] [CrossRef]
- Galarneau, A.; Calin, N.; Iapichella, J.; Barrande, M.; Denoyel, R.; Coasne, B.; Fajula, F. Optimization of the properties of macroporous chromatography silica supports through surface roughness control. Chem Mater. 2009, 21, 1884–1892. [Google Scholar] [CrossRef]
- Agi, A.; Junin, R.; Gbadamosi, A.; Abbas, A.; Azli, N.B.; Oseh, J. Influence of nanoprecipitation on crystalline starch nanoparticle formed by ultrasonic assisted weak-acid hydrolysis of cassava starch and the rheology of their solutions. Chem. Eng. Process. 2019, 142, 107556. [Google Scholar] [CrossRef]
- Schneider, M.; Cesca, K.; Maria, S.; Hotza, D.; Rodríguez-Castellón, E.; Moreira, R. Synthesis and characterization of silica-based nanofluids for enhanced oil recovery. J. Mater. Res. Technol. 2023, 24, 4143–4152. [Google Scholar] [CrossRef]
- Musić, S.; Filipović-Vinceković, N.; Sekovanić, L. Precipitation of amorphous SiO2 particles and their properties. Braz. J. Chem. Eng. 2011, 28, 89–94. [Google Scholar] [CrossRef]
- Nayak, P.; Datta, A. Synthesis of SiO2-Nanoparticles from Rice Husk Ash and its Comparison with Commercial Amorphous Silica through Material Characterization. Silicon 2021, 13, 1209–1214. [Google Scholar] [CrossRef]
- Lal, M.; Sharma, P.; Ram, C. Synthesis and photocatalytic potential of Nd-doped TiO2 under UV and solar light irradiation using a sol-gel ultrasonication method. Results Mater. 2022, 15, 100308. [Google Scholar] [CrossRef]
- Al-Saida, B.; Sandouqa, A.; Shawabkeh, R.A.; Hussein, I. Synthesis of Nanosilica for the Removal of Multicomponent Cd2+ and Cu2+ from Synthetic Water: An Experimental and Theoretical Study. Molecules 2022, 27, 7536. [Google Scholar] [CrossRef]
- Gourmand, C.; Bertagnolli, C.; Brandel, J.; Hubscher-Bruder, V.; Boos, A. Bioinspired Mesoporous Silica for Cd(II) Removal from Aqueous Solutions. Ind. Eng. Chem. Res. 2022, 61, 8188–8203. [Google Scholar] [CrossRef]
- Mehdinia, A.; Mehrabi, H.; Jabbari, A. Polythionine grafted onto magnetic SBA-15 for the removal of cadmium ions from aqueous solutions: Isothermal and kinetic studies. New J. Chem. 2019, 43, 5582–5591. [Google Scholar] [CrossRef]
- Kamari, S.; Ghorbani, F. Synthesis of magMCM-41 with rice husk silica as cadmium sorbent from aqueous solutions: Parameters’ optimization by response surface methodology. Environ. Technol. 2016, 38, 1562–1579. [Google Scholar] [CrossRef]
- Simonescu, C.M.; Lavric, V.; Musina Antonescu, O.M.; Culita, D.C.; Marinescu, V.; Tardei, C.; Oprea, O.; Pandele, A.M. Experimental and modeling of cadmium ions removal by chelating resins. J. Mol. Liq. 2020, 307, 112973. [Google Scholar] [CrossRef]
- Snoussi, Y.; Abderrabba, M.; Sayari, A. Removal of cadmium from aqueous solutions by adsorption onto polyethylenimine-functionalized mesocellular silica foam: Equilibrium properties. J. Taiwan Inst. Chem. Eng. 2016, 66, 372–378. [Google Scholar] [CrossRef]
- Wang, P.; Shen, T.; Li, X.; Tang, Y.; Li, Y. Magnetic Mesoporous Calcium Carbonate-Based Nanocomposites for the Removal of Toxic Pb(II) and Cd(II) Ions from Water. ACS App. Nano Mat. 2020, 3, 1272–1281. [Google Scholar] [CrossRef]
- Andooz, A.; Eqbalpour, M.; Kowsari, E.; Ramakrishna, S.; Cheshmeh, Z.A. A comprehensive review on pyrolysis from the circular economy point of view and its environmental and social effects. J. Clean. Prod. 2023, 388, 136021. [Google Scholar] [CrossRef]


| RH Samples | Acid Washing Temperature (°C) | Acid Washing Time (h) | Pyrolysis 500 °C 1 h 10 °C/min | Calcination Slope (°C/min) | Calcination Temperature (°C) |
|---|---|---|---|---|---|
| AWRH1 | 100 | 3 | pyrolyzed | 10 | 700 for 3 h |
| AWRH2 | 100 | 3 | pyrolyzed | 2 | 700 for 3 h |
| AWRH3 * | 20 | 24 | - | 2 | 700 for 3 h |
| AWRH4 | 100 | 3 | - | 2 | 700 for 3 h |
| AWRH5 | 20 | 24 | pyrolyzed | 2 | 700 for 3 h |
| SiO2 | BET p/p0 Domain a | SBET m2/g | CBET | Vmes b mL/g | Dmes average nm |
|---|---|---|---|---|---|
| RH2-SiO2-2 | 0.049 < p/p0 < 0.15 | 329 | 91 | 0.35 | 6.5 |
| RH4-SiO2-2 | 0.058 < p/p0 < 0.34 | 233 | 68 | 0.27 | 6.5 |
| RH4-SiO2-3 | 0.049 < p/p0 < 0.34 | 266 | 76 | 0.31 | 6.5 |
| RH5-SiO2-1 | 0.083 < p/p0 < 0.34 | 208 | 58 | 0.24 | 6.5 |
| RH5-SiO2-2 | 0.142 < p/p0 < 0.34 | 190 | 49 | 0.22 | 6.5 |
| RH5-SiO2-3 | 0.169 < p/p0 < 0.34 | 188 | 61 | 0.22 | 6.5 |
| Silica | HCl 0.1M | Duration | Pyr/Calc | SBET-average m2/g | SBET Range m2/g |
|---|---|---|---|---|---|
| RH1-SiO2 | 100 °C | 3 h | Pyr 1 (10 °C/min) | 276 | 213–298 |
| RH2-SiO2 | 100 °C | 3 h | Pyr 1 (2 °C/min) | 317 | 304–325 |
| RH3-SiO2 | 20 °C | 24 h | Calc (2 °C/min) | 247 | 228–261 |
| RH4-SiO2 | 100 °C | 3 h | Calc (2 °C/min) | 249 | 232–266 |
| RH5-SiO2 | 20 °C | 24 h | Pyr 1 (2 °C/min) | 188 | 186–207 |
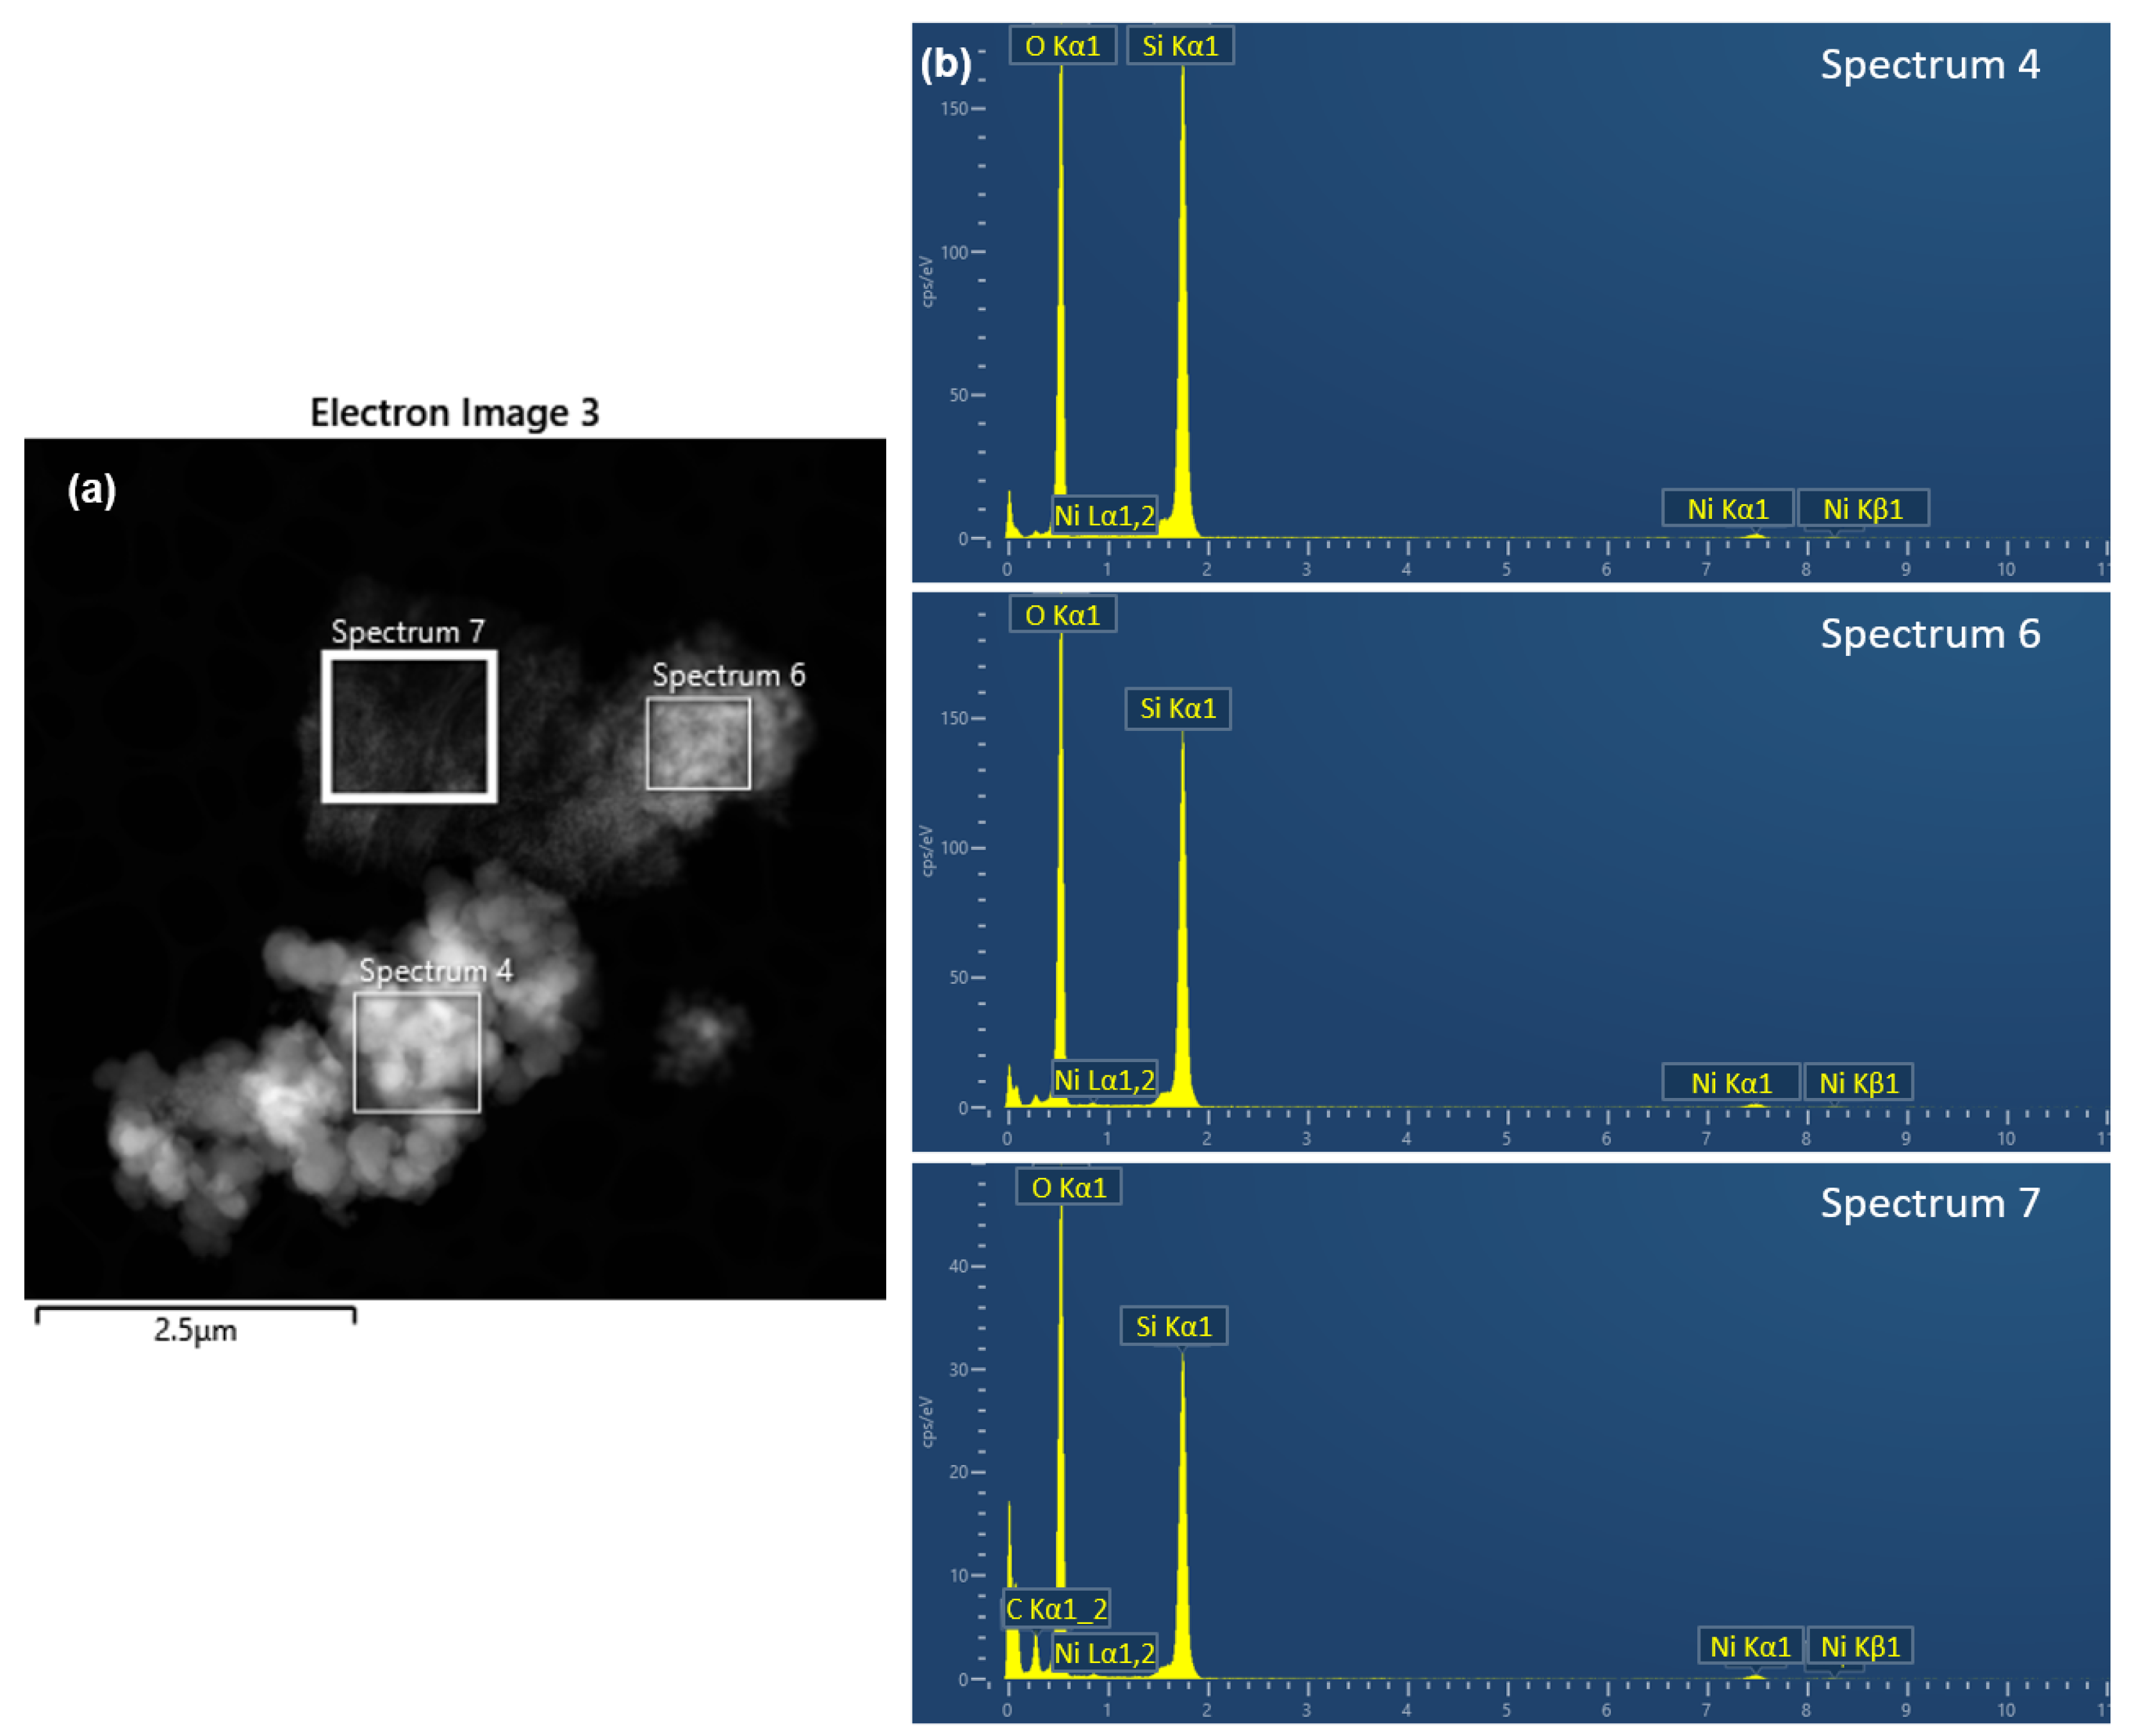
| Elements | Wt. % Spectrum 4 | σ | Wt. % Spectrum 6 | σ | Wt. % Spectrum 7 | σ | Wt. % Average | σ |
|---|---|---|---|---|---|---|---|---|
| O K | 50.76% | 0.3 | 56.91% | 0.3 | 60.26% | 0.3 | 55.98% | 0.5 |
| Si K | 49.24% | 0.3 | 43.09% | 0.3 | 39.74% | 0.3 | 44.02% | 0.5 |
| Total | 100.00% | 100.00% | 100.00% | 100.00% |
Disclaimer/Publisher’s Note: The statements, opinions and data contained in all publications are solely those of the individual author(s) and contributor(s) and not of MDPI and/or the editor(s). MDPI and/or the editor(s) disclaim responsibility for any injury to people or property resulting from any ideas, methods, instructions or products referred to in the content. |
© 2024 by the authors. Licensee MDPI, Basel, Switzerland. This article is an open access article distributed under the terms and conditions of the Creative Commons Attribution (CC BY) license (https://creativecommons.org/licenses/by/4.0/).
Share and Cite
Rodriguez-Otero, A.; Galarneau, A.; Drané, M.; Vargas, V.; Sebastian, V.; Wilson, A.; Grégoire, D.; Radji, S.; Marias, F.; Christensen, J.H.; et al. Towards Achieving Circular Economy in the Production of Silica from Rice Husk as a Sustainable Adsorbent. Processes 2024, 12, 2420. https://doi.org/10.3390/pr12112420
Rodriguez-Otero A, Galarneau A, Drané M, Vargas V, Sebastian V, Wilson A, Grégoire D, Radji S, Marias F, Christensen JH, et al. Towards Achieving Circular Economy in the Production of Silica from Rice Husk as a Sustainable Adsorbent. Processes. 2024; 12(11):2420. https://doi.org/10.3390/pr12112420
Chicago/Turabian StyleRodriguez-Otero, Alba, Anne Galarneau, Méghane Drané, Vicmary Vargas, Victor Sebastian, Andrew Wilson, David Grégoire, Sadia Radji, Frederic Marias, Jan H. Christensen, and et al. 2024. "Towards Achieving Circular Economy in the Production of Silica from Rice Husk as a Sustainable Adsorbent" Processes 12, no. 11: 2420. https://doi.org/10.3390/pr12112420
APA StyleRodriguez-Otero, A., Galarneau, A., Drané, M., Vargas, V., Sebastian, V., Wilson, A., Grégoire, D., Radji, S., Marias, F., Christensen, J. H., & Bouyssiere, B. (2024). Towards Achieving Circular Economy in the Production of Silica from Rice Husk as a Sustainable Adsorbent. Processes, 12(11), 2420. https://doi.org/10.3390/pr12112420