Article

The Gas Generation Process and Modeling of the Source Rock from the Yacheng Formation in the Yanan Depression, South China Sea

by
Liu Yang
1,2,*,
Gaoyuan Yan
1,2,
Yang Wang
3,
Yaoning Liu
1,
Xiujie Chen
1,
Tang Pan
1,4 and
Hanyu Zhang
3
1
School of Construction Management, Jiangsu Vocational Institute of Architectural Technology, Xuzhou 221116, China
2
Key Laboratory of CBM Resource and Reservoir-Generating Process, China Ministry of Education, Xuzhou 221008, China
3
Key Laboratory of Coalbed Methane Resources and Reservoir Formation Process, Ministry of Education, China University of Mining and Technology, Xuzhou 221008, China
4
Jiangsu Collaborative Innovation Center for Building Energy Saving and Construction Technology, Xuzhou 221116, China
*
Author to whom correspondence should be addressed.
Processes 2024, 12(11), 2476; https://doi.org/10.3390/pr12112476
Submission received: 23 September 2024 / Revised: 4 November 2024 / Accepted: 6 November 2024 / Published: 7 November 2024

Abstract

:
The research on deepwater oil and gas exploration areas is relatively limited, and sample collection is difficult. A drilled coal sample from Yanan Depression was used to investigate the hydrocarbon generation process, and the potential, by a gold tube thermal simulation experiment. The results show that the total gas yield was much higher than the oil yield. According to an analysis of the gas pyrolysis data, as represented by ln(C1/C2) and ln(C2/C3), the gas generation process consisted of two forms, namely, primary gas with ~1.33% Ro and secondary gas that occurred at levels greater than 1.33% Ro. The primary gas from kerogen was generated at ~1.33% Ro, which coincided with the %Ro value of the maximum oil yield. The activation energy distribution of the C1–C5 generation processes ranged from 54 to 72 kcal/mol, with a frequency factor of 6.686 × 10¹⁴ s−1 for the coal sample. We constructed the history of gas generation on the basis of the process and kinetic parameters, combined with data on the sedimentary burial and thermal history. The extrapolation of the gas history revealed that the gas has been generated from 5 Ma to the present, with a maximum yield of 178.5 mg/gTOC. This history suggests that the coal has good primary gas generation potential and provides favorable gas source conditions for the formation of gas fields. This study provides a favorable basis for expanding the effective source rock areas.

1. Introduction

Currently, the field of oil and gas exploration has shifted from conventional to unconventional resources and from onshore to offshore [1,2]. The Qiongdongnan Basin, located in the South China Sea, is the largest new area for oil and gas exploration in deep water (water depth greater than 500 m). The South China Sea is situated at the intersection of multiple tectonic plates, including the Eurasian Plate and the Pacific Plate, resulting in extremely complex geological conditions [1,2,3,4,5,6]. Compared to the well-studied coal-bearing strata in continental rift basins, the coal-measure strata in the Qiongdongnan Basin are characterized by greater thickness, thinner individual coal seams, poor regional stability, and higher thermal evolution [7,8]. The development and distribution characteristics, hydrocarbon generation features, and oil and gas migration and accumulation patterns of coal-rich zones and associated gas accumulation zones in the Qiongdongnan Basin are poorly understood, and exploration directions remain uncertain. Therefore, studying the hydrocarbon generation characteristics of source rocks holds significant theoretical importance and practical value for expanding oil and gas source areas and guiding the exploration of coal-derived hydrocarbons in marine environments.
Thermal simulation experiments are widely applied in unconventional resources, enabling the study of hydrocarbon generation and expulsion characteristics, hydrocarbon generation potential, and oil and gas retention features of source rocks. Many scholars utilize thermal simulation experiments to investigate the influence of temperature, pressure, aqueous media, and catalytic factors on the hydrocarbon generation process and potential within formations [9,10,11]. Han et al. observed that as the heating temperature increases, methane production and hydrocarbon generation gradually increase [12]. Pressure has no significant effect on the generation of primary pyrolysis gas but has a notable inhibitory effect on secondary pyrolysis gas. Thermal simulation experiments under abnormally high pressure have revealed that high pressure inhibits hydrocarbon generation conversion in samples, and this inhibitory effect on hydrocarbon generation intensifies with the enhancement of organic matter’s hydrocarbon generation capacity [13,14]. Comparative studies of thermal simulation experiments with and without water have found that water participates in hydrocarbon generation evolution, increasing hydrocarbon yield, and the composition of hydrocarbons generated in thermal simulations with water more closely resembles that of crude oil [15]. Research has shown that transition metal elements exhibit catalytic effects during the formation of natural gas, with the catalytic performance of common transition metal elements ranked as Ni, Fe, V, Co, and Cr [16]. Yang et al. discovered that coal undergoes four evolution stages, including kerogen degradation, kerogen cracking, oil cracking, and C2 cracking [17]. Research on the pore development characteristics of shale has found that from the mature to the highly mature stage, the total proportion of organic pores exceeds 50%, with a sharp increase in organic porosity. The types of organic pores transition from hydrocarbon contraction fractures to hydrocarbon bubble pores and hydrocarbon dissolution pores, providing the main space for gas storage. As samples are heated to the overmature stage, organic porosity gradually decreases [18]. Evidently, thermal simulation experiments have made significant progress in understanding the hydrocarbon generation process of source rocks, the characteristics of micrometer- to nanometer-scale pore structure changes during shale thermal evolution, and the co-evolutionary relationship between organic matter’s hydrocarbon generation and expulsion and the reservoir properties of mudstones and shales.
A KINETICS (2015) software was utilized for the calculation of kinetic parameters and their application in geological settings. The method of quantitatively assessing oil and gas resource potential using hydrocarbon generation kinetic parameters is relatively common [19,20]. The acquisition of hydrocarbon generation kinetic parameters typically relies on a series of mathematical models, which are based on experimental data and geological conditions [21,22,23]. The parallel first-order reaction model provides a better description of the organic matter pyrolysis process under complex geological conditions, assuming that each reaction has different activation energies and pre-exponential factors, and that the hydrocarbon generation process consists of multiple parallel first-order reactions. The overall reaction model, on the other hand, treats the organic matter pyrolysis process as a single overall reaction, without considering the formation and conversion of intermediate products. This model is simple and easy to use but may not accurately describe complex geological and chemical reaction processes.
Several geochemical studies have been conducted focusing on the geochemical characteristics and hydrocarbon generation potential of the source rocks in the Yanan Sag [24,25]. However, some results used other formations or other sag source rocks, which were from a similar geological background, instead of the Yanan Sag to determine the main gas generation time and potential [3,26]. Due to the significant differences in geological environments between marine coal-bearing basins and terrestrial basins, there may be biases in the evaluation of hydrocarbon generation potential. In this paper, coal from Yanan Depression was used to investigate the hydrocarbon generation process, potential, kinetic mechanism, and the construction of a generation model. This work will help to investigate the effective source area and gas migration and accumulation efficiency.

2. Samples and Methods

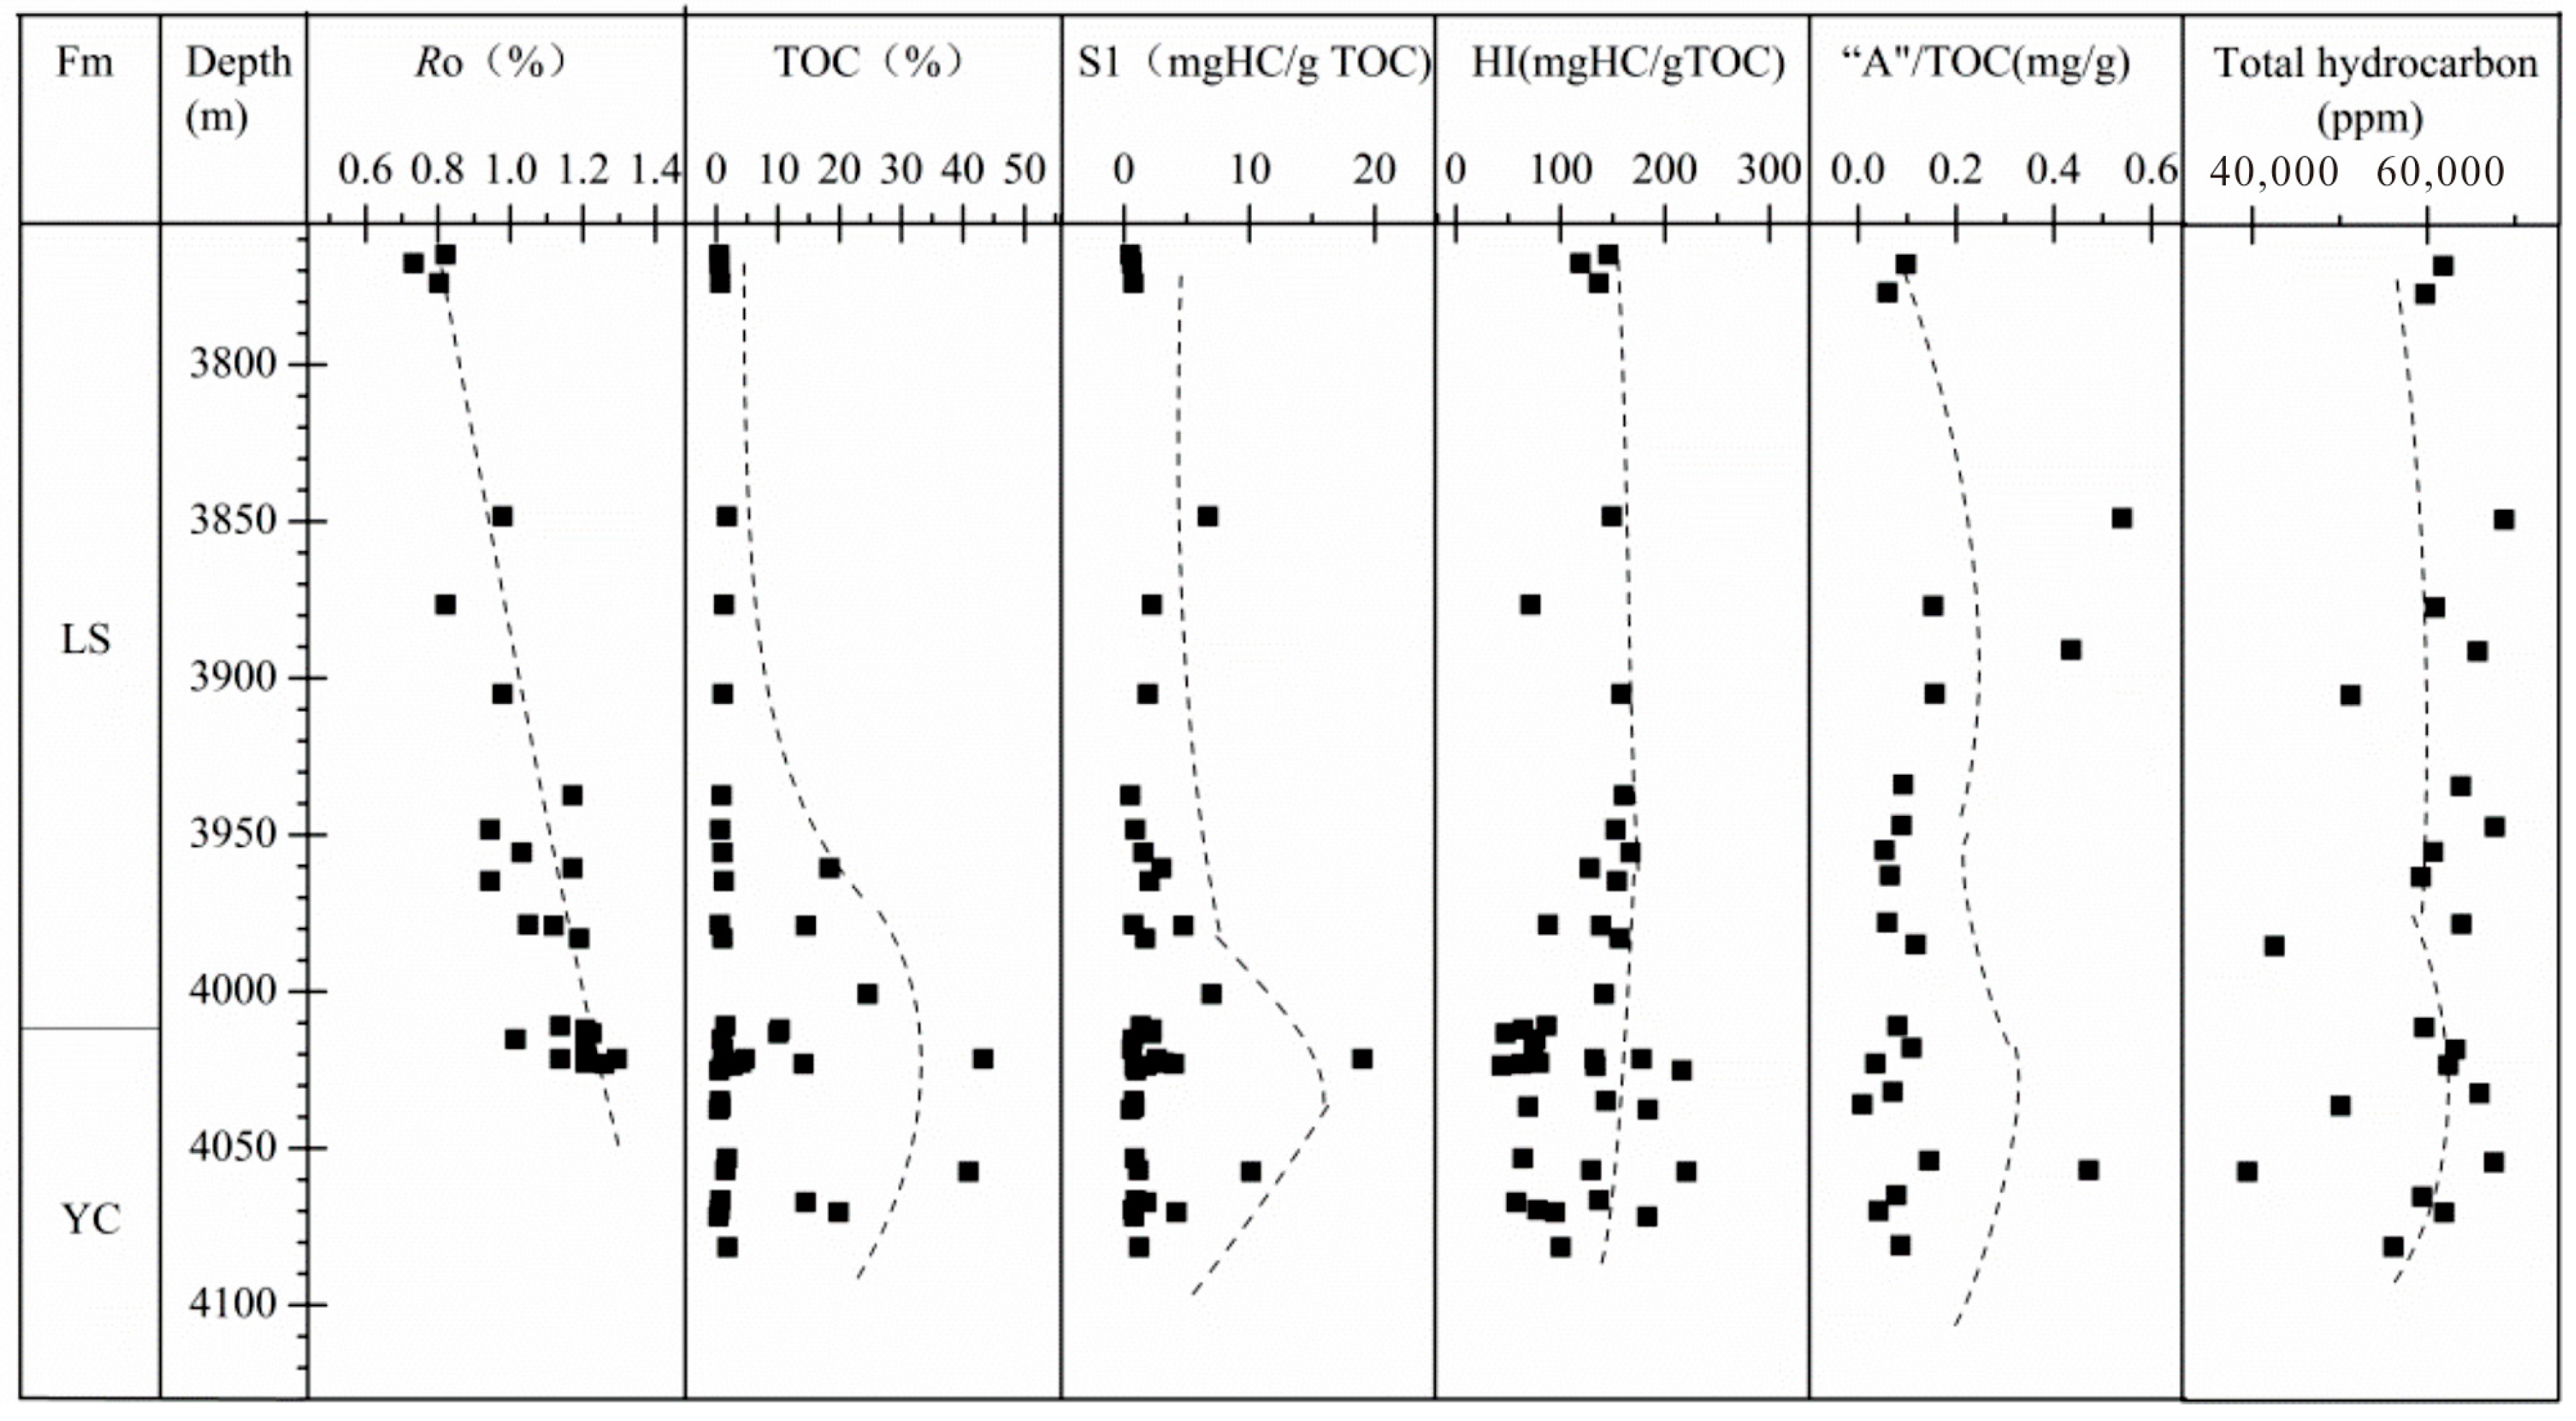
2.1. Geological Settings and Sample Location

The Qiongdongnan Basin, which is approximately 65,000 km2, is located in the northwest of the continental margin of the northern South China Sea. It is an NEE-striking basin that formed during the Cenozoic era. The Hainan Uplift is to its north, the Yongle Uplift is to its south, and the Yinggehai Basin is to its west (Figure 1) [3].
Qiongdongnan Basin underwent three phases of tectonic evolution: rifting during the Paleogene, depression during the Early Middle Miocene, and neotectonism since the Late Miocene [27,28] (Figure 2). In the Paleogene rifting stage, the basin was filled with Eocene lacustrine facies, Lower Oligocene Yacheng Fm transitional deposits, and marine facies of the Upper Oligocene. During the Upper Oligocene, Lingshui Fm neritic–bathyal deposits occurred from the bottom to the top. In the Neogene stage, the basin received deposits from the Miocene Sanya Fm, Meishan Fm, and Huangliu Fm; the Pliocene Yinggehai Fm; and Quaternary strata as bathyal marine deposits [24,25]. The coal-bearing strata and neritic shale of the Yacheng Formation are the main source rocks for hydrocarbons in the South China Sea. The coal seams in the Yacheng Formation are characterized by instability in their lateral distribution and poor continuity; they are numerous and mostly have a thickness ranging from a few centimeters to 1 m [1,2].

2.2. Experimental Sample

One coal sample was selected from the YC13-1-A2-well, which is 4020–4025 m from the Yacheng Formation (Figure 1). The values of S2 and TOC show the high abundance of organic matter, with the maceral composition dominated by vitrinite, and >90% of the kerogen in the sample was Type II2, as shown in Figure 3.

2.3. Gold Tube Pyrolysis Experiments

Pyrolysis experiments are an effective means of simulating the hydrocarbon generation process of source rocks under geological conditions, including open- [21,30], closed-, and semi-open systems [14]. Closed-system pyrolysis accounts for secondary reactions during petroleum generation, such as the cracking of petroleum into natural gas, with all products of the thermal maturation process being retained in a closed container. Various forms of containers are used, including the aqueous pyrolysis reactor [31], micro-sealed containers [32], and gold tubes [33]. Compared to the other two systems, closed-system pyrolysis appears to better simulate the effects of pressure, temperature, water, and minerals on the thermal evolution of hydrocarbon generation in source rocks, revealing the maximum gas generation potential during source rock thermal evolution and reducing the loss of thermal evolution products from the source rock.
A closed pyrolysis system experiment was completed at Guangzhou Institute of Geochemistry, Chinese Academy Sciences. The testing process and equipment are shown in Figure 4 and Figure 5. The sample (Figure 4d), after being ground to 200 mesh, was divided into 24 parallel aliquots and placed into separate gold tubes (Figure 4e), which were then sealed on one end under argon protection. Thereafter, the sealed gold tubes were placed in autoclaves (Figure 4b). The samples in the autoclaves were heated in a single oven to the target temperature. The experimental pressure was 50 MPa, with an error of <1 MPa observed during the entire pyrolysis procedure [34]. The temperature was programmed to increase at 2 °C/h and 20 °C/h, with the final target temperatures ranging from 300 to 600 °C. Finally, the tubes were taken out of the autoclave every 24 °C and brought down in temperature, and the hydrocarbon products tested using an Agilent 6890 GC (Agilent, Santa Clara, USA) (Figure 4c). The test data of 24 tubes are listed in Table 1.

2.4. Quantification of Pyrolysis Products

(1)
Hydrocarbon gas (C1–C5) yield
The surfaces of the gold tubes were cleaned with methylene chloride (CH2Cl2). The tubes were then pierced with a needle in a high-vacuum chamber at room temperature, allowing all the generated gases to flow into the line. The collected gases were automatically transferred to a gas chromatograph (GC) for an analysis of their composition. The hydrocarbon gases were analyzed on an HP Agilent 6890 (Agilent, Santa Clara, CA, USA), with helium as a carrier gas. An external standard was added to quantify the C1–C5 hydrocarbons. A Paraplot column (0.53 mm × 50 m, Al2O3/KCl coating) was used on the GC. Units of mL/g were used for the quantitative determination of the gas, and repeated experiments demonstrated relative errors of less than 0.5%. The total gas was a mixture of gases with different molecular weights in a closed environment under closed conditions, and the gas production rate would be overestimated when expressed as a volume production rate [34]. Therefore, the volume production rate of the gas was converted into a mass production rate, which, in turn, was converted into a unit production rate of TOC.
(2)
Hydrocarbon oil (C6–C14, C15+) yield
After the gas analysis, the volatile hydrocarbons (C6–C14) were collected via liquid nitrogen freezing in a small bottle; then, n-hexane was injected into the bottle, which was placed on an ultrasonic oscillation instrument. Before the quantitative analysis of the C6–C14 compounds, an internal standard (deuterium C24) was added to the bottle. An HP Agilent 6890 GC, equipped with a DB-5 capillary column (Agilent, Santa Clara, CA, USA) (60 m × 0.32 mm), with helium as a carrier gas and an FID detector, was used to analyze the light hydrocarbons (C6–C14). After that, the samples were dried and cleaned with nitrogen. CH2Cl2 was added to the bottle and stirred for 30 min under ultrasonic oscillation. The tubes were allowed to stand for several hours; then, they were suction filtered. Finally, heavy oil (C15+) was quantified using the same methods as above, with units of mg/g.

2.5. KINETICS Analysis

On the basis of the experimental data, reaction kinetic parameters were calculated using the KINETICS (2015) software, developed by Lawrence Livermore National Key Laboratory of Stanford University, USA, and a first-order reaction kinetic model providing general information about the overall reaction kinetics [35] discrete model was applied. The equations are as follows:
d x d T = A φ ( 1 x ) e x p ( E / R T )
where E stands for the activation energy, A is the frequency factor, x is the fraction of the sample which has decomposed in time t, R is the gas constant (8.314 J/molK), φ is the heating rate, and T is the absolute temperature.

3. Results and Discussions

3.1. Experiment Results

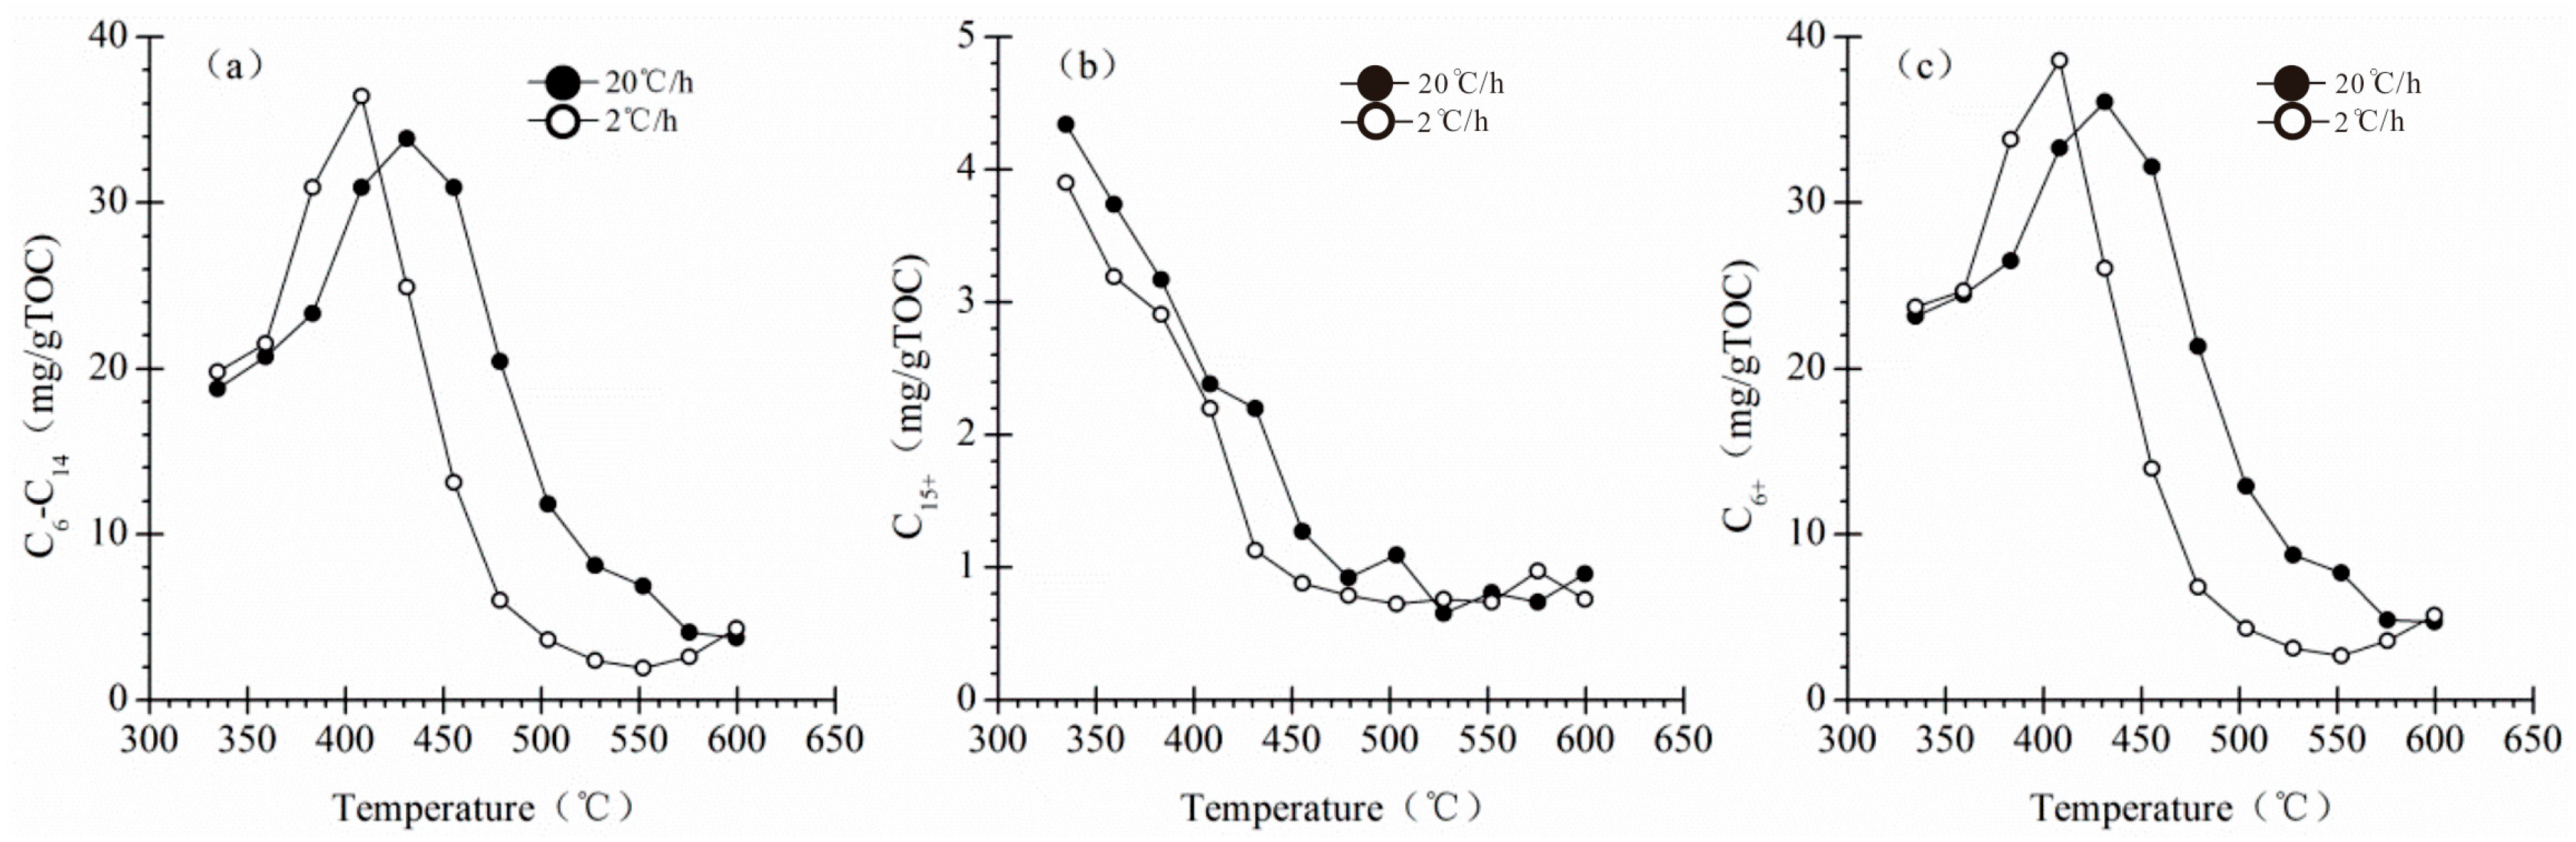
3.1.1. Pyrolysis Oils

The total oil fraction in our experiment was divided into C6–14 and C15+ compounds. The concentration profiles of the pyrolysis temperatures of C6–14, C15+, and C6+ are shown in Table 1 and Figure 6. The evolution of all the products was similar at both heating rates. As the temperature increased, the concentration of C15+ decreased, and C6–14 reached its peak yield at temperatures of 436 °C and 408 °C at heating rates of 20 °C/h and 2 °C/h, respectively; then the yield began to decrease. C6+ had the same form as C6–14, including the peak temperature. When the concentration declines in a closed pyrolysis system, it is generally recognized that the cracking rate of the product is significantly higher than its generation rate [20,36].

3.1.2. Pyrolysis Gases

The characteristics of individual pyrolysis products are important [37]. The C1 accumulative yield increased as the pyrolysis temperature increased, and the yield at the heating rate of 20 °C/h was lower than that at the heating rate of 2 °C/h (Figure 7a). This result means that the C1 concentration at a slow heating rate was higher than that at a fast heating rate at the same pyrolysis temperature. The other individual gases (C2–C5) had maximum yields at both heating rates (Figure 7b–d), which is different from C1.
The yield of methane increased slowly at the beginning of the temperature increase, below 400 °C for 20 °C/h or 375 °C for 2 °C/h. The methane then increased rapidly during pyrolysis (Figure 7a). The heavy hydrocarbon gases (C2–5) increased continuously with an increase in the temperature, until 475 °C for 20 °C/h or 425 °C for 2 °C/h, reaching the maximum yield (Figure 7e). After reaching the peak values, the heavy hydrocarbon gases began to crack. The dry coefficient (C1/∑C1–5%) decreased at the beginning and then began to increase to a limit value (Figure 7f). This pattern shows that the content of heavy gas in the low-temperature stage was significantly higher than that of methane [36]. Studies have shown that as pressure increases, at the same temperature, the degradation rates of kerogen and coal accelerate, leading to an increase in the yield of liquid hydrocarbons and a decrease in the yield of gaseous hydrocarbons in the thermal evolution products [38]. The main focus of this study is on the impact of temperature on hydrocarbon generation. The pressure condition is constant pressure.

3.2. Hydrocarbon Generation Characteristics

C1–C 3 gases under different temperatures are helpful for distinguishing whether methane comes from the cracking of kerogen or oil [39]. Two sensitive values of C1/C2 and C2/C3 can be used to divide the evolution stages [40]. Scatter diagrams of ln(C1/C2) and ln(C2/C3) are shown in Figure 8. The organic matter evolution processes were periodic and could be divided into four stages at the two heating rates.
Taking the heating rate of 2 °C/h (Figure 8b) as an example, the first stage (I) was <384 °C, where the main characteristics were that ln(C2/C3) first increased and then suddenly decreased and that ln(C1/C2) gradually decreased. Toward the end of this stage, the concentration of C3 was higher than that of C2, and the concentration of C2 was higher than that of C1 at 384 °C. According to the evidence described above, we defined this stage as the thermal degradation of kerogen [41]. The second stage (II) was from 384 to 408 °C. An increase in lnC1/C2 indicated that the methane and C1 yields were greater than the C2 yield. The increasing rates of evolution of ethane and propane were similar, according to the modest increase in lnC2/C3. This feature is a typical characteristic of kerogen pyrolysis [40,42]. We noted that lnC1/C2 and lnC2/C3 increased rapidly, indicating that the methane and ethane concentrations increased rapidly due to the secondary cracking of oil. Thus, the third (III) stage, from 432 °C to 504 °C, was named the oil cracking stage [42]. The fourth (IV) stage was from 504 °C to 600 °C, where lnC1/C2 and lnC2/C3 still increased, but lnC2/C3 slowed compared with the third stage, indicating C2 cracking.
As illustrated in Figure 7 and Figure 8, the slow heating rate means that a longer lead time, which generates more hydrocarbons, was required for the higher temperatures to reach the same yield as the fast heating rate [3,41]. To unify the scale under various conditions, it was necessary to construct the relationship between the hydrocarbon yield and vitrinite reflectance (Easy%Ro) 33 to better understand the characteristics of hydrocarbon generation from coal. Here, we based our analysis on the Easy%Ro model to calculate the values of %Ro for various temperatures in our experimental data [43].
From the Easy%Ro and evolution stages discussed above, the characteristics of hydrocarbon generation during increases in the vitrinite reflectance are shown in Figure 9. Hydrocarbon gases were generated in small amounts at low maturity (<0.8%), and the total yield was lower than the oil yield. The process of cracking C6+ gases could be neglected [41,44,45]. When C2 cracking occurred at a high maturity level, the total gases continuously increased rapidly, so C2 cracking was not the only way that methane was generated in this stage. Overall, we inferred the C1–C5 hydrocarbon gas yield for coal to be approximately 1.33% as the maximum yield of the coal’s primary gas and >1.33% as the secondary gas dominated by oil cracking. In other words, the %Ro of the maximum oil (C6–14) yield was the same as the threshold %Ro of primary and secondary gas. This pattern is similar to the gas generation process of oil-bearing mudstone [46].

3.3. Kinetics of Gas Generation

The kinetic parameters showed no significant differences from those of the source rock and its kerogen [45]. Thus, isolating kerogen from the source rock to calculate the kinetic parameters was unnecessary [46]. With the aim of calculating the gas potential of the source rock, the kinetic parameters of the total hydrocarbon gas were calibrated in the test rather than those of the compound-specific gas. The kinetic parameters of the reaction, including the activation energy and frequency factor, were calculated using KINETICS (2015) software. As shown in Figure 10, the curve fit of the parameters calculated using the software was similar to that of the experimental data, which were feasibly extrapolated to geological conditions. The activation energy (Ea) distribution of generating C1–5 ranged from 54 to 72 kcal/mol, with a frequency factor of 6.686 × 10¹⁴ s−1 for the coal sample from the Yacheng Formation.

3.4. Gas Generation History and Potential

Kinetic parameters are helpful for overcoming the uncertainty in evaluating kinetics and can be reasonably extrapolated to calculate the history of hydrocarbon generation [47]. Hydrocarbon generation is generally affected by burial history and geotemperature. The YC13-1-A2-well’s burial history and Ro were determined from the Yacheng Formation’s source rocks, whereas the well’s data were provided by the Institute, Zhanjiang Branch of CNOOC Ltd (CNOOC Ltd, Hong Kong, China), and the paleogeothermal gradients used (4.0 °C/100 m) were from Xiao [4]. The simulation results showed that the burial depths of the Yacheng Formation ranged from 4010 m to 4130 m, and the maximum burial temperature within this well at present can reach 160 °C (Figure 11). The calculated vitrinite reflectance value was 0.7–1.3% Ro, indicating that the source rocks reached the oil and gas generation stage between approximately 5 Ma and now (Figure 11). The temperature and Ro simulations were verified using measured vitrinite reflectance data and other geochemical parameters (Figure 12), indicating that the parameters of this model were credible.
According to the modeling results, the gas generation history and potential were determined, as shown in Figure 13. As discussed above, the hydrocarbon gas generated from the coal’s source rock below 1.33% Ro can be considered the main primary gas. In geological time, the coal from the Yacheng Formation experienced the primary gas generation stage from 5 Ma to now, reaching a maximum generation yield of 178.5 mg/gTOC. Although the vertical and lateral stabilities of the coal seam in the Yanan Depression are not good, the total thickness and gas yield are significant in the Yacheng Formation coal’s source rocks. This structure can provide favorable conditions as a gas source for the formation of large- and medium-sized gas fields.

4. Conclusions

Coal samples from the YC13-1-A2-well of the Yanan Depression were pyrolyzed in sealed gold tubes under constant pressure and non-isothermal heating conditions to investigate the evolutionary characteristics and potential of gas generation over geological time. The following results were obtained:
(1)
The total gas yield was much higher than the oil yield. The generated gas consisted of two types, namely, primary gas, including the kerogen degradation and cracking stages, and secondary gas, which contained the oil and C2 cracking stages. The threshold %Ro of the two types was 1.33% Ro.
(2)
The activation energy distribution of C1 to C5 generation ranged from 54 to 72 kcal/mol, with a frequency factor of 6.686 × 10¹⁴ s−1 for the Yacheng Formation coal sample. Models of the gas generation history and potential were proposed based on burial and thermal history, as well as kinetic parameters. The extrapolation of the gas revealed that the gas has been generated from 5 Ma to the present and that the source rocks in the Yanan Depression have not reached maturity for secondary gas. This structure can provide favorable conditions as a gas source for the formation of gas fields.
(3)
In subsequent research, the geological characteristics of source rock formations can be combined to study the hydrocarbon generation characteristics under different conditions, such as temperature, pressure, aqueous media, and catalysts, in order to reveal the complex processes of oil and gas accumulation.

Author Contributions

Conceptualization, L.Y. and G.Y.; methodology, L.Y.; software, L.Y., G.Y. and Y.W.; validation, L.Y., G.Y. and Y.L.; formal analysis, L.Y. and G.Y.; investigation, L.Y.; resources, G.Y.; data curation, G.Y.; writing—original draft preparation, L.Y.; writing—review and editing, L.Y., G.Y., Y.W., Y.L., X.C., T.P. and H.Z.; visualization, G.Y.; supervision, L.Y.; project administration, Y.W. and Y.L.; funding acquisition, L.Y. All authors have read and agreed to the published version of the manuscript.

Funding

This research was funded by the National Natural Science Foundation of China (42172156, 41802183), Xuzhou Science and Technology Plan Project, Basic Science and Technology Project (KC22032), General Project of Natural Science Research in Jiangsu Higher Education Institutions (21KJB170018, 23KJD560001), School-Level Scientific Research Project of Jiangsu Vocational Institute of Architectural Technology (JYJBZX2019), and Young Ph.D. Fund of Jiangsu Collaborative Innovation Center for Building Energy Saving and Construction Technology (SJXTBS2115).

Data Availability Statement

Data are contained within this article.

Acknowledgments

We would like to thank the Key Laboratory of CBM Resource and Reservoir-Generating Process for all the support provided in this research.

Conflicts of Interest

The authors declare that they have no known competing financial interests or personal relationships that could have appeared to influence the work reported in this paper.

References

  1. Zhang, G.C.; Ji, M.; Chen, Y.; Gan, J.; Wang, D.D.; Zhang, C.Y. Cumulation characteristics and exploration potentials of gas accumulation belt in Qiongdongnan Basin. Acta Pet. Sin. 2024, 45, 226–240, (In Chinese with English Abstract). [Google Scholar]
  2. Zhang, G.C.; Wang, D.D.; Lan, L.; Liu, S.X.; Su, L.; Wang, L.; Tang, W.; Guo, J.; Sun, R. The geological characteristics of the large- and medium-sized gas fields in the South China Sea. Acta Oceanol. Sin. 2021, 40, 1–12. [Google Scholar] [CrossRef]
  3. Li, W.H.; Zhang, Z.H.; Zheng, K.; Li, Y.C. Geochemical Characteristics and Developmental Models of the Eocene Source Rocks in the Qiongdongnan Basin, Northern South China Sea. Energy Fuels 2017, 31, 13011–14430. [Google Scholar] [CrossRef]
  4. Xiao, X.M.; Xiong, M.; Tian, H.; Wilkins, R.W.T.; Huang, B.J.; Tang, Y.C. Determination of the source area of the Ya13–1 gas pool in the Qiongdongnan Basin, South China Sea. Org. Geochem. 2006, 37, 990–1002. [Google Scholar] [CrossRef]
  5. Xie, Y.H.; Wang, Z.F.; Tong, C.X. Petroleum geology of Yacheng 13-1, the largest gas field in China’s offshore region. Mar. Petrol. Geol. 2008, 25, 433–444. [Google Scholar] [CrossRef]
  6. Pang, H.; Ma, K.Y.; Huo, X.G.; Huang, X.M.; Wu, S.; Zhang, X.G. Crude Oil Source and Accumulation Models for the WenchangFormation, Southern Lufeng Sag, Pearl River Mouth Basin, (Offshore) China. Minerals 2023, 13, 162. [Google Scholar] [CrossRef]
  7. Wang, D.D.; Zhang, G.C.; Li, Z.X.; Dong, G.Q.; Sun, R.; Guo, S.; Wu, Y. The development characteristics and distribution predictions of the Paleogene coal-measure source rock in the Qiongdongnan Basin, northern South China Sea. Acta Geol. Sin. (Engl. Ed.) 2021, 95, 105–120. [Google Scholar] [CrossRef]
  8. Zhang, G.C.; Chen, Y.; Wang, D.D.; Li, Z.X. Cenozoic giant coal-bearing basin belt discovered in China’s sea area. Acta Oceanol. Sin. 2023, 42, 101–112. [Google Scholar] [CrossRef]
  9. Han, W.X.; Luo, X.; Lin, S.H.; Zhao, Z.Y.; Liu, J.Z.; Wang, Q. Geochemical parameters of thermal simulation of gas generation on lacustrine Type II shales in semi-open pyrolysis system. Geoenergy Sci. Eng. 2023, 231, 212178. [Google Scholar] [CrossRef]
  10. Behar, F.; Roy, S.; Jarvie, D. Artificial maturation of a Type I kerogen in closed system: Mass balance and kinetic modelling. Org. Geochem. 2010, 41, 1235–1247. [Google Scholar] [CrossRef]
  11. Ronald, J.H.; Tang, Y.; Kaplan, I.R. Insights into oil cracking based on laboratory experiments. Org. Geochem. 2003, 34, 1651–1672. [Google Scholar]
  12. Han, H.; Zhong, N.N.; Huang, C.X.; Zhang, W. Pyrolysis kinetics of oil shale from northeast China: Implications from thermogravimetric and Rock–Eval experiments. Fuel 2015, 159, 776–783. [Google Scholar] [CrossRef]
  13. Al Darouich, T.; Behar-Largeau, F.C.; Largeau, C. Pressure effect on the thermal cracking of the light aromatic fraction of Safaniya crude oil—Implications for deep prospects. Org. Geochem. 2006, 37, 1155–1169. [Google Scholar] [CrossRef]
  14. Wu, Y.D.; Ji, L.M.; He, C.; Zhang, Z.N.; Zhang, M.Z.; Sun, L.; Su, L.; Xia, Y.Q. The effects of pressure and hydrocarbon expulsion on hydrocarbon generation during hydrous pyrolysis of Type-I kerogen in source rock Yuandong. J. Nat. Gas Sci. Eng. 2016, 34, 1215–1224. [Google Scholar] [CrossRef]
  15. Lewan, M.D.; Roy, S. Role of water in hydrocarbon generation from Type-I kerogen in Mahogany oil shale of the Green River Formation. Org. Geochem. 2011, 42, 31–41. [Google Scholar] [CrossRef]
  16. Mango, F.D.; Elrod, L.W. The carbon isotope composition of catalytic gas: A comparative analysis with natural gas. Geochim. Cosmochim. Acta 1999, 63, 1097–1106. [Google Scholar] [CrossRef]
  17. Liu, Y.; Qin, Y.; Shi, Y.; Shen, Y.L. Hydrocarbon evolution during pyrolysis of source rocks of Yacheng coal formation from the Yanan depression in the South China Sea. Pet. Sci. Technol. 2016, 34, 601–608. [Google Scholar]
  18. Shi, M.; Yu, B.S.; Zhang, J.C.; Huang, H.; Yuan, Y.; Li, B. Evolution of organic pores in marine shales undergoing thermocompression: A simulation experiment using hydrocarbon generation and expulsion. J. Nat. Gas Sci. Eng. 2018, 59, 406–413. [Google Scholar] [CrossRef]
  19. Ungerer, P.; Pelet, R. Extrapolation of oil and gas formation kinetics from laboratory experiments to sedimentary basins. Nature 1987, 327, 52–54. [Google Scholar] [CrossRef]
  20. Behar, F.; Kressmann, S.; Rudkiewicz, J.L.; Vandenbroucke, M. Experimental simulation in a confined system and kinetic modelling of kerogen and oil cracking. Org. Geochem. 1991, 19, 173–189. [Google Scholar] [CrossRef]
  21. Peters, K.E.; Walters, C.C.; Mankiewicz, P.J. Evaluation of kinetic uncertainty in numerical models of petroleum generation. AAPG Bull. 2006, 90, 387–403. [Google Scholar] [CrossRef]
  22. Cramer, B.; Faber, E.; Gerling, P.; Krooss, B.M. Reaction kinetics of stable carbon isotopes in natural gas: Insights from dry, open system pyrolysis experiments. Energy Fuels 2001, 15, 517–532. [Google Scholar] [CrossRef]
  23. Berner, U.; Faber, E.; Scheeder, G.; Panten, D. Primary cracking of algal and land plant kerogens: Kinetic models of isotope variations in methane, ethane, and propane. Chem. Geol. 1995, 126, 233–245. [Google Scholar] [CrossRef]
  24. Zhu, W.L.; Huang, B.J.; Mi, L.J. Key geological problems in oil and gas exploration in the deep water area of the northern south China sea. AAPG Bull. 2009, 93, 741–761. [Google Scholar] [CrossRef]
  25. Su, L.; Zheng, J.J.; Chen, G.J.; Zhang, G.C.; Guo, J.M.; Xu, Y.C. The upper limit of maturity of natural gas generation and its implication for the Yacheng formation in the Qiongdongnan Basin, China. J. Asian Earth Sci. 2012, 54, 203–213. [Google Scholar] [CrossRef]
  26. Huang, B.J.; Xiao, X.M.; Li, X. Geochemistry and Origins of Natural Gases in the Yinggehai and Qiongdongnan Basins, Offshore South China Sea. Org. Geochem. 2003, 34, 1009–1025. [Google Scholar] [CrossRef]
  27. Ru, K.; Pigott, J.D. Crustal Structure and Tectono–Magmatic Evolution of Northern South China Sea. AAPG Bull. 1986, 70, 1136–1155. [Google Scholar]
  28. Clayton, J.L. Geochemistry of caolbed gas—A review. Int. J. Coal Geol. 1998, 37, 155–178. [Google Scholar]
  29. Shalaby, M.R.; Hakimi, M.H.; Abdullah, W.H. Geochemical characteristics and hydrocarbon generation modeling of the Jurassic source rocks in the Shoushan Basin, north Western Desert, Egypt. Mar. Pet. Geol. 2011, 28, 1611–1624. [Google Scholar] [CrossRef]
  30. Peters, K.E.; Burnham, A.K.; Walters, C.C.; Schenk, O. Guidelines for kinetic input to petroleum system models from open-system pyrolysis. Mar. Pet. Geol. 2018, 92, 979–986. [Google Scholar] [CrossRef]
  31. Lewan, M.D.; Winters, J.C.; McDonald, J.H. Generation of oil-like pyrolyzates from organic-rich shales. Science 1979, 203, 897–899. [Google Scholar] [CrossRef] [PubMed]
  32. Harrison, A.; Cracknell, R.F.; Krueger-Venus, J.; Sarkisov, L. Branched versus linear alkane adsorption in carbonaceous slit pores. Adsorption 2014, 20, 427–437. [Google Scholar] [CrossRef]
  33. Behar, F.; Vandenbroucke, M.; Tang, Y.; Marquis, F.; Espitalie, J. Thermal cracking of kerogen in open and closed systems: Determination of kinetic parameters and stoichiometric coefficients for oil and gas generation. Org. Geochem. 1997, 26, 321–339. [Google Scholar] [CrossRef]
  34. Tian, H.; Xiao, X.M.; Wilkins, R.W.T.; Li, X.Q.; Gan, H.J. Gas sources of the YN2 gas pool in the Tarim Basin—Evidence from gas generation and methane carbon isotope fractionation kinetics of source rocks and crude oils. Mar. Petrol. Geol. 2007, 24, 29–41. [Google Scholar] [CrossRef]
  35. Jaber, J.O.; Probert, S.D. Reaction kinetics of fluidised bed gasification of Jordanian oil shales. Int. J. Therm. Sci. 2000, 39, 295–304. [Google Scholar] [CrossRef]
  36. Behar, F.; Vandenbroucke, M.; Teermann, S.C.; Hatcher, P.G.; Leblond, C.; Lerat, O. Experimental simulation of gas generation from coals and a marine kerogen. Chem. Geol. 1995, 126, 247–260. [Google Scholar] [CrossRef]
  37. Schoell, M. Genetic characterization of natural gases. AAPG Bull. 1983, 67, 2225–2238. [Google Scholar]
  38. Guo, R.C.; Zhang, G.L.; Zeng, Z.P.; Wang, Q.J.; Zhao, L.Q.; Wang, J.W.; Yu, T.F.; Gao, J.X. Analysis of controlling effect of temperature–pressure conditions on hydrocarbon generation of source rocks. Front. Earth Sci. 2022, 10, 856984. [Google Scholar] [CrossRef]
  39. Wang, Q.T.; Lu, H.; Greenwood, P.; Shen, C.C.; Liu, J.Z.; Peng, P.A. Gas evolution during kerogen pyrolysis of Estonian Kukersite shale in confined gold tube system. Org. Geochem. 2013, 65, 74–82. [Google Scholar] [CrossRef]
  40. Liu, W.H.; Wang, J.; Tenger; Qin, J.Z.; Zheng, L.J. Stable carbon isotopes of gaseous alkanes as genetic indicators inferred from laboratory pyrolysis experiments of various marine hydrocarbon source materials from southern China. Sci. China Earth Sci. 2012, 55, 966–974. [Google Scholar] [CrossRef]
  41. Hill, R.J.; Zhang, E.; Katz, B.J.; Tang, Y.C. Modeling of Gas Generation from the Barnett Shale, Fort Worth Basin, Texas. AAPG Bull. 2007, 91, 501–521. [Google Scholar] [CrossRef]
  42. Jenden, P.D.; Drazan, D.J.; Kaplan, I.R. Mixing of thermogenic natural gases in northern Appalachian Basin. AAPG Bull. 1993, 77, 980–998. [Google Scholar]
  43. Sweeney, J.J.; Burnham, A.K. Evaluation of a Simple Model of Vitrinite Reflectance Based on Chemical Kinetics. AAPG Bull. 1990, 74, 1559–1570. [Google Scholar]
  44. Xie, L.J.; Sun, Y.G.; Wang, F.Y.; Jiang, A.Z.; Chen, J.P. Experimental study on the gas generation processes of lacustrine and marine shales in North China: Source implications for shale gas. Mar. Petrol. Geol. 2015, 67, 204–216. [Google Scholar] [CrossRef]
  45. Reynolds, J.G.; Burnham, A.K. Comparison of kinetic analysis of source rocks and kerogen concentrates. Org. Geochem. 1995, 23, 11–19. [Google Scholar] [CrossRef]
  46. Wang, Q.; Zou, H.Y.; Hao, F.; Zhu, Y.M.; Zhou, X.H.; Wang, Y.B.; Tian, J.Q.; Liu, J.Z. Modeling hydrocarbon generation from the Paleogene source rocks in Liaodong Bay, Bohai Sea: A study on gas potential of oil–prone source rocks. Org. Geochem. 2014, 76, 204–219. [Google Scholar] [CrossRef]
  47. Zhang, E.; Hill, R.J.; Katz, B.J.; Tang, Y.C. Modeling of gas generation from the Cameo coal zone in the Piceance Basin, Colorado. AAPG Bull. 2008, 92, 1077–1106. [Google Scholar] [CrossRef]
Figure 1. Location of the Qiongdongnan Basin (Reproduced with permission from [Li et al.], [Energy & Fuels]; published by [American Chemical Society], (2017) [3]).
Processes 12 02476 g001
Figure 2. Stratigraphic column of the Qiongdongnan Basin (Reproduced with permission from [Xiao et al.], [Organic Geochemistry]; published by [Elsevier], (2006) [4]).
Processes 12 02476 g002
Figure 3. Organic matter type of samples used in the simulation (Reproduced with permission from [Shalaby et al.], [Marine and Petroleum Geology]; published by [Elsevier], (2011) [29]).
Processes 12 02476 g003
Figure 4. Flow chart of the closed-system analysis experiment. (a) The testing process; (b) fully automatic high-temperature and high-pressure enclosed hydrocarbon generation simulation device; (c) GC-MS; (d) experimental sample; and (e) gold tube 5.5 mm × 60 mm).
Processes 12 02476 g004
Figure 5. Temperature design diagram for thermal simulation.
Processes 12 02476 g005
Figure 6. Liquid hydrocarbon yields at different pyrolysis temperatures. (a) C6–C14 yields. (b) C15+ yields. (c) C6+ yields.
Processes 12 02476 g006
Figure 7. Gas hydrocarbon yields at different pyrolysis temperatures. (a) C1 yield. (b) C2 yield. (c) C3 yield. (d) C4–C5 yields. (e) C2–C5 yields. (f) Drying coefficient.
Processes 12 02476 g007
Figure 8. Plots of ln (C1/C2) and ln (C1/C2). (a) The heating rate of 20 °C/h. (b) The heating rate of 2 °C/h.
Processes 12 02476 g008
Figure 9. Hydrocarbon generation process of coal.
Processes 12 02476 g009
Figure 10. Best curve fittings and activation energy for the generation of C1–5 hydrocarbons.
Processes 12 02476 g010
Figure 11. Burial and temperature history of the YC13-1-A2 well in the Yanan Sag.
Processes 12 02476 g011
Figure 12. Diagram of various geochemical parameters of the source rocks and depth intervals in the YC13-1-A2 well.
Processes 12 02476 g012
Figure 13. Total gas generation potential and history of the coal’s source rock under geological conditions.
Processes 12 02476 g013
Table 1. Hydrocarbon composition data from pyrolysis experiments on the coal (mg/gTOC).
Heating
Rate
T/°CC1C2C3C4–5C6–14C15+EASYRo (%)
20 °C/h3360.180.02nd a0.2118.84.340.56
0.68
3600.620.090.050.2120.73.740.68
3842.360.460.140.8123.33.170.79
4088.623.371.092.9330.92.380.96
43220.038.113.199.0133.92.21.17
45647.9716.896.728.0630.91.271.44
48078.8118.536.037.4220.40.921.8
504109.8016.314.803.7711.81.092.19
528141.4311.231.690.518.10.652.65
552159.065.270.090.026.840.813.06
576179.832.450.05nd4.090.743.5
600197.941.85ndnd3.750.953.87
2 °C/h3360.830.160.050.1419.83.90.71
3603.230.740.180.2321.53.190.85
38411.514.231.502.7030.92.911.08
40830.039.873.494.6736.42.21.33
43258.3616.775.508.2724.91.131.68
45699.6117.895.315.7813.10.882.08
480131.9310.511.410.656.020.792.53
504158.803.950.180.023.610.722.99
528183.761.460.05nd2.370.763.54
552203.651.29ndnd1.910.743.83
576229.600.92ndnd2.610.974.19
600251.850.65ndnd4.320.764.45
a No data.
Disclaimer/Publisher’s Note: The statements, opinions and data contained in all publications are solely those of the individual author(s) and contributor(s) and not of MDPI and/or the editor(s). MDPI and/or the editor(s) disclaim responsibility for any injury to people or property resulting from any ideas, methods, instructions or products referred to in the content.

