Article

Enhancement of Natural Dye-Sensitized Solar Cell Efficiency Through TiO2 Hombikat UV100 and TiO2 P25 Photoanode Optimization

1
LPMC, University of Picardie Jules Verne, 33 rue Saint Leu, CEDEX 01, 80039 Amiens, France
2
University of Cocody, UFR SSMT 22, Abidjan 00258, Côte d’Ivoire
3
NGO, Collaborating Academics, 14, Av Frederic Mistral, 34110 Frontignan, France
4
Photovoltaics Laboratory, Institute of Science & Technology of Materials (IMRE)—Physics Faculty, University of Havana, Zapata esg G, s/n, Havana 10400, Cuba
5
Laboratory of Energy, Materials, Modelling and Methods, National Higher Polytechnic School of Douala, University of Douala, Douala P.O. Box 24157, Cameroon
6
Plateforme de Microscopie Electronique de l’Université de Picardie Jules Verne, Hub Energie, 15 rue Baudelocque, 80039 Amiens CEDEX 01, France
*
Author to whom correspondence should be addressed.
Processes 2024, 12(11), 2481; https://doi.org/10.3390/pr12112481
Submission received: 21 September 2024 / Revised: 7 October 2024 / Accepted: 27 October 2024 / Published: 8 November 2024

Abstract

:
Engineering new photoanode materials to substantially improve the efficiency of natural dye-sensitized solar cells (DSSC-Ns) is a significant challenge in the field of DSSC-Ns. This study utilizes the doctor blade technique to develop novel photoanode materials based on mixtures with different proportions of TiO2 Hombikat UV100 and TiO2 P25, two nanometric powders with different grain sizes. The fabricated films were studied by X-ray diffraction, which revealed a dominant anatase phase in the structure, as was corroborated by Raman spectroscopy. The crystallite size of the materials was determined using the Scherrer method. Using optical measurements, we estimated the bandgap energy (Eg) of the photoanodes that varied in the samples at around 3 eV. The assembled solar cells demonstrated a significant efficiency of 4.87% in the TiO2 Hombikat UV100/TiO2 P25 sample with the proportion of 50–50% (HP50) of blended photoanode. This sample device exhibited a fill factor of 50.41%, an open circuit voltage (Voc) of 0.65 V, and a current density of 14.75 mA/cm2 for an active surface area of 0.19 cm2. The HP50 sample constituted highly efficient DSSC-Ns and photoanodes with lower open-circuit voltage in the series, while HP40 developed a Voc of 0.73 V, and HP30 developed a Voc of 0.70 V.

1. Introduction

Enhancing the energy conversion efficiency of dye-sensitized solar cells (DSSCs) requires high-performance photoanodes. Among the various options, mesoporous TiO2 remains a promising candidate due to its desirable properties [1,2]. The development of TiO2 nanoparticles through the use of different techniques has significantly advanced photovoltaic technology by allowing precise control over optoelectronic properties, such as grain size, grain shape, and crystal structure [3,4]. Sol–gel synthesis has become a widely used method for fabricating mesoporous TiO2, utilizing precursors such as titanium tetrapropoxide or titanium n-butoxide [5,6,7,8,9]. Photoanodes based on TiO2 P25 have gained attention for their improved optoelectrical properties and photocatalytic hydrogen production, making them a prominent choice in DSSC devices [10,11]. Recent developments include the creation of composite photoanode layers by incorporating silver nanowires into TiO2 P25 paste, which has enhanced DSSC yields to approximately 4.14% [12]. Comparative studies of pure and doped TiO2 P25 have shown that doped variants offer superior performances [13]. Research on factors such as compact layers, electrolytes, and photoactive layer doping has further explored their impacts on the efficiency of TiO2 P25-based solar cells [14,15]. Effective DSSC photoanodes require porous, blocking oxide semiconductor layers to prevent electron leakage and enhance efficiency [16]. However, the wide bandgap of anatase and rutile TiO2 (~3.2 eV) limits their ability to capture natural sunlight effectively [17]. To overcome this limitation, various strategies have been employed, including nonmetal doping, noble and transition metal doping, and the synthesis of coupled semiconductors to extend TiO2 absorption into the visible spectrum [18,19]. Although the anatase phase of TiO2 Hombikat UV100 is less frequently used as a photoelectrode in photovoltaic devices, it remains suitable for photocatalytic oxidation reactions [20,21]. Despite its lower crystallinity, TiO2 Hombikat UV100 may offer advantages such as higher light transmission due to its smaller particle size, potentially leading to a better balance between surface recombination and specific surface area [22,23]. In this study, we propose a novel composite photoanode combining TiO2 Hombikat UV100 (anatase phase) with TiO2 P25 (which contains 15% rutile). Our aim was to experimentally determine the optimal composition in terms of photovoltaic properties.
Mixing powders with different typical grain sizes (25 nm and 10 nm) during the preparation of pastes for mesoporous layer production can significantly alter the properties influencing the photovoltaic efficiency of the final device. In dye-sensitized solar cells, the characteristics of the mesoporous TiO2 layer such as filling factor, porosity, specific surface area, and connectivity strongly impact the photoelectric performance of the device. Additionally, in DSSCs, photogenerated electrons are produced within dyes at the interface between the electrolyte and the mesoporous TiO2 layer. Thus, photovoltaic properties also depend on complex phenomena related to the mesoporous structure, the dye’s ability to penetrate and color the layer, and the electrolyte’s ability to wet the layer.
Adding a small amount of 10 nm-sized powder to a predominantly 25 nm-sized powder paste can fill the voids between larger grains, significantly altering the properties of the resulting mesoporous layer. However, given that TiO2 grains are not spherical and vary in size, the structural arrangements are complex and disordered. Nevertheless, mixing these two powders is expected to yield a paste with optimal properties for the reasons discussed, even though detailed results may be challenging to predict.
This work presents our findings in this area. Since results can be influenced by uncontrolled synthesis or experimental parameters, we verified the reproducibility of our results by testing samples from different preparations. The results are satisfactory.

2. Experimental Section

2.1. Materials

The mixed sample (TiO2 P25–TiO2 Hombikat UV100) was prepared with TiO2 P25 in mass percentages ranging from 30% to 50%. X-ray diffraction (XRD) analysis confirmed the semi-amorphous nature of TiO2 Hombikat UV100, which predominantly crystallizes in the anatase phase. The photoanode materials were synthesized using TiO2 P25 nanopowders (Degussa) sourced from Merck-Aldrich (Taufkirchen, Germany) and TiO2 Hombikat UV100. Additional materials such as Triton X-100 (Merck-Aldrich), polyethylene glycol (Merck-Aldrich), acetylacetone (Merck-Aldrich), and FTO glass substrate (TEC 10, Merck-Aldrich) were used in the fabrication process as described below. All chemical compounds and materials were used without further purification. SEM images were recorded using the scanning electron microscopy (SEM) FEI Quanta 200 instrument (Hillsboro, OR, USA).

2.2. Elaboration of TiO2 Photoanodes

The doctor blade method was used to fabricate layers with varying proportions of TiO2 P25 and TiO2 Hombikat UV100, which will simply be noted later in this work as P25 and UV100, respectively. The films were labeled according to their P25 content, where HP-X refers to a sample containing X% of P25. The samples included HP-0 (a pure UV100 layer), HP-30, HP-40, HP-45, and HP-50, corresponding to samples with 30%, 40%, 45%, and 50% TiO2 P25 content. The photoanode layers were deposited onto FTO–glass substrates (TEC 10), which underwent a thorough cleaning process before deposition. This process involved sequential ultrasonic treatment in distilled water, absolute ethanol, and acetone, for 15 min each. The HP-0 sample was composed of 400 mg of UV100 nanopowder. The mixed powders of the other samples were maintained in a constant manner at a total mass of 400 mg. The nanopowders were finely ground and homogenized in an agate mortar for several hours with a solution of 0.2 mL distilled water and 0.8 mL absolute ethanol. Following this, 0.02 mL of Triton X-100, 0.02 mL of acetylacetone, and 0.01 mL of polyethylene glycol were added to this mixture. Each resulting mixture was then applied to the FTO–glass substrate by the doctor blade technique, followed by progressive heat treatment. The samples were initially heated to 150 °C and held at this temperature for 2 h. This temperature was reached by a ramp rate of 0.55 °C/min. This was followed by further heating to 430 °C, with a hold time of 30 min at a ramp rate of 3 °C/min. The samples were then allowed to cool to room temperature at this last rate.

2.3. Preparation of Electrolyte Solution (3I/I3)

The electrolyte solution was prepared following the established protocols from the literature [24,25], with slight modifications to suit the assembly of the fabricated DSSCs in this work. In a mixed solvent of 1 mL ethylene glycol and 4 mL acetonitrile, 50.8 mg of diiodine and 249 mg of potassium iodide were dissolved under magnetic stirring to achieve a final concentration of 0.3 M.

2.4. DSSC-N Device Setup

Figure 1 shows the DSSC-N (dye-sensitized solar cell) device developed in this study. The device configuration consists of an external glass–FTO substrate, which houses the photoanode and is directly exposed to the incident light source. The glass–FTO counter-electrode is coated with an 80 nm platinum layer, serving as the cathode. A redox electrolyte (3I/I3) is introduced between the two electrodes and sealed by a clamp to facilitate electron–hole exchange within the device. For current–voltage (I-V) measurements, the device is connected to a two-channel Keithley 2602B instrument. The incident light source is a solar simulator (Ossila, Sheffield 54 7W, UK, model No: 02009A1), calibrated to emit a total integrated power of 1000 W/m2 across the wavelength range of 350 nm to 1000 nm. This setup allows for the precise characterization of the DSSC-N device’s performance under controlled illumination conditions, providing valuable insights into its photovoltaic properties and efficiency.

3. Results and Discussion

3.1. XRD Pattern Analysis

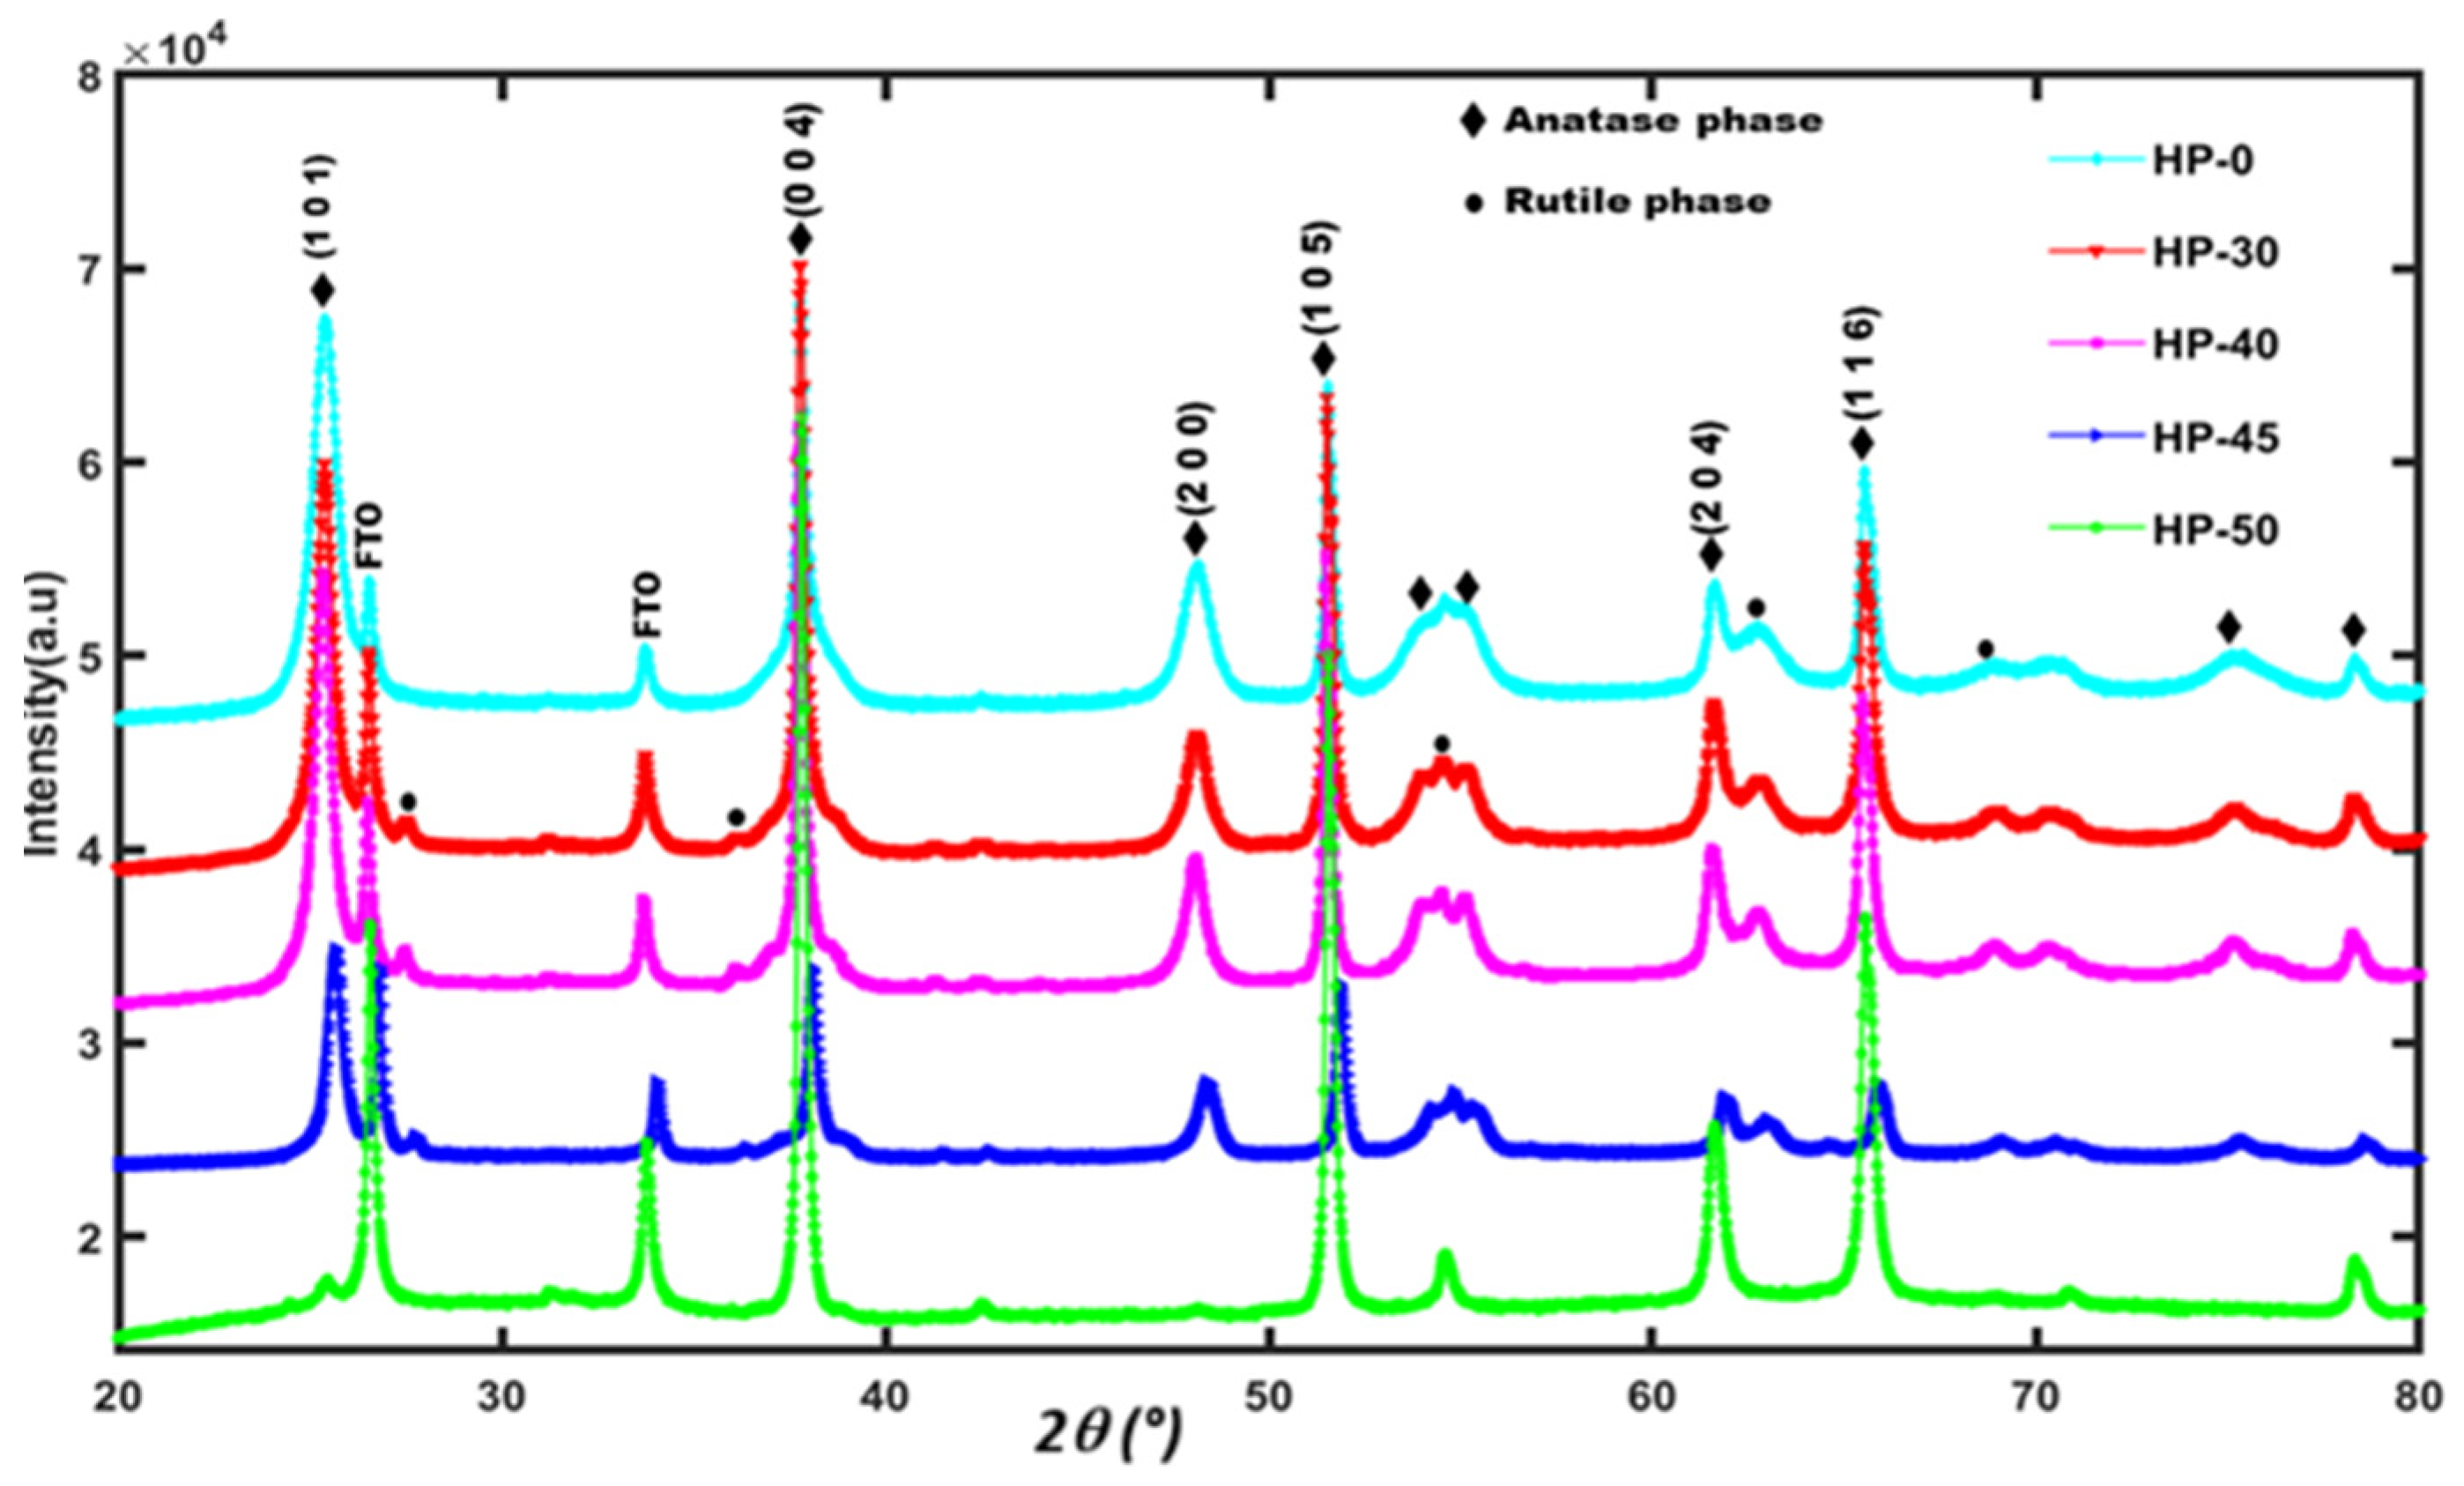
Figure 2 presents the XRD pattern of the studied samples processed on FTO–glass. The most intense XRD peaks, observed at values of 25.46°, 38°, 47.9°, 54.42°, 55.33°, and 65.80°, are attributed to the anatase phase of TiO2 [22,26,27]. The presence of less intense peaks at values of 27.35°, 33.71°, and 41.38° in the TiO2 P25-doped samples indicates the presence of the rutile phase in TiO2 P25, confirming the effect of the mixed phases.
The crystallite size was determined using the Scherrer formula [28,29], yielding an average value of D = 16.3 nm. For this calculation, the most intense peak at 2θ = 25.46° was used, with a full width at half maximum (FWHM) value of β = 0.08722°.

3.2. Raman Spectra Study

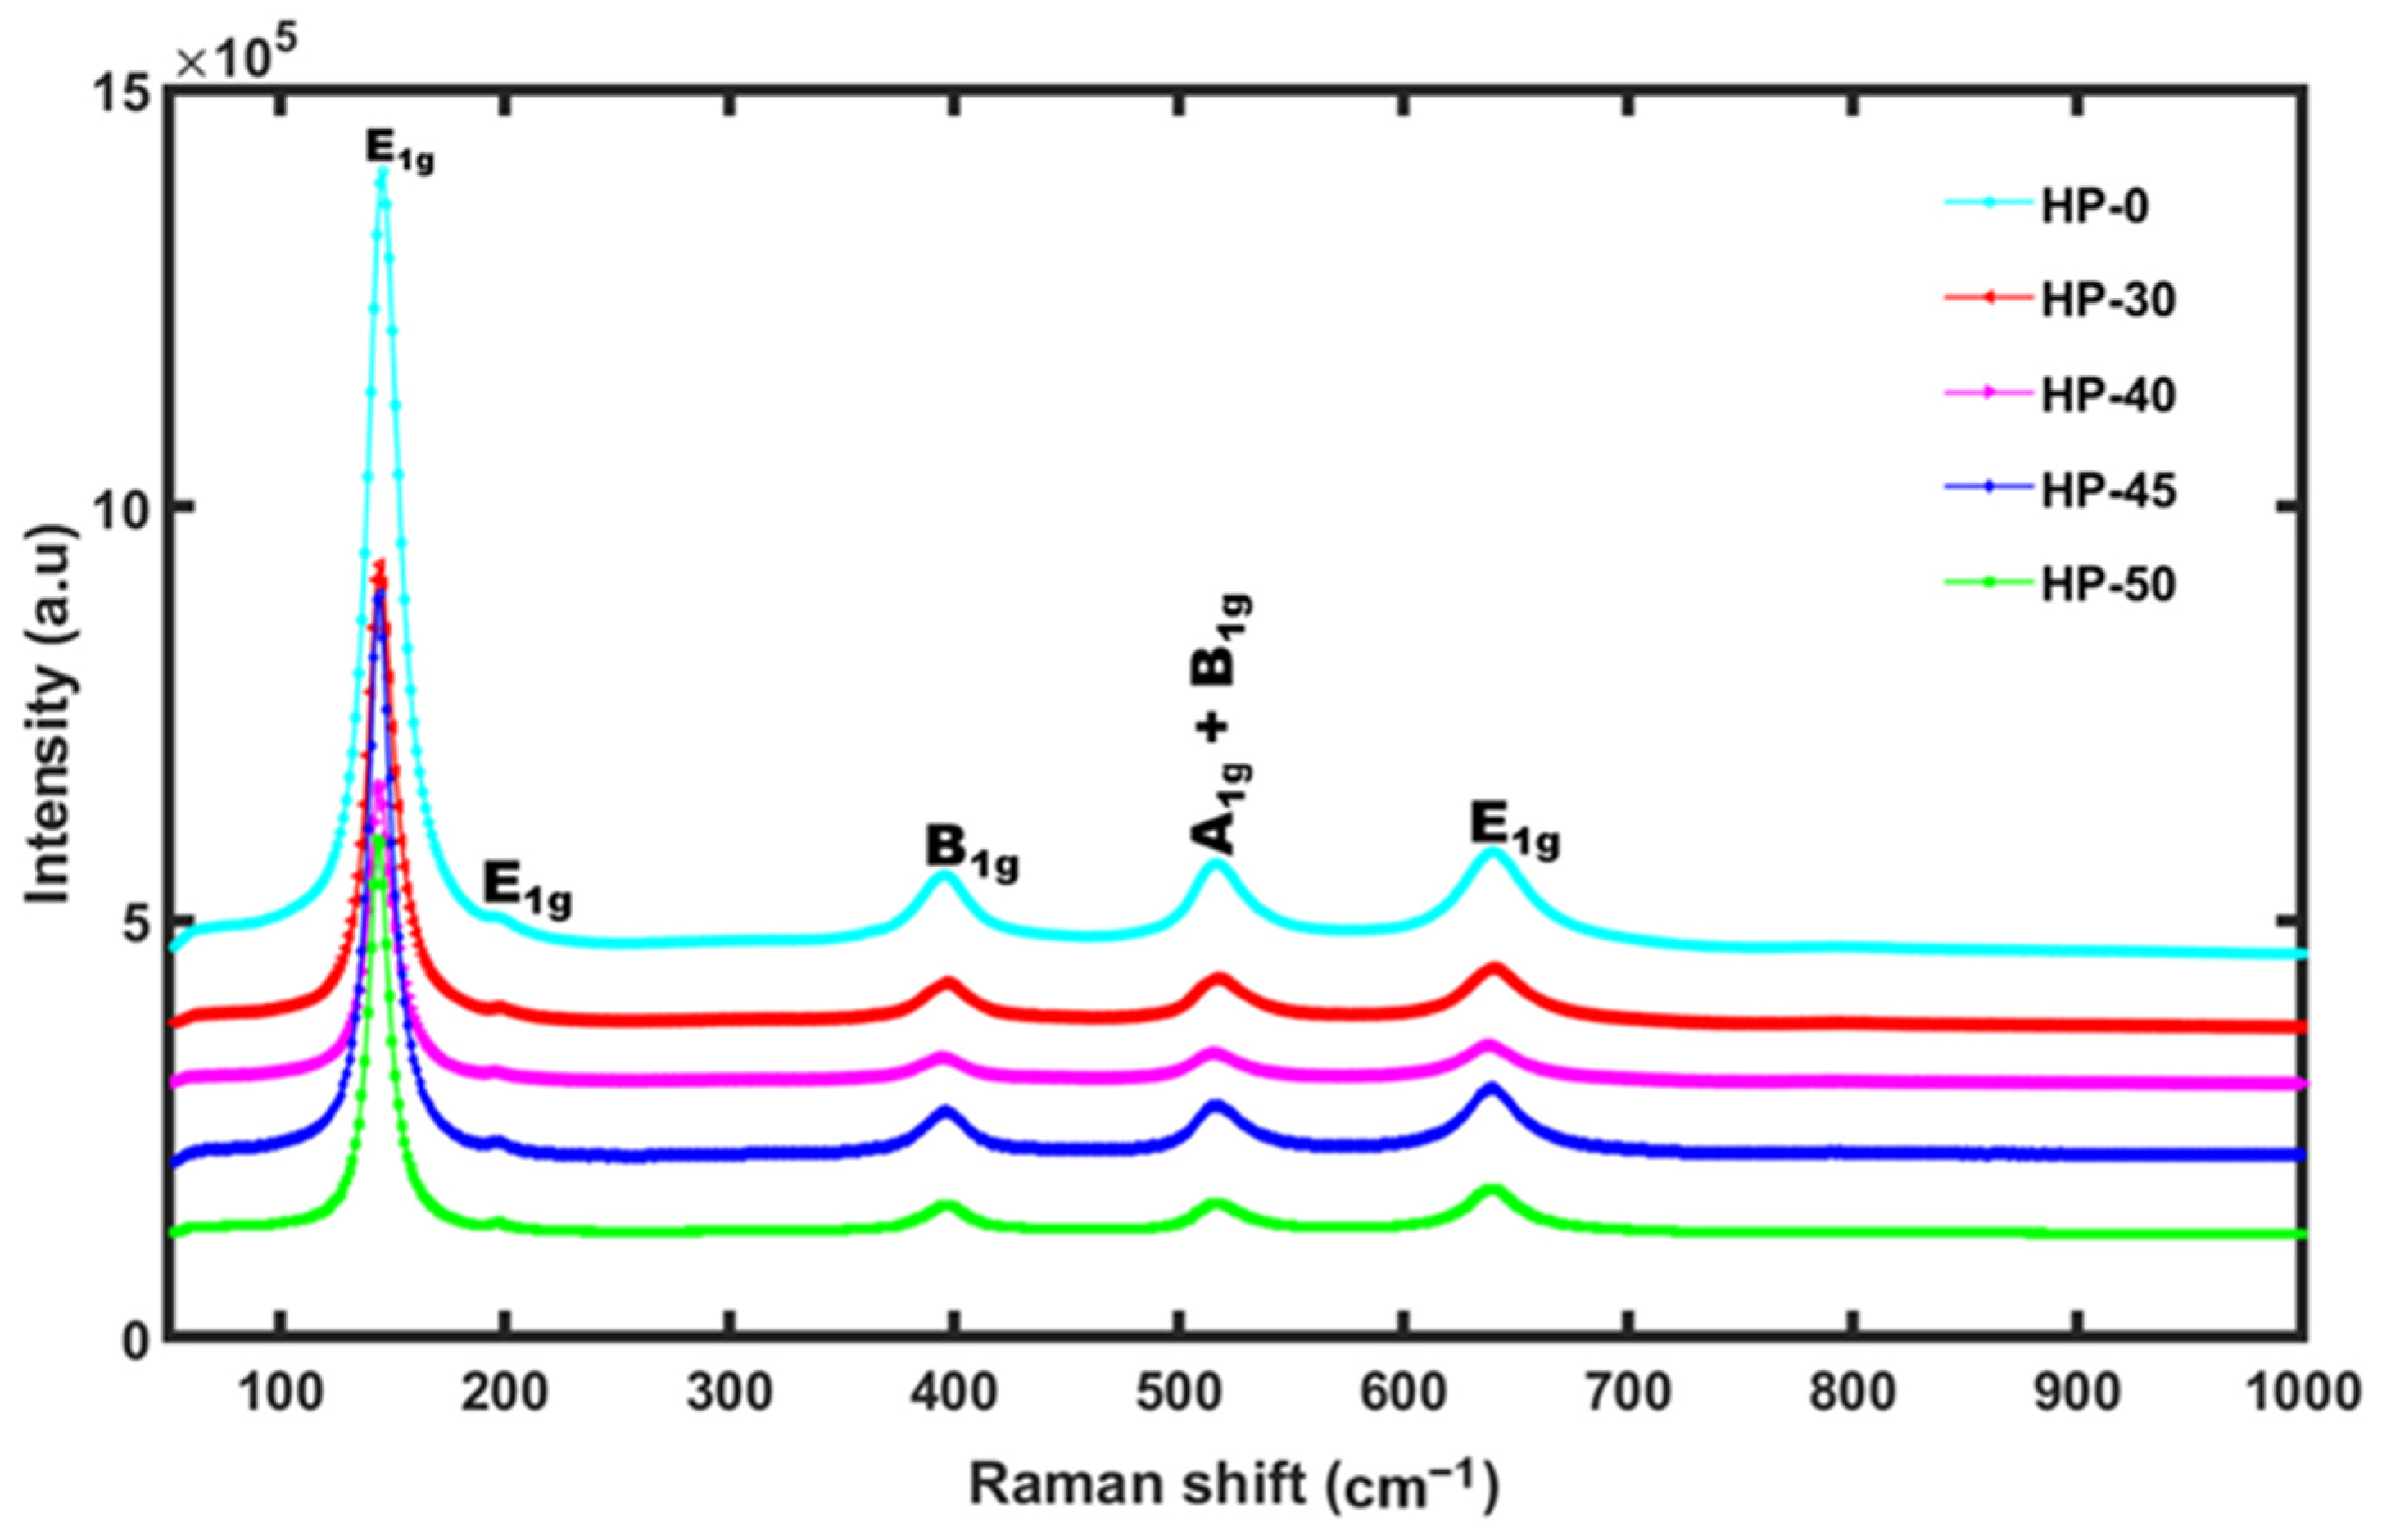
Figure 3 presents a comprehensive analysis of the Raman spectra obtained from the fabricated samples. The observed Raman modes, including E1g, B1g, and A1g, provide valuable insights into the formation and structural characteristics of TiO2 [30,31,32], further corroborating the X-ray diffraction results. Notably, the distinct peaks at 145.8 cm−1 and 197.1 cm−1 correspond to the E1g Raman vibration mode, indicative of specific crystal lattice vibrations within the TiO2 structure. The prominent peak at 394.4 cm−1 corresponds to the B1g Raman vibration mode, representing the symmetric stretching motion of oxygen atoms in the TiO2 lattice. Additionally, the peak at 518.3 cm−1 is attributed to a combination of A1g and B1g modes, reflecting further lattice vibrational characteristics. Of particular interest is the peak at 638.7 cm−1, attributed to the E1g mode, which signifies the stretching and bending motions of Ti-O and O-Ti-O bonds. This distinctive feature is characteristic of the pure anatase phase [31], providing crucial evidence of the structural integrity and composition of the fabricated samples. The detailed analysis of the Raman spectra offers valuable insights into the structural properties and phase composition of the TiO2-based materials, further enriching our understanding of their potential applications in photovoltaic devices. The observation of all Raman modes in this mixed material confirms consistent structural arrangements.

3.3. SEM Study

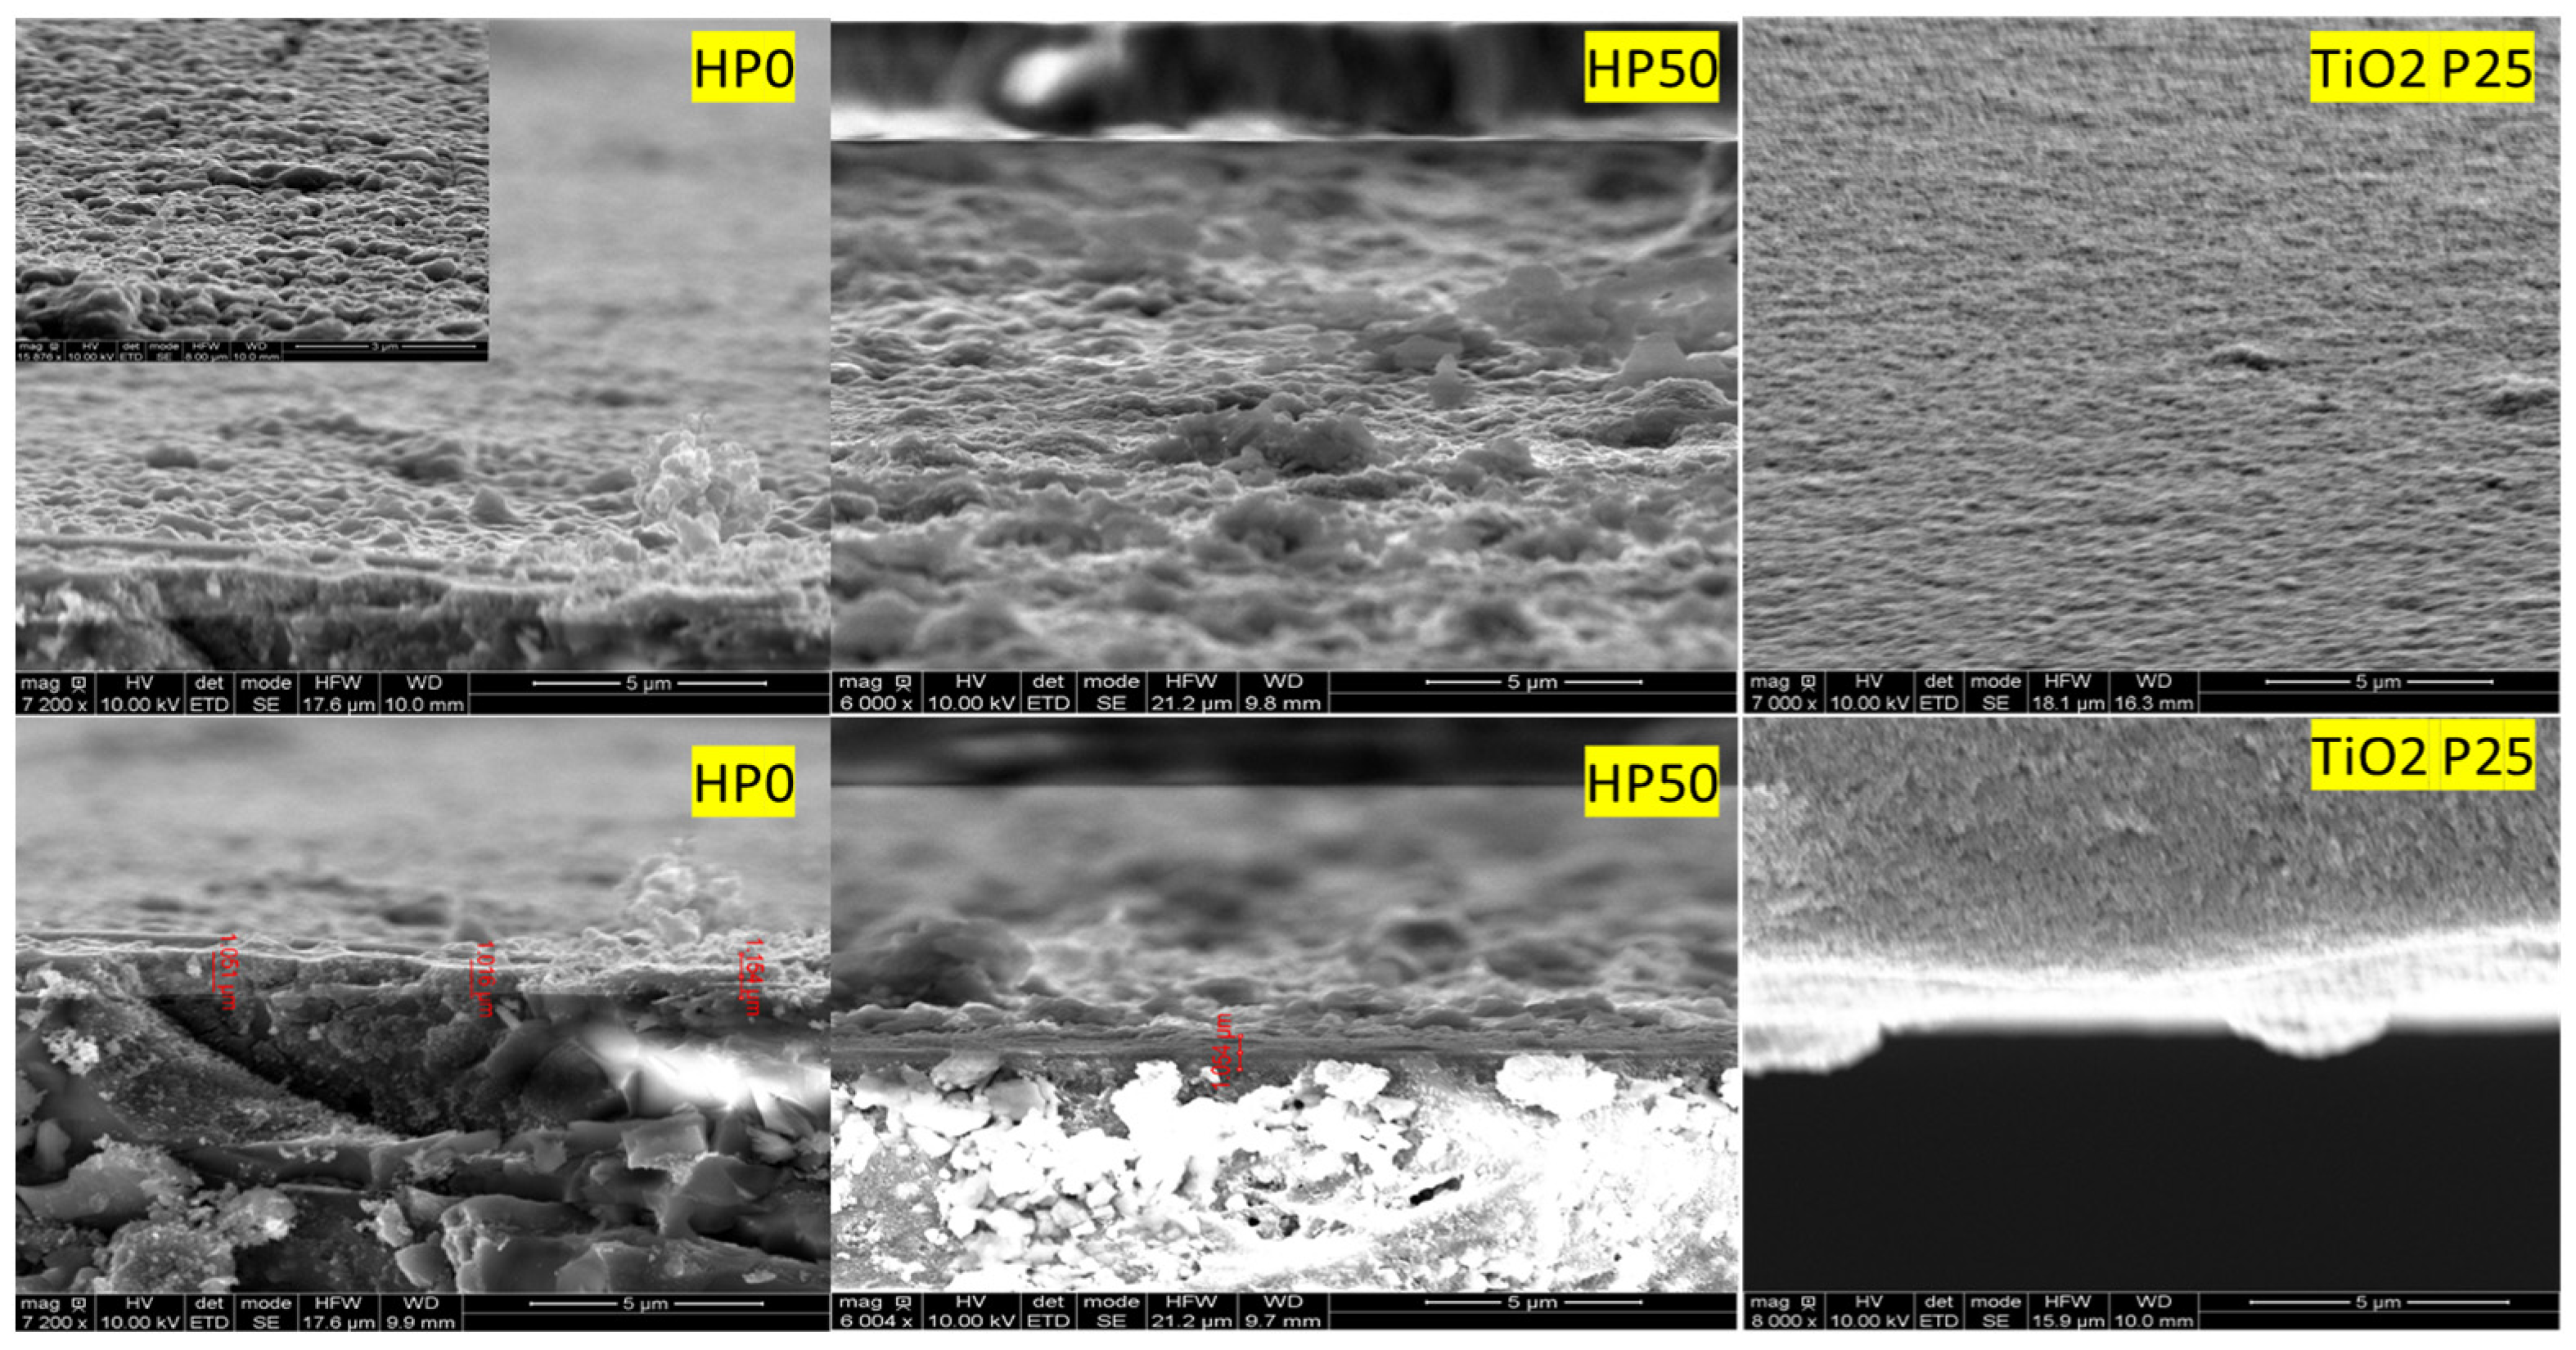
Figure 4 shows the cross-section image and surface morphology of TiO2 Hombikat UV100 (HP0), HP50, and TiO2 P25 films, respectively. The thicknesses of the layers are shown on the cross-section image. Surface morphology indicates the presence of agglomerates with a uniform distribution of particles of various sizes, spherical shapes, and nanoflowers. The thicknesses of the HP0 and HP50 photoanode layers are estimated at ~1.061 µm, as shown in Figure 4. The comparison of the surface morphologies of the TiO2 Hombikat UV100 and TiO2 P25 layers versus HP50 shows a rougher surface with larger particle sizes in the HP50 sample. Grain size was determined using imageJ (Bundled with 64-bit Java 8). Spherical particles have an approximate diameter of 0.24 µm for HP0, 0.32 µm for HP50, and 0.18 µm for TiO2 P25.

4. Optical Properties

4.1. Reflectance and Transmittance

Transmittance and reflectance spectra were meticulously measured using a JASCO V-670 spectrophotometer (AZoNetwork, UK Ltd) to elucidate the optical properties of the fabricated films. Various samples, including HP-0, HP-30, HP-40, HP-45, and HP-50, were successfully prepared using the doctor blade technique, each with a uniform thickness of 0.62 µm. Figure 5 presents a comprehensive analysis of the reflectance and transmittance characteristics of the fabricated films. The reflectance spectra revealed an average reflectance of 45% across most samples. In contrast, the transmittance spectra showed a consistent value of 20% within the wavelength range of 380–500 nm. This range corresponds to the high-absorbance region of TiO2 nanoparticles, highlighting the efficiency of the films in absorbing incident light within this spectral window. These observed optical properties provide valuable insights into the potential applications of the fabricated films in enhancing the performance of photovoltaic devices. Notably, HP-40 exhibited higher transmittance than the other samples, although no clear trend correlating to the composition was observed. Conversely, a reflectance peak was detected at the edge of the visible spectrum for all samples, with HP-30 showing the highest reflectance. Based on these findings, we conclude that the optical behavior can be attributed to the grain size distribution rather than the proportion of mixed elements, and that HP-40 seems to exhibit higher transmittance and lower reflectance in good proportions, conferring to it better optical performance photovoltaic activity.
This study highlights the potential of these films in photovoltaic applications due to their tailored optical properties, especially in absorbing light in the high-absorbance region of TiO2 nanoparticles. However, the reflectance behavior points to grain size distribution as a more critical factor than composition in determining the optical response of these films. This insight suggests that further tuning of grain size could optimize the films for specific optical applications.

4.2. Absorbance Spectra and Tauc’s Diagram Analysis

Figure 6 provides a detailed analysis of the absorbance spectra and Tauc’s plot, offering valuable insights into the optical properties of the fabricated films. The absorbance spectra shown in Figure 5a reveal that the films absorb, on average, 50% of visible light within the wavelength range of 400–550 nm. Notably, the HP-45 sample exhibits a significant increase in absorbance compared to the other samples, highlighting its superior light-harvesting capabilities. This positions HP-45 as one of the most efficient photoanodes, making it a promising candidate for improving the performance of photovoltaic devices.
Tauc’s law [33,34,35] is employed to determine the optical bandgap energy (Eg) of the samples based on the assumption that TiO2 behaves as a direct-gap semiconductor. As shown in Figure 5b, Tauc’s plot provides a graphical representation of the relationship between the absorption coefficient (α) and photon energy (hν), allowing the estimation of Eg. The thorough analysis presented in Figure 5 offers valuable insights into the optical and bandgap characteristics of the fabricated films, contributing to a deeper understanding of their potential applications in photovoltaic technologies.
α h ν 1 n = A h ν E g
where A is a constant reflecting the degree of disorder in the amorphous solid structure, Eg represents the optical bandgap in eV, and denotes the photon energy in eV. For a direct-gap material, the value of n is typically 1/2, and the optical bandgap is determined from the squared plot of the product of the absorption coefficient and photon energy (hν) by extrapolating the regression line to the energy axis. The photon emission mechanism can be explained by the well-known Bremsstrahlung radiation if the depletion region of the p-n junction is roughly treated as a gaseous micro-plasma. The wavelength of the emitted photon is related to its energy by Planck’s equation [36]. The estimated bandgap energies of the processed layers are 2.97 eV, 3.10 eV, 3.02 eV, 2.95 eV, and 3.05 eV, for the HP-0, HP-30, HP-40, HP-45, and HP-50 films, respectively. This analysis offers crucial insights into the bandgap properties of the fabricated films, emphasizing their potential in various photovoltaic applications. There is no clear tendency in the evolution of absorbance and optical gap energy where HP-45 presents a lower value.

5. Evaluation of the DSSC-Ns’ Efficiency and J-V Curve Analysis

The efficiency (η) of the DSSC-Ns is evaluated from the cells’ current–voltage (J-V) curve, as described in the literature [37,38,39], utilizing the following expression:
η = J S C × V O C × F F Φ i n ,
where
-
VOC represents the open-circuit voltage;
-
JSC denotes the short-circuit current density;
-
Φ i n represents the incident light power;
-
FF denotes the fill factor [40,41], which can be determined by the mathematical formula:
F F = P m a x J S C × V O C
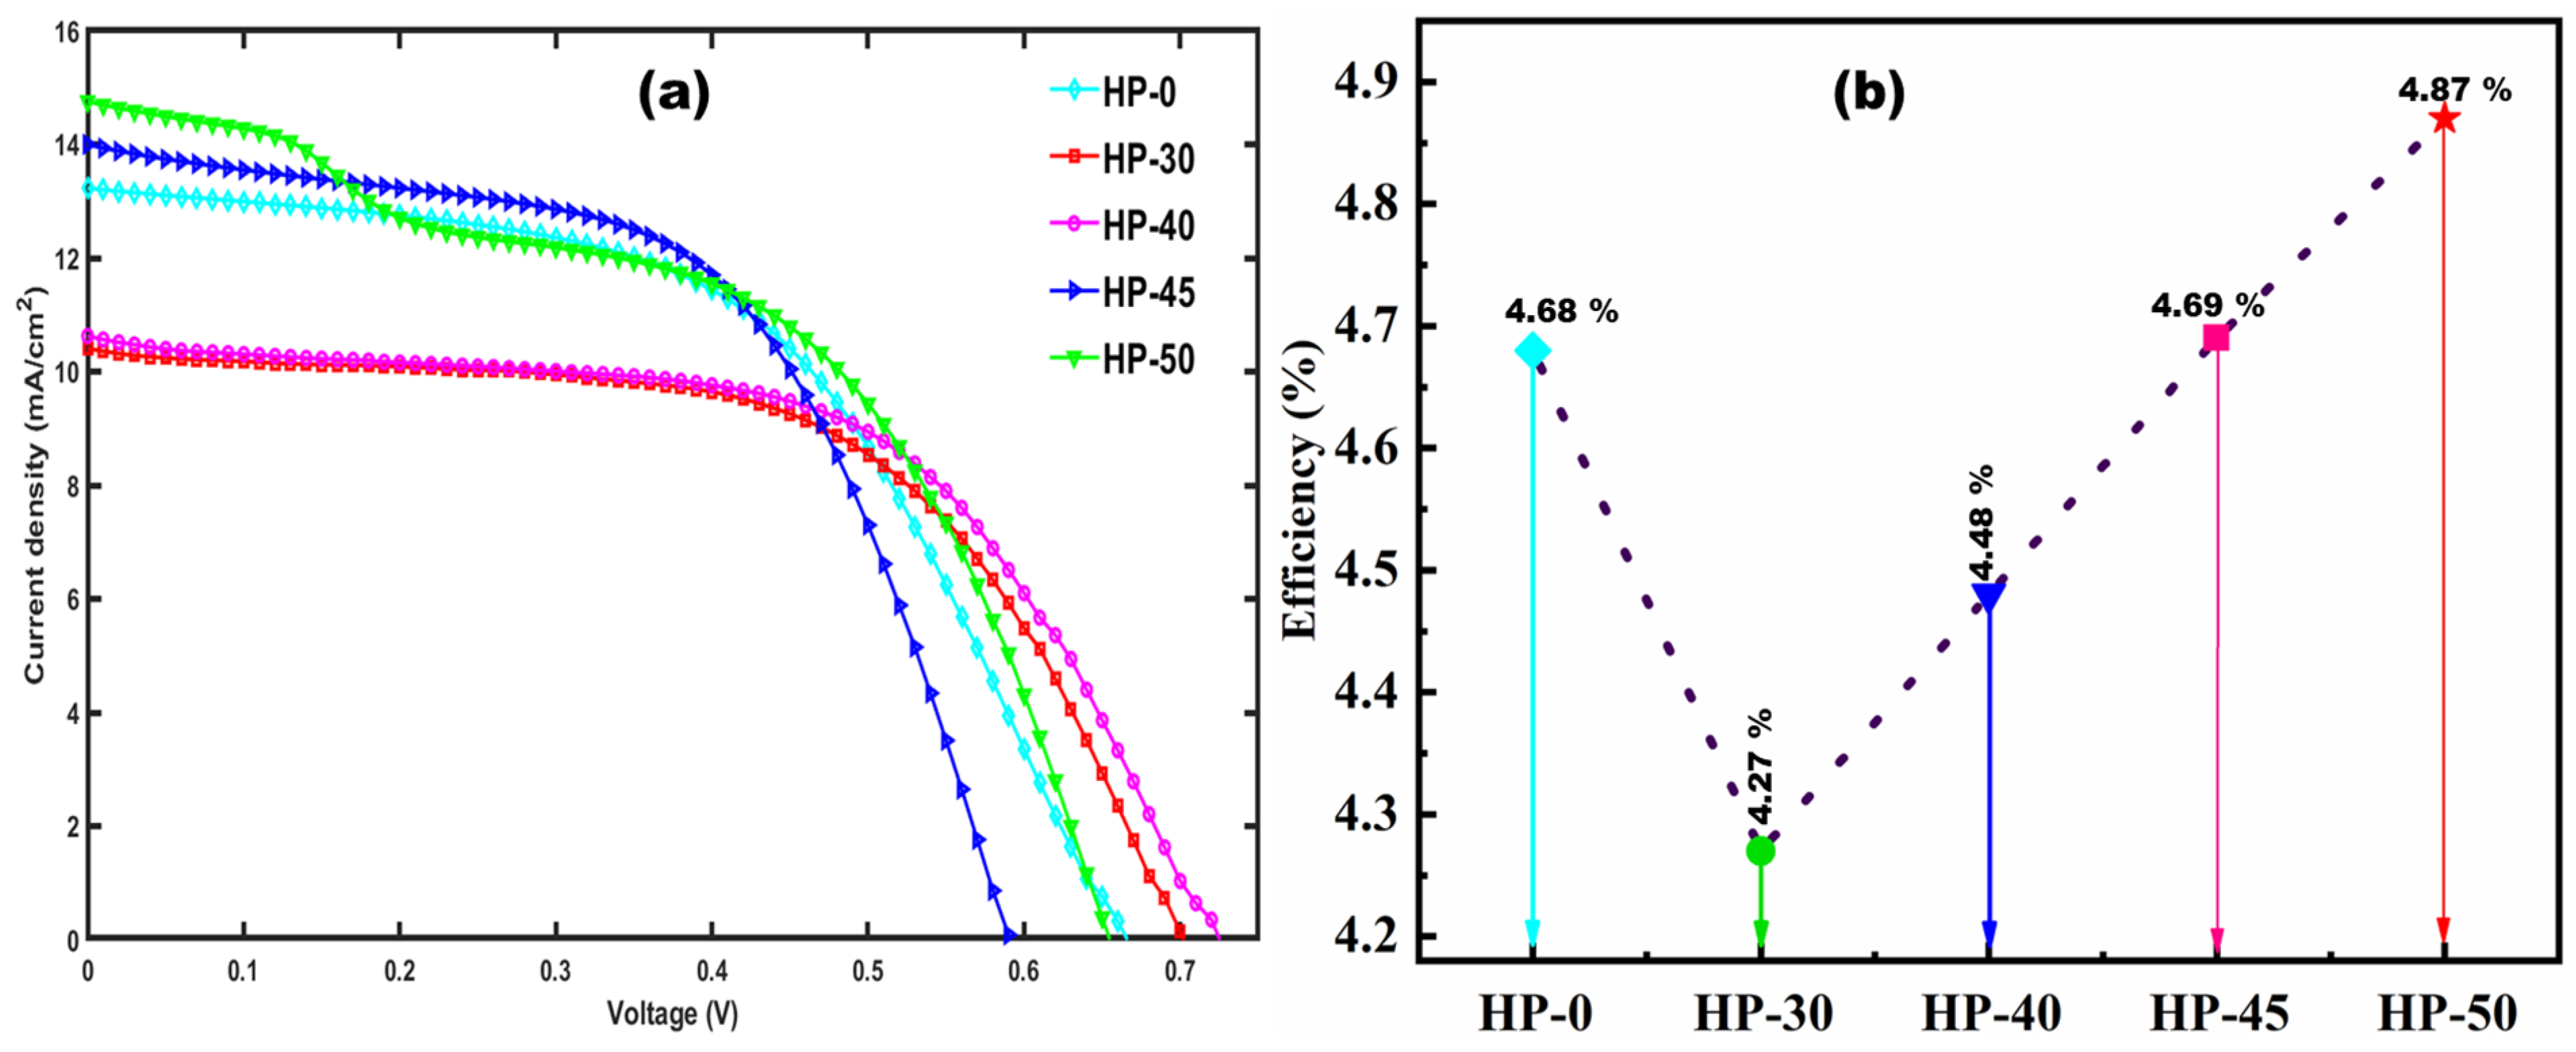
Figure 7 displays the J-V curves obtained under illumination for different DSSC-Ns developed in this study. The photovoltaic devices evaluated include the following:
FTO/(compact-layer)/HP-0/Hibiscus-sabdariffa/Electrolyte (3I/I3)/Pt;
FTO/(compact-layer)/HP-30/Hibiscus-sabdariffa/Electrolyte (3I/I3)/Pt;
FTO/(compact-layer)/HP-40/Hibiscus-sabdariffa/Electrolyte (3I/I3)/Pt;
FTO/(compact-layer)/HP-45/Hibiscus-sabdariffa/Electrolyte (3I/I3)/Pt;
FTO/(compact-layer)/HP-50/Hibiscus-sabdariffa/Electrolyte (3I/I3)/Pt.
The J-V response obtained from these devices enabled us to evaluate the efficiency (η) of each natural dye-sensitized solar cell manufactured and studied in this work.
Remarkably, efficiencies of 4.68%, 4.27%, 4.48%, 4.69%, and 4.89% were observed for the HP-0, HP-30, HP-40, HP-45, and HP-50 photoanodes based-DSSC-Ns, respectively (refer to Table 1). These values represent some of the highest reported efficiencies in this category of natural dye-sensitized solar cell [40,41]. Particularly noteworthy is the outstanding performance of the DSSC-Ns based on the HP-50 photoanode, which demonstrated a fill factor of 50.41%, an open-circuit voltage Voc = 0.65 V, and a current density of 14.75 mA/cm2 under an active area of 0.19 cm2. Furthermore, significant improvements in open-circuit voltage were observed for the DSSC-N devices based on HP-40 (Voc = 0.73 V) and HP-30 (Vo = 0.7 V) photoanodes, further underscoring the effectiveness of the developed photoanode materials in enhancing the power of dye-sensitized solar cells.

6. Discussion and Reproducibility of Results

An important parameter influencing the efficiency of dye-sensitized solar cells (DSSCs) is the effective interface (Sint) area between TiO2 and the electrolyte, observed as the charge generation that occurs in this region [42]. This area is typically smaller than the real area (Sreal) of the mesoporous structure, as not all TiO2 grains may be wetted by the electrolyte or fully covered by the dye. Therefore, the efficiency is expected to depend on the real area of the mesoporous TiO2 structure and the capability of the electrolyte and dye to penetrate smaller pores within the layer. By mixing two nanopowders with different grain sizes, we produced layers with varying characteristics from one sample to another. Starting with powder containing larger grains, porosity tends to decrease when smaller grains are introduced, as these smaller grains can more easily fill voids within the mesoporous structure, but this tendency changes rapidly with insignificant experiment conditions. The saturation behavior at the low-voltage region is attributed to the sample preparation, redox activity inertia, and grain wetting in the presence of the electrolyte. Conversely, in layers predominantly composed of small grains, the penetration of the electrolyte is restricted, which can lead to lower cell efficiency.
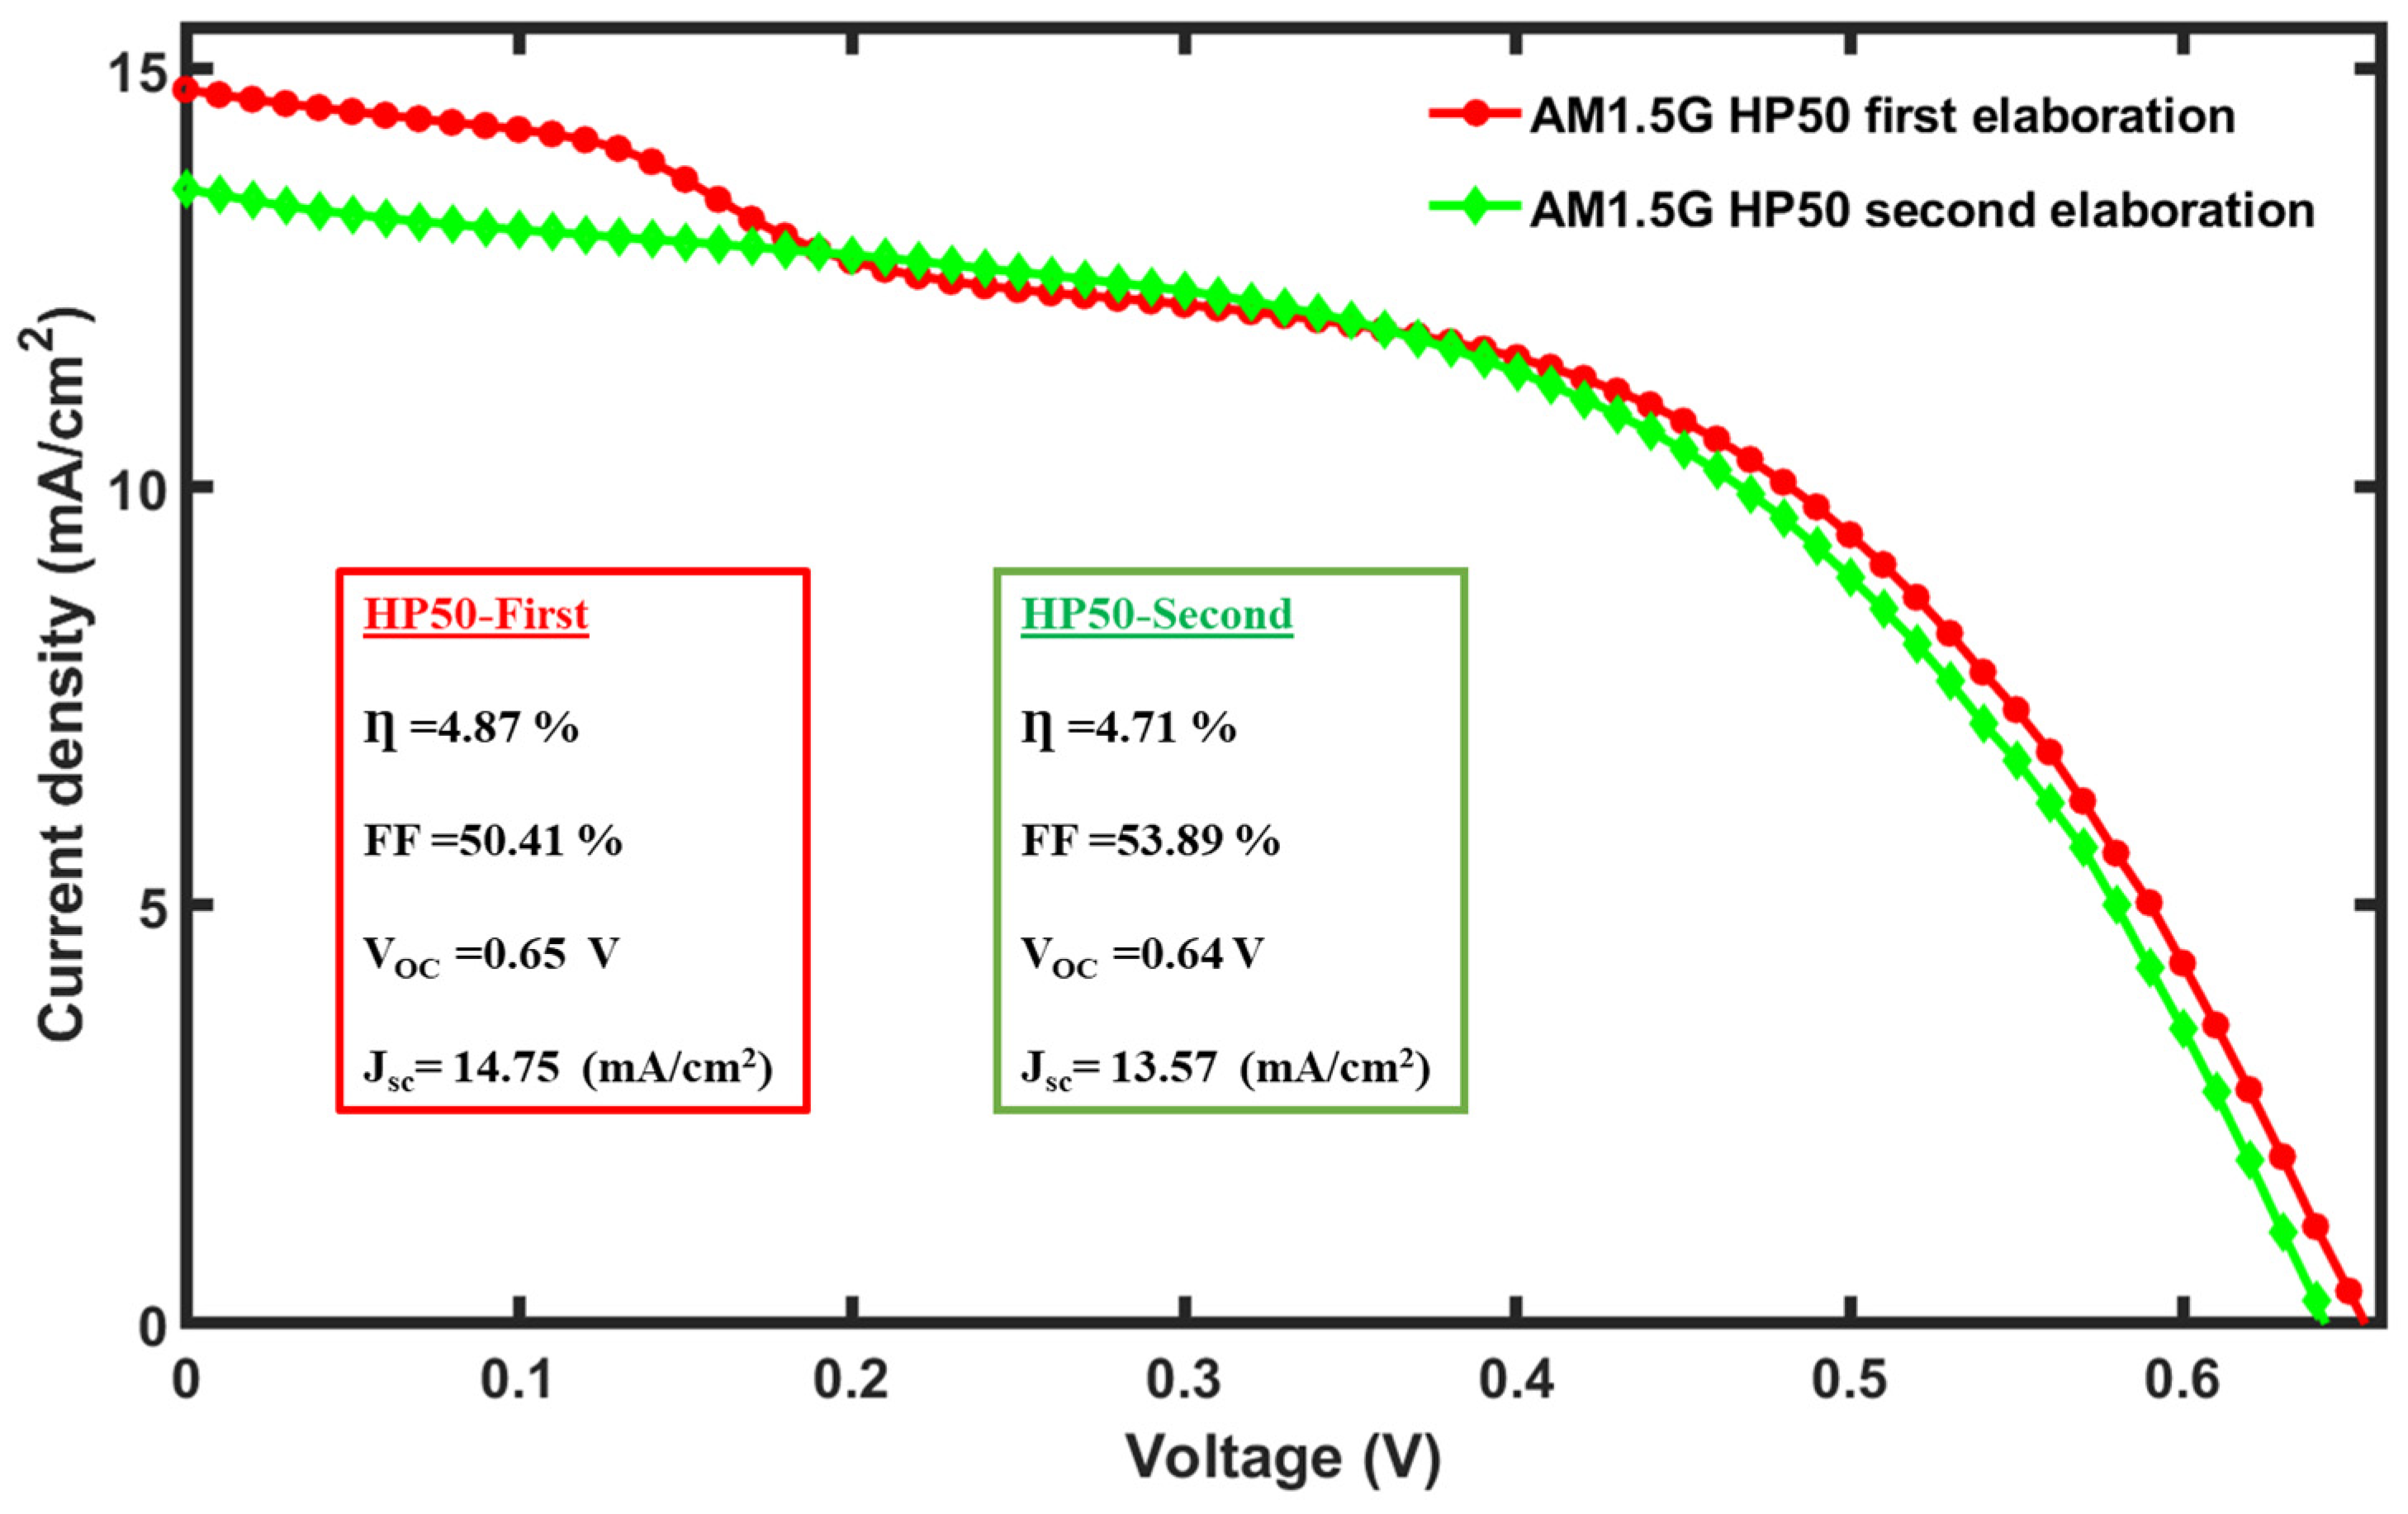
In this work, our aim was not to develop a detailed model, nor to analyze the mechanisms in depth. However, we note that our results qualitatively align with the general expectations based on the above arguments. Given the complexity of the preparation process and the sensitivity of the properties to synthesis and preparation parameters, we verified the reproducibility of the results. Figure 8 shows the efficiency deduced from the J-V curve for the HP-50 sample, obtained from both the first and second fabrications. The results are approximately similar, allowing us to conclude that the quality of the fabricated cells is quite satisfactory.

7. Conclusions

The newly developed photoanode materials demonstrated significant advancements in enhancing the performance of natural dye-sensitized solar cells (DSSC-Ns) fabricated in this study. These materials exhibited a high light absorption capacity and notably reduced dye adhesion time, averaging just 2 h. Additionally, substantial improvements were observed in the optical bandgap energy, with the HP-45 photoanode achieving an impressive value of 2.95 eV. As a result of these enhancements, the developed DSSC-Ns achieved remarkable performance metrics, including an efficiency of 4.87% and an open-circuit voltage (Voc) of 0.73 V, highlighting the promising potential of TiO2-based DSSCs with optimized photoanode layers. Moreover, the current density was significantly improved, reaching 14.75 mA/cm2 for an active area of 0.19 cm2. These advancements represent a significant step forward in the development of efficient and sustainable photovoltaic technologies, paving the way for the further optimization and broader utilization of TiO2-based materials to enhance the performance and viability of dye-sensitized solar cells.

Author Contributions

Conceptualization, A.F.K. and Y.G.; Methodology, P.S.-G., L.V.-R. and S.E.; Validation, P.S.-G., L.V.-R. and Y.G.; Formal analysis, A.F.K., A.S.Y., S.E. and R.M.; Investigation, A.S.Y., A.J. and Y.G.; Resources, P.S.-G.; Data curation, A.F.K.; Writing—original draft, A.F.K.; Visualization, R.M.; Supervision, Y.G. All authors have read and agreed to the published version of the manuscript.

Funding

This work was supported financially by the French Embassy in Cuba via Grant Agreement No. PR-23-103, the Ministry of Higher Education, and Scientific Research of Côte d’Ivoire and Project PHC Bantou 2024_No. 51662UC.

Data Availability Statement

The data that support the findings of this study are openly available on request from the corresponding author.

Acknowledgments

A. F. K. and Y. G. thank Ibrahim Diomande, Founder of the International Private University of Abidjan (UIPA), for his helpful advice.

Conflicts of Interest

The authors do not have any conflicts of interest.

References

  1. Li, W.; Wu, Z.; Wang, J.; Elzatahry, A.A.; Zhao, D. A Perspective on Mesoporous TiO2 Materials. Chem. Mater. 2014, 26, 287–298. [Google Scholar] [CrossRef]
  2. Tasić, N.; Marinković Stanojević, Z.; Branković, Z.; Lačnjevac, U.; Ribić, V.; Žunić, M.; Novaković, T.; Podlogar, M.; Branković, G. Mesoporous Films Prepared from Synthesized TiO2 Nanoparticles and Their Application in Dye-Sensitized Solar Cells (DSSCs). Electrochim. Acta 2016, 210, 606–614. [Google Scholar] [CrossRef]
  3. Jesus, M.A.M.L.; Ferreira, A.M.; Lima, L.F.S.; Batista, G.F.; Mambrini, R.V.; Mohallem, N.D.S. Micro-Mesoporous TiO2/SiO2 Nanocomposites: Sol-Gel Synthesis, Characterization, and Enhanced Photodegradation of Quinoline. Ceram. Int. 2021, 47, 23844–23850. [Google Scholar] [CrossRef]
  4. Tsotetsi, D.; Dhlamini, M.; Mbule, P. Sol-Gel Derived Mesoporous TiO2: Effects of Non-Ionic Co-Polymers on the Pore Size, Morphology, Specific Surface Area and Optical Properties Analysis. Results Mater. 2022, 14, 100266. [Google Scholar] [CrossRef]
  5. Koozegar Kaleji, B.; Gorgani, M. Comparison of Sol-Gel and Hydrothermal Synthesis Methods on the Structural, Optical and Photocatalytic Properties of Nb/Ag Codoped TiO2 Mesoporous Nanoparticles. Int. J. Environ. Anal. Chem. 2022, 102, 3357–3372. [Google Scholar] [CrossRef]
  6. Noorasid, N.S.; Arith, F.; Aliyaselvam, O.V.; Salehuddin, F.; Mustafa, A.N.; Chelvanathan, P.; Azam, M.A.; Amin, N. Low-Temperature Sol-Gel Synthesized TiO2 with Different Titanium Tetraisopropoxide (TTIP) Molarity for Flexible Emerging Solar Cell. J. Sol-Gel Sci. Technol. 2024, 109, 826. [Google Scholar] [CrossRef]
  7. Yeoh, M.-E.; Chan, K.-Y.; Wong, H.-Y.; Low, P.-L.; How Thien, G.S.; Ng, Z.-N.; Ananda Murthy, H.C.; Balachandran, R. Hydrothermal Duration Effect on the Self-Assembled TiO2 Photo-Anode for DSSC Application. Opt. Mater. 2023, 141, 113907. [Google Scholar] [CrossRef]
  8. Eskandarloo, H.; Zaferani, M.; Kierulf, A.; Abbaspourrad, A. Shape-Controlled Fabrication of TiO2 Hollow Shells toward Photocatalytic Application. Appl. Catal. B Environ. 2018, 227, 519–529. [Google Scholar] [CrossRef]
  9. Marycleopha, M.; Yaou Balarabe, B.; Adjama, I.; Moussa, H.; Anandaram, H.; Abdoul Razak, M.W. Anhydrous Sol-Gel Synthesis of TiO2 Nanoparticles: Evaluating Their Impact on Protein Interactions in Biological Systems. J. Trace Elem. Miner. 2024, 7, 100114. [Google Scholar] [CrossRef]
  10. Nakamoto, T.; Higuchi, K.; Taguchi, K. Effectiveness of Light Scattering Layer Using Mesoporous SiO2-TiO2 Core-Shell on Dye-Sensitized Solar Cells. IEEJ Trans. Electr. Electron. Eng. 2024, 19, 157–159. [Google Scholar] [CrossRef]
  11. Kuo, T.-R.; Liao, H.-J.; Chen, Y.-T.; Wei, C.-Y.; Chang, C.-C.; Chen, Y.-C.; Chang, Y.-H.; Lin, J.-C.; Lee, Y.-C.; Wen, C.-Y.; et al. Extended Visible to Near-Infrared Harvesting of Earth-Abundant FeS2–TiO2 Heterostructures for Highly Active Photocatalytic Hydrogen Evolution. Green Chem. 2018, 20, 1640–1647. [Google Scholar] [CrossRef]
  12. Ye, Y.-J.; Wu, T.-C. Preparation of Photoanode Composite Layers with Different Concentrations of Silver Nanowires Combined with TiO2 for Dye-Sensitized Solar Cells. In Proceedings of the 2021 IEEE 3rd Eurasia Conference on IOT, Communication and Engineering (ECICE), Yunlin, Taiwan, 29–31 October 2021; pp. 534–537. [Google Scholar]
  13. Ge, Z.; Yin, A.; Fang, M.; Zhu, W.; Li, C. dSiO2@TiO2-CsPbBr3 Hierarchical Microspheres for Dye-Sensitized Solar Cells to Enhance Photovoltaic Conversion Efficiency. J. Mater. Sci. Mater. Electron. 2024, 35, 1183. [Google Scholar] [CrossRef]
  14. Ho, Y.-R.; Lin, C.-H.; Huang, J.-J. Effect of TiO2 Compact Layer and ITO Texturing on DSSC Efficiency Improvement by Chemical Deposition and Etching Process. J. Mater. Sci. Mater. Electron. 2021, 32, 2618–2626. [Google Scholar] [CrossRef]
  15. Subramanian, A.; Murugapoopathi, S.; Amesho, K.T.T. Enhancing the Performance of Nanocrystalline TiO2 Dye-Sensitized Solar Cells with Phenothiazine-Doped Blended Solid Polymer Electrolyte. Electrocatalysis 2024, 15, 226–238. [Google Scholar] [CrossRef]
  16. Duarte, A.I.E.; Cruz, A.L.L.; Marquina, A.V.; Martínez, J.A.A.; Juárez, A.G.; Islas, C.Z. One-Step Method to Simultaneously Grow TiO2 Compact and Porous Layers for DSSC Photoelectrodes. Appl. Nanosci. 2024, 14, 819. [Google Scholar] [CrossRef]
  17. Siah, W.R.; Lintang, H.O.; Shamsuddin, M.; Yuliati, L. High Photocatalytic Activity of Mixed Anatase-Rutile Phases on Commercial TiO2 Nanoparticles. IOP Conf. Ser. Mater. Sci. Eng. 2016, 107, 012005. [Google Scholar] [CrossRef]
  18. Hu, Z.; Xu, T.; Liu, P.; Oeser, M. Microstructures and Optical Performances of Nitrogen-Vanadium Co-Doped TiO2 with Enhanced Purification Efficiency to Vehicle Exhaust. Environ. Res. 2021, 193, 110560. [Google Scholar] [CrossRef]
  19. Wang, Y.; Zhang, R.; Li, J.; Li, L.; Lin, S. First-Principles Study on Transition Metal-Doped Anatase TiO2. Nanoscale Res. Lett. 2014, 9, 46. [Google Scholar] [CrossRef]
  20. Navidpour, A.H.; Ahmed, M.B.; Zhou, J.L. Photocatalytic Degradation of Pharmaceutical Residues from Water and Sewage Effluent Using Different TiO2 Nanomaterials. Nanomaterials 2024, 14, 135. [Google Scholar] [CrossRef]
  21. Chnirheb, A.; Harir, M.; Kanawati, B.; Azzouzi, M.E.; Gebefügi, I.; Schmitt-Kopplin, P. Efficiency and Degradation Products Elucidation of the Photodegradation of Mefenpyrdiethyl in Water Interface Using TiO2 P-25 and Hombikat UV100. J. Environ. Sci. 2012, 24, 1686–1693. [Google Scholar] [CrossRef]
  22. Zumeta, I. Comparative Study of Nanocrystalline TiO2 Photoelectrodes Based on Characteristics of Nanopowder Used. Sol. Energy Mater. Sol. Cells 2003, 76, 15–24. [Google Scholar] [CrossRef]
  23. Kraidy, A.F.; Yapi, A.S.; El Marssi, M.; Penton Madrigal, A.; Gagou, Y. Structural Refinement and Optoelectrical Properties of Nd2Ru2O7 and Gd2Ru2O7 Pyrochlore Oxides for Photovoltaic Applications. Materials 2024, 17, 2571. [Google Scholar] [CrossRef] [PubMed]
  24. Mejica, G.F.C.; Unpaprom, Y.; Ramaraj, R. Fabrication and Performance Evaluation of Dye-Sensitized Solar Cell Integrated with Natural Dye from Strobilanthes Cusia under Different Counter-Electrode Materials. Appl. Nanosci. 2023, 13, 1073–1083. [Google Scholar] [CrossRef]
  25. Gu, P.; Yang, D.; Zhu, X.; Sun, H.; Wangyang, P.; Li, J.; Tian, H. Influence of Electrolyte Proportion on the Performance of Dye-Sensitized Solar Cells. AIP Adv. 2017, 7, 105219. [Google Scholar] [CrossRef]
  26. Sreethawong, T.; Yamada, Y.; Kobayashi, T.; Yoshikawa, S. Catalysis of Nanocrystalline Mesoporous TiO2 on Cyclohexene Epoxidation with H2O2: Effects of Mesoporosity and Metal Oxide Additives. J. Mol. Catal. Chem. 2005, 241, 23–32. [Google Scholar] [CrossRef]
  27. Uddin, M.T.; Mukhlish, B.; Zobayer, M.; Mondal, J.; Shafiul, H. Hydrothermal Synthesis of Mesoporous TiO2 Nanoparticles for Enhanced Photocatalytic Degradation of Organic Dye. Indian J. Chem. Technol. 2023, 30, 320–330. [Google Scholar] [CrossRef]
  28. Holzwarth, U.; Gibson, N. The Scherrer Equation versus the “Debye-Scherrer Equation”. Nat. Nanotechnol. 2011, 6, 534. [Google Scholar] [CrossRef]
  29. Kumar, C.P.; Gopal, N.O.; Wang, T.C.; Wong, M.-S.; Ke, S.C. EPR Investigation of TiO2 Nanoparticles with Temperature-Dependent Properties. J. Phys. Chem. B 2006, 110, 5223–5229. [Google Scholar] [CrossRef]
  30. Balachandran, U.; Eror, N.G. Raman Spectra of Titanium Dioxide. J. Solid State Chem. 1982, 42, 276–282. [Google Scholar] [CrossRef]
  31. Ohsaka, T.; Izumi, F.; Fujiki, Y. Raman Spectrum of Anatase, TiO2. J. Raman Spectrosc. 1978, 7, 321–324. [Google Scholar] [CrossRef]
  32. Zhang, Y.-H.; Chan, C.K.; Porter, J.F.; Guo, W. Micro-Raman Spectroscopic Characterization of Nanosized TiO2 Powders Prepared by Vapor Hydrolysis. J. Mater. Res. 1998, 13, 2602–2609. [Google Scholar] [CrossRef]
  33. Tauc, J.; Grigorovici, R.; Vancu, A. Optical Properties and Electronic Structure of Amorphous Germanium. Phys. Status Solidi B 1966, 15, 627–637. [Google Scholar] [CrossRef]
  34. Ali, N.; Jabeen, M.; Khesro, A.; Ahmed, R.; Alrobei, H.; Kalam, A.; Al-Sehemi, A.G. Combinatorial Synthesis of Tin Antimony Sulfide Thin Films for Solar Cell Application. Int. J. Energy Res. 2021, 45, 21527–21533. [Google Scholar] [CrossRef]
  35. Kraidy, A.F.; El Radaf, I.M.; Zeinert, A.; Lahmar, A.; Peláiz-Barranco, A.; Gagou, Y. Optoelectrical Properties of the Ternary Chalcogenide SnSb2S5 as a New Absorber Layer for Photovoltaic Application. J. Phys. Appl. Phys. 2024, 57, 205102. [Google Scholar] [CrossRef]
  36. Xu, K. Silicon Electro-Optic Micro-Modulator Fabricated in Standard CMOS Technology as Components for All Silicon Monolithic Integrated Optoelectronic Systems*. J. Micromechanics Microeng. 2021, 31, 054001. [Google Scholar] [CrossRef]
  37. Belghachi, A. Theoretical Calculation of the Efficiency Limit for Solar Cells. In Solar Cells—New Approaches and Reviews; Kosyachenko, L.A., Ed.; InTech: London, UK, 2015; ISBN 978-953-51-2184-8. [Google Scholar]
  38. Kumar, T.S.; Shalini, S.; Roy, T.A.; Prasanna, S.; Balasundaraprabhu, R.; Sundaram, S. Solvent Selection for Anthrocyanin Dye Extraction from Kigelia Africana and Hibiscus Sabdariffa for Dye Sensitized Solar Cells. J. Photochem. Photobiol. 2024, 20, 100233. [Google Scholar] [CrossRef]
  39. El-Ahmar, M.H.; El-Sayed, A.-H.M.; Hemeida, A.M. Mathematical Modeling of Photovoltaic Module and Evalute the Effect of Varoius Paramenters on Its Performance. In Proceedings of the 2016 Eighteenth International Middle East Power Systems Conference (MEPCON), Cairo, Egypt, 27–29 December 2016; pp. 741–746. [Google Scholar]
  40. Taretto, K.; Soldera, M.; Troviano, M. Accurate explicit equations for the fill factor of real solar cells—Applications to thin-film solar cells. Prog. Photovolt. Res. Appl. 2013, 21, 1489–1498. [Google Scholar] [CrossRef]
  41. Tayeb, A.M.; Solyman, A.A.A.; Hassan, M.; Abu el-Ella, T.M. Modeling and Simulation of Dye-Sensitized Solar Cell: Model Verification for Different Semiconductors and Dyes. Alex. Eng. J. 2022, 61, 9249–9260. [Google Scholar] [CrossRef]
  42. Vaillant, L.; Vigil, E.; Forcade, F.; Thami, T.; Adnani, H.; Yacou, C.; Ayral, A.; Saint-Grégoire, P. On Fundamental Mechanisms in Dye Sensitized Solar Cells through the Behaviour of Different Mesoporous Titanium Dioxide Films. Eur. Phys. J. Appl. Phys. 2015, 72, 20404. [Google Scholar] [CrossRef]
Figure 1. Natural dye-sensitized solar cell device.
Processes 12 02481 g001
Figure 2. XRD patterns of processed layers.
Processes 12 02481 g002
Figure 3. Raman spectra obtained from all the studied samples.
Processes 12 02481 g003
Figure 4. SEM, cross-section, and surface morphology of TiO2 Hombikat UV100 (HP0), HP50, and TiO2 P25 films.
Processes 12 02481 g004
Figure 5. Reflectance (a) and transmittance (b) spectra of processed layers.
Processes 12 02481 g005
Figure 6. Absorbance spectra (a) and Tauc’s diagram of all studied samples (b).
Processes 12 02481 g006
Figure 7. (a) J-V curve of the DSSC-Ns and (b) evolution of their efficiency versus P25 content.
Processes 12 02481 g007
Figure 8. J-V curve of DSSC-N for first (red color) and second (green color) elaboration based on HP50 and efficiency deduced.
Processes 12 02481 g008
Table 1. DSSC-N parameters obtained in this work.
PhotoanodeJsc (mA/cm2)Voc (V)FF (%)η (%)
HP-013.220.6653.654.68
HP-3010.400.7058.544.27
HP-4010.620.7358.094.48
HP-4513.990.5956.74 4.69
HP-5014.750.6550.414.87
Disclaimer/Publisher’s Note: The statements, opinions and data contained in all publications are solely those of the individual author(s) and contributor(s) and not of MDPI and/or the editor(s). MDPI and/or the editor(s) disclaim responsibility for any injury to people or property resulting from any ideas, methods, instructions or products referred to in the content.