Article

Integration of Thermal Solar Power in an Existing Combined Cycle for a Reduction in Carbon Emissions and the Maximization of Cycle Efficiency

by
Adham Mohamed Abdelhalim
1,
Andrés Meana-Fernández
2,* and
Ines Suarez-Ramon
2
1
Mechanical Engineering Department, College of Engineering and Technology, Arab Academy for Science, Technology and Maritime Transport, Alexandria 21611, Egypt
2
Thermal Machines and Engines Area, Department of Energy, University of Oviedo, 33204 Gijon, Spain
*
Author to whom correspondence should be addressed.
Processes 2024, 12(11), 2557; https://doi.org/10.3390/pr12112557
Submission received: 11 October 2024 / Revised: 8 November 2024 / Accepted: 13 November 2024 / Published: 15 November 2024
(This article belongs to the Special Issue 2nd Edition of Innovation in Chemical Plant Design)

Abstract

:
The energy transition towards renewable energy sources is vital for handling climate change, air pollution, and health-related problems. However, fossil fuels are still used worldwide as the main source for electricity generation. This work aims to contribute to the energy transition by exploring the best options for integrating a solar field within a combined cycle power plant. Different integration positions at the gas and steam cycles for the solar field were studied and compared under several operating conditions using a thermodynamic model implemented in MATLAB R2024a. Fuel-saving and power-boosting (flowrate and parameter boosting) strategies were studied. The results revealed that, for a maximum fuel savings of 7.97%, the best option was to integrate the field into the steam cycle before the economizer stage. With an integrated solar thermal power of 3 MW, carbon dioxide emissions from fuel combustion were reduced to 8.3 g/kWh. On the other hand, to maximize power plant generation, the best option was to integrate the field before the superheater, increasing power generation by 24.2% for a solar thermal power of 4 MW. To conclude, guidelines to select the best integration option depending on the desired outcome are provided.

1. Introduction

For more than 50 years, global energy consumption has been increasing at rates between 1% and 2% [1], with the only exceptions being the early 1980s (the energy crisis), 2009 (the financial crisis), and 2020 (the COVID crisis). In addition, the average energy consumption annual growth rate of 1.5% from 2010 to 2019 reached a maximum of 2.2% in the year 2023 [2]. Currently, fossil fuels provide more than 80% of the primary energy, with coal representing 27% of this total [3,4]. Between 1965 and 2022, the use of fossil fuels increased globally by 96,796 TWh, becoming around 2.4 times higher. Asia reached a total generation of 775,566 TWh from fossil fuels, and in Europe, fossil fuel generation grew by 21,391 TWh [1]. Iran experienced a growth of 3518%, passing from 92 to 3335 TWh. On the other hand, the United Kingdom reduced fossil fuel generation by 33%, from 2259 to 1519 TWh [1].
As long as fossil fuels lead the energy system, the world will continue to face energy scarcity for millions of people and the worsening of climate change and pollution effects. As the world population increases, so will the energy demand. Therefore, fuel consumption is expected to increase unless the efficiency of power generation systems is improved. In addition, low-carbon energy sources should replace fossil fuels in the energy mix to handle climate change, pollution, and health-related problems.
With the social demand for cleaner energy sources and technologies, most countries are making significant efforts to adopt renewable generation, which increased from 2795 TWh in 1965 to 23,848 TWh in 2022 [1]. Asia had the highest renewable energy consumption in 2022, with 10,879 TWh. South America increased renewable generation by 2270% from 1965 to 2022, passing from 117 TWh to 2773 TWh. As a consequence of those efforts, the global share of renewable energy in electricity generation is now around 30% [5]. The share of solar and wind power increased from 2.8% in 2012 to 12.1% in 2022 [6], with the investment in solar power increasing up to 310 billion dollars, a 36% increase from 2018 to 2022 [5]. The International Renewable Energy Agency (IRENA) expects the share of renewable energy consumption to reach 28% by 2030 and 66% by 2050 [7]. The share of renewables in the electricity sector is expected to increase more, reaching 57% by 2030 and 86% by 2050 [8].
Solar energy is one of the most important renewable energy sources. It is available and affordable, and it requires low maintenance costs [9]. Between 1991 and 2020, solar energy has expanded at an exponential rate and become a common energy source. In fact, it has been claimed that smart solar energy systems could supply the whole world energy demand without additional energy sources [10]. In addition, the carbon footprint of solar panels is 95% lower than coal-based technologies [11]. According to a study by Lawrence Berkeley National Laboratory in USA, the implementation of solar and wind energy between 2019 and 2022 generated USD 249 billion in climate, pollution, and health benefits, avoiding from 1200 to 1600 premature deaths [12]. In addition, the cost of renewable technologies has dropped by around 60%, especially in the case of solar panels [9]. Solar energy is predicted to become extremely cost-competitive by 2030, with prices from 0.02 to 0.08 USD/kWh [12].
Despite the advances in renewable technologies, gas power plants currently generate 22% of global electricity, with natural gas consumption increasing up to 6100 TWh in 2021 [6]. Combined cycles (CC) are the most common power plants, using exhaust gases from a top gas cycle to generate steam in a Heat Recovery Steam Generator (HRSG) and power a bottom steam cycle. A feasible strategy for reducing the environmental impact of combined cycles is the integration of solar energy in the so-called Integrated Solar Combined Cycles (ISCC), especially in tropical regions. These cycles, which combine gas-fired power cycles and Concentrated Solar Power (CSP) technologies, have the advantage of preventing power outer risks that could result from relying only on solar power. The thermal energy obtained from the combustion of natural gas is complemented by the thermal energy produced by solar concentrators, increasing the total efficiency of the system [13]. Although parabolic trough solar power plants were proposed in the 1990s by Luz Solar International [14], economic factors prevented the building of power plants before the 2000s, when the Global Environment Facility financed USD 50 million for the construction of four ISCC power plants in developing countries with intense solar irradiation, most of them in the Middle East. This incentive renewed the interest in Concentrated Solar Power (CSP) technologies, specifically in Parabolic Trough Collectors (PTC) [15]. It has been predicted that CSP power plants will represent 25% of global power generation by 2050 [16]. Due to the lower cost of thermal energy storage with respect to batteries, CSP technologies seem more suitable for baseload power generation than photovoltaic systems. Nevertheless, solar fields are still relatively costly [17].
Research has been conducted on solar thermal power integration at the top (Brayton) and the bottom (Rankine) cycles, with several hybrid setups [18,19]. When integrated into the top gas cycle, solar power is used to preheat compressed air before entering the combustion chamber [14]. When integrated into the bottom steam cycle, it is typically used to generate more steam to power the turbine [20,21]. Barigozzi et al. [22] investigated the performance of an ISCC with solar integration at the top and bottom cycles. A higher solar-to-electricity efficiency was obtained when solar power was integrated at the top cycle, but power generation was higher through integration in the bottom cycle.
According to Behar [23], PTCs with synthetic oils as the heat transfer fluid (HTF) are the most efficient method for solar power integration at the bottom cycle. The results from the work of Manente et al. [24] showed the highest solar-to-electricity efficiency values when synthetic oil was used to evaporate water at the high pressure level of the HRSG. This conclusion matches the results from Elmohlawy et al. [25], who found an increase in the thermal efficiency by 1.2% when injecting the steam at the high pressure level instead of at the intermediate one. El Mohalawy et al. [26] developed a model for two ISCC configurations with PTCs for a plant with an original capacity of 503 MW. In the first configuration, a solar steam generator (SSG) was used to complement the intermediate pressure evaporator and superheater. In the second configuration, the feedwater from the deaerator was superheated using the SSG. They found that the second configuration generated more power than the first one, allowing to reduce CO2 emissions by around 51,671 ton.
Rovira et al. presented an innovative hybrid configuration [27] with a partially recuperative Brayton cycle for fuel saving with the introduction of solar power, achieving higher solar power shares than standard layouts. The 135 MW Kurymat plant in Egypt, in operation since 2011 [28], works by heating synthetic oil with PTCs and heating a portion of the high-pressure water of the steam cycle before it returns to the HRSG. Abdel Dayem et al. [28] developed a model of this plant, finding that the increase in direct normal irradiance (DNI) could increase the turbine power and the solar share by 10% and 25%, respectively. All these sources, along with the work of Muñoz, Rovira, and Montes [29], show that solar integration into the bottom cycle with PTCs and synthetic oils is the most common configuration in current or developing projects, with solar share values from 3% to 14%. The best thermodynamic performance is obtained when integrating solar energy at the high pressure level of the HRSG for steam evaporation and/or superheating. Javadi et al. [30] examined different possibilities for integrating solar power into a combined cycle with two pressure levels: preheating the fuel or air before the combustion chamber or integrating it at the high pressure level of the HRSG. In line with previous studies, the highest power generation at the lowest cost was found when solar power was integrated into the high-pressure line of the HRSG.
Hosseini et al. [31] compared six thermal power plants, claiming an ISCC with a 67 MW solar field to be the optimal configuration. This plant could avoid the emission of 2.4 Mt of CO2 and save USD 59 million in fuel consumption over its 30-year operational life. Compared to a combined cycle and a simple gas turbine, its levelized cost of electricity (LCOE) is 10% and 33% less expensive. Aghdam et al. [32] explored the integration of solar power into an operating power plant in Iran, finding an increase in plant capacity and electrical efficiency from 714 to 728 MW and from 45 to 47%, respectively. A similar study was performed by Anwar [33] to assess the performance of solar integration of PTCs into the Al-Abdaliya CC in Kuwait with an Engineering Equation Solver (EES) model. The plant and solar capacities were 280 MW and 60 MW, respectively. The results showed that the ISCC efficiency was 20% higher than the original CC and that carbon emissions fall by around 64 kton/year. Ameri and Mohammadzadeh [34] conducted a thermodynamic, thermo-economic, and Life Cycle Analysis of three hybrid designs for a conventional plant in Iran. They reported an increase in power production of 6 MW and a reduction in carbon emissions of 10 g/kWh when the solar field was integrated into the superheater of the bottom steam cycle. Achour et al. [35] developed a thermodynamic model to calculate the thermal performance of an ISCC in Algeria. The overall plant efficiency reached 60%, while the solar-to-electricity efficiency reached 14.4%. Another model was generated by Manente [36] to evaluate the integration of solar energy into a combined cycle, finding that the solar-to-electricity efficiency was between 24 and 29%, but the drop in the gas turbine efficiency at lower load values decreased the ISCC thermal efficiency. Durán-García et al. [37] examined solar thermal power integration in parallel to the HRSG of a combined cycle with two pressure levels. When they introduced the solar field in parallel to the high-pressure economizer, the cycle efficiency increased by 1.32%, but when the solar field was coupled to the low-pressure superheater, the efficiency increase was higher at 3.22%.
Regarding earlier studies that examined the integration of solar thermal power in a combined cycle power plant, some of them focused on solar integration at the top gas cycle, others focused on the bottom steam cycle, and most of them sought to increase plant output power generation. In this work, a study of solar thermal power integration in an existing combined cycle power plant is presented. A real combined cycle power plant in Egypt was examined with the aim of optimizing cycle efficiency and reducing fuel consumption and carbon emissions. Solar thermal power integration was studied at several positions in the top gas and bottom steam cycles and considering different operating strategies, namely fuel saving (FS) and power boosting (PB), providing a comprehensive study of the different possibilities for solar power integration. Firstly, the development of the thermodynamic model of the original combined cycle is presented. Then, the modifications of the model to be adapted to the different ISCC configurations and operating strategies are explained. Finally, the results from the model are assessed, providing guidelines for solar thermal power integration depending on the benefits sought: increasing cycle efficiency, maximizing power delivery, or reducing fuel consumption and carbon emissions.

2. Thermodynamic Model of the Original Combined Cycle

2.1. Description of the Combined Cycle

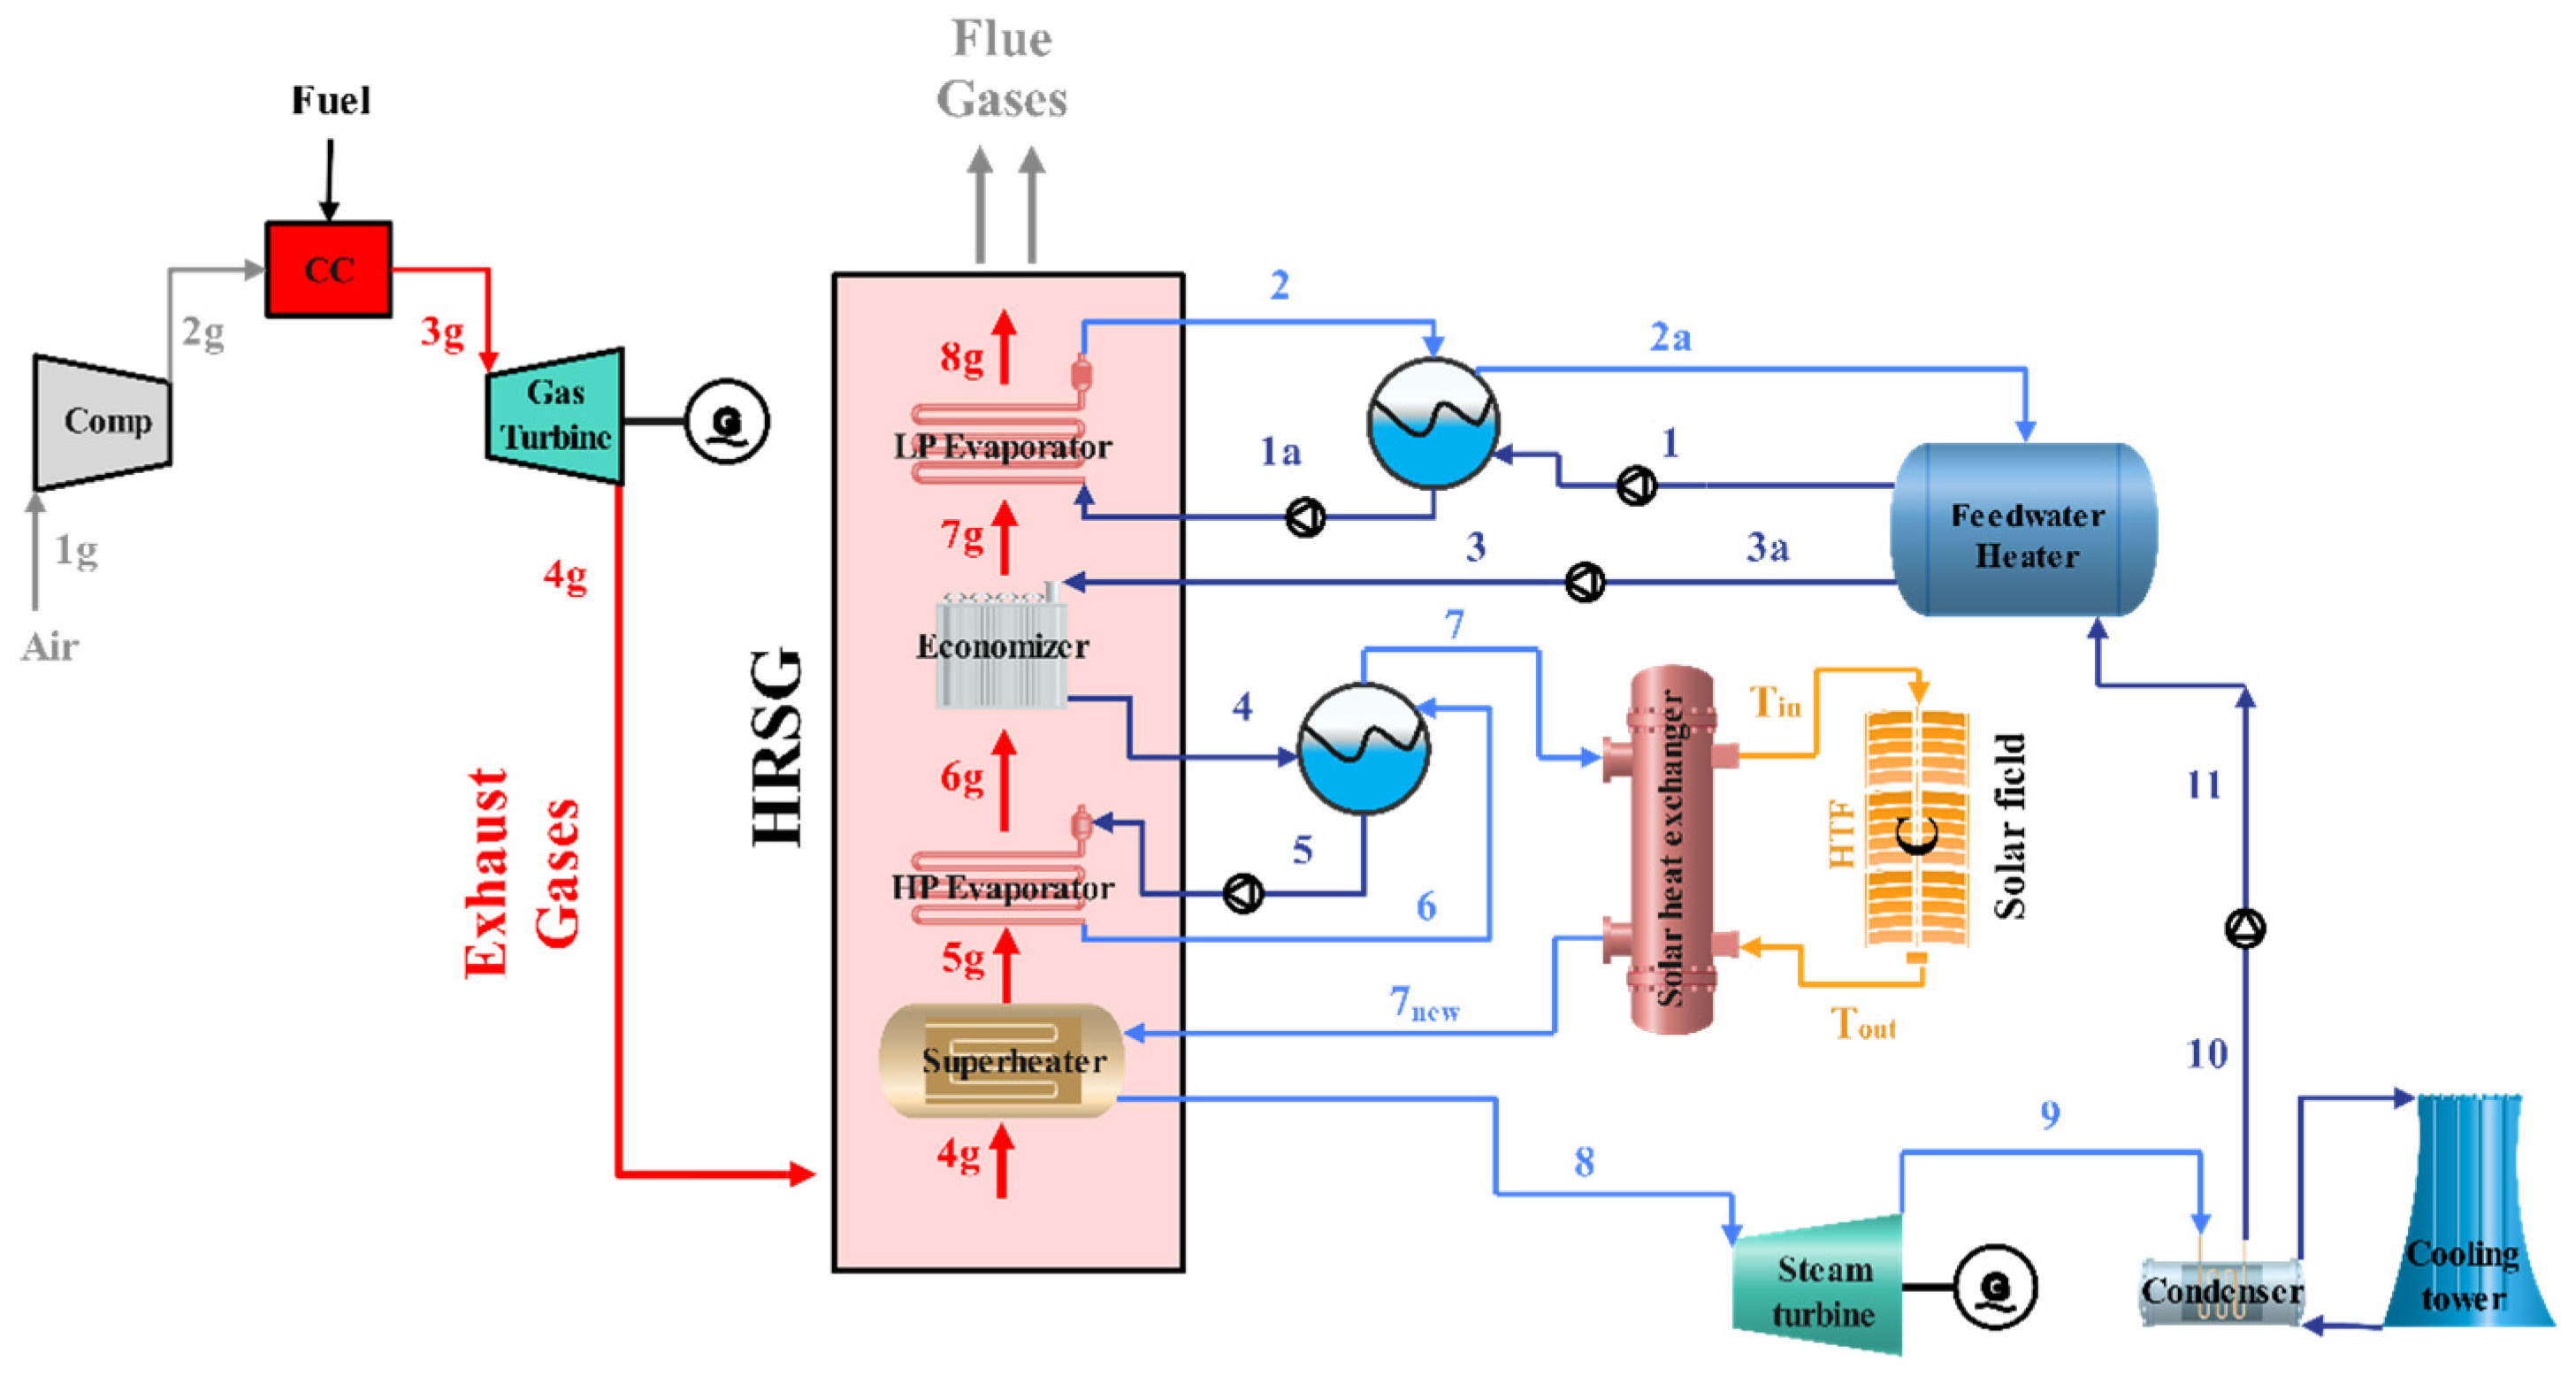
The combined cycle studied in this work is a 90.5 MW power plant in Alexandria, Egypt (latitude 31°12′ N, longitude 29°55′ E, altitude 18 m), property of Egyptian Petrochemicals Co. (EPC) [38]. Figure 1 shows the main components of the power plant: the top gas cycle, the bottom steam cycle, and the HRSG. The steam turbine is a DK-M 045 model fabricated by Brown, Boveri, and Cie (Baden, Switzerland), and the gas turbine is a GT8C model fabricated by ASEA Brown Boveri (Zurich, Switzerland).
Table 1 collects the main characteristics of the cycle, with a cycle efficiency of 56.1%, whereas Figure 2 displays its T-s diagram.

2.2. Thermodynamic Model

The thermodynamic model of the power plant was developed with MATLAB software [39], using the toolboxes Ideal Air [40] and X-Steam [41] to obtain water and air thermodynamic properties. As depicted on the left side of Figure 1, ambient air enters the compressor (1g), where it increases its temperature and pressure (2g). Then, it is mixed with fuel and burns in the combustion chamber, producing high-temperature gases (3g), which are expanded in the turbine up to ambient pressure (4g), generating power and entering the HRSG afterwards. From the pressure ratio rp, pressures P i g in bar and temperatures T i g in K may be calculated as follows:
r p = P 2 g P 1 g = P 3 g P 4 g
r p k 1 k = T 2 g T 1 g
where the heat capacity ratio k is the ratio between the specific heat at constant pressure c p and at constant volume c v in kJ/(kg·K). The following equations were used to obtain the power of the gas turbine W ˙ G T and compressor W ˙ c o m p , the thermal power supplied in the combustion chamber Q c c , and the net power of the gas cycle W ˙ G n e t in kW:
W ˙ G T = m ˙ g · h 3 g h 4 g
W ˙ c o m p = m ˙ a h 2 g h 1 g
Q ˙ c c = m ˙ f · L H V = m ˙ g h 3 g m ˙ a h 2 g
W ˙ G n e t = W ˙ G T W ˙ c o m p
The mass flowrates of gases m ˙ g , air m ˙ a , and fuel m ˙ f are expressed in kg/s, and the enthalpy h is expressed in kJ/kg. The natural gas lower heating value L H V is 47,000 kJ/kg [42]. The thermal efficiency of the top gas cycle is obtained as follows:
η T = W ˙ G n e t Q ˙ c c
The main components of the bottom steam cycle, on the right side of Figure 1, are the turbine, condenser, and preheater. The steam turbine power in kW may be obtained:
W ˙ S T = m ˙ s · h 8 h 9
The power values of the high-pressure pump W ˙ h p p u m p and the feedwater pump W ˙ f w p u m p are as follows:
W ˙ h p p u m p = m ˙ s · h 3 h 3 a
W ˙ f w p u m p = m ˙ s · h 11 h 10
Then, the net power of the steam cycle can be calculated:
W ˙ S n e t = W ˙ S T W ˙ h p p u m p W ˙ f w p u m p
where m ˙ s is the steam flowrate in kg/s, and h i is the steam enthalpy in kJ/kg. Consequently, the power plant net power and efficiency can be calculated:
W ˙ T o t a l = W ˙ G n e t + W ˙ S n e t
η C C = W ˙ G n e t + W ˙ S n e t Q ˙ c c
The HRSG allows the exchange of thermal energy between the gas turbine exhaust gases and the water from the steam cycle. It consists of four heat exchangers: a superheater, a high-pressure (HP) evaporator, an economizer, and a low-pressure (LP) evaporator. As the UA values and specific configurations of the heat exchangers of the real power plant were not available, it was decided to calculate equivalent UA values using the effectiveness-Number of Transfer Units (ε-NTU) method [43] with a simplified analysis of an equivalent counterflow heat exchanger that operates with the same terminal temperatures and heat transfer rates as the original power plant. The pinch and approach temperatures were obtained from the available power plant data, allowing to adjust the model to match real operating conditions.
Initially, fluid outlet temperatures were guessed to calculate a first value of the Logarithmic Mean Temperature Difference (LMTD). Then, calculations were performed to obtain new values of the outlet temperatures. The LMTD is calculated as follows:
L M T D = T 1 T 2 ln T 1 T 2
where T 1 and T 2 are the temperature differences between the hot and cold fluids at the inlet and outlet in K. The product of the heat transfer area A in m2 and the heat transfer coefficient U in W/(m2·K) can be determined:
U A = Q ˙ L M T D
where Q ˙ is the heat transfer rate in kW. Once ( U A ) is calculated, the Number of Transfer Units ( N T U ) is obtained:
N T U = U A C m i n
where C m i n is the smaller of the two heat capacity rates, i.e., C c o l d and C h o t , of the cold and hot fluids in kW/K, determined from the mass flowrates m i ˙ in kg/s and the fluid specific heats C P i in kJ/(kg·K):
C h o t = m ˙ h o t . C P h o t                                                                             C c o l d = m ˙ c o l d . C w c o l d
To obtain the relationship between the heat exchanger effectiveness Ɛ and the N T U , the ratio between the smaller and greater heat capacity rates is calculated as follows:
C r = C m i n C m a x
The relationship between Ɛ and N T U is obtained from the equation for heat exchangers in counterflow arrangement with a single pass:
Ɛ = 1 exp N T U · 1 C r 1 C r · e x p N T U · 1 C r
Which, for a phase change heat exchanger ( C r 0 ), becomes the following:
Ɛ = 1 exp N T U
The value of Ɛ obtained allows to relate the actual and maximum possible thermal energy transfer rates Q ˙ a c t u a l and Q ˙ m a x i m u m in kW:
Ɛ = Q ˙ a c t u a l Q ˙ m a x i m u m
The maximum possible heat exchanged Q ˙ m a x i m u m can be expressed as given below:
Q ˙ m a x i m u m = C m i n T h o t , i n T c o l d , i n
This equation can be specified for two different cases:
C c < C h :   C m i n = C c   Ɛ = T c o l d , o u t T c o l d , i n T h o t , i n T c o l d , i n
C h < C c :   C m i n = C h Ɛ = T h o t , i n T h o t , o u t T h o t , i n T c o l d , i n
where T i , i n and T i , o u t are the fluid inlet and outlet temperatures and are in K. A new value for the first fluid (with C m i n ) outlet temperature T 1 , o u t is then obtained. Assuming no heat losses in the exchanger, the actual heat transfer rate and the outlet temperature of the second fluid (with C m a x ) are calculated from the following equations:
Q ˙ a c t u a l = m ˙ h o t . C p h o t . T h o t , i n T h o t , o u t
Q ˙ a c t u a l = m ˙ c o l d . C p c o l d . T c o l d , o u t T c o l d , i n
Figure 3 shows the temperature–heat transfer rate diagram of the original combined cycle, where the evolution of temperatures across the HRSG may be observed. The pinch and approach temperatures are 17.5 K and 28 K, whereas the UA values that fit the power plant data are 449 kW/K for the feedwater heater, 164.5 kW/K for the low-pressure evaporator, 175.5 kW/K for the economizer, 475 kW/K for the high-pressure evaporator, and 84.5 kW/K for the superheater.

2.3. Validation of the Model

As explained in the previous subsection, one part of the data obtained from the EPC power plant was used as input data for the model, whereas the rest (intermediate temperatures, pinch, and approach points) were used to validate the model. A comparison between the EPC power plant real values and the values obtained from the model is presented in Table 2. The results show good agreement, enabling the developed model to be used for the study of solar power integration into the original combined cycle.

3. Study of Solar Power Integration (ISCC)

The validated model presented in the previous section was modified to integrate solar thermal power into the combined cycle. Two operating strategies, fuel saving (FS) and power boosting (PB), were analyzed. Figure 4 shows the four possible solar integration positions A, B, C, and D in the gas and steam cycles.

3.1. Fuel-Saving Mode

For fuel-saving operation, the solar field was integrated into the gas or steam cycle to allow a reduction in fuel consumption while keeping the output power of the cycle constant. Once the amount of saved fuel was obtained, the direct reduction in CO2 emissions was calculated from the natural gas L H V and the natural gas/CO2 emission ratio E F N G C O 2 = 0.252 kg/kWh [44]:
C O 2 , a v o i d e d = m ˙ f s a v e d · L H V · E F N G C O 2 · Δ t
where Δ t is the mean solar operation time for Alexandria, i.e., 275 h/month [45], and m ˙ f s a v e d is the fuel consumption reduction thanks to solar thermal power integration in kg/h. Solar integration at the gas cycle differs from integration at the steam, as explained in the following two subsections.

3.1.1. Gas Cycle Integration

As shown in Figure 4, solar thermal power can be integrated at two positions: after the air compressor in order to heat compressed air before it enters the combustion chamber (case A) and after the combustion chamber in order to heat combustion gases before they enter the turbine (case B). According to the literature, case A is the most typical alternative, but case B is worth investigating. The assumptions considered for gas cycle integration in the FS scheme are as follows:
  • Mass flowrates of fuel and air are altered depending on the solar thermal power;
  • Compression specific work is constant;
  • Gas turbine inlet and outlet conditions are constant;
  • The turbine specific work is constant;
  • The top gas cycle output power is constant;
  • The mass flowrate of fuel is reduced;
  • The bottom steam cycle is unaffected;
  • The ISCC overall output power remains constant.
(a)
Case A: After air compressor
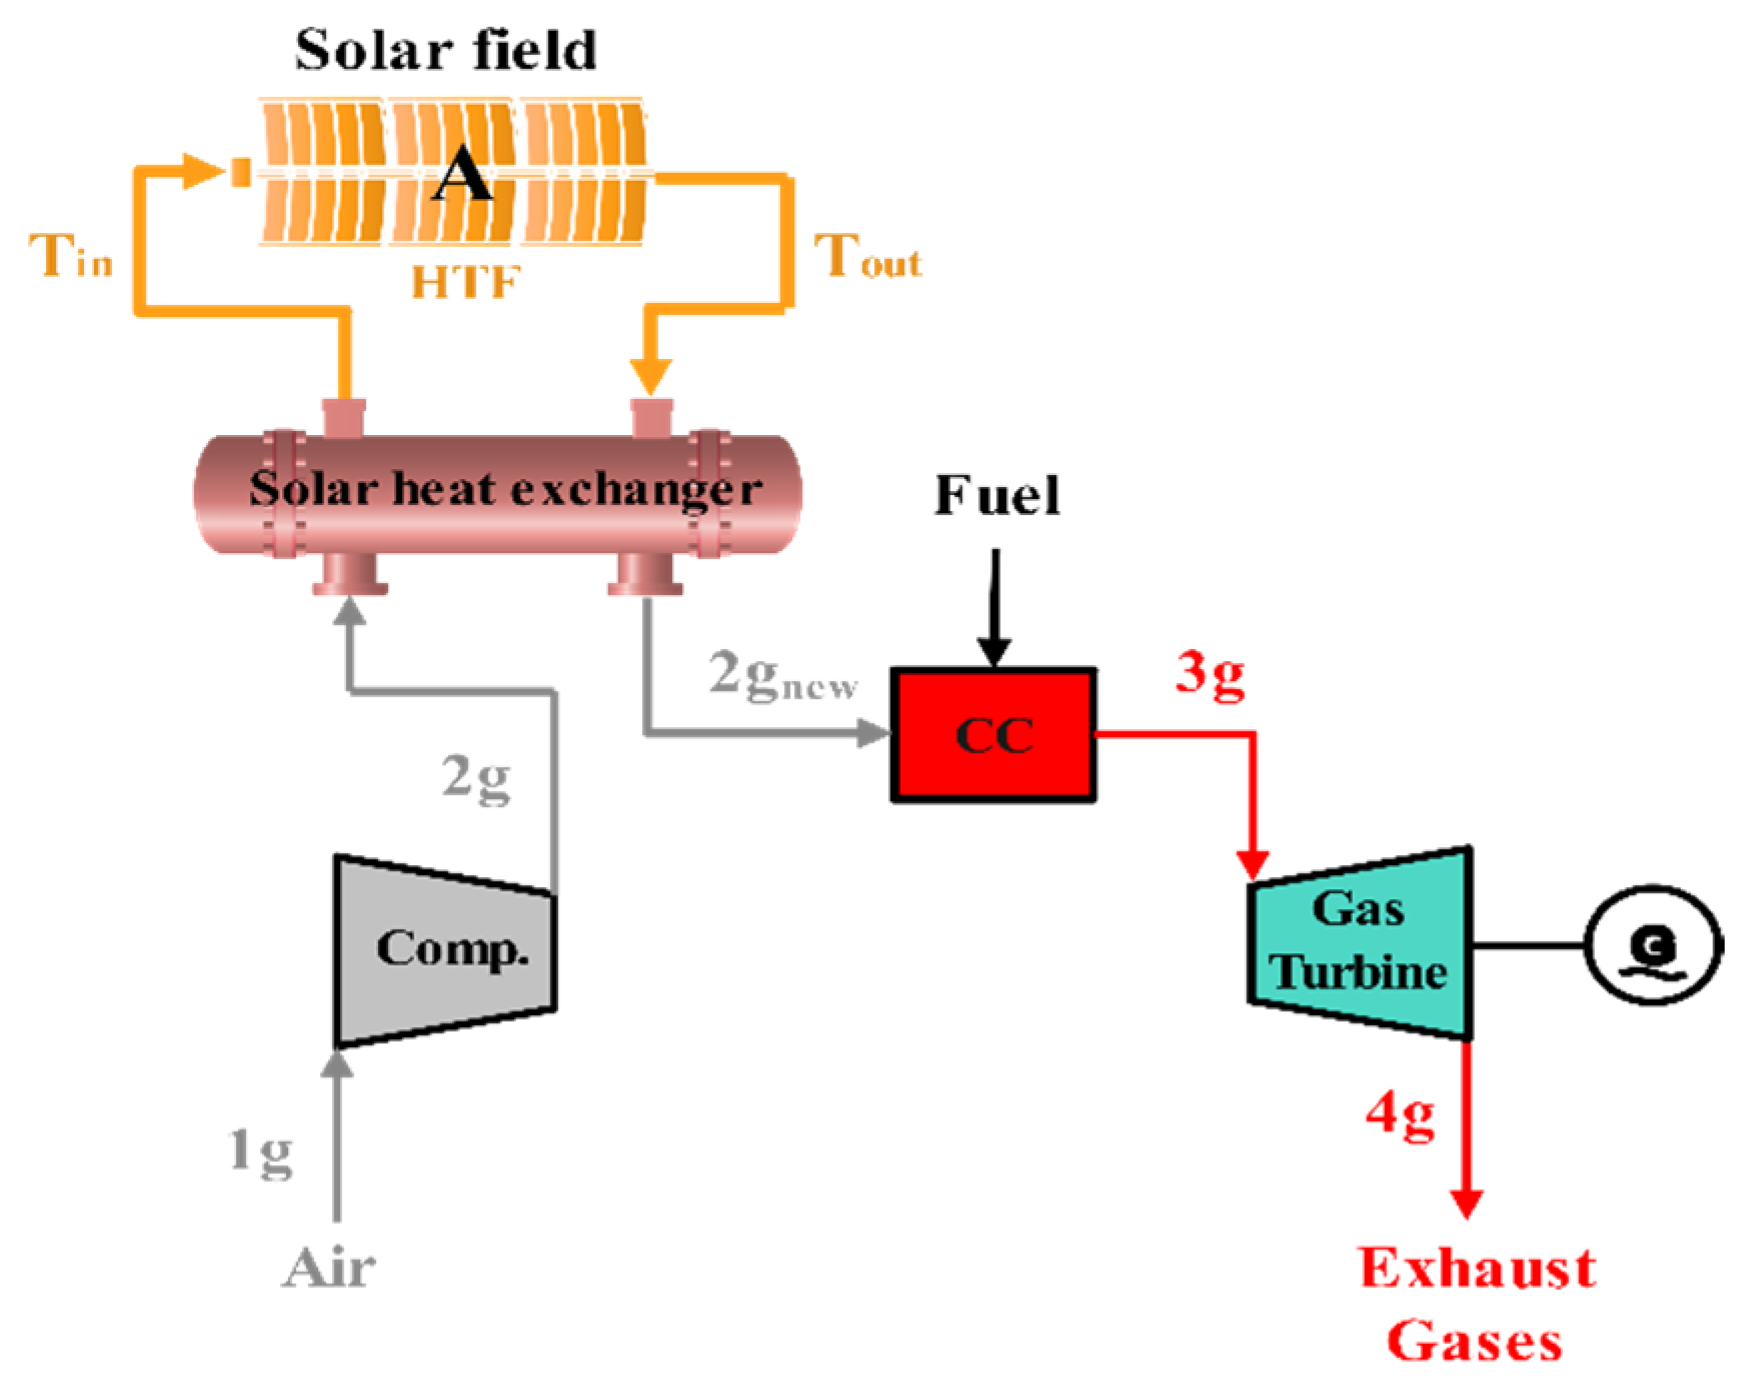
As shown in Figure 5, the solar field is integrated after the compressor, heating the compressed air before it enters the combustion chamber.
The original thermodynamic model was adapted by modifying the air and fuel mass flowrates m ˙ a n e w and m ˙ f n e w , so compression power W ˙ c o m p becomes the following:
W ˙ c o m p = m ˙ a n e w h 2 g h 1 g
The energy balance in the combustion chamber is reformulated as given below:
m ˙ a n e w · h 2 g n e w + Q ˙ c c = m ˙ a n e w · h 2 g n e w + m ˙ f n e w · L H V = m ˙ g h 3 g
The solar heat power integrated Q ˙ S o l a r in kW, assuming no heat losses, becomes the following:
Q ˙ S o l a r = m ˙ a n e w · h 2 g n e w h 2 g
(b)
Case B: After combustion chamber
As depicted in Figure 6, the solar field is integrated after the combustion chamber to heat combustion gases before they enter the gas turbine, resulting in the new thermodynamic state 3gnew. The challenge of heating hot gases from the combustion chamber is significant since they must reach a very high temperature before entering the turbine. The thermodynamic model uses the same assumptions as for case A. As the turbine inlet and outlet conditions are the same as for the original cycle, solar thermal power will allow to reduce fuel consumption in the combustion chamber, reducing the temperature of 3gnew.
An energy balance in the combustion chamber yields the following:
m ˙ a n e w · h 2 g + Q ˙ c c = m ˙ a n e w · h 2 g + m ˙ f n e w · L H V = m ˙ g h 3 g n e w
And the solar thermal power integrated, assuming no heat losses, becomes the following:
Q ˙ S o l a r = m ˙ a n e w · h 3 g h 3 g n e w

3.1.2. Steam Cycle Integration

When working in the fuel-saving operation mode, solar thermal power can be integrated into the bottom steam cycle as well. In this case, the solar integration will compensate for the loss of the gas turbine output power due to the reduction in fuel consumption. Two integration positions were examined: before the superheater, so that saturated steam from the HP drum is heated before entering the actual superheater stage (case C), and before the economizer, with feedwater being preheated before the economizer (case D).
(a)
Case C: Integration before superheater
In this configuration, as shown in Figure 7, outlet steam from the HP drum is heated by the solar field before it enters the superheater. The HRSG temperature distribution will change as water and steam temperatures increase. Hence, the steam turbine will generate more power to compensate for the reduction in the top gas cycle power, allowing to reduce fuel consumption.
The solar heat power integrated, assuming no heat losses, results in the following:
Q ˙ S o l a r = m ˙ s · h 7 n e w h 7
  • (b) Case D: Integration at economizer
The solar field can be integrated into the bottom steam cycle after the feedwater outlet to preheat water before it enters the economizer, as depicted in Figure 8. As in case C, the temperature distribution along the HRSG will be shifted upwards, increasing the steam turbine output power and allowing the use of less fuel in the gas cycle.
The solar heat power integrated, assuming no heat losses, is as follows:
Q ˙ S o l a r = m ˙ s · h 3 n e w h 3

3.2. Power-Boosting Mode

In the power-boosting mode, the same fuel consumption as for the original combined cycle is kept constant, so the integration of the solar field increases the output power of the plant. The same four integration positions examined for the fuel-saving mode, indicated in Figure 4, were studied, but the assumptions for the model change.

3.2.1. Gas Cycle Integration

In this case, the added solar heat will result in an increase in the power output of the gas turbine. Solar thermal power integration was studied after the air compressor (case A, Figure 5) and after the combustion chamber (case B, Figure 6). The developed thermodynamic models were modified with the following assumptions:
  • Air and gas mass flowrates change depending on the integrated solar thermal power;
  • Fuel mass flowrate is steady;
  • Compression work increases;
  • Gas turbine inlet and outlet conditions are constant;
  • The total output power of the upper gas cycle increases;
  • The bottom steam cycle is unaffected. The ISCC overall output power increases.

3.2.2. Steam Cycle Integration

In this case, the gas cycle works at the same conditions as in the original cycle, and the integration of solar power increases the power output of the bottom steam cycle. The same two integration positions as for fuel saving, i.e., before the superheater (case C, Figure 7) and before the economizer (case D, Figure 8) of the HRSG, were studied. Two different operating modes, flowrate and parameter boosting, were considered for each integration position. In the flowrate-boosting mode, the integrated power is used to increase the steam flowrate, whereas in the parameter boosting, it modifies the thermodynamic states of the steam cycle, which continues working with the same steam flowrate.

3.3. Solar Field Technology Selection

Before moving on to the results, considerations about the solar field technology to be used are presented, depending on their operating temperatures. Table 3 collects the characteristics of different solar concentration technologies so that, depending on the solar power integration position, the most suitable technology can be selected. According to the literature, the most common technology in ISCCs is the use of PTCs with Therminol VP-1 as HTF. Therminol VP-1 is characterized by a low dynamic viscosity and a high heat capacity over a large operational temperature range [46]. However, its maximum operating temperature is 390 °C. As the temperature of the cycle working fluids could be higher, solar molten salts could be an alternative HTF [47], as they are able to reach much higher temperatures up to 550 °C. Nevertheless, for temperatures too high, PDR or heliostats will be the only option.

4. Results

Every studied configuration was considered in both fuel-saving and power-boosting operating modes. For fuel saving, maximum reductions in fuel consumption and CO2 emissions were the target; for power boosting, maximization of the output power was the goal. In addition, the maximum solar thermal power that can be integrated into the cycle was evaluated. To make reading easier, the detailed results of all the studied configurations are collected in Appendix A (Table A1, Table A2, Table A3, Table A4, Table A5, Table A6, Table A7 and Table A8), leaving only the most relevant data in this section.

4.1. Fuel-Saving Mode

4.1.1. Gas Cycle Integration

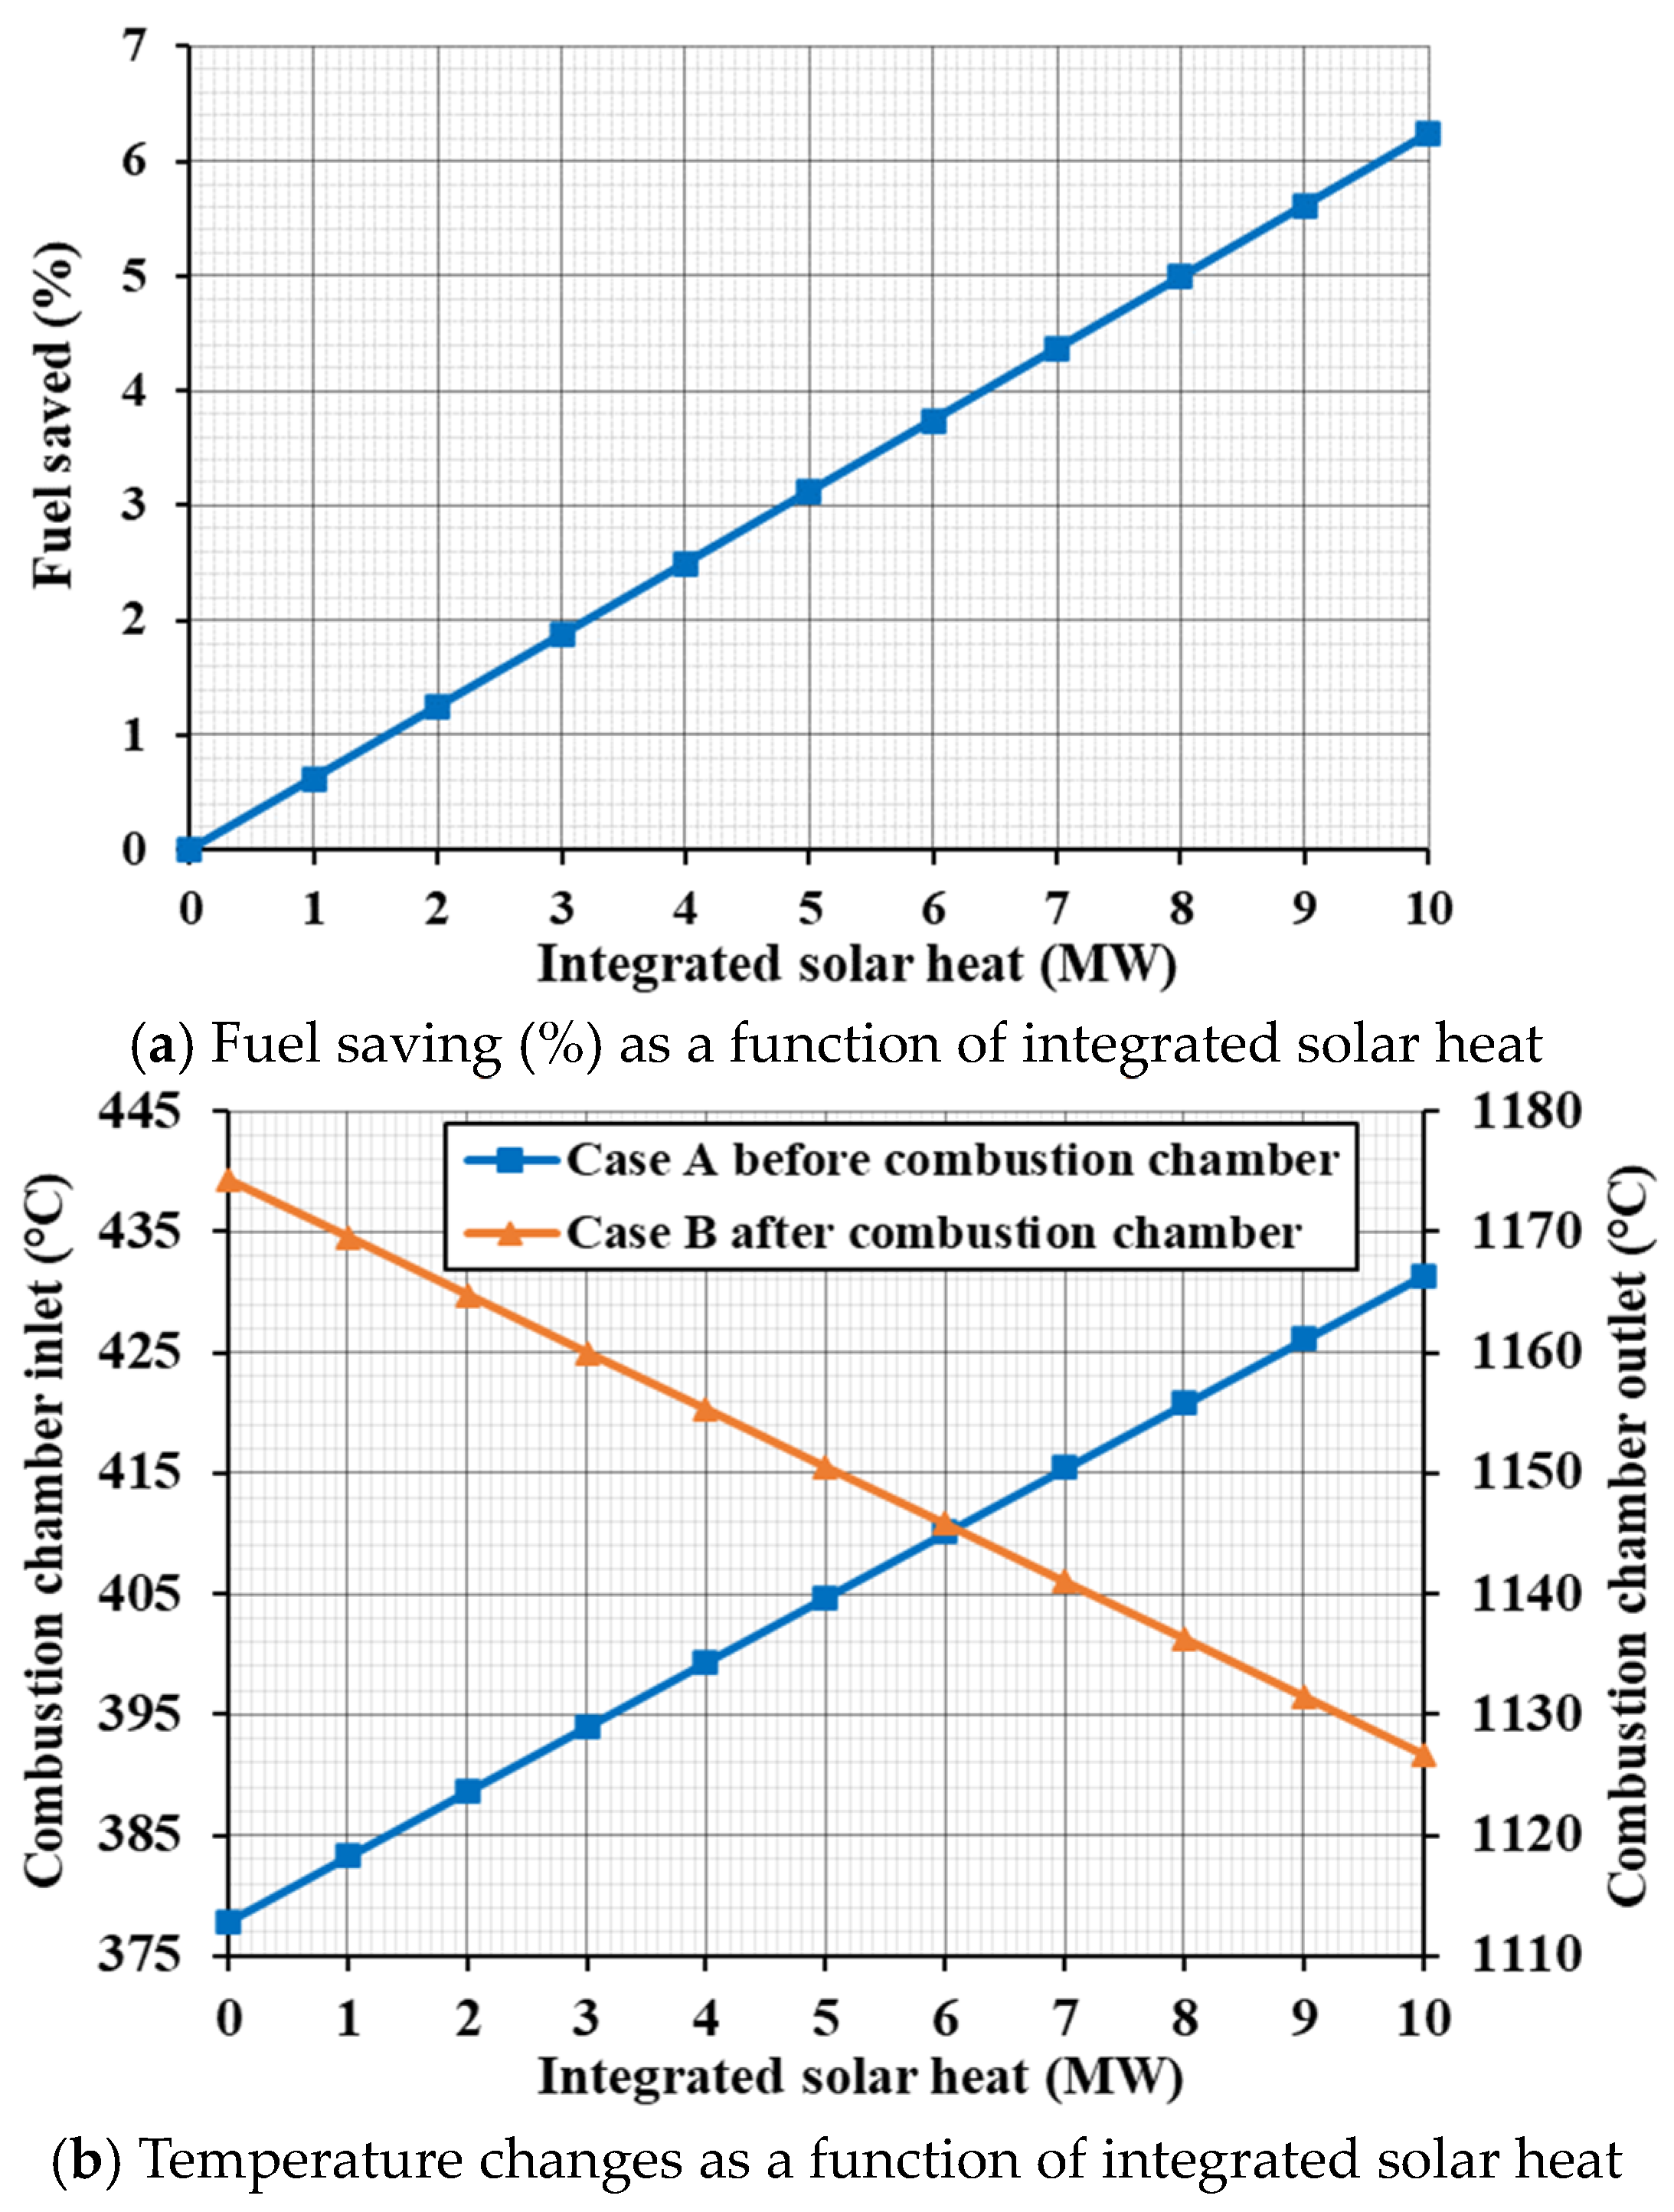
The results of the fuel-saving cases alongside the original values of the combined cycle are collected in Table 4. Total net power remains constant and equal to the original cycle value, 90,569 MW, but the cycle efficiency increases slightly to 56.15%. When compared to the original CC, cases A and B show significant benefits, such as the reduction in fuel consumption of 6.23% when 10 MW solar thermal power is integrated into the cycle. Fuel saving as a function of the integrated solar thermal power is represented in Figure 9a, showing linear behavior. With 28.2 MJ/kg specific work per fuel unit mass, both cases A and B result in cutting carbon emissions by 6.4 g CO2/kWh. In case A, PTC technology could be employed for the solar field placed after the compressor. However, molten salts should be used as HTF, as the maximum output temperature of the solar heat exchanger (T2gnew) reaches 433 °C at 10 MW of integrated solar power, as shown in Figure 9b.
In case B, although global values are the same as in case A, the temperatures of the different states of the gas cycle change, as collected in Table A1. The outlet temperature of the combustion chamber state 3gnew becomes lower, requiring less fuel because the solar heat exchanger will provide the additional heat necessary for reaching the temperature of the state 3g just before the turbine inlet. In case B, when solar power is integrated into the cycle, heat must be transferred to gases at temperatures from 1126.5 °C (3gnew) to 1174 °C (3g), as depicted in Figure 9b. Only heliostat field collectors will be able to provide the required solar thermal power at those temperatures. Comparing options A and B, case A shows a clear advantage, as it allows integrating more solar field technologies.

4.1.2. Steam Cycle Integration

When solar thermal power is integrated into the bottom steam cycle, attention must be paid to steam temperatures. If they rise too much, the direction of heat transfer might be reversed inside the HRSG. To prevent this issue, temperature evolutions inside the HRSG were controlled, obtaining the maximum solar thermal power that may be integrated into the cycle. The detailed results from cases C and D are collected in Table A2.
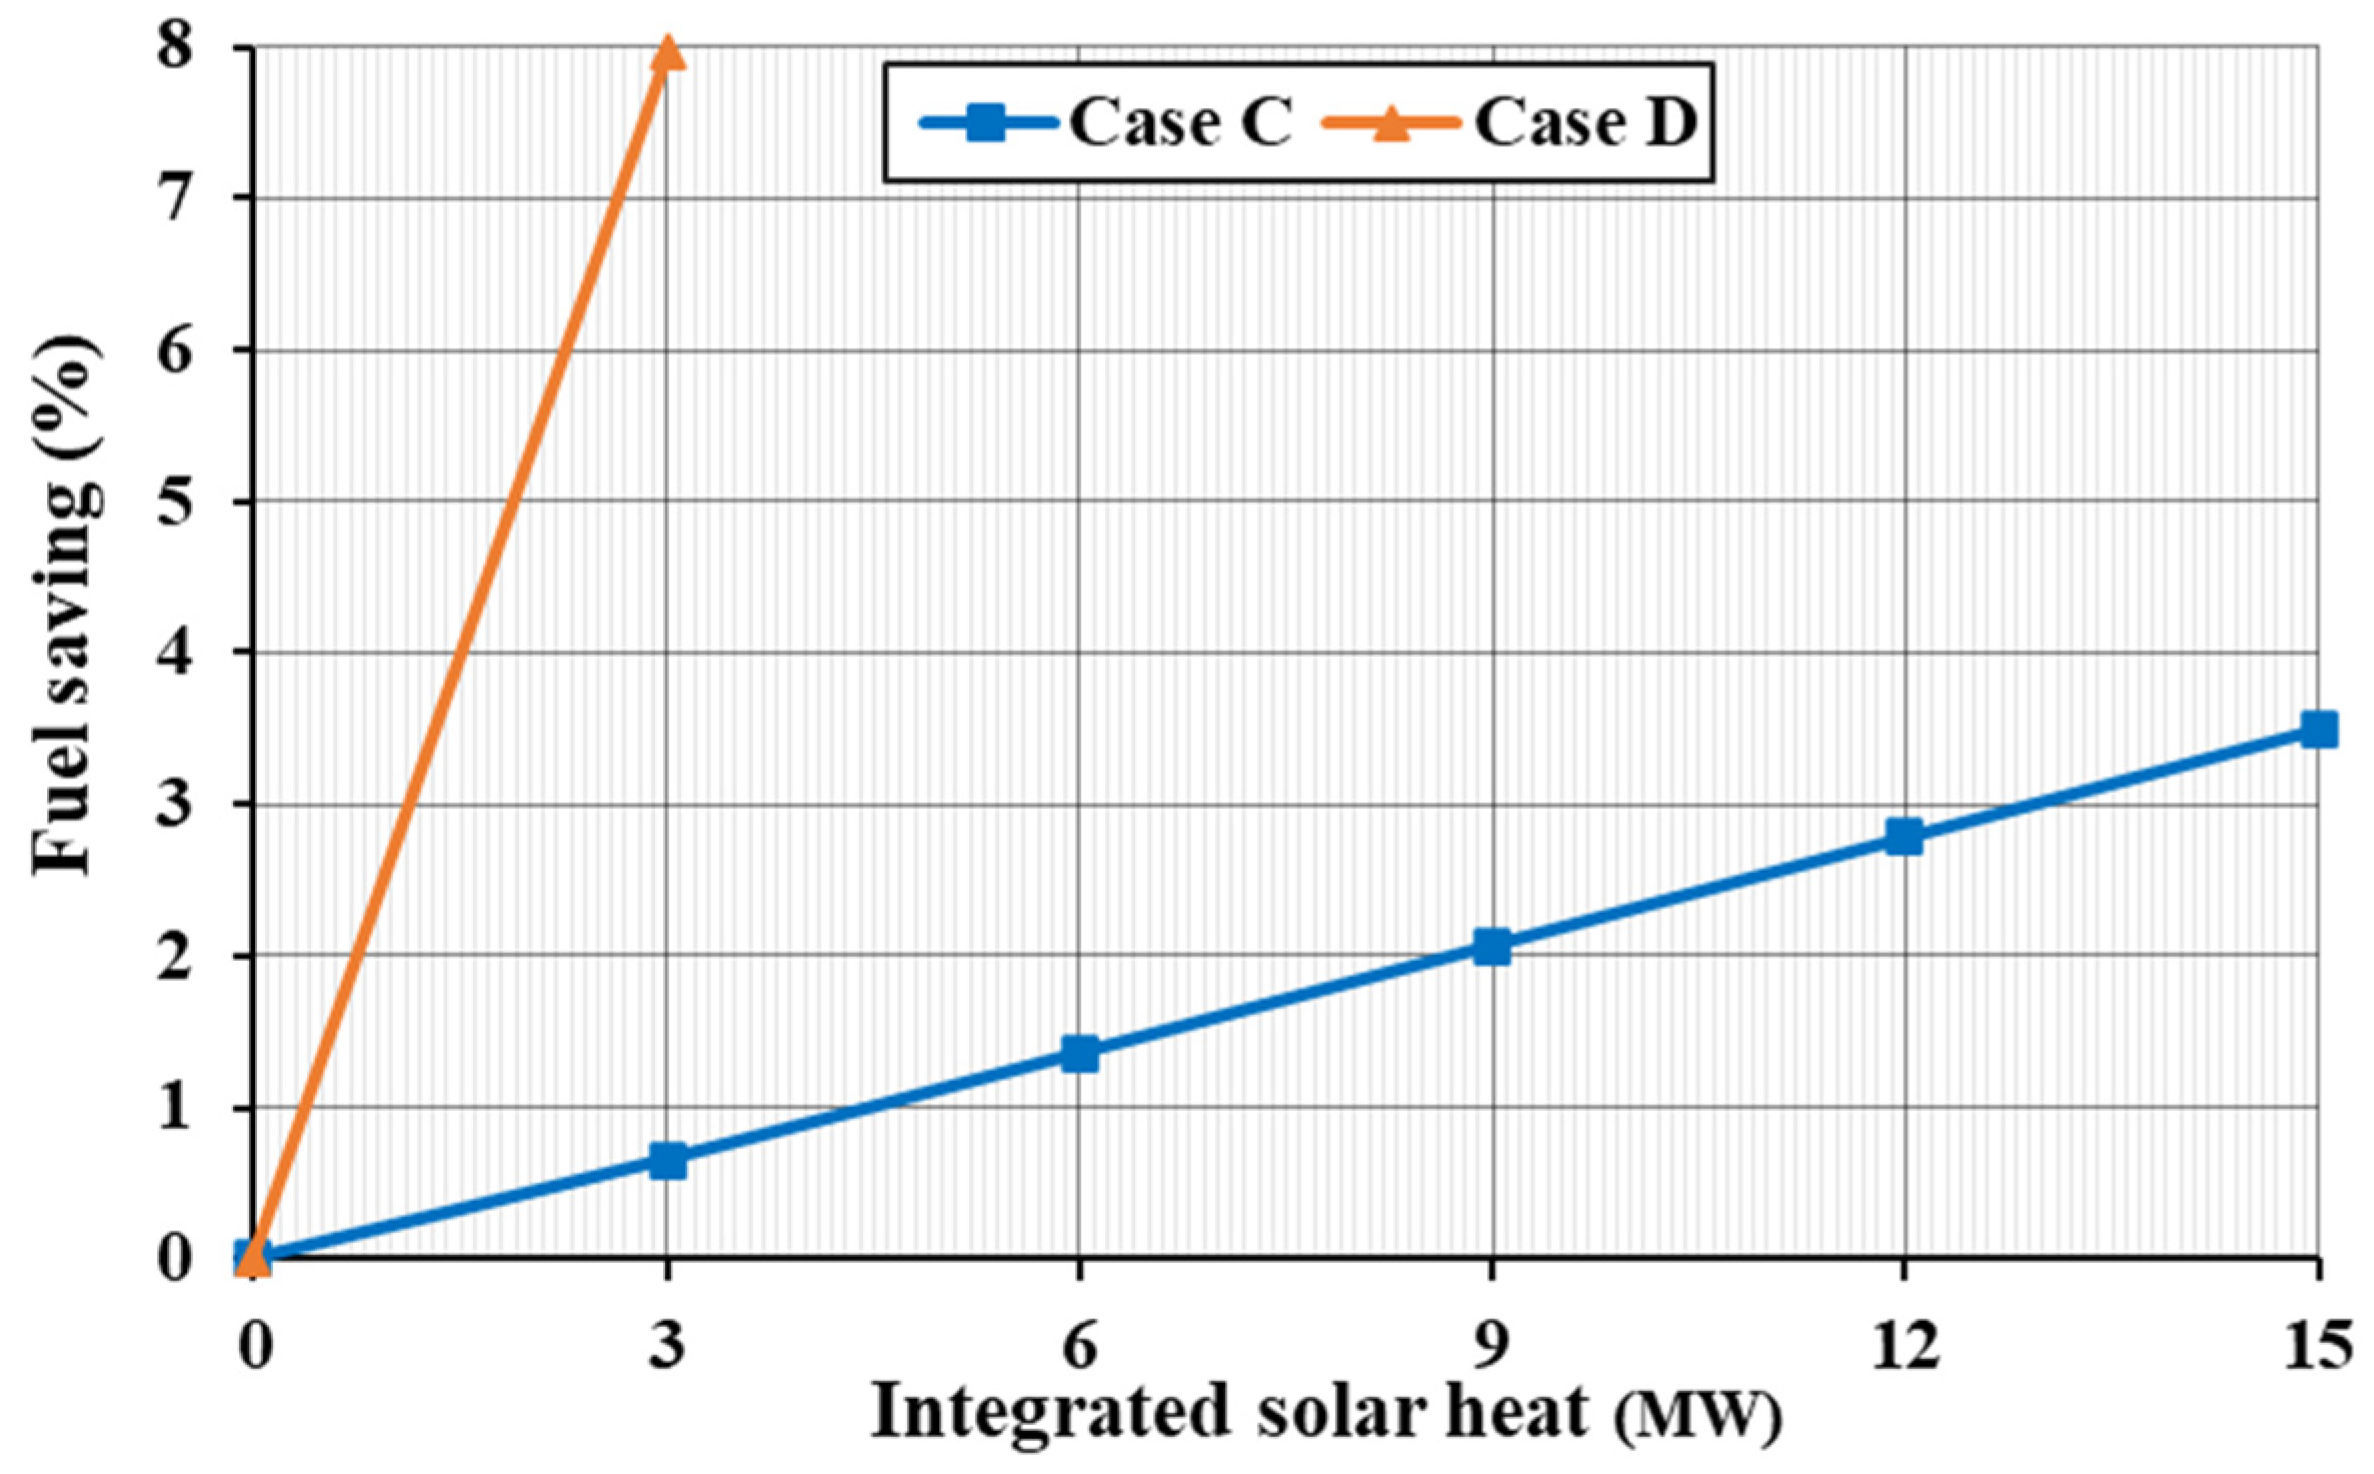
The results from the study of cases C and D are collected in Table 5. In both cases, the top gas cycle was unaffected by solar power integration. The configuration of case C allowed to integrate a maximum of 15 MW solar thermal power before the superheater stage, avoiding the heat transfer reversal inside the HRSG, as depicted in the T-Q diagram shown in Figure 10. This configuration could reduce fuel consumption to 3.3 kg/s, a decrease of 3.49% of the original value. However, the total ISCC efficiency was 53.06%, lower than for the original cycle. On the other hand, the specific work per fuel unit mass increased to 27.4 MJ/kg, leading to a potential reduction in emissions of 3.5 g CO2/kWh. For the configuration presented in case C, as the maximum temperature reached is 480 °C for 15 MW of integrated solar power, the solar field used could be either PDR, heliostats, or even PTCs with molten salts as HTF.
Regarding the configuration of case D, the maximum solar thermal power that could be integrated before the economizer was limited to 3 MW. However, looking at the T-Q diagram in Figure 10, the temperature evolutions of gas and steam are nearer, hinting at a more effective heat transfer inside the HRSG. Indeed, fuel saving reaches a maximum of 7.97%, more than twice the value obtained with 15 MW solar power in case C with just one-fifth of the solar power integrated, as may be observed in Figure 11. Consequently, overall cycle efficiency increases up to 59.79%, the highest value of the four configurations studied for the fuel-saving operation mode. As collected in Table 5, case D reaches a specific work of 28.7 kJ/kg fuel, leading to potential savings of 8.3 g CO2/kWh with only 3 MW of integrated solar power. In addition, due to the lower operating temperatures for the solar heat exchanger, PTCs and PDRs could be used, with PTC and synthetic oils becoming a feasible option.

4.2. Power-Boosting Mode

4.2.1. Gas Cycle Integration

Table 6 collects the results from power-boosting operation when solar power is integrated into the top gas cycle. For case A, an extra power of 4 MW (4.41%) could be obtained by integrating 10 MW of solar thermal power. Generation capacity increased to 27.6 MJ/kg. However, the back work ratio increases slightly to 49.3% due to the higher air-fuel ratio, and the cycle efficiency drops to 55.19%. Temperatures for this case reaches 379 °C at state 2g and 430 °C at state 2gnew, allowing the use of PTCs with solar molten salts, PDRs, or a heliostat field. Considering case B, global cycle parameters are the same as for case A. The main difference is the temperature of state 3g, which reaches 1129.5 °C for 10 MW of integrated solar thermal power, thus requiring a heliostat as the solar field technology. The evolution of power boosting and cycle efficiency as a function of the solar thermal power is depicted in Figure 12, where the increase in the power output alongside a slight decrease in the cycle efficiency becomes apparent.

4.2.2. Steam Cycle Integration: Flowrate Boosting

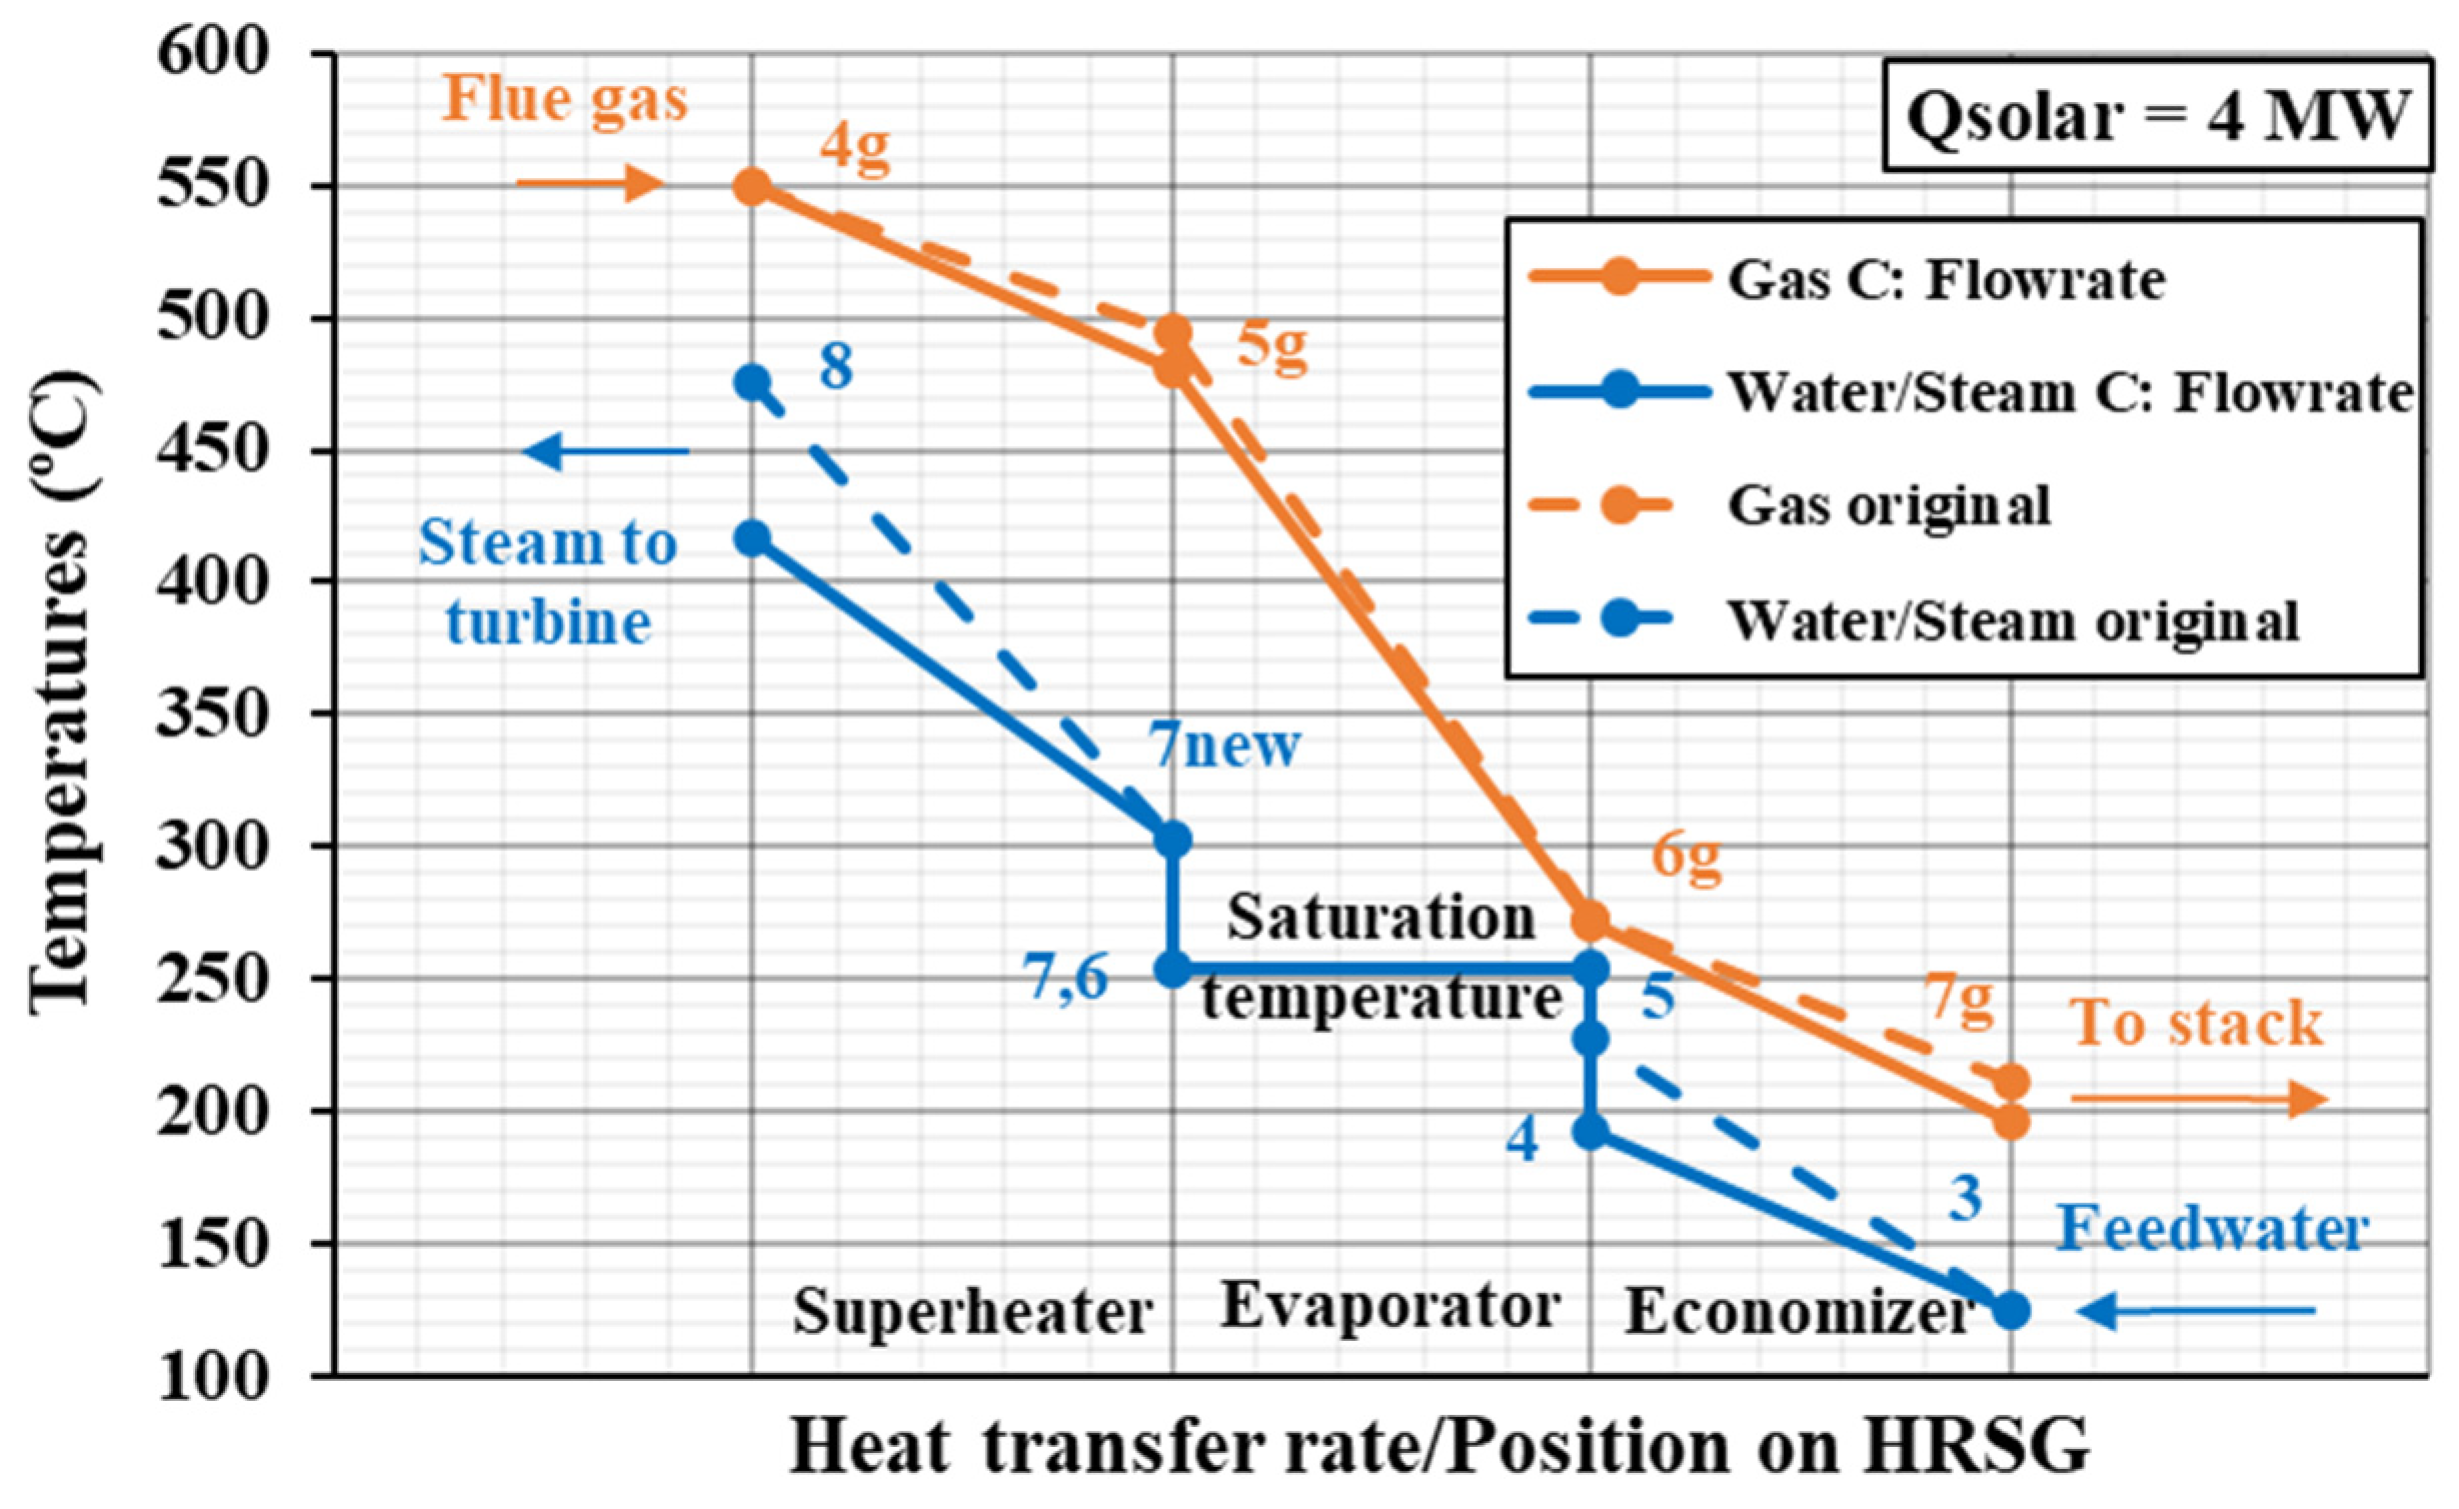
Firstly, the results from flowrate boosting are discussed. In the configuration proposed in case C, a maximum of 4 MW solar thermal power could be integrated before the superheater, resulting in the T-Q diagram represented in Figure 13. As shown in Table 7, the cycle output power increased to 112.5 MW (24.2% boost) thanks to the increase in the steam flowrate from 25 to 45.84 kg/s. Consequently, overall cycle efficiency increased by 11.9%. Leaving the top gas cycle unaffected, it was possible to generate 32.8 MJ/kg fuel, increasing power production in 6.4 MJ/kg fuel. In case C, the maximum steam temperature at the solar heat exchanger was slightly above 300 °C, so selecting PTC technology with synthetic oil as HTF for the solar field becomes a feasible option.
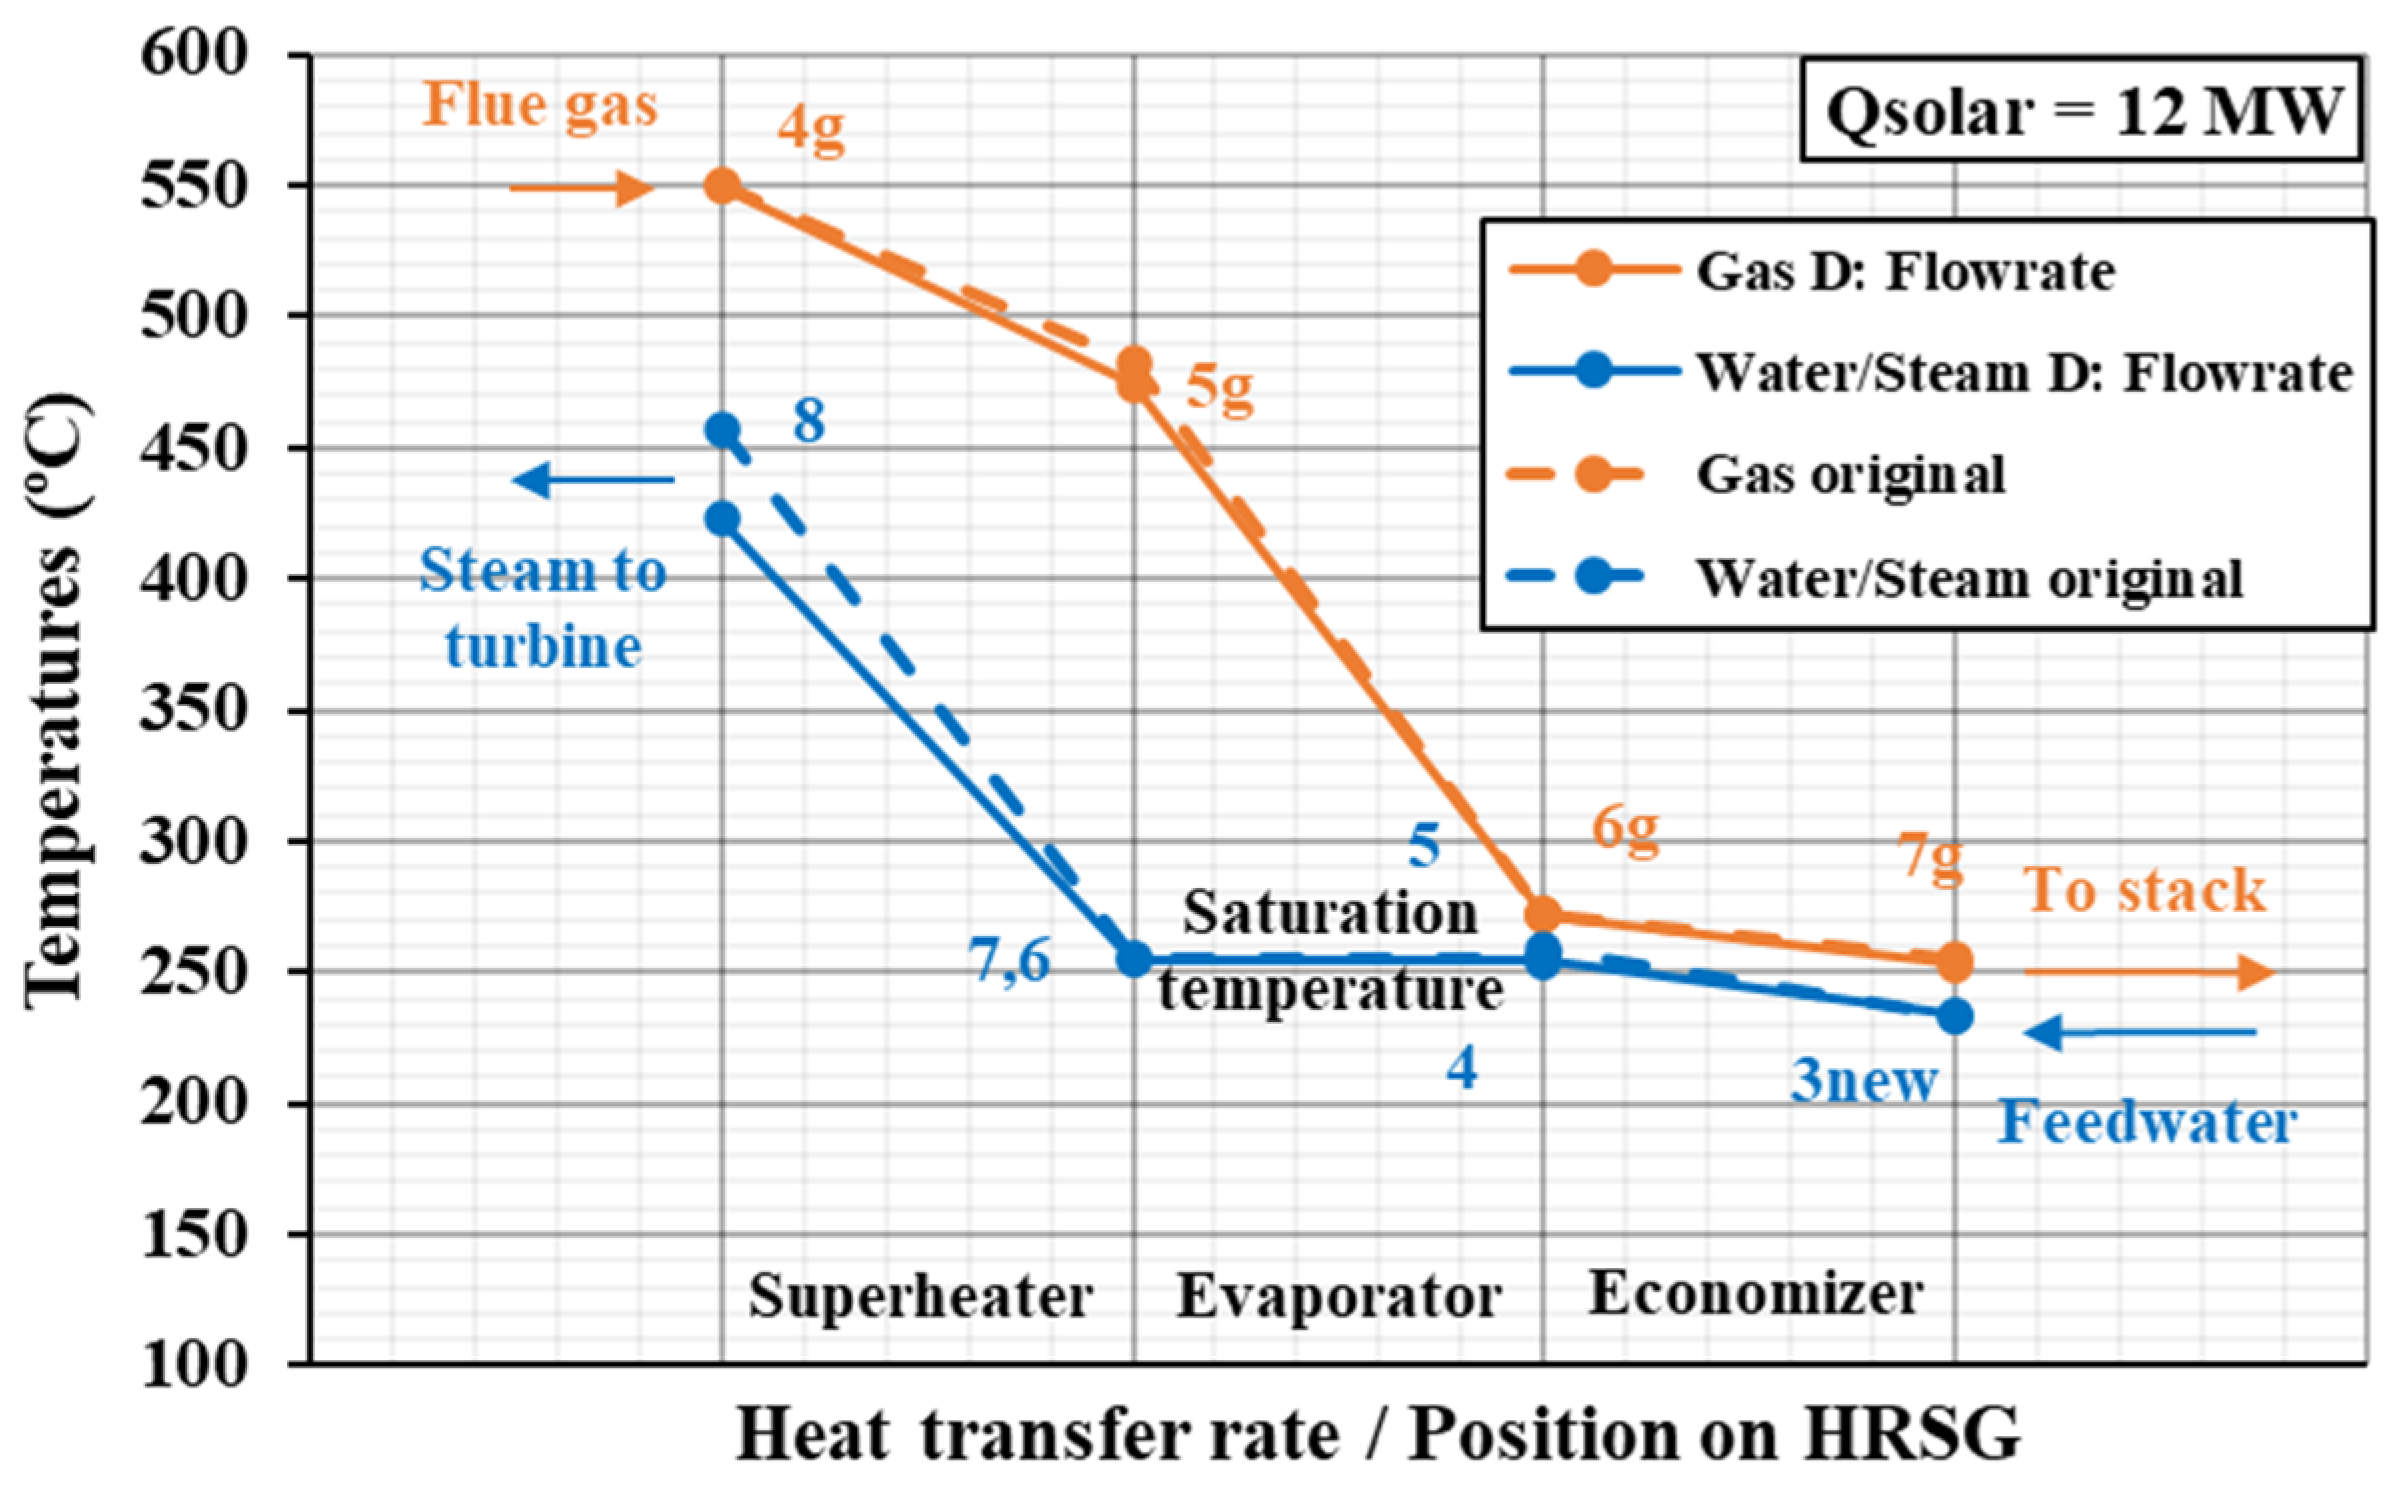
Regarding the configuration of case D, the maximum solar thermal power that could be integrated before the economizer reached 12 MW. In the T-Q diagram of the HRSG shown in Figure 14, it may be appreciated how water and gas temperatures became slightly closer at the economizer stage. As collected in Table 7, the maximum output power was around 98.7 MW (8.96% boost), with overall cycle efficiency increasing up to 56.93%. The work per fuel unit mass increased to 28.8 MJ/kg. In this configuration, solar integration at the economizer allows to use both PDRs and PTCs, with PTC easily matching the low operating temperature ranges for case D.
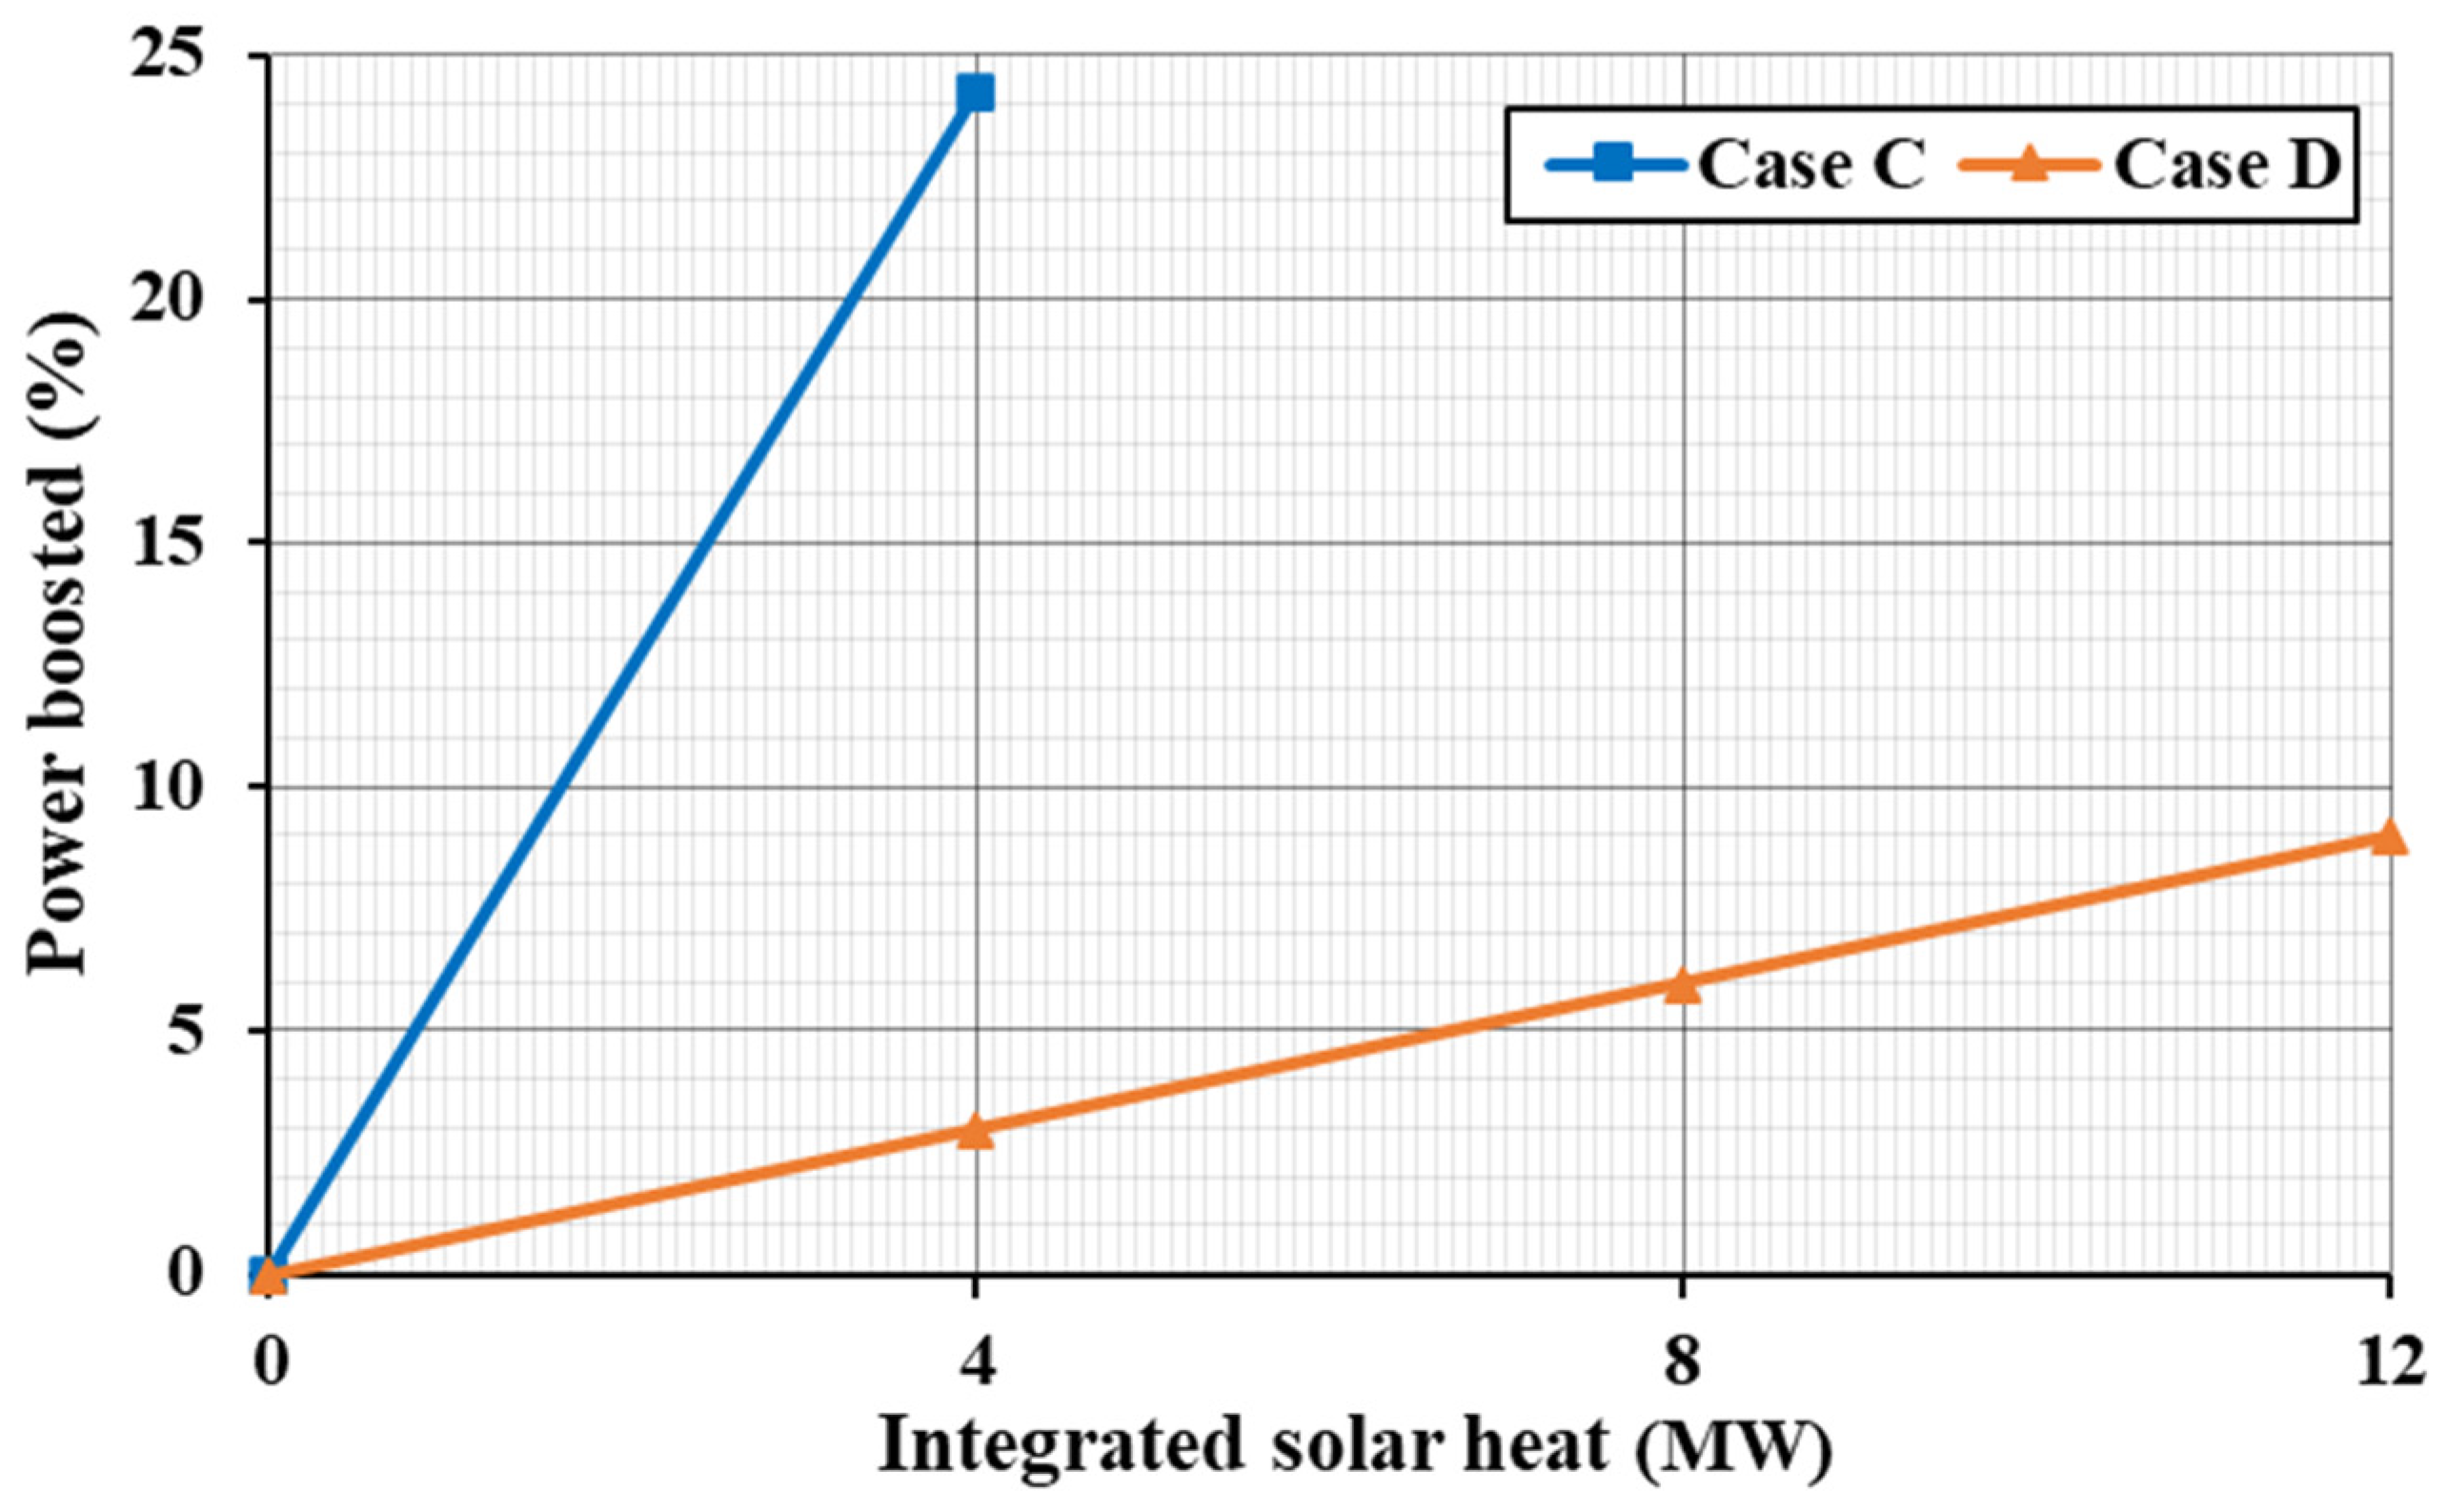
The evolution of the power boosted with respect to solar thermal power is depicted in Figure 15. Despite the limitation in the integrated solar power of 4 MW, the power boosting in case C, i.e., 24.2%, is almost three times the boost in case D for 12 MW of solar power: 8.96%.

4.2.3. Steam Cycle Integration: Parameter Boosting

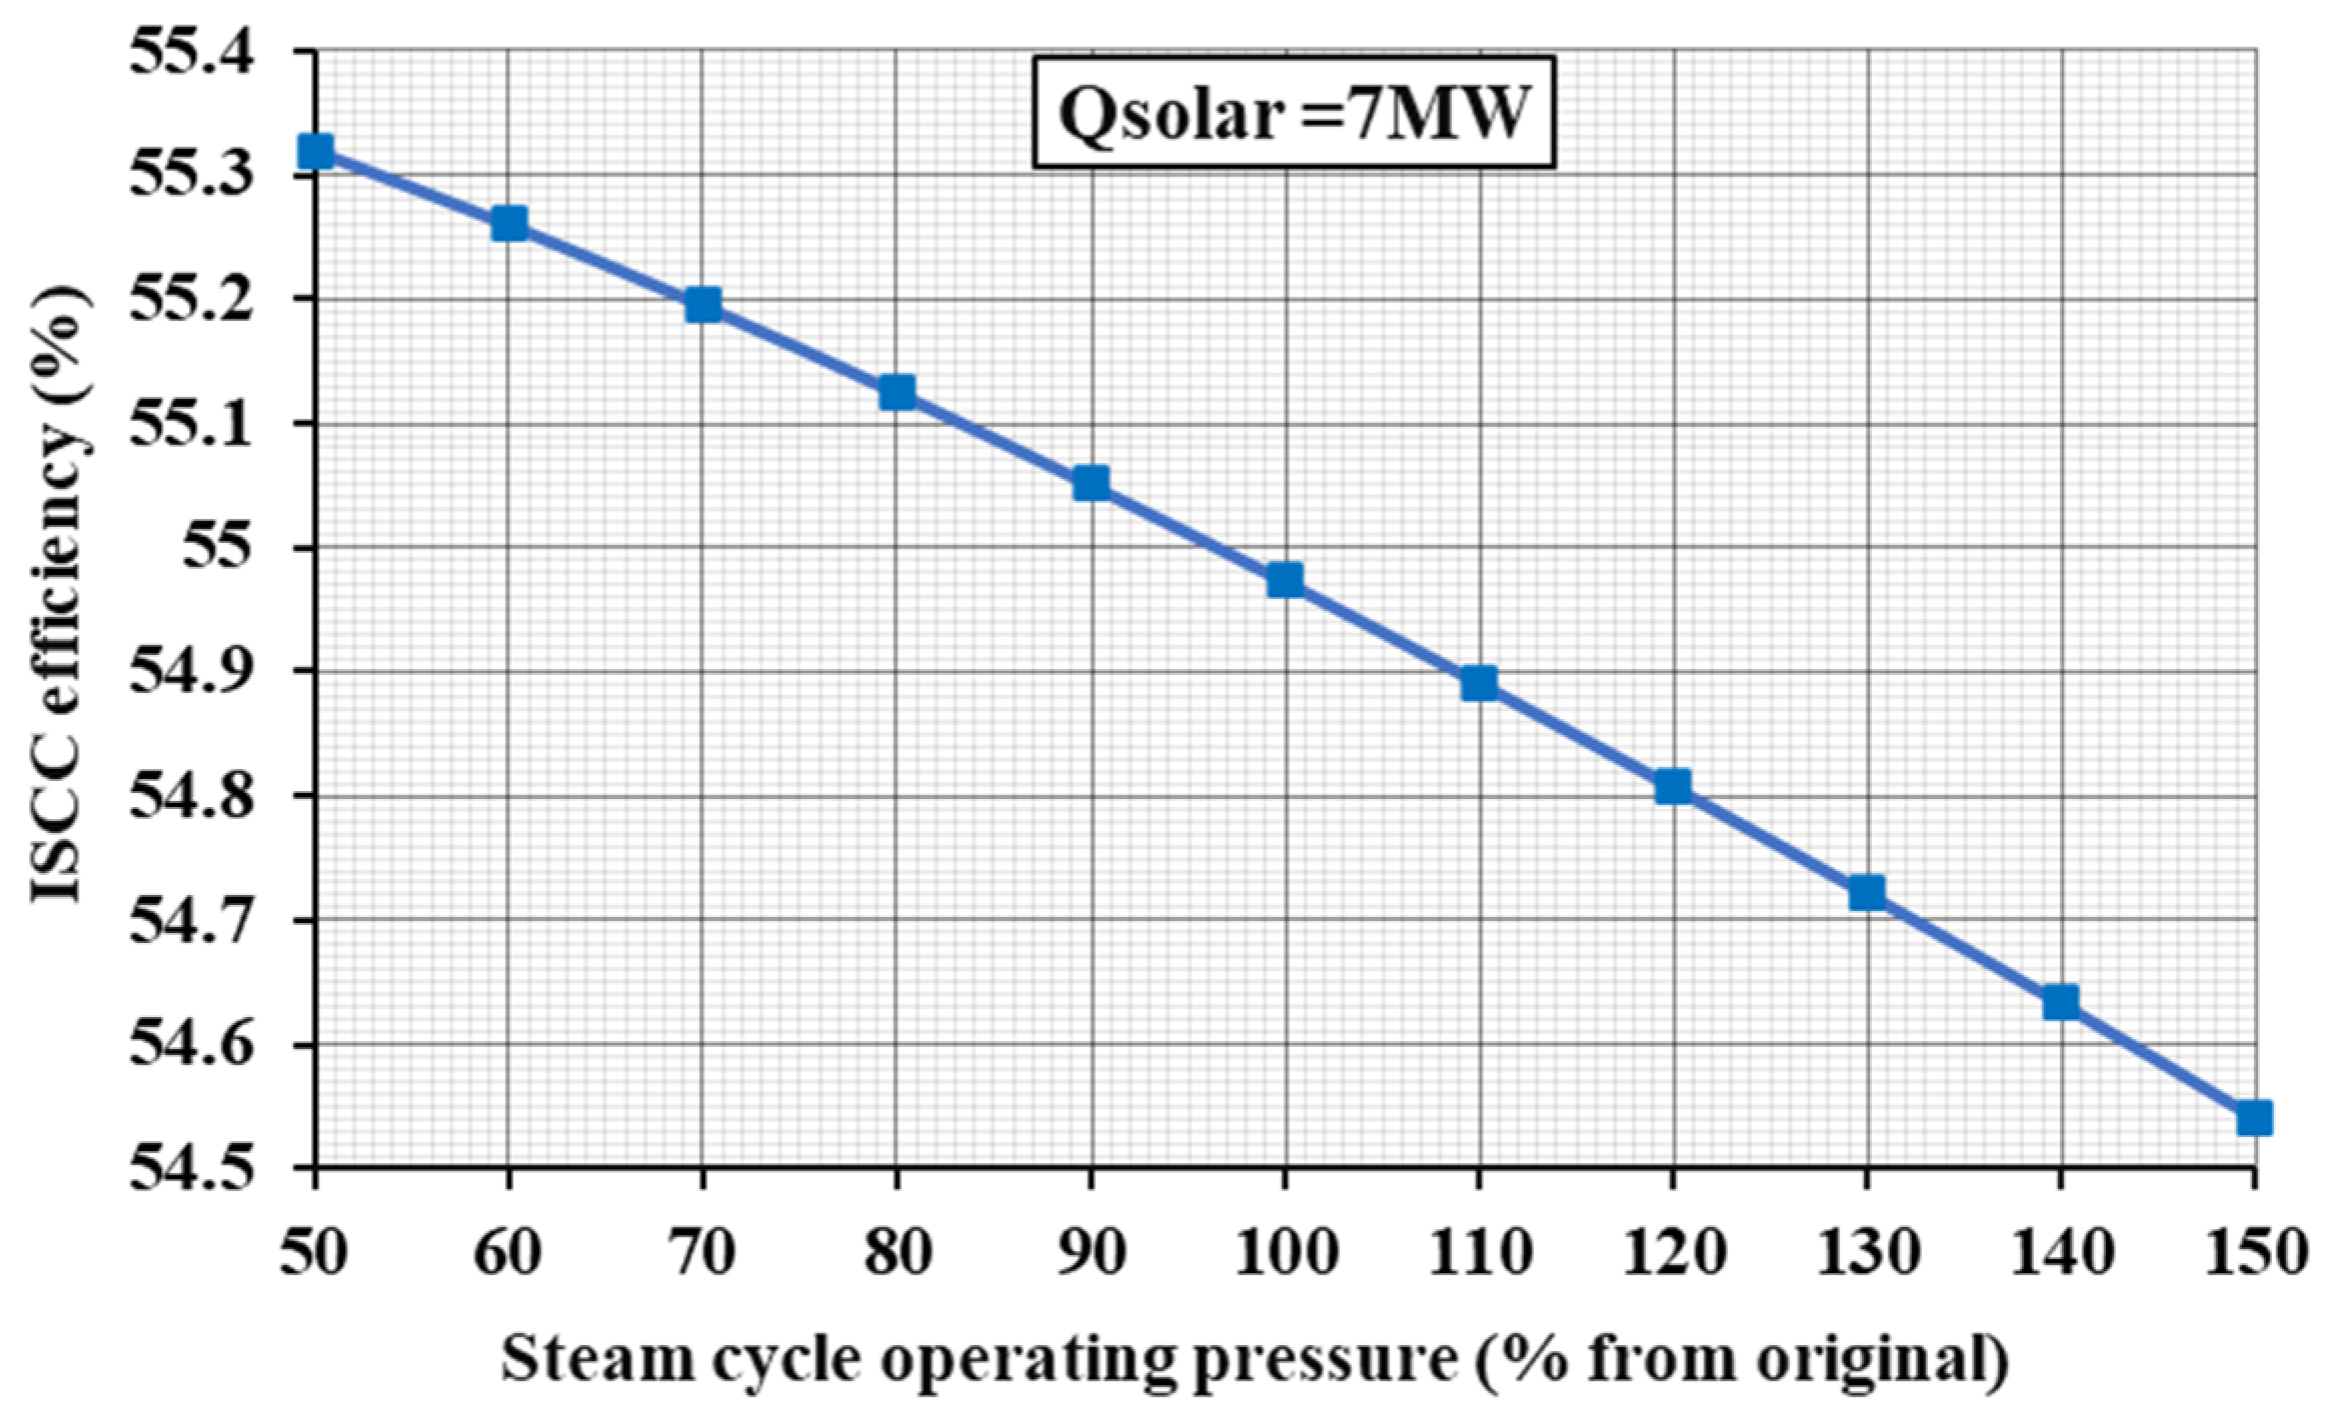
Parameter boosting was the other option studied for power boosting through solar power integration at the bottom steam cycle. For the configuration of case C, several HP evaporator pressure values were studied, from −50% to +50% of the original value in 10% interval steps. (Please refer to Table A5 and Table A6 for detailed results.) Operating pressure affected the maximum solar power that could be integrated into the cycle, increasing from 7 MW at −50% pressure to 9 MW at +50% pressure. Therefore, the comparison was performed at 7 MW to select the optimum operating pressure. It was observed that integrating 7 MW of solar power at the original HP evaporator pressure increased power generation by 2.18%, as shown in Figure 16. This figure shows the evolution of power boosting as a function of working pressure for 7 MW of integrated solar power, where it may be appreciated that reducing the pressure increases the power boosted. The minimum and maximum power-boosting values of 1.37 and 2.82% were obtained for the extremes of the studied pressure range: −50% pressure and + 50% pressure. Overall cycle efficiency also varied between 54.54% for the +50% pressure case and 55.32% for the −50% pressure case, as depicted in Figure 17. For case C, PTC can be used as the solar field technology for all the pressure values studied.
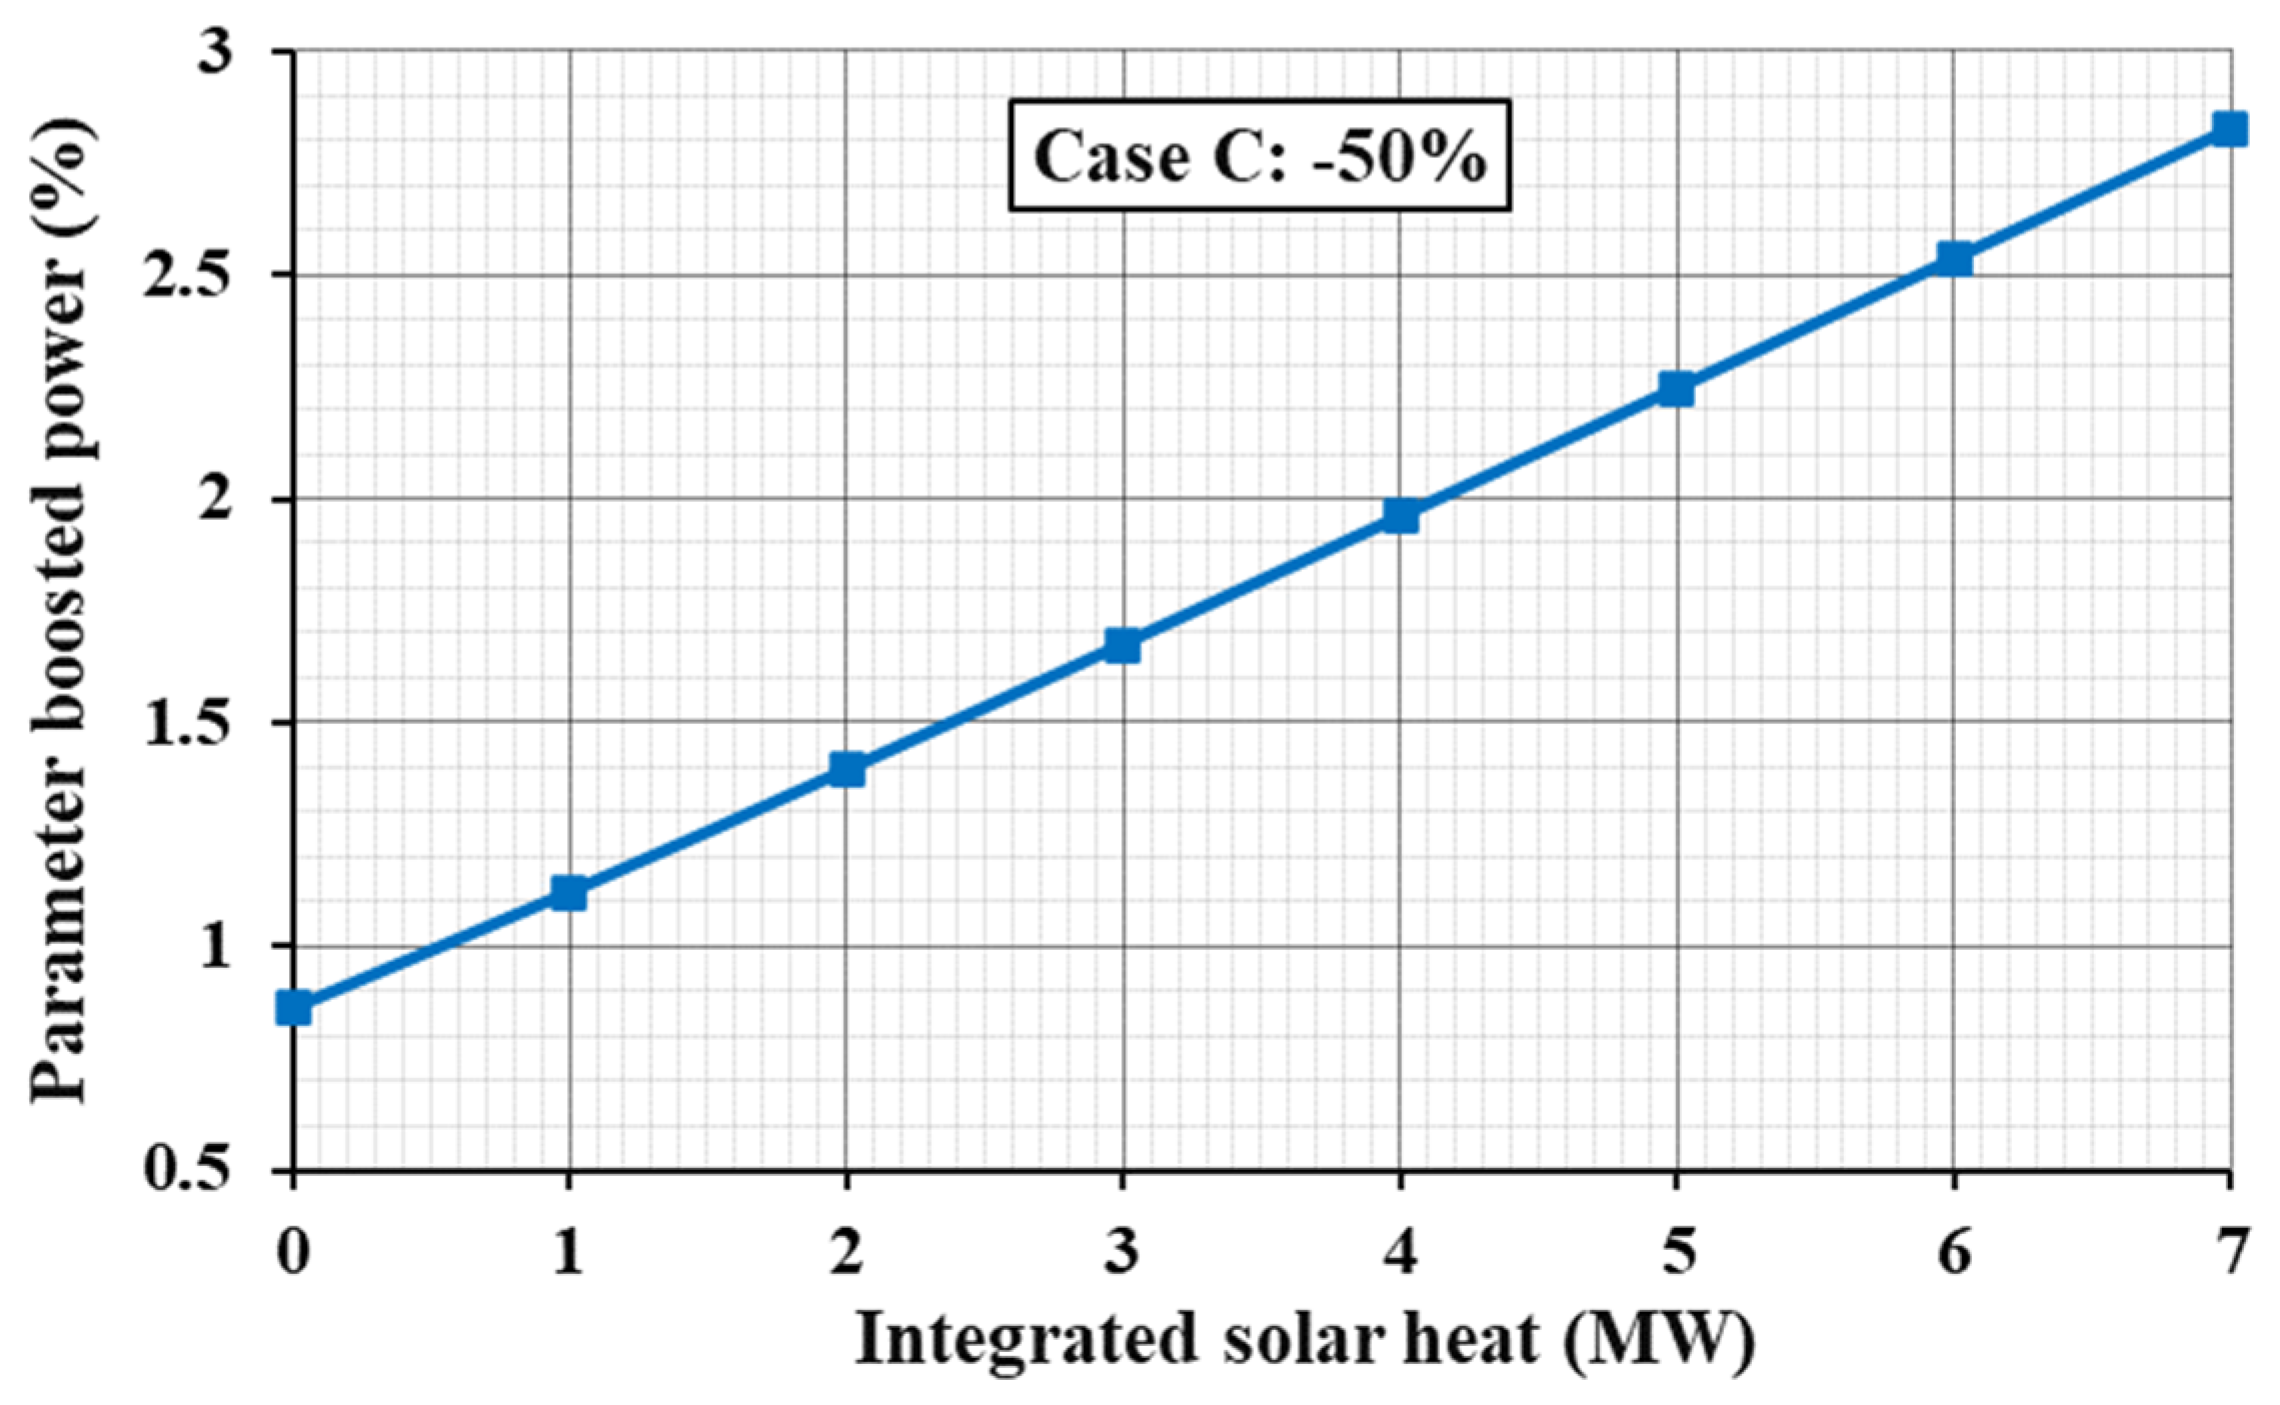
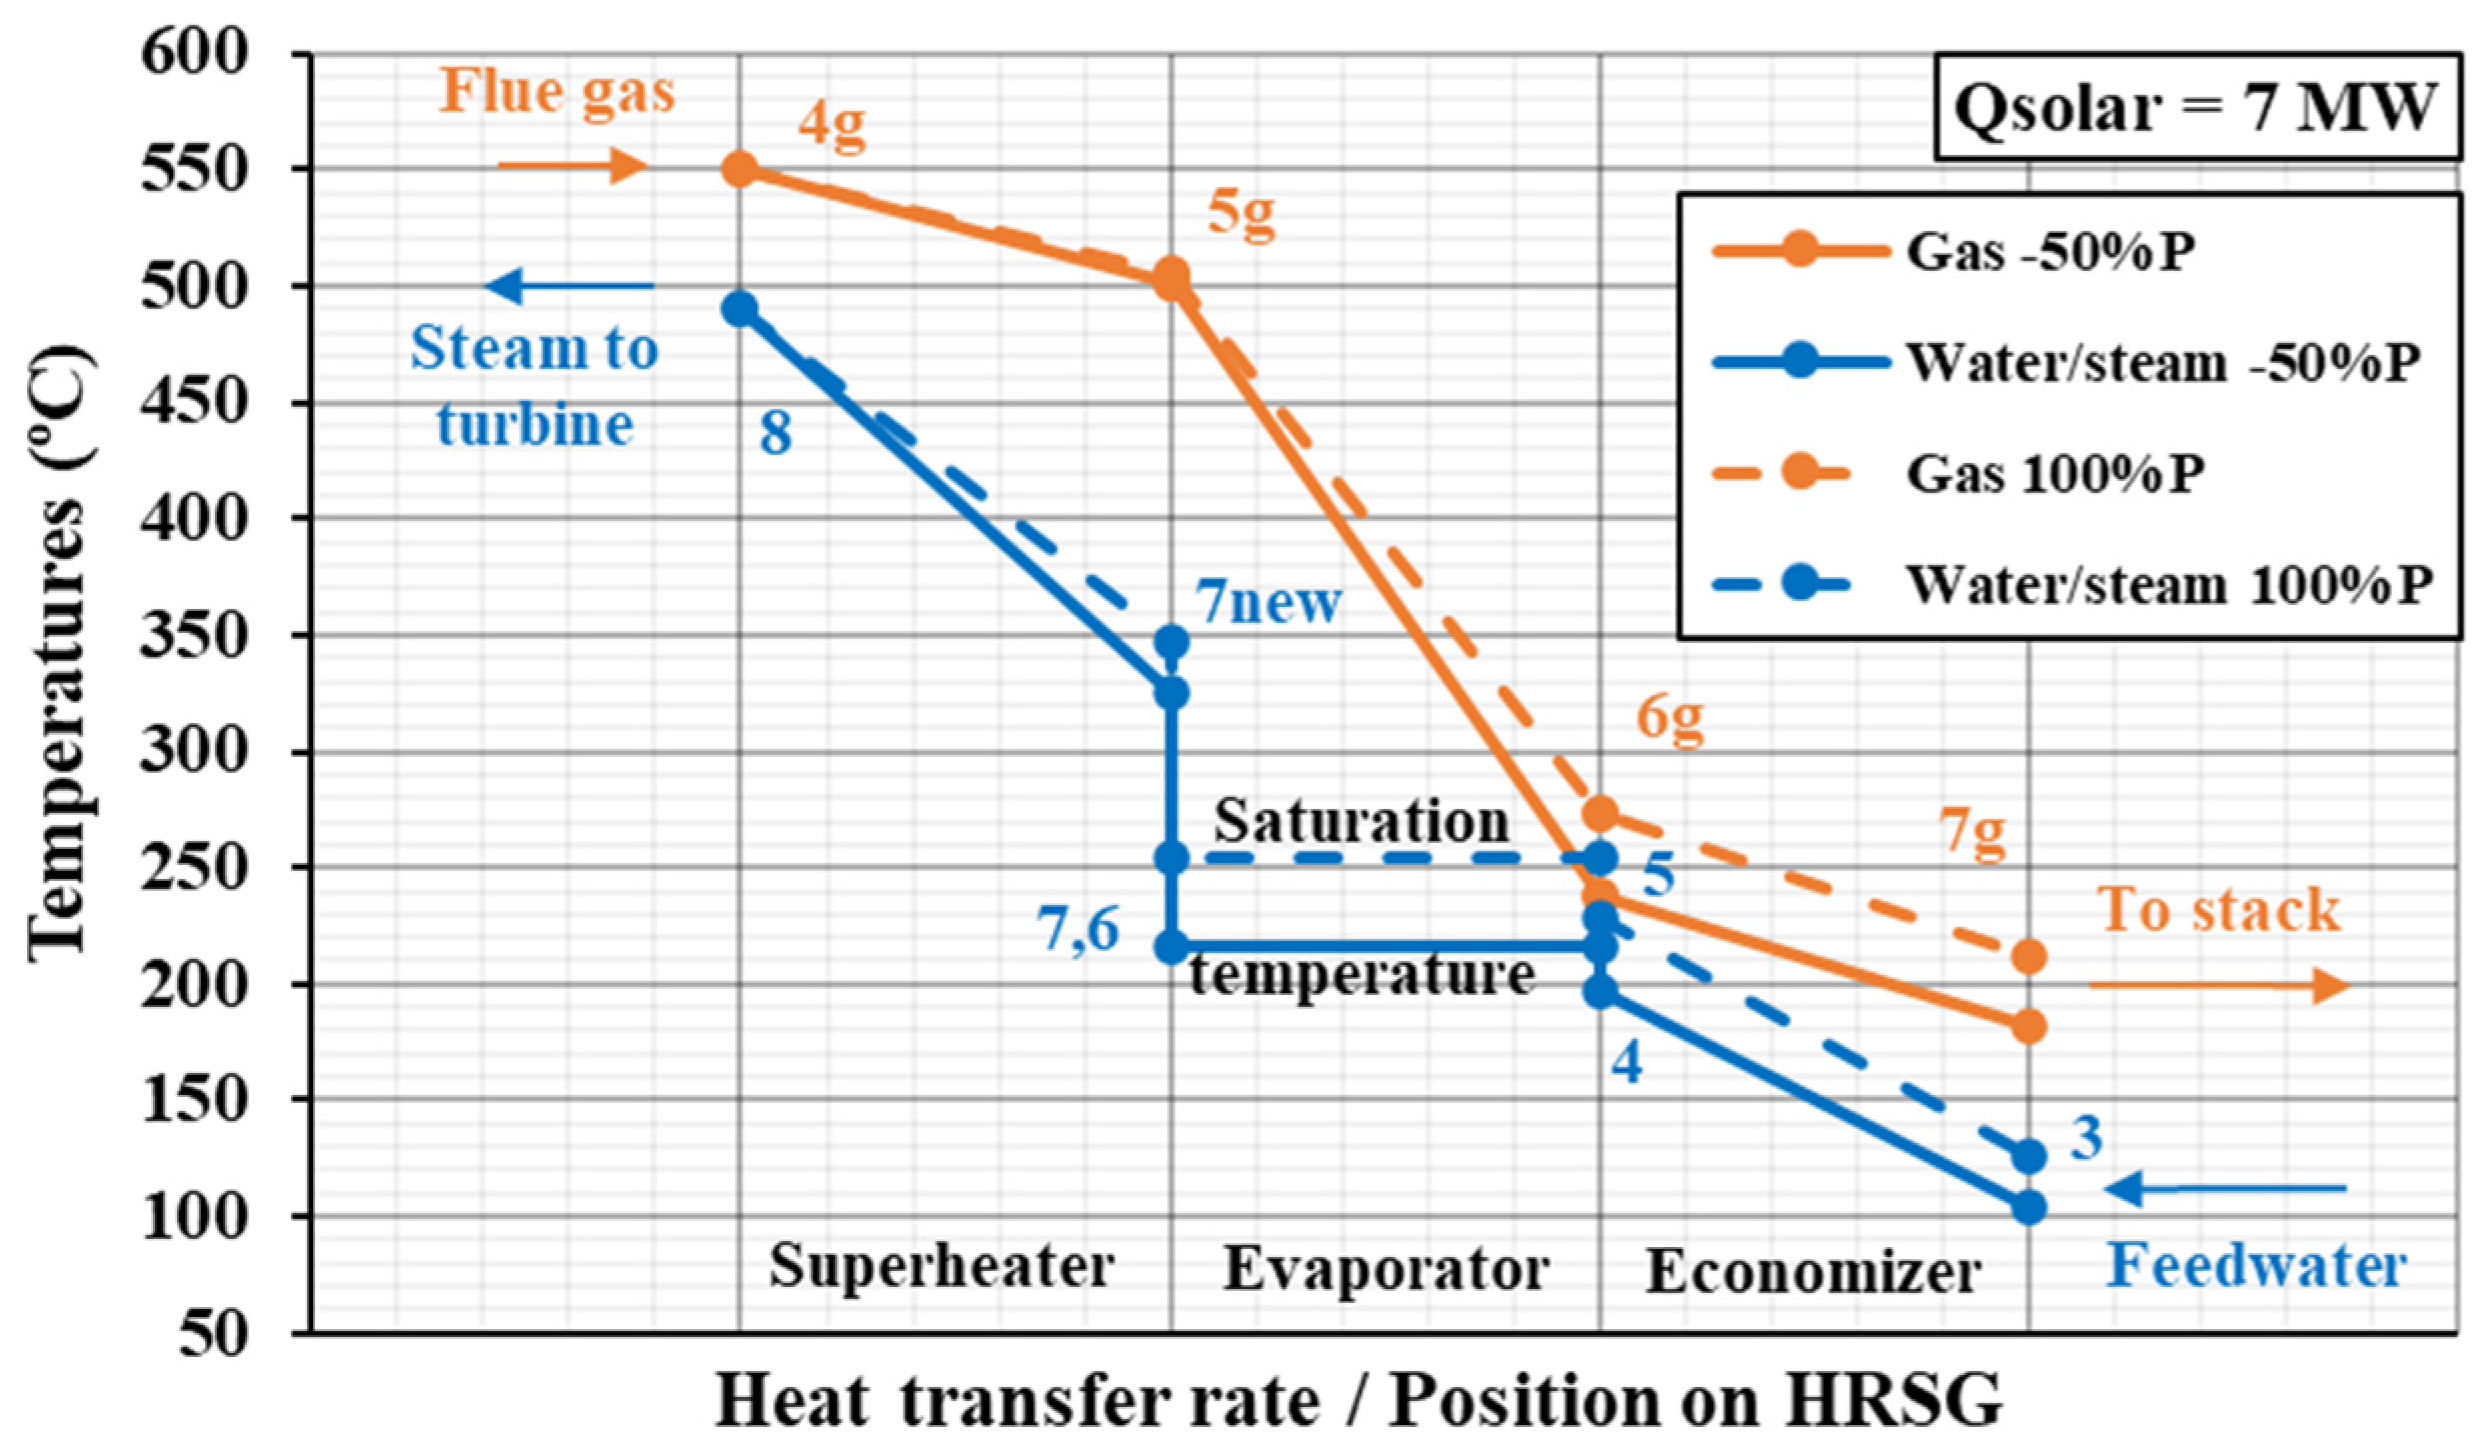
As with −50% HP evaporator pressure the maximum power boost was obtained, the evolution of power boosting with respect to the integrated solar power is shown in Figure 18. It may be observed that just reducing evaporating pressure increases overall output power by 0.86% (0.77 MW) even without solar power; however, for 7 MW, power is boosted by 2.82% (2.5 MW). Figure 19 shows the temperature distribution inside the HRSG for this last case, where it may be appreciated that exhaust gas temperatures come nearer to steam temperatures.
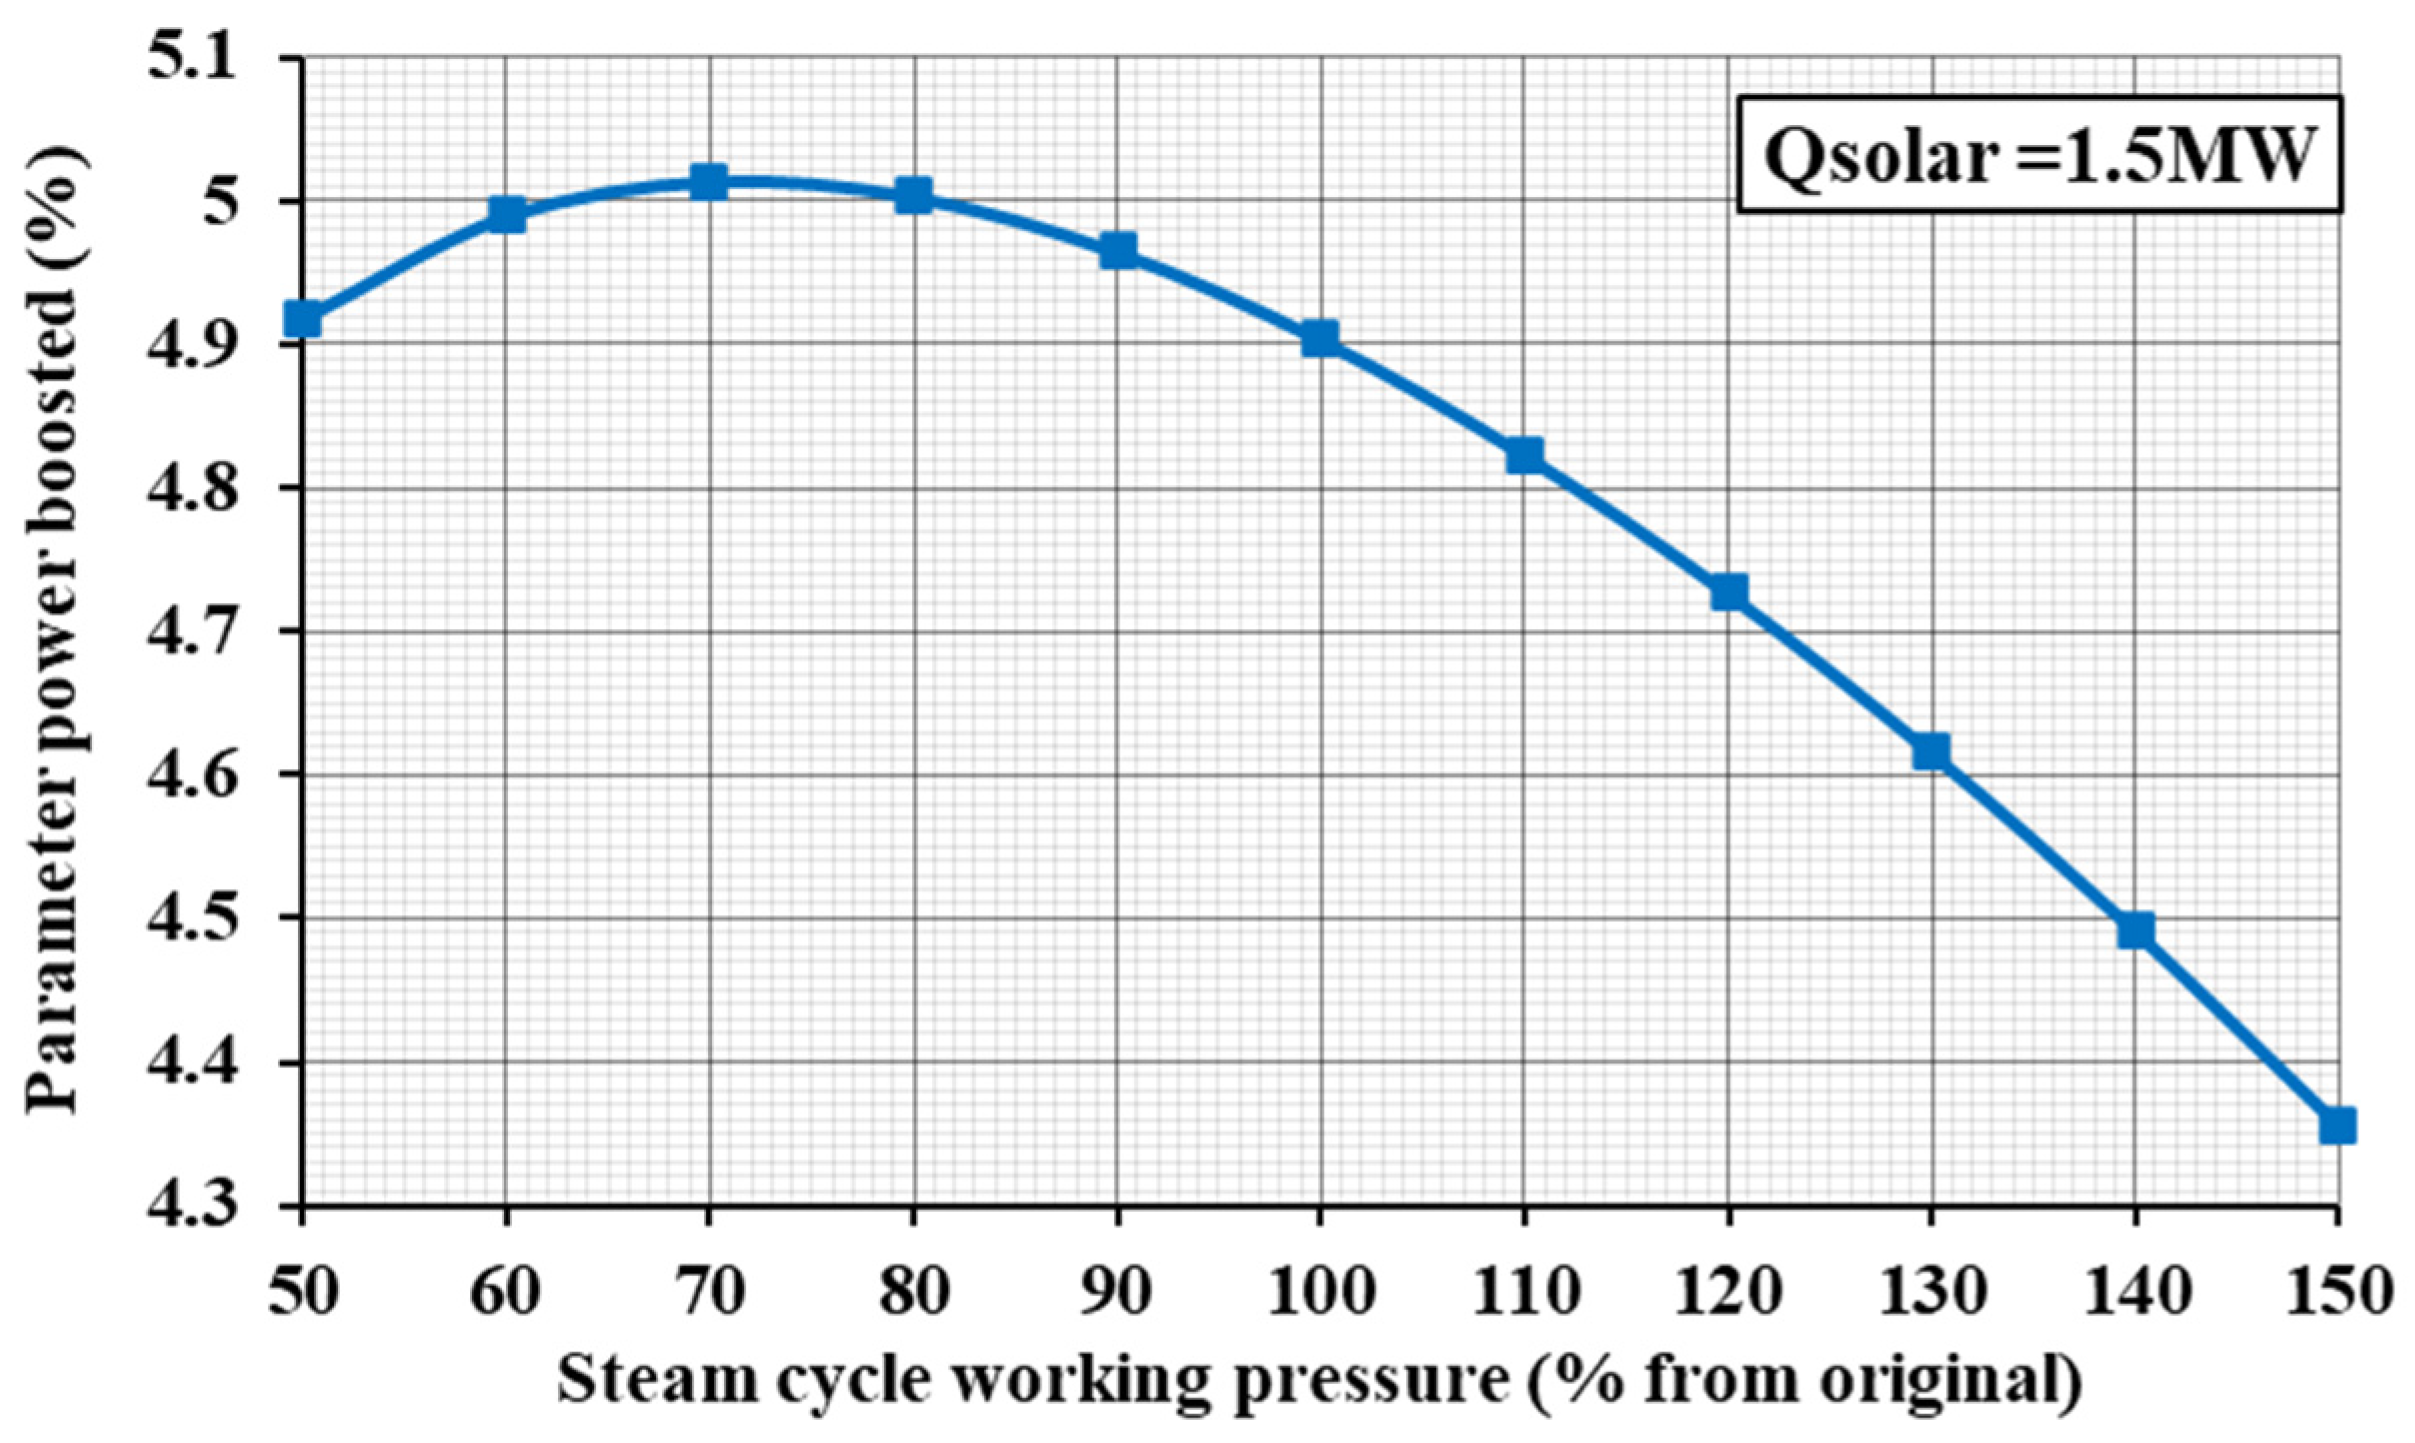
Considering solar power integration before the economizer (case D), the evaporator operating pressure was also changed between −50% and +50% of the original pressure at 10% intervals, with the detailed results collected in Table A7 and Table A8. Again, the maximum solar thermal power that could be integrated was affected by the operating pressure, varying in the range between 1.5 and 2 MW. Hence, to compare results, a value of 1.5 MW was chosen. Figure 20 shows the power boosting as a function of the HP evaporator pressure. When 1.5 MW solar power was integrated at original operating conditions, the delivered power increased by 4.9%. As in case C, the increase in operating pressure decreased output power, reaching the lowest increase of 4.35% at the +50% pressure case (58.04% cycle efficiency). Nevertheless, for case D, it was possible to find a maximum in power boosting for the −30% pressure case, reaching 5.01% power boosting with respect to the original CC. As with flowrate boosting in case D, integrating the solar field before the economizer makes PTC technology with synthetic oils a suitable option.
Focusing on the −30% HP evaporator pressure, Figure 21 shows power boosting as a function of the integrated solar power, up to the maximum limit of 1.5 MW. It may be observed that the decrease in the evaporator pressure only increases overall output power by 41 kW (0.04%), so the effect of solar power integration becomes more determinant. Even with just 1.5 MW of solar power, power boosting is 5.01% (4.54 MW), with an overall cycle efficiency of 58.4%. Looking at the T-Q diagram of the HRSG under these conditions, shown in Figure 22, it may be appreciated that gas temperatures come much closer to water temperatures in both the economizer and superheater.

5. Discussion

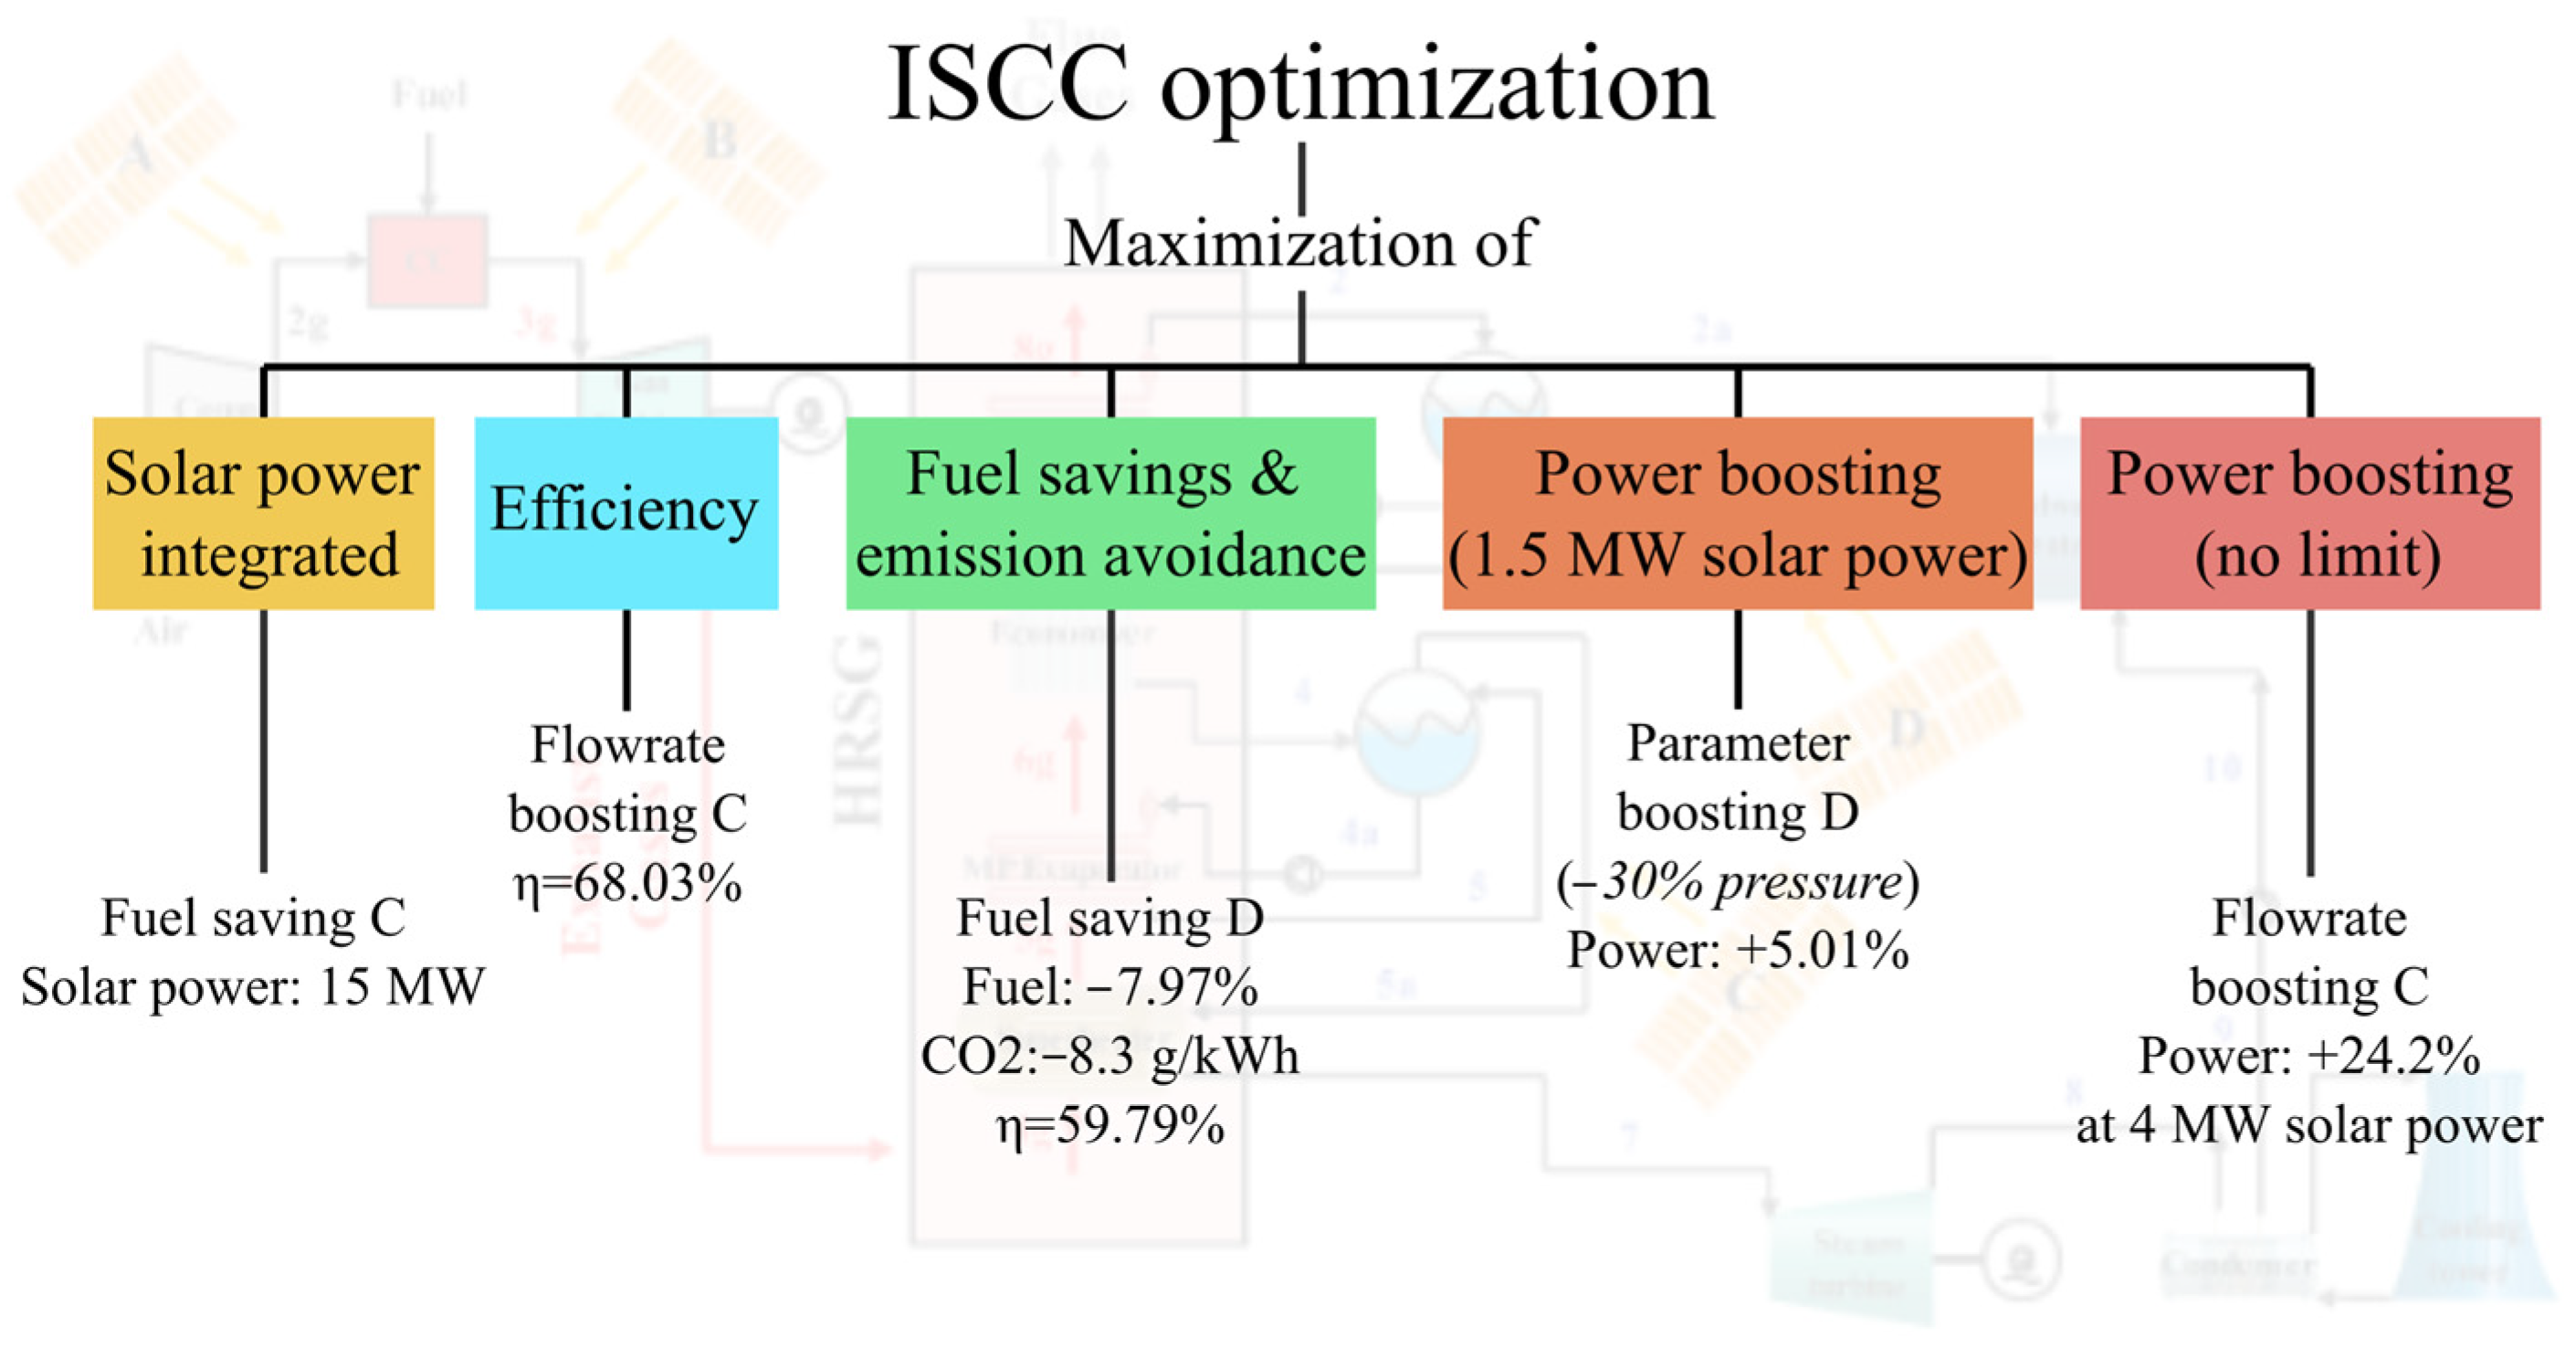
From the analysis of the results, some considerations for solar thermal power integration in existing combined cycles were derived. Table 8 collects the main considerations obtained, while Figure 23 shows graphically the main guidelines to be followed for solar power integration, with the aim of providing the best course of action depending on the desired outcome.
Regarding fuel-saving operation, cases A and B must adapt to the same gas turbine inlet conditions, so both were able to save the same amount of fuel when 10 MW solar thermal power was integrated: 6.23%. However, case A exhibited better flexibility in terms of the solar field technology to be used (parabolic dish reflectors or heliostat field collectors), as it benefits from lower operating temperatures. For the steam cycle integration options, case C was only able to save 3.49% by requiring 15 MW of integrated solar thermal power, resulting in the lowest fuel savings per MW of solar power. However, it was the configuration that could integrate the highest solar power: 15 MW. The configuration presented in case D, on the contrary, allowed to reduce fuel consumption by 7.97% with just 3 MW of solar power. Due to its lower operating temperatures, parabolic trough collectors are a suitable option for solar power integration in the steam cycle. In addition, for the same integrated solar power of 3 MW, cases A and B were only able to save 1.87% of fuel, whereas case C had the lowest savings of all configurations: 0.65%.
Considering power-boosting operation, cases A and B can boost power by 4.41% with 10 MW of integrated solar power. However, the flowrate-boosting strategy with integration of solar power before the steam cycle superheater was found to have the best impact on the cycle. In this sense, an increase in cycle output power of 24.2% was found for case C when 4 MW of solar power was integrated. With the same solar power, case D was only able to increase cycle output power by 2.98%. Nevertheless, for the parameter-boosting strategy, the opposite behavior was observed. With 7 MW of integrated solar power, case C showed the lowest boosting performance, with only 2.82% when the HP evaporator pressure was reduced to half of that of the original cycle. On the other hand, with only 1.5 MW of integrated solar power, case D was able to boost power by 5.01% when the HP evaporator pressure was reduced to 70% of the original value.
Finally, the results of this work may be compared with relevant findings from the recent literature. Abdel Dayem et al. [28] found that the increase in DNI, due to changes in climate conditions, could increase steam turbine power by 10%. In the present work, it was found that with only 4 MW of solar power, the steam turbine power could be increased by 24.2% with a flowrate-boosting strategy. The results from Aghdam et al. [32] revealed an increase of 2% in the plant efficiency and from 714 to 728 MW in the plant capacity when the solar field was integrated before the superheater of the bottom steam cycle. In the present work, for the same integration point and with a flowrate-boosting strategy, power was boosted by 24.2%, and the cycle efficiency increased by 11.9%. Comparing the results of the present work with the work of Barigozzi et al. [22], it was also found that power-boosting strategies with solar integration at the bottom steam cycle performed better than those with integration at the top gas cycle. Behar [23] proposed PTCs with synthetic oil as HTF as the most efficient method for solar power integration at the bottom steam cycle. However, it was found that this technology is not suited for all types of solar integration at the bottom steam cycle (see case C for fuel saving). Nevertheless, PTC is the most suitable technology for most of the bottom steam cycle-integration cases. Elmohalawy [25] found an increase in thermal efficiency of 1.2% when steam was injected at the high pressure level. In the present work, the highest efficiency increase, 11%, was found when integrating solar power before the high-pressure superheater to heat saturated steam. Finally, Ameri and Mohammadzadeh [34] found an increase of 6 MW in power generation and a reduction of 10 g/kWh in carbon emissions when the solar field was integrated before the superheater of the bottom steam cycle for a total power output of 300 MW. In the present work, output power was boosted by 22 MW (24.2%) and 2.6 MW (2.82%) for flowrate and parameter boosting, respectively, and carbon emissions could be reduced by 3.5 g/kWh for total power outputs of 112.5 and 93.1 MW.

6. Conclusions

With the focus set on the optimization of the efficiency of combined cycles and a reduction in fuel consumption and carbon emissions, the integration of solar power in a real and existing combined cycle power plant was analyzed in this work. Using a thermodynamic model, it is possible to provide recommendations for solar power integration in combined cycles depending on the desired outcome. In this sense, the results from this work could be valuable for the specific retrofitting of existing combined cycle power plants with different technical or environmental constraints.
The integration of solar power increases the energy content of the cycle streams. Integration at the top gas cycle level may be constrained due to the higher temperatures and technical requirements of the solar field and heat transfer fluid. In this sense, integration should be performed after the compressor and before the combustion chamber to allow for the use of either parabolic dish reflectors or heliostat field collectors. However, high-temperature heat transfer fluids such as molten salts should be used. It is thus advisable to integrate solar power at the bottom steam cycle to also allow for the use of parabolic trough collectors and other heat transfer fluids.
Considering the effects of power integration on the cycle, if the objective is to integrate as much solar power as possible, then the best option is to perform the integration before the superheater of the steam cycle for fuel saving. If the aim is to increase overall cycle efficiency, the best option is integrating solar power before the steam cycle superheater with a flowrate-boosting strategy. If focus is set on reducing fuel consumption and avoiding carbon emissions, then a fuel-saving strategy by solar power integration before the economizer is the best option. Finally, if the objective is to boost power as much as possible, depending on the available solar resource, two different strategies are recommended. For small solar field sizes, a parameter-boosting strategy with solar integration before the economizer is the best choice. If there is no limit on the solar field size, flowrate boosting by integrating solar power before the superheater is the best option.
Future works could focus on the dynamic study of the ISCC configurations proposed in this work, coupling the model to a comprehensive solar database for different locations. Another research interest could be coupling the ISCC with a heat storage system to continue using renewable energy during the night. In addition, combinations of the proposed integrating positions could be studied at the same time and compared with the single-integration cases. Finally, a solar field design based on the maximum solar power to be integrated and an economic study could help to decide the best option for solar power integration for each particular situation.

Author Contributions

Conceptualization, I.S.-R. and A.M.-F.; methodology, A.M.A., A.M.-F. and I.S.-R.; software, A.M.A., A.M.-F. and I.S.-R.; validation, I.S.-R. and A.M.-F.; formal analysis, A.M.A., A.M.-F. and I.S.-R.; investigation, A.M.A., A.M.-F. and I.S.-R.; resources, A.M.-F. and I.S.-R.; data curation, A.M.A., A.M.-F. and I.S.-R.; writing—original draft preparation, A.M.A. and A.M.-F.; writing—review and editing, A.M.-F. and I.S.-R.; visualization, A.M.A., A.M.-F. and I.S.-R.; supervision, A.M.-F. and I.S.-R.; project administration, I.S.-R. All authors have read and agreed to the published version of the manuscript.

Funding

This research received no external funding.

Data Availability Statement

The original contributions presented in the study are included in the article material; further inquiries can be directed to the corresponding author.

Conflicts of Interest

The authors declare no conflicts of interest.

Appendix A. Detailed Results of Each Studied Configuration

Table A1. Original CC vs. ISCC (Case A and Case B) “Fuel saving”.
Mass FlowratesOriginal CCISCC Case AISCC Case B
Air to fuel ratio5053.3953.39
Turbine gas flowrate (kg/s)174.7174.7174.7
Air flowrate (kg/s)171.28171.49171.49
Fuel flowrate (kg/s)3.423.213.21
Fuel saving (%)--6.236.23
LP evaporator mass flowrate (kg/s)555
HP evaporator mass flowrate (kg/s)252525
Operating temperaturesOriginal CCISCC Case AISCC Case B
Compressor inlet (°C)242424
Combustion chamber inlet (°C)378431378
Gas turbine inlet (°C)117411741174
Gas turbine outlet (°C)549549549
Solar heat integrationOriginal CCISCC Case AISCC Case B
Integrated solar heat (MW)--10
Cycle efficiencyOriginal CCISCC Case AISCC Case B
Gas turbine cycle (%)39.8439.85
Combined cycle (%)56.1356.15
Cycle power breakdownOriginal CCISCC Case AISCC Case B
Compressor (kW)62,45062,45062,450
Gas turbine (kW)126,727126,727126,727
Gas cycle (kW)64,27764,27764,277
Steam cycle (kW)26,29226,29226,292
Total net power (kW)90,56990,56990,569
Back work ratio (%)49.27949.27949.279
Specific work per unit fuel mass flow (kJ/kg)26,43928,19828,198
CO2 emissions (Mt/year)0.29710.27850.2785
CO2 emissions saved (kg CO2/kWh)--0.00640.0064
Table A2. Original CC vs. ISCC (Case C and Case D) “Fuel saving”.
Mass FlowratesOriginal CCISCC Case CISCC Case D
Air to fuel ratio505050
Turbine gas flowrate (kg/s)174.7168.59160.7
Air flowrate (kg/s)171.28165.28157.61
Fuel flowrate (kg/s)3.423.33.15
Fuel saving (%)--3.497.97
LP evaporator mass flowrate (kg/s)555
HP evaporator mass flowrate (kg/s)252525
Operating temperaturesOriginal CCISCC Case CISCC Case D
Compressor inlet (°C)242424
Combustion chamber inlet (°C)378378378
Gas turbine inlet (°C)117411741174
Gas turbine outlet (°C)549549549
Solar heat integrationOriginal CCISCC Case CISCC Case D
Integrated solar heat (MW)--153
Cycle efficiencyOriginal CCISCC Case CISCC Case D
Gas turbine cycle (%)39.8439.8439.84
Combined cycle (%)56.1353.0659.79
Cycle power breakdownOriginal CCISCC Case CISCC Case D
Compressor (kW)62,45060,26657,471
Gas turbine (kW)126,727122,294116,622
Gas cycle (kW)64,27762,02859,152
Steam cycle (kW)26,29228,54231,417
Total net power (kW)90,56990,56990,569
Back work ratio (%)49.27949.27949.279
Specific work per unit fuel mass flow (kJ/kg)26,43927,39928,730
CO2 emissions (Mt/year)0.29710.28670.2734
CO2 emissions saved (kg CO2/kWh)--0.00350.0083
Table A3. Original CC vs. ISCC (Case A and Case B) “Power boosting”.
Mass FlowratesOriginal CCISCC Case AISCC Case B
Air to fuel ratio5053.2
Turbine gas flowrate (kg/s)174.7185.68
Air flowrate (kg/s)171.28182.25
Fuel flowrate (kg/s)3.423.423.42
LP evaporator mass flowrate (kg/s)555
HP evaporator mass flowrate (kg/s)252525
Operating temperaturesOriginal CCISCC Case AISCC Case B
Compressor inlet (°C)242424
Combustion chamber inlet (°C)378430378
Gas turbine inlet (°C)117411741174
Gas turbine outlet (°C)549549549
Solar heat integrationOriginal CCISCC Case AISCC Case B
Integrated solar heat (MW)--10
Cycle efficiencyOriginal CCISCC Case AISCC Case B
Gas turbine cycle (%)39.8439.83
Combined cycle (%)56.1355.19
Cycle power breakdownOriginal CCISCC Case AISCC Case B
Compressor (kW)62,45066,455
Gas turbine (kW)126,727134,693
Gas cycle (kW)64,27768,239
Steam cycle (kW)26,29226,323
Total net power (kW)90,56994,562
Power boosted (%)--4.41
Back work ratio (%)49.27949.33
Specific work per unit fuel mass flow (kJ/kg)26,43927,605
Table A4. Original CC vs. ISCC (Case C and Case D) “Flowrate boosting”.
Mass FlowratesOriginal CCISCC Case CISCC Case D
Air to fuel ratio505050
Turbine gas flowrate (kg/s)174.7174.7174.7
Air flowrate (kg/s)171.28171.28171.28
Fuel flowrate (kg/s)3.423.423.42
LP evaporator mass flowrate (kg/s)59.176.54
HP evaporator mass flowrate (kg/s)2545.8432.72
Operating temperaturesOriginal CCISCC Case CISCC Case D
Compressor inlet (°C)242424
Combustion chamber inlet (°C)378378378
Gas turbine inlet (°C)117411741174
Gas turbine outlet (°C)549549549
Inlet steam temperature (°C)457416.5423
Pinch temperature (°C)17.517.317
Economizer outlet temperature (°C)228192.5254.5
Approach temperature (°C)28620.5
Operating pressuresOriginal CCISCC Case CISCC Case D
Inlet steam pressure (bar)434343
LP evaporator pressure (bar)2.42.42.4
Condenser pressure (bar)0.080.080.08
Solar heat integrationOriginal CCISCC Case CISCC Case D
Integrated solar heat (MW)--412
Cycle efficiencyOriginal CCISCC Case CISCC Case D
Gas turbine cycle (%)39.8439.8439.84
Combined cycle (%)56.1368.0356.93
Cycle power breakdownOriginal CCISCC Case CISCC Case D
Compressor (kW)62,45062,45062,450
Gas turbine (kW)126,727126,727126,727
Gas cycle (kW)64,27764,27764,277
Steam cycle (kW)26,29248,21434,412
Total net power (kW)90,569112,49198,689
Power boosted (%)--24.28.96
Back work ratio (%)49.27949.27949.279
Specific work per unit fuel mass flow (kJ/kg)26,43932,84028,810
Table A5. Original CC vs. Parameter boosting “Case C” (+10%, +20%, +30%, +40%, and +50%).
Mass FlowratesOriginal
ISCC
ISCC “Case C” (Superheater)
+10%+20%+30%+40%+50%
Turbine gas flowrate (kg/s)174.7
Air flowrate (kg/s)171.27
Fuel flowrate (kg/s)3.42
LP evaporator mass flowrate (kg/s)5
HP evaporator mass flowrate (kg/s)25
Operating temperaturesOriginal
ISCC
+10%+20%+30%+40%+50%
Compressor inlet (°C)24
Combustion chamber inlet (°C)379
Gas turbine inlet (°C)1174
Gas turbine outlet (°C)549
Inlet steam temperature (°C)491491490.5490.5490489.5
Pinch temperature (°C)19.31918.518.217.917.5
Economizer outlet temperature (°C)228232.5237241244.548
Approach temperature (°C)26.527.529303132
Operating pressuresOriginal
ISCC
+10%+20%+30%+40%+50%
Inlet steam pressure (bar)2.42.642.883.123.363.6
LP evaporator pressure (bar)4347.351.655.960.264.5
Condenser pressure (bar)0.08
Solar heat integrationOriginal
ISCC
+10%+20%+30%+40%+50%
Integrated solar heat (MW)7
Cycle efficiencyOriginal
ISCC
+10%+20%+30%+40%+50%
Gas turbine cycle (%)39.84
Combined cycle (%)54.9754.8954.8154.7254.6354.54
Cycle power breakdownOriginal
ISCC
+10%+20%+30%+40%+50%
Compressor (kW)62,450
Gas turbine (kW)126,727
Gas cycle (kW)64,277
Steam cycle (kW)28,26528,12827,98727,84327,69427,539
Total net power (kW)92,54292,40592,26492,12091,97191,816
Power boosted (%)2.182.021.871.711.551.37
Back work ratio (%)49.279
Specific work per unit fuel mass flow (kJ/kg)27,01626,97626,93526,89226,84926,804
Table A6. Original CC vs. Parameter boosting “Case C” (−10%, −20%, −30%, −40%, and −50%).
Mass FlowratesOriginal
ISCC
ISCC “Case C” (Superheater)
−10%−20%−30%−40%−50%
Turbine gas flowrate (kg/s)174.7
Air flowrate (kg/s)171.27
Fuel flowrate (kg/s)3.42
LP evaporator mass flowrate (kg/s)5
HP evaporator mass flowrate (kg/s)25
Operating temperaturesOriginal
ISCC
−10%−20%−30%−40%−50%
Compressor inlet (°C)24
Combustion chamber inlet (°C)379
Gas turbine inlet (°C)1174
Gas turbine outlet (°C)549
Inlet steam temperature (°C)491491491491491490.5
Pinch temperature (°C)19.319.72020.521.21.5
Economizer outlet temperature (°C)228223218212205197.5
Approach temperature (°C)26.52523.52220.518.5
Operating pressuresOriginal
ISCC
−10%−20%−30%−40%−50%
Inlet steam pressure (bar)4338.734.430.125.821.5
LP evaporator pressure (bar)2.42.161.921.681.441.2
Condenser pressure (bar)0.08
Solar heat integrationOriginal
ISCC
−10%−20%−30%−40%−50%
Integrated solar heat (MW)7
Cycle efficiencyOriginal
ISCC
−10%−20%−30%−40%−50%
Gas turbine cycle (%)39.84
Combined cycle (%)54.9755.0555.1255.1955.2655.32
Cycle power breakdownOriginal
ISCC
−10%−20%−30%−40%−50%
Compressor (kW)62,450
Gas turbine (kW)126,727
Gas cycle (kW)64,277
Steam cycle (kW)28,26528,39628,52128,64028,75028,849
Total net power (kW)92,54292,67392,79892,91793,02793,126
Power boosted (%)2.182.322.462.592.712.82
Back work ratio (%)49.279
Specific work per unit fuel mass flow (kJ/kg)27,01627,05427,09127,12527,15727,186
Table A7. Original CC vs. Parameter boosting “Case D” (+10%, +20%, +30%, +40%, and +50%).
Mass FlowratesOriginal ISCCISCC “Case D” (Economizer)
+10%+20%+30%+40%+50%
Turbine gas flowrate (kg/s)174.7
Air flowrate (kg/s)171.27
Fuel flowrate (kg/s)3.42
LP evaporator (kg/s)5
HP evaporator kg/s)25
Operating temperaturesOriginal ISCC+10%+20%+30%+40%+50%
Compressor inlet (°C)24
Combustion chamber inlet (°C)379
Gas turbine inlet (°C)1174
Gas turbine outlet (°C)549
Inlet steam temperature (°C)534534.5535535535534.5
Pinch temperature (°C)151514.51413.513.5
Economizer outlet temperature (°C)229233236239.5242245
Approach temperature (°C)25.527.529.531.533.535
Operating pressuresOriginal ISCC+10%+20%+30%+40%+50%
Inlet steam (bar)4347.351.655.960.264.5
LP evaporator (bar)2.42.642.883.123.363.6
Condenser (bar)0.08
Solar heat integrationOriginal ISCC+10%+20%+30%+40%+50%
Integrated solar heat (MW)1.5
Cycle efficiencyOriginal ISCC+10%+20%+30%+40%+50%
Gas turbine cycle (%)39.84
Combined cycle (%)58.3458.358.2458.1858.6558.04
Cycle power breakdownOriginal ISCC+10%+20%+30%+40%+50%
Compressor (kW)62,450
Gas turbine (kW)126,727
Gas cycle (kW)64,277
Steam cycle (kW)30,73330,66030,57330,47230,36030,237
Total net power (kW)95,01094,93794,85094,74994,63794,514
Power boosted (%)4.94.824.724.614.494.35
Back work ratio (%)49.279
Specific work per unit fuel mass flow (kJ/kg)27,73627,71527,68927,66027,62727,591
Table A8. Original CC vs. Parameter boosting “Case D” (−10%, −20%, −30%, −40%, −50%).
Mass FlowratesOriginal ISCCISCC “Case D” (Economizer)
−10%−20%−30%−40%−50%
Turbine gas flowrate (kg/s)174.7
Air flowrate (kg/s)171.27
Fuel flowrate (kg/s)3.42
LP evaporator (kg/s)5
HP evaporator kg/s)25
Operating temperaturesOriginal ISCC−10%−20%−30%−40%−50%
Compressor inlet (°C)24
Combustion chamber inlet (°C)379
Gas turbine inlet (°C)1174
Gas turbine outlet (°C)549
Inlet steam temperature (°C)534533532530527.5524.5
Pinch temperature (°C)1515.51616.517.518
Economizer outlet temperature (°C)229225221216211205
Approach temperature (°C)25.52320.51814.511
Operating pressuresOriginal ISCC−10%−20%−30%−40%−50%
Inlet steam (bar)4338.734.430.125.821.5
LP evaporator (bar)2.42.161.921.681.441.2
Condenser (bar)0.08
Solar heat integrationOriginal ISCC−10%−20%−30%−40%−50%
Solar heat (MW)1.5
Cycle efficiencyOriginal ISCC−10%−20%−30%−40%−50%
Gas turbine cycle (%)39.84
Combined cycle (%)58.3458.3858.458.458.3958.35
Cycle power breakdownOriginal ISCC−10%−20%−30%−40%−50%
Compressor (kW)62,450
Gas turbine (kW)126,727
Gas cycle (kW)64,277
Steam cycle (kW)30,73330,78830,82330,83330,81130,746
Total net power (kW)95,01095,06595,10095,11095,08895,023
Power boosted (%)4.94.9655.014.984.92
Back work ratio (%)49.279
Specific work per unit fuel mass flow (kJ/kg)27,73627,75227,76227,76527,75927,740

References

  1. U.S Energy Information Administration “EIA”. Energy Institute Statistical Review of World Energy. 2012. Available online: https://ourworldindata.org/ (accessed on 13 November 2024).
  2. Enerdata. World Energy & Climate Statistics—Yearbook 2024. Available online: https://yearbook.enerdata.net/total-energy/world-consumption-statistics.html (accessed on 1 November 2024).
  3. Shahabuddin, M.; Bhattacharya, S. Effect of reactant types (steam, CO2 and steam + CO2) on the gasification performance of coal using entrained flow gasifier. Int. J. Energy Res. 2021, 45, 9492–9501. [Google Scholar] [CrossRef]
  4. Alam, M.T.; Dai, B.; Wu, X.; Hoadley, A.; Zhang, L. A critical review of ash slagging mechanisms and viscosity measurement for low-rank coal and bio-slags. Front. Energy 2021, 15, 46–67. [Google Scholar] [CrossRef]
  5. REN21. Renewables 2023 Global Status Report: Energy Supply Module. 2023. Available online: https://www.ren21.net/wp-content/uploads/2019/05/GSR-2023_Energy-Supply-Module.pdf (accessed on 13 November 2024).
  6. Statista. Global Data and Business Intelligence Platform with an Extensive Collection of Statistics. 2023. Available online: https://www.statista.com/ (accessed on 5 August 2024).
  7. Imteaz, M.A.; Shanableh, A.; Rahman, A.; Ahsan, A. Optimisation of rainwater tank design from large roofs: A case study in Melbourne, Australia. Resour. Conserv. Recycl. 2011, 55, 1022–1029. [Google Scholar] [CrossRef]
  8. Gielen, D.; Boshell, F.; Saygin, D.; Bazilian, M.D.; Wagner, N.; Gorini, R. The role of renewable energy in the global energy transformation. Energy Strateg. Rev. 2019, 24, 38–50. [Google Scholar] [CrossRef]
  9. Zhu, L.; Fang, W.; Rahman, S.U.; Khan, A.I. How solar-based renewable energy contributes to CO2 emissions abatement? Sustainable environment policy implications for solar industry. Energy Environ. 2023, 34, 359–378. [Google Scholar] [CrossRef]
  10. Weldekidan, H.; Strezov, V.; Town, G. Review of solar energy for biofuel extraction. Renew. Sustain. Energy Rev. 2018, 88, 184–192. [Google Scholar] [CrossRef]
  11. Tsoutsos, T.; Frantzeskaki, N.; Gekas, V. Environmental impacts from the solar energy technologies. Energy Policy 2005, 33, 289–296. [Google Scholar] [CrossRef]
  12. International Renewable Energy Agency “IRENA”. Future of Solar Photovoltaic. 2019. Available online: https://www.irena.org/-/media/Files/IRENA/Agency/Publication/2019/Nov/IRENA_Future_of_Solar_PV_2019.pdf (accessed on 25 October 2024).
  13. U.S. Department of Energy. Solar Parabolic Trough. 2009. Available online: https://www1.eere.energy.gov/ba/pba/pdfs/solar_trough.pdf (accessed on 31 October 2024).
  14. Rovira, A.; Montes, M.J.; Varela, F.; Gil, M. Comparison of Heat Transfer Fluid and Direct Steam Generation technologies for Integrated Solar Combined Cycles. Appl. Therm. Eng. 2013, 52, 264–274. [Google Scholar] [CrossRef]
  15. The World Bank. Implementation Completion and Results Report (TF-91289) on A Grand in The Amount of US $49.80 Million to the Arab Republic of Egypt for the Kuraymat Solar Thermal Hybrid Project. 2012. Available online: http://documents.worldbank.org/curated/en/168831468332487486/Main-report (accessed on 13 November 2024).
  16. Islam, M.T.; Huda, N.; Abdullah, A.B.; Saidur, R. A comprehensive review of state-ofthe-art concentrating solar power (CSP) technologies: Current status and research trends. Renew. Sustain. Energy Rev. 2018, 91, 987–1018. [Google Scholar] [CrossRef]
  17. Sumayli, H.; El-Leathy, A.; Danish, S.N.; Al-Ansary, H.; Almutairi, Z.; Al-Suhaibani, Z.; Saleh, N.S.; Saeed, R.S.; Alswaiyd, A.; Djajadiwinata, E.; et al. Integrated CSP-PV hybrid solar power plant for two cities in Saudi Arabia. Case Stud. Therm. Eng. 2023, 44, 102835. [Google Scholar] [CrossRef]
  18. Powell, K.M.; Rashid, K.; Ellingwood, K.; Tuttle, J.; Iverson, B.D. Hybrid concentrated solar thermal power systems: A review. Renew. Sustain. Energy Rev. 2017, 80, 215–237. [Google Scholar] [CrossRef]
  19. Pramanik, S.; Ravikrishna, R.V. A review of concentrated solar power hybrid technologies. Appl. Therm. Eng. 2017, 127, 602–637. [Google Scholar] [CrossRef]
  20. Wang, S.; Zhang, G.; Fu, Z. Performance analysis of a novel integrated solar combined cycle with inlet air heating system. Appl. Therm. Eng. 2019, 161, 114010. [Google Scholar] [CrossRef]
  21. Barakat, S.; Ramzy, A.; Hamed, A.M.; El Emam, S.H. Enhancement of gas turbine power output using earth to air heat exchanger (EAHE) cooling system. Energy Convers. Manag. 2016, 111, 137–146. [Google Scholar] [CrossRef]
  22. Barigozzi, R.; Franchini, G.; Perdichizzi, A.; Ravelli, S. Simulation of Solarized Combined Cycles: Comparison Between Hybrid GT and ISCC Plants. In Proceedings of the ASME Turbo Expo 2013: Turbine Technical Conference and Exposition, San Antonio, TX, USA, 3–7 June 2013; Volume 4. [Google Scholar] [CrossRef]
  23. Behar, O. Solar thermal power plants—A review of configurations and performance comparison. Renew. Sustain. Energy Rev. 2018, 92, 608–627. [Google Scholar] [CrossRef]
  24. Manente, G.; Rech, S.; Lazzaretto, A. Optimum choice and placement of concentrating solar power technologies in integrated solar combined cycle systems. Renew. Energy 2016, 96, 172–189. [Google Scholar] [CrossRef]
  25. Elmohlawy, A.E.; Ochkov, V.F.; Kazandzhan, B.I. Thermal performance analysis of a concentrated solar power system (CSP) integrated with natural gas combined cycle (NGCC) power plant. Case Stud. Therm. Eng. 2019, 14, 100458. [Google Scholar] [CrossRef]
  26. Elmohlawy, A.E.; Ochkov, V.F.; Kazandzhan, B.I. Study and prediction the performance of an integrated solar combined cycle power plant. Energy Procedia 2019, 156, 72–78. [Google Scholar] [CrossRef]
  27. Rovira, A.; Abbas, R.; Sánchez, C.; Muñoz, M. Proposal and analysis of an integrated solar combined cycle with partial recuperation. Energy 2020, 198, 117379. [Google Scholar] [CrossRef]
  28. Dayem, A.M.A.; Metwally, M.N.; Alghamdi, A.S.; Marzouk, E.M. Numerical Simulation and Experimental Validation of Integrated Solar Combined Power Plant. Energy Procedia 2014, 50, 290–305. [Google Scholar] [CrossRef]
  29. Muñoz, M.; Rovira, A.; Montes, M.J. Thermodynamic cycles for solar thermal power plants: A review. WIREs Energy Environ. 2022, 11, e420. [Google Scholar] [CrossRef]
  30. Javadi, M.; Jafari Najafi, N.; Khalili Abhari, M.; Jabery, R.; Pourtaba, H. 4E analysis of three different configurations of a combined cycle power plant integrated with a solar power tower system. Sustain. Energy Technol. Assess. 2021, 48, 101599. [Google Scholar] [CrossRef]
  31. Hosseini, R.; Soltani, M.; Valizadeh, G. Technical and economic assessment of the integrated solar combined cycle power plants in Iran. Renew Energy 2005, 30, 1541–1555. [Google Scholar] [CrossRef]
  32. Hajizadeh Aghdam, M.; Khoshgoftar Manesh, M.H.; Khani, N.; Yazdi, M. Energy, Exergy-Based and Emergy-Based Analysis of Integrated Solar PTC with a Combined Cycle Power Plant. Int. J. Thermodyn. 2021, 24, 17–30. [Google Scholar] [CrossRef]
  33. Binamer, A.O. Al-Abdaliya integrated solar combined cycle power plant: Case study of Kuwait, part I. Renew. Energy 2019, 131, 923–937. [Google Scholar] [CrossRef]
  34. Ameri, M.; Mohammadzadeh, M. Thermodynamic, thermoeconomic and life cycle assessment of a novel integrated solar combined cycle (ISCC) power plant. Sustain. Energy Technol. Assess. 2018, 27, 192–205. [Google Scholar] [CrossRef]
  35. Achour, L.; Bouharkat, M.; Behar, O. Performance assessment of an integrated solar combined cycle in the southern of Algeria. Energy Rep. 2018, 4, 207–217. [Google Scholar] [CrossRef]
  36. Manente, G. High performance integrated solar combined cycles with minimum modifications to the combined cycle power plant design. Energy Covers. Manag. 2016, 111, 186–197. [Google Scholar] [CrossRef]
  37. Dolores, D.G.; Rafael, A.S.; Galileo, M.C. Estudio del acoplamiento de diferentes configuraciones de ciclo combinado con planta solar de canal parabólico. Ing. Investig. Tecnol. 2015, 16, 253–264. [Google Scholar] [CrossRef]
  38. Egyptian Petrochemicals Company. Available online: www.egy-petrochem.com (accessed on 26 November 2023).
  39. Math Works. MATLAB Software. Available online: https://www.mathworks.com/products.html?s_tid=nav_products (accessed on 13 November 2024).
  40. Math Works. Ideal Air Toolbox. Available online: https://www.mathworks.com/matlabcentral/fileexchange/71269-ideal-air-properties-at-constant-pressure-1-atm (accessed on 19 April 2019).
  41. Math Works. XSteam Toolbox. Available online: https://www.mathworks.com/matlabcentral/fileexchange/9817-x-steam-thermodynamic-properties-of-water-and-steam (accessed on 19 April 2019).
  42. World Nuclear Association. Heat Values of Various Fuels. Available online: https://world-nuclear.org/information-library/facts-and-Figures/heat-values-of-various-fuels.aspx (accessed on 22 December 2023).
  43. Bergman, T.L.; Lavine, A.S.; Incropera, F.P.; Dewitt, D.P. Heat Exchangers. In Fundamentals of Heat and Mass Transfer, 7th ed.; John Wiley & Sons, Inc.: Hoboken, NJ, USA, 2011; pp. 706–747. [Google Scholar]
  44. “Recognized Document of the Regulation of Thermal Installations in Buildings (RITE)” Joint Resolution of the Ministries of Industry, Energy and Tourism, and the Ministry of Public Works. CO2 Emission Factors and Passage Coefficients to Primary Energy. Available online: https://energia.gob.es/desarrollo/EficienciaEnergetica/RITE/Reconocidos/Reconocidos/Otrosdocumentos/Factores_emision_CO2.pdf (accessed on 15 October 2023).
  45. World Weather & Climate Information. 2023. Available online: https://weather-and-climate.com/average-monthly-hours-Sunshine,Alexandria,Egypt (accessed on 20 July 2023).
  46. Solutia. Therminol VP-1: Vapor Phase/Liquid Phase Heat Transfer Fluid. Available online: http://twt.mpei.ac.ru/tthb/hedh/htf-vp1.pdf (accessed on 18 July 2021).
  47. Ruegamer, T.; Kamp, H.; Kuckelkorn, T.; Schiel, W.; Weinrebe, G.; Nava, P.; Riffelmann, K.; Richert, T. Molten Salt for Parabolic Trough Applications: System Simulation and Scale Effects. Energy Procedia 2014, 49, 1523–1532. [Google Scholar] [CrossRef]
  48. Barlev, D.; Vidu, R.; Stroeve, P. Innovation in concentrated solar power. Sol. Energy Mater. Sol. Cells. 2011, 95, 2703–2725. [Google Scholar] [CrossRef]
  49. Kalogirou, S.A. Solar thermal collectors and applications. Prog. Energy Combust. Sci. 2004, 30, 231–295. [Google Scholar] [CrossRef]
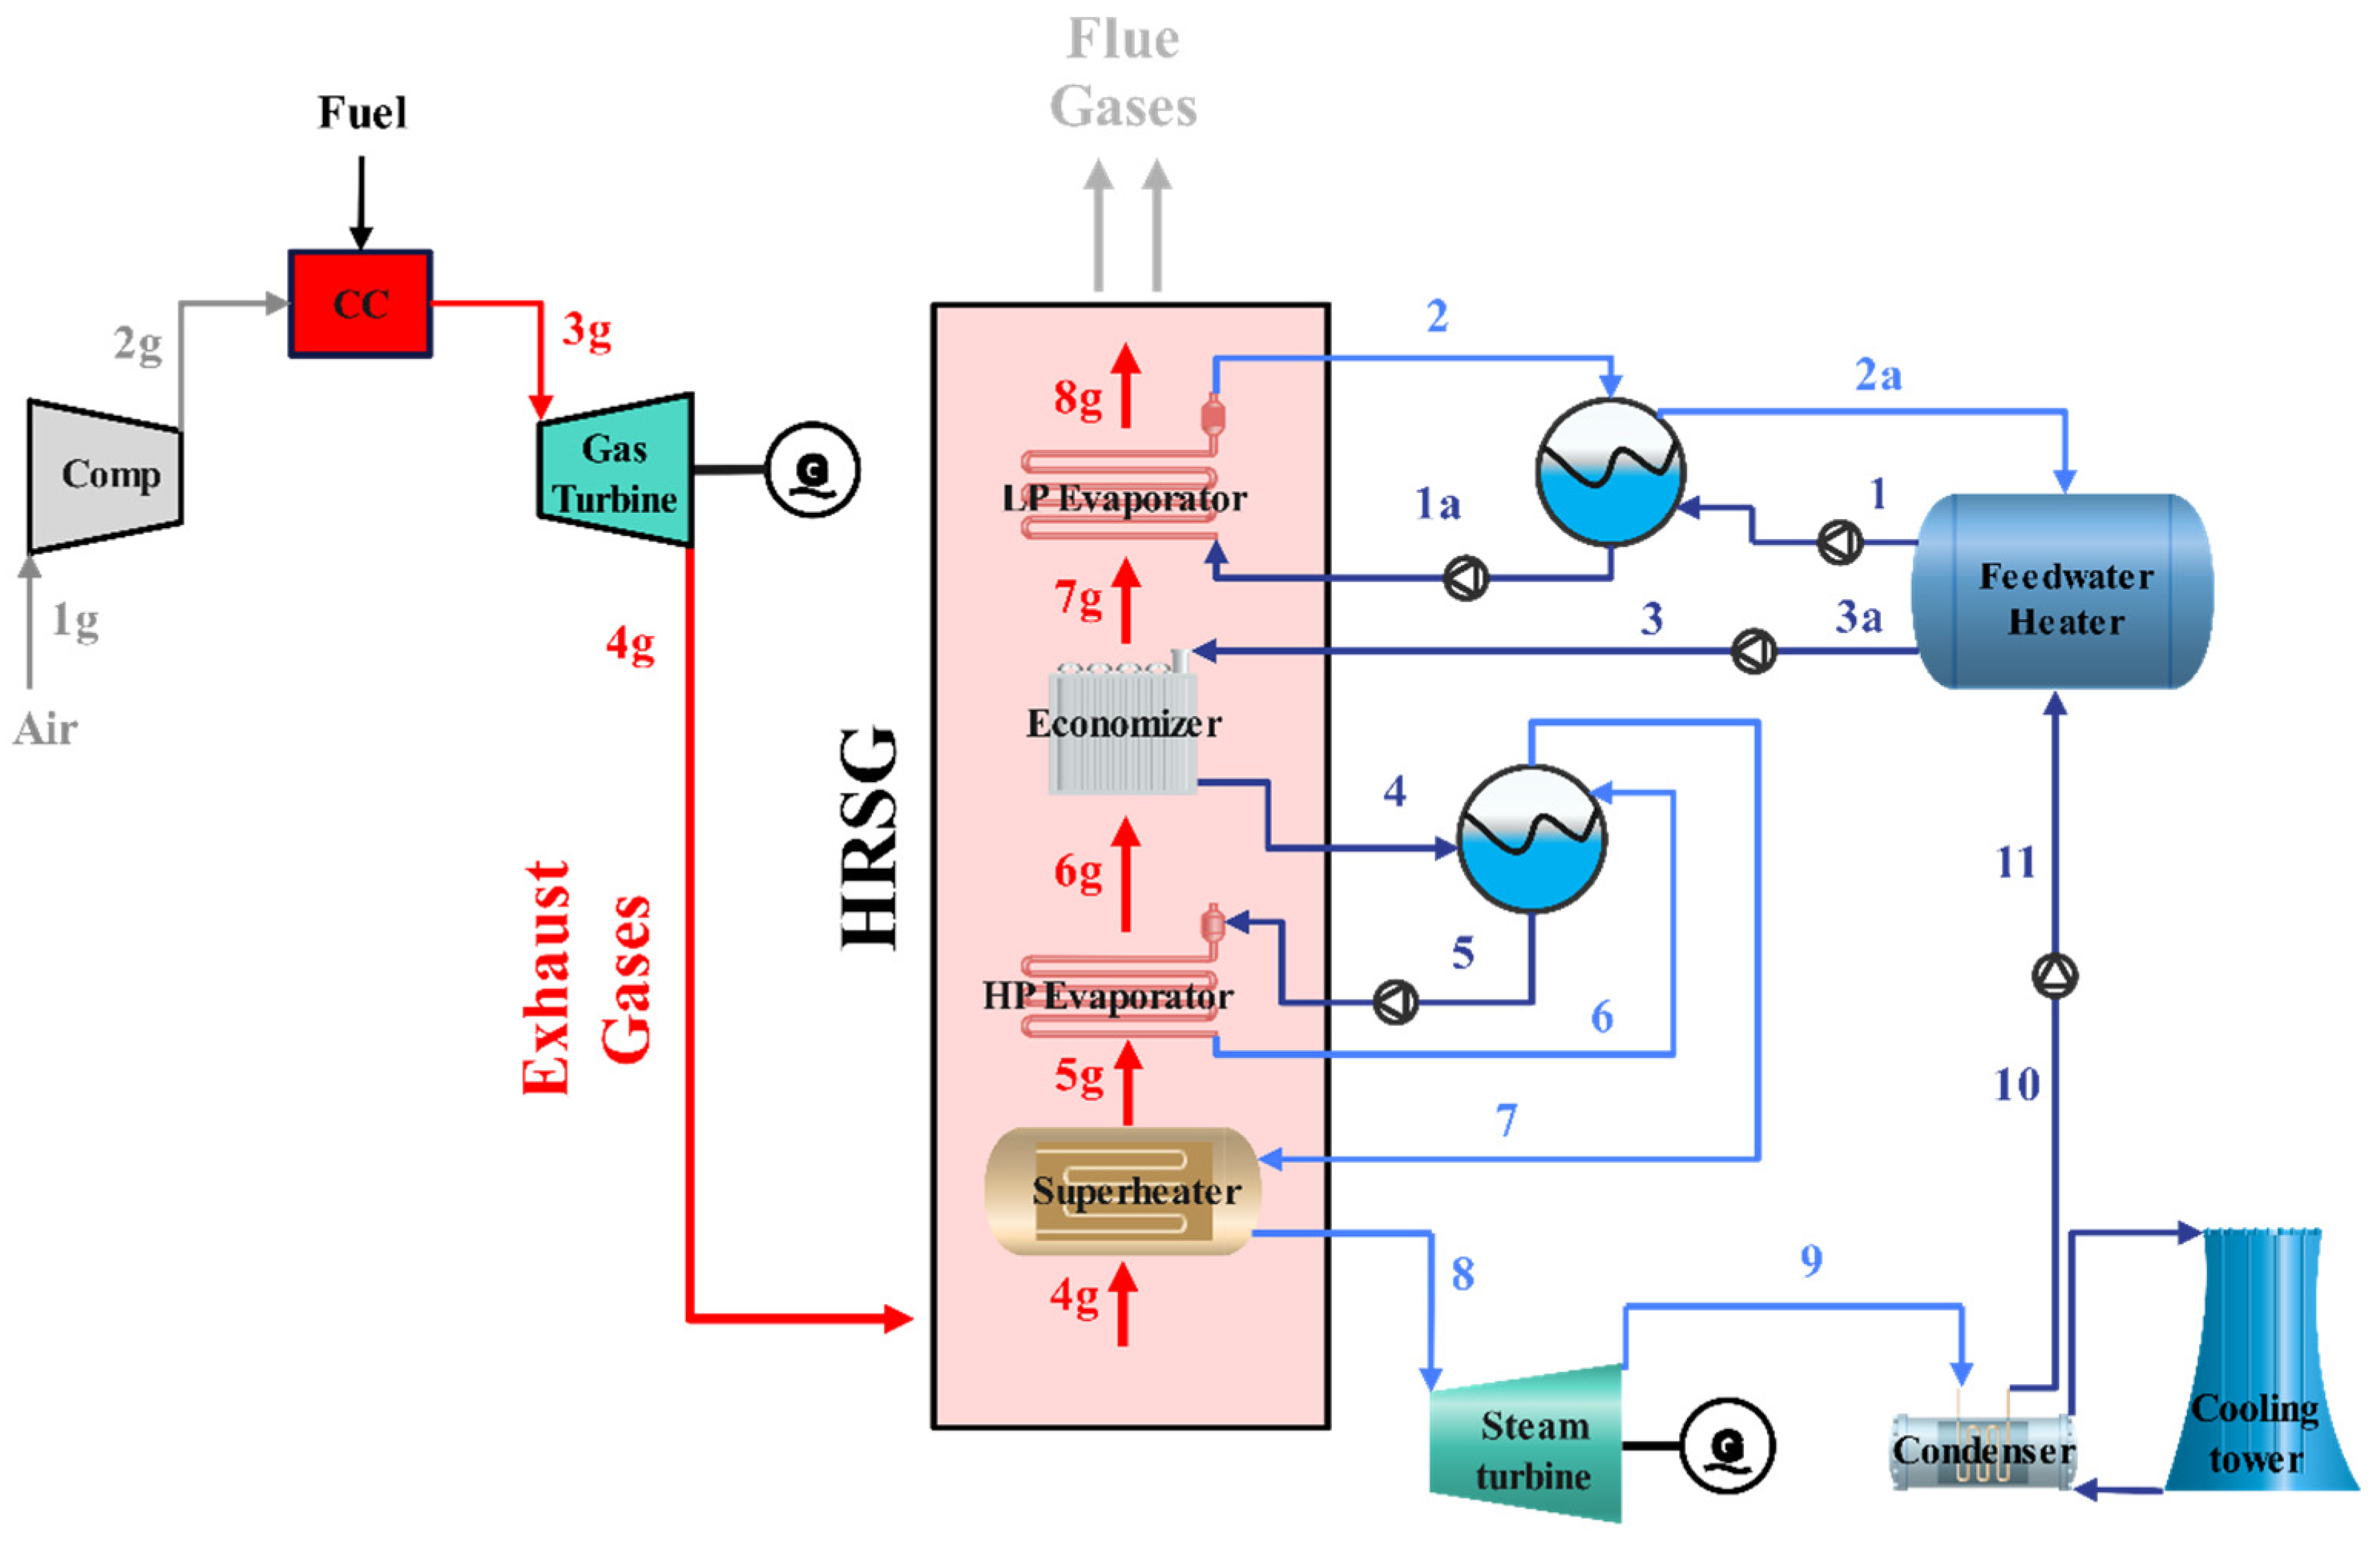
Figure 1. Diagram of the original combined cycle power plant.
Processes 12 02557 g001
Figure 2. T-s diagram of the original combined cycle.
Processes 12 02557 g002
Figure 3. T-Q diagram of the original combined cycle.
Processes 12 02557 g003
Figure 4. Solar field integration options.
Processes 12 02557 g004
Figure 5. Case A: solar field integration after air compressor.
Processes 12 02557 g005
Figure 6. Case B: solar field integration after combustion chamber.
Processes 12 02557 g006
Figure 7. Case C: solar field integration before superheater.
Processes 12 02557 g007
Figure 8. Case D: solar field integration at economizer.
Processes 12 02557 g008
Figure 9. Fuel saving (a) and temperature changes (b) for integration options A and B.
Processes 12 02557 g009
Figure 10. T-Q diagram for cases C and D (fuel saving).
Processes 12 02557 g010
Figure 11. Fuel saving (%) for steam cycle integration options.
Processes 12 02557 g011
Figure 12. Power boosting (%) and cycle efficiency (%) for integration options A and B.
Processes 12 02557 g012
Figure 13. T-Q diagram for case C (flowrate power boosting).
Processes 12 02557 g013
Figure 14. T-Q diagram for case D (flowrate power boosting).
Processes 12 02557 g014
Figure 15. Flowrate power boosting (%) for steam cycle integration configurations.
Processes 12 02557 g015
Figure 16. Parameter power boosting (%) at different pressure levels for case C.
Processes 12 02557 g016
Figure 17. Overall efficiency at different pressure levels for case C.
Processes 12 02557 g017
Figure 18. Parameter power boosting as a function of integrated solar power for case C: −50% HP.
Processes 12 02557 g018
Figure 19. T-Q diagram for case C parameter power boosting (−50% HP evaporator pressure).
Processes 12 02557 g019
Figure 20. Parameter power boosting (%) at different pressure levels for case D.
Processes 12 02557 g020
Figure 21. Parameter power boosting (%) as a function of integrated solar power for case D: −30%.
Processes 12 02557 g021
Figure 22. T-Q diagram for case D parameter power boosting (−30% LP evaporator pressure).
Processes 12 02557 g022
Figure 23. Optimum ISCC strategies depending on the desired outcome.
Processes 12 02557 g023
Table 1. Technical data of the combined cycle power plant.
Gas CycleSteam Cycle
Ambient temperature24 °CSteam inlet pressure43 bar
Ambient pressure1 barSteam inlet temperature457 °C
Combustion chamber inlet temperature379 °CLP evaporator pressure2.4 bar
Turbine pressure15.7 barCondenser pressure0.08 bar
Turbine inlet temperature1174 °CEconomizer outlet temperature228 °C
Turbine exhaust temperature549 °CLP evaporator mass flowrate5 kg/s
Exhaust mass flowrate174.7 kg/sHP evaporator mass flowrate25 kg/s
Table 2. Results of the thermodynamic model vs. actual values from the EPC power plant.
Operating & Design ConditionsModelEPC Power Plant
Gas turbine cycle
Air mass flowrate, kg/s171.2171.2
Air to fuel ratio5050
Pressure ratio, rp15.715.7
Turbine inlet temperature, °C11741100
Exhaust temperature, °C549540
Power output, MW90,56990,569
Top gas cycle efficiency, %39.84%39.84%
Steam Turbine cycle
LP steam mass flowrate, kg/s55
HP steam mass flowrate, kg/s2525
Turbine inlet pressure, bar4343
Power output, MW26,29226,292
Bottom steam cycle efficiency, %27.1NA
Heat recovery steam generator (HRSG)
Pinch point temperature, K17.517.5
Approach temperature, K2828
Stack temperature, °C160172
(UA) Feedwater heater, kW/K449NA
(UA) Low-pressure evaporator, kW/K164.5NA
(UA) Economizer, kW/K175.5NA
(UA) High-pressure evaporator, kW/K475NA
(UA) Superheater, kW/K84.5NA
Combined cycle
Total output power, MW90,56990,569
Efficiency, %56.1356.13
Table 3. Concentrating solar collectors [48,49].
Collector TypeParabolic Trough Collectors (PTC)Parabolic Dish Reflectors (PDR)Heliostat Field Collectors (Solar Power Tower)
DescriptionParabolic sheet of reflective material.Linear receiver (metal pipe with heat transfer fluid)Large reflective parabolic dish with stirring high engine receiver at focal pointLarge heliostat field with tall tower in its center. Receiver: water/HTF boiler at top
Operating range (°C)50–400150–1500300–2000
Relative costLowVery highHigh
Concentration ratio 115–45100–1000150–1500
TrackingOne-AxisTwo-AxisTwo-Axis
Efficiency (%)~18~30~25–28
1 Ratio of the effective area of the aperture to the receiver/absorber area of the collector.
Table 4. Original CC vs. ISCC (case A and case B) “Fuel saving”.
Mass FlowratesOriginal CCISCC Case AISCC Case B
Fuel flowrate (kg/s)3.423.21
Fuel saving (%)--6.23
Solar heat integrationOriginal CCISCC Case AISCC Case B
Integrated solar heat (MW)--10
Cycle efficiencyOriginal CCISCC Case AISCC Case B
Gas turbine cycle (%)39.8439.85
Combined cycle (%)56.1356.15
Cycle power breakdownOriginal CCISCC Case AISCC Case B
Gas cycle (kW)64,27764,27764,277
Steam cycle (kW)26,29226,29226,292
Total net power (kW)90,56990,56990,569
Specific work per fuel unit mass flow (kJ/kg)26,43928,19828,198
CO2 emissions (Mt/year)0.29710.27850.2785
CO2 emissions saved (kg CO2/kWh)-0.00640.0064
Table 5. Original CC vs. ISCC (case C and case D) “Fuel saving”.
Mass FlowratesOriginal CCISCC Case CISCC Case D
Fuel flowrate (kg/s)3.423.33.15
Fuel saving (%)--3.497.97
Solar heat integrationOriginal CCISCC Case CISCC Case D
Integrated solar heat (MW)--153
Cycle efficiencyOriginal CCISCC Case CISCC Case D
Gas turbine cycle (%)39.8439.8439.84
Combined cycle (%)56.1353.0659.79
Cycle power breakdownOriginal CCISCC Case CISCC Case D
Compressor (kW)62,45060,26657,471
Gas turbine (kW)126,727122,294116,622
Gas cycle (kW)64,27762,02859,152
Steam cycle (kW)26,29228,54231,417
Total net power (kW)90,56990,56990,569
Specific work per unit fuel mass flow (kJ/kg)26,43927,39928,730
CO2 emissions (Mt/year)0.29710.28670.2734
CO2 emissions saved (kg CO2/kWh)--0.00350.0083
Table 6. Original CC vs. ISCC (case A and case B) “Power boosting”.
Solar Heat IntegrationOriginal CCISCC Case CISCC Case D
Integrated solar heat (MW)--10
Cycle efficiencyOriginal CCISCC Case CISCC Case D
Gas turbine cycle (%)39.8439.83
Combined cycle (%)56.1355.19
Cycle power breakdownOriginal CCISCC Case CISCC Case D
Compressor (kW)62,45066,455
Gas turbine (kW)126,727134,693
Gas cycle (kW)64,27768,239
Steam cycle (kW)26,29226,323
Total net power (kW)90,56994,562
Power boosted (%)--4.41
Back work ratio (%)49.27949.33
Specific work per unit fuel mass flow (kJ/kg)26,43927,605
Table 7. Original CC vs. Flowrate boosting (case C and case D).
Mass FlowratesOriginal CCISCC Case CISCC Case D
LP evaporator mass flowrate (kg/s)59.176.54
HP evaporator mass flowrate (kg/s)2545.8432.72
Solar heat integrationOriginal CCISCC Case CISCC Case D
Integrated solar heat (MW)--412
Cycle efficiencyOriginal CCISCC Case CISCC Case D
Gas turbine cycle (%)39.8439.8439.84
Combined cycle (%)56.1368.0356.93
Cycle power breakdownOriginal CCISCC Case CISCC Case D
Gas cycle (kW)64,27764,27764,277
Steam cycle (kW)26,29248,21434,412
Total net power (kW)90,569112,49198,689
Power boosted (%)--24.28.96
Specific work per unit fuel mass flow (kJ/kg)26,43932,84028,810
Table 8. Considerations for integration of solar thermal power in existing combined cycles.
StrategyConsiderations/Recommendations for Solar Thermal Power Integration
Fuel savingA
  • Parabolic dish reflector or heliostat field collector technology must be used.
  • Parabolic trough collector could be an alternative, but HTF must withstand high temperatures (molten salts).
  • Recommended if implementation at the top gas cycle is requested.
B
  • Heliostat field collector technology must be used.
  • Not recommended due to technology restrictions.
C
  • Parabolic dish reflector or heliostat field collector technology must be used.
  • Parabolic trough collector could be an alternative, but HTF must withstand high temperatures (molten salts).
  • Lowest fuel saving per MW of solar thermal power.
  • Can absorb the highest solar thermal power.
  • Recommended for maximizing solar power integration.
D
  • Can work with all solar field technologies and HTFs.
  • Highest fuel saving per MW of solar thermal power.
  • Highest ISCC efficiency achieved among fuel-saving cases.
  • Recommended for fuel-saving operation.
Power boostingA
  • Parabolic dish reflector or heliostat field collector technology must be used.
  • Parabolic trough collector could be an alternative, but HTF must withstand high temperatures (molten salts).
  • Lowest power boosting per MW of solar thermal power.
  • Recommended if implementation at the top gas cycle is requested.
B
  • Heliostat field collector technology must be used.
  • Lowest power boosting per MW of solar thermal power.
  • Not recommended due to technology restrictions and low efficiency.
CFlowrate
  • Can work with all solar field technologies and HTFs.
  • Highest power boosting per MW of solar thermal power.
  • Highest ISCC efficiency achieved.
  • Recommended for power-boosting operation.
Parameter
  • Can work with all solar field technologies and HTFs.
  • Low power boosting per MW of solar thermal power.
  • Not recommended.
DFlowrate
  • Can work with all solar field technologies and HTFs.
  • Is clearly outperformed by flowrate option C.
  • Not recommended.
Parameter
  • Can work with all solar field technologies and HTFs.
  • Maximizes power boosting for solar power < 1.5 MW.
  • Recommended for low solar thermal power values.
Disclaimer/Publisher’s Note: The statements, opinions and data contained in all publications are solely those of the individual author(s) and contributor(s) and not of MDPI and/or the editor(s). MDPI and/or the editor(s) disclaim responsibility for any injury to people or property resulting from any ideas, methods, instructions or products referred to in the content.