Article

Experimental and Numerical Simulation Studies on the Synergistic Design of Gas Injection and Extraction Reservoirs of Condensate Gas Reservoir-Based Underground Gas Storage

1
National Key Laboratory of Oil and Gas Reservoir Geology and Exploitation, Southwest Petroleum University, Chengdu 610500, China
2
Tarim Oilfield Company, PetroChina, Korla 841000, China
3
Southwest Oil & Gas Field Company, PetroChina, Chengdu 610051, China
*
Author to whom correspondence should be addressed.
Processes 2024, 12(12), 2668; https://doi.org/10.3390/pr12122668
Submission received: 3 October 2024 / Revised: 7 November 2024 / Accepted: 15 November 2024 / Published: 26 November 2024
(This article belongs to the Special Issue Numerical Simulation of Oil and Gas Storage and Transportation)

Abstract

:
The natural gas industry has developed rapidly in recent years, with gas storage playing an important role in regulating winter and summer gas consumption and ensuring energy security. The Ke7010 sand body is a typical edge water condensate gas reservoir with an oil ring, and the construction of gas storage has been started. In order to clarify the feasibility of synergistic storage building for gas injection and production, the fluid characteristics during the synergistic reservoir building process were investigated through several rounds of drive-by experiments. The results show that the oil-phase flow capacity is improved by increasing the number of oil–water interdrives, and the injection and recovery capacity is improved by increasing the number of oil–gas interdrives; the reservoir capacities of the high-permeability and low-permeability rock samples increase by about 4.84% and 7.26%, respectively, after multiple rounds of driving. Meanwhile, a numerical model of the study area was established to simulate the synergistic storage construction scheme of gas injection and extraction, and the reservoir capacity was increased by 7.02% at the end of the simulation period, which was in line with the experimental results. This study may provide a reference for gas storage construction in the study area.

1. Introduction

Underground gas storage refers to artificial gas reservoirs formed by injecting natural gas into a specific underground storage space, which is used to solve the seasonal and geographical imbalance of gas consumption in cities [1,2], and it is an important part of the urban natural gas transmission and distribution system, which is important for regulating winter and summer gas consumption and ensuring energy security [3,4]. It has the dual function of gas storage and extraction, which is also important for regulating winter and summer gas consumption and ensuring energy security. Since the world’s first underground gas storage facility was built in Ontario, Canada, in 1915, more than 679 underground gas storage facilities of various types have been built around the world [5,6]. Of these, North America accounts for 66%, Europe for about 20% and the Commonwealth of Independent States for about 7%. The total working gas volume in North America is 163.5 billion cubic metres, ranking first in the world, followed by the Commonwealth of Independent States region with a total working gas volume of 120.8 billion cubic metres and the European region with a total working gas volume of 107.6 billion cubic metres. China’s research and practice of underground storage construction has occurred relatively later [7], and more than 36 underground storage reservoirs have been completed, with a cumulative capacity of more than 61.373 billion cubic metres [8]. Among all the types of gas storage reservoirs built so far, depleted gas reservoir-type reservoirs, which are characterised by high geological understanding, natural sealing, large gas storage capacity, and strong peaking capacity, are the main types of gas storage reservoirs built globally [9,10,11].
For depleted gas reservoirs, especially condensate reservoirs, the interactions and influences between the edge water, condensate oil ring, and injected gas during the injection and recovery process [12,13] will have certain impacts on the injection and recovery rate of the reservoir as well as the reservoir capacity, causing engineering problems and certain economic losses. Therefore, in order to support the construction and operation of condensate reservoirs, it is necessary to clarify the characteristic laws of oil, gas, and water seepage during the injection and production process, and a large number of studies have already been carried out around condensate reservoirs. Among others, Brannon [14] used component modelling to simulate reservoir operation scenarios for depleted condensate reservoirs to improve condensate recovery. Rouhbakhsh Arfaee et al. [15] constructed single-porosity, double-porosity, and double-permeability models for fractured condensate reservoirs to investigate the effect of fracturing on reservoir storage capacity and fluid distribution in condensate reservoirs. Deng et al. [16] concluded that multiple cycles of gas injection can restore reservoir pressure and reduce recombinant content, thereby improving reservoir injection and storage capacity. Jieming Wang et al. [17] established a mathematical model and an experimental simulation method for the changing of oil and gas phases during the whole process of gas reservoir injection and extraction, and the study showed that the injected gas has evaporation and pumping effects on the oil ring in the gas reservoir’s injection stage. Long et al. [18] proposed a full-cycle EOR-UGS methodology for condensate reservoir-type reservoirs, including depletion production, cyclic gas injection, synergistic production, and multi-cycle gas injection and recovery (UGC) phases, which can significantly improve condensate recovery and enhance gas storage and peaking capacity. Song et al. [19] developed a mathematical model of gas–water flow in a pore-scale model based on CT scan images of rock samples, thus simulating and analysing the law of gas–water two-phase flow in multi-cycle replacement.
Therefore, in order to clarify the principle and feasibility of synergistic reservoir construction for gas injection and production in the study area, and to design and simulate the synergistic reservoir construction scheme in the study area, this paper carries out a study combining numerical simulation and experimentation. First, the two-phase seepage characteristics of oil and gas during the synergistic reservoir building process of gas injection and extraction are investigated by designing multiple rounds of repulsion experiments. Secondly, in conjunction with the numerical simulation study of the synergistic reservoir construction scheme for gas injection and extraction in the study area, the principle, effect, and feasibility of multiple rounds of drive expansion are clarified, which will serve as a reference for the subsequent operation in the study area and the study of similar blocks.

2. Overview of the Study Area

The KE7010 sand body in the study area is located in the eastern part of the XIQI tectonics, as a typical stratified side water condensate gas reservoir with an oil ring controlled by tectonics and lithology (Figure 1), with a gas bearing area of 2.3 km2; a reservoir thickness of 16.78 m; an average porosity of 14.7%; a permeability of 40.2 mD; an original stratigraphic pressure of 45.6 MPa; and a proven geological reserve of 646 million m3 of natural gas and 720,300 tonnes of oil, of which the geological reserve of the gas layer is 4.37 × 10⁸ m3, and the geological reserve of condensate is 13.62 × 10⁴ t, with a content of 3116 g/m3. The study area is characterised by large area, thick reservoir, good physical properties, high stratigraphic pressure, good sealing, large scale of reserves, better preservation status of oil and gas, and excellent overall sealing ability of the sand body. It meets the requirements of underground gas storage reconstruction and can be constructed in cooperation with gas injection and extraction to improve the recovery rate of condensate and oil ring oil, expand the reservoir capacity, and realise the purpose of seasonal peak demand and winter supply security.
The study area started the construction of the gas storage reservoir in 2022, and based on the technology of gas injection, extraction, and synergistic reservoir construction in condensate reservoirs, it was designed to realise the purpose of improving the extraction degree of oil ring condensate rings, expanding the capacity and increasing the injection, extraction, and peak regulation capacity of the reservoir through multiple rounds of injection and extraction and driving alternation while transforming the condensate reservoirs, constructing the reservoirs, and extracting the condensate ring from the oil ring by counter-evaporation.

3. Gas Injection EOR-Storage Coordination

The synergistic reservoir construction by gas injection and extraction in condensate reservoirs refers to the multiple rounds of gas injection and withdrawal into the upper storage zone of a condensate reservoir suitable for storage during its conversion to a gas storage facility. While carrying out the reconstruction of condensate gas reservoir construction, the extraction of oil ring condensate by counter-evaporation improves the degree of oil ring condensate extraction, which in turn achieves the purpose of expanding the storage capacity of condensate gas reservoir-type reservoirs and improving the injection and extraction capacity of reservoir operation [20,21,22].
The synergistic construction of gas injection and extraction reservoirs in condensate reservoirs combines the functions of extraction and capacity expansion and follows the development principle of ‘gravity-assisted, drying and pressure-maintaining, and taking into account the richness of gas’ [23]. In the process of converting oil-ring-type condensate gas reservoirs into gas storage reservoirs, first by injecting natural gas at the top of the reservoir, relying on the advantages of gravitational differentiation, anti-evaporation extraction, and component diffusion of dry gas as well as drying and pressure maintenance, five regional zones are formed: The top of the secondary gas, the dry gas–condensate oil transition zone (ring), the condensate oil zone (ring), the condensate oil –edge (bottom) water transition zone, and the edge (bottom) water zone (Figure 2). At the same time, the subsequent operation of the gas storage reservoir, through the process of multiple rounds of injection, extraction, and replacement, with the help and deepening of dry gas anti-evaporation and extraction, gravity differentiation, and the advantages of component diffusion and drying and pressure maintenance, can further improve the recovery rate of condensate, so as to continuously expand the storage space and constantly expand the capacity to the maximum recovery of condensate at the same time to maximise the expansion of storage capacity of gas storage.

4. Multiple Rounds of Drive-By Capacity Expansion Experiments

4.1. Experimental Principles

In order to study the oil–water and oil–vapour two-phase seepage characteristics during the process of gas injection and extraction synergistic reservoir construction in condensate reservoirs, based on the theory of oil–vapour–water seepage and the method of oil–vapour–water PVT phase characteristics testing [24], an indoor physical simulation experiment was used to simulate the process of gas injection and extraction synergistic reservoir construction in condensate reservoirs, and several rounds of oil–steam–oil, oil–steam, and oil–steam interdriven experiments were conducted. Under laboratory conditions, oil–water and oil–gas mutual drive experiments were carried out on rock samples using the non-stationary method. The results of the data on the relative permeability of oil and gas were recorded, and the phase permeability curves after oil–water and oil–gas mutual drive were plotted according to the experimental data in order to study the rule of change of the permeability patterns of the oil phase and gas phase under the conditions of oil–water and oil–gas mutual drive.

4.2. Experimental Materials and Methods

4.2.1. Experimental Condition

The temperature and pressure conditions of this experiment were normal temperature and pressure (20 °C, 0.101 MPa), and the cores used in the experiment were representative cores of the actual reservoir. Since the original formation fluids could not be obtained at the time of reservoir construction, the fluid samples used in the experiment were obtained by sampling and testing formation fluids, of which the condensate and natural gas used in the experiment were configured according to the composition of the substances, and the water used in the replacement experiment was prepared according to the data of the analysis of the formation water sampling in the actual formation section.

4.2.2. Experimental Materials

Experimental Core

The cores used in the experiment were representative core samples of the actual reservoir in the Kekeya Reservoir, and the pore permeability tests were conducted separately on five rock samples to obtain the physical properties of the cores as shown in Table 1. Among them, the permeability of Core 1 and Core 2 was within the permeability distribution range of the main reservoir in the study area, and they were used as representative samples of low permeability and high permeability cores of the reservoir, respectively, to conduct the subsequent rounds of oil–water and gas–oil transient repulsion phreatic seepage experiments.

Condensate Gas

The condensate gas used in the experiment was compounded from soil samples and formulated according to compositional data (Table 2) following analysis of gas production samples from the study area.

Condensate Oil

The condensate used in the experiment was compounded from soil samples and formulated according to compositional data after analysis of gas production samples from the study area (Table 3).

Formation Water

The aquifer water used in the experiment was a simulated aquifer water formulated based on chemical property data (Table 4) after sampling and analysis of aquifer water in the study area.

4.2.3. Experimental Equipment

The main instrument used in the experiment was the 103-type relative permeability testing device (Figure 3), which is mainly composed of three parts: injection, replacement and metering, of which the injection system includes oil, gas, and water injection systems, valves, and filters; the replacement system includes a pressure booster, a core adder, a pressure return valve, a hand pump, and a pressure transducer; and the metering system includes a data logger, an oil metering tube, a gas metering tube, a water metering tube, and a balance bottle.

4.2.4. Experimental Methods

The steps and procedures of multi-round oil–water (oil and gas) mutual drive experiments are as follows:
  • At normal temperature and pressure, first fully saturate the core with formation water (condensate), then use the replacement pump to pass the formation water/condensate through the rock samples at a specified pressure or flow rate until the pressure difference and flow rate between the inlet and outlet of the replacement rock samples stabilises. Then, measure the permeability of the water (gas) phase and the oil phase three times in succession with a relative deviation of less than 3% and use this water (gas) phase and oil phase permeability as the base value for the relative permeability of water–oil (gas-oil) and oil–water (oil-gas). This water (gas) phase and oil phase permeability is used as the base value for the water-oil (gas-oil) and oil-water (oil-gas) relative permeabilities;
  • When determining the relative permeability of oil and gas, use the oil drive water (gas drive oil) method to determine the bound water (residual oil), drive until no water (oil) is produced or the oil drive multiplier reaches 20 times the pore volume or more, record the amount of water (oil) driven out, and calculate the oil saturation (gas saturation) and bound water saturation (residual oil saturation) of the rock samples;
  • The initial pressure differential should ensure that the end effect can be overcome without creating turbulence;
  • Adjust the outlet volume metering system, start the water drive oil (oil drive gas), and record the replacement pressure and liquid production at each moment;
  • Carry out the gas-drive-oil (gas-drive-water) test to the residual oil (residual water) state, determine the effective permeability of the oil (gas) phase in the residual state, and then terminate the displacement test;
  • Conduct experiments on oil-driven water (gas-driven oil) using the experimental process and methods and procedures consistent with water-driven oil (oil-driven gas);
  • This cycle is repeated for five rounds of oil–water (oil and gas) mutual propulsion, and during each round of propulsion, the liquid production at the exit end of the rock sample at each moment, the pressure difference between the two ends, and other data are recorded;
  • Calculate the relative permeability of the gas and oil phases and the gas and oil saturation at any time in the core according to Darcy’s formula, the JBN method [25], or the Jones graphical method [26], respectively, and plot the relative permeability curves of oil and gas. In this case, the formula for determining the relative permeability of two-phase fluids in rock is as follows:
K ge = 2 p a q g μ g L A p 1 2 p a 2 × 10 2
K o e = q o μ o L A ( p 1 p 2 ) × 10 2
where Kge is the gas-phase effective permeability, decimal; Koe is the oil-phase effective permeability, decimal; pa is the atmospheric pressure, MPa; qg, qo are gas and oil flow rates, respectively, mL/s; μg, μo are the viscosity values of gas and oil, respectively, mPa·s; L is the core length, cm; A is the core cross-sectional area, cm2; p1 is the core inlet pressure, MPa; and p2 is the core outlet pressure, MPa.
K rg = K ge K g ( S os )
K ro = K oe K g ( S ws )
where Krg is the gas-phase relative permeability, decimal; Kge is the gas-phase effective permeability, mD; Kg (Sog) is the gas-phase effective permeability under residual oil, mD; Kro is the oil-phase relative permeability, decimal; and Koe is the oil-phase effective permeability, mD.
S o = m i m o V p ρ w × 100
S g = 100 S o
where So is the oil saturation of the core, %; mi is the mass of the oil-bearing core at point i, g; mo is the mass of the dry core, g; and Sg is the gas saturation of the core, %.

4.3. Experimental Results and Analysis

4.3.1. Oil–Water Mutual Drive

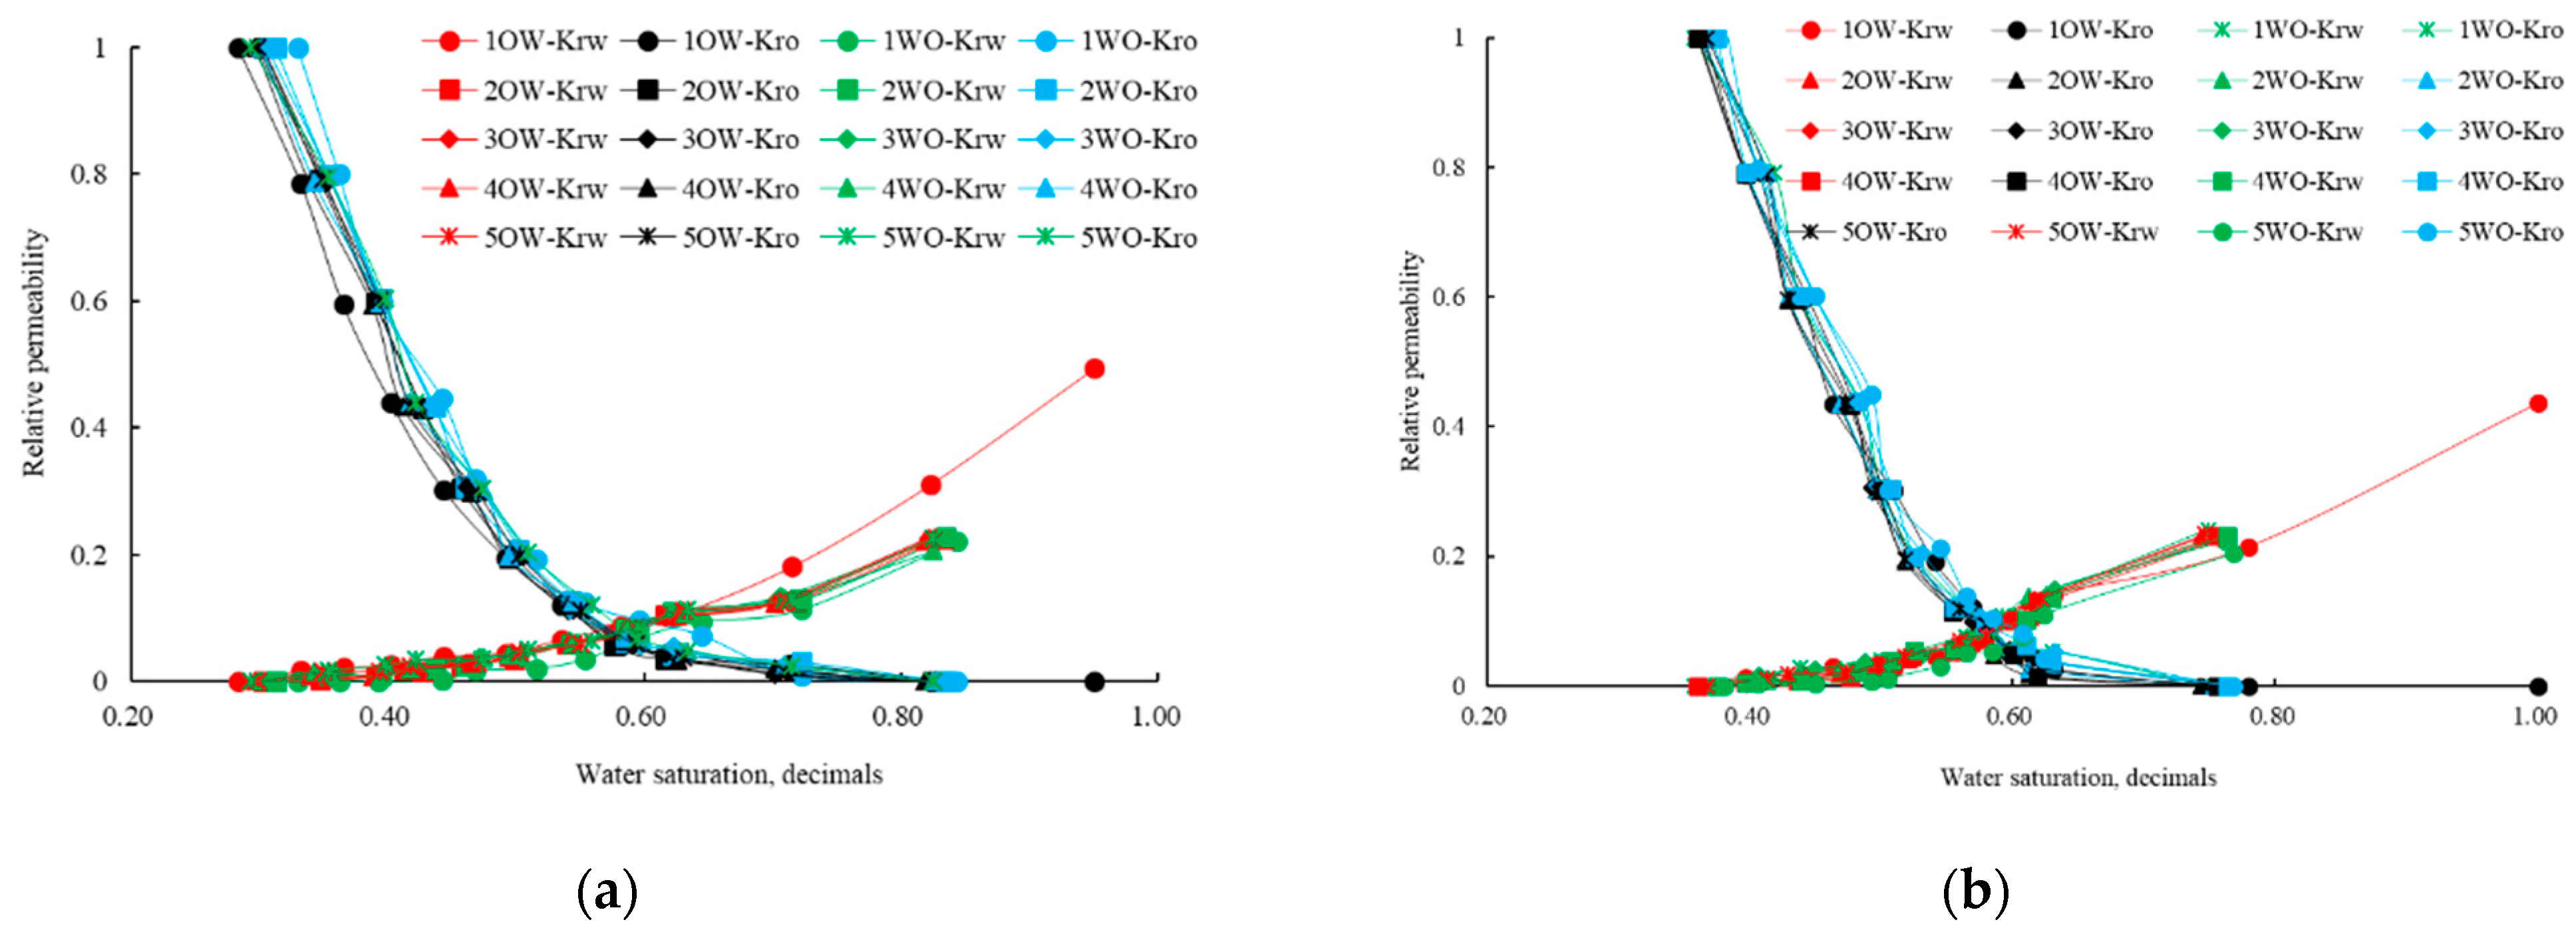
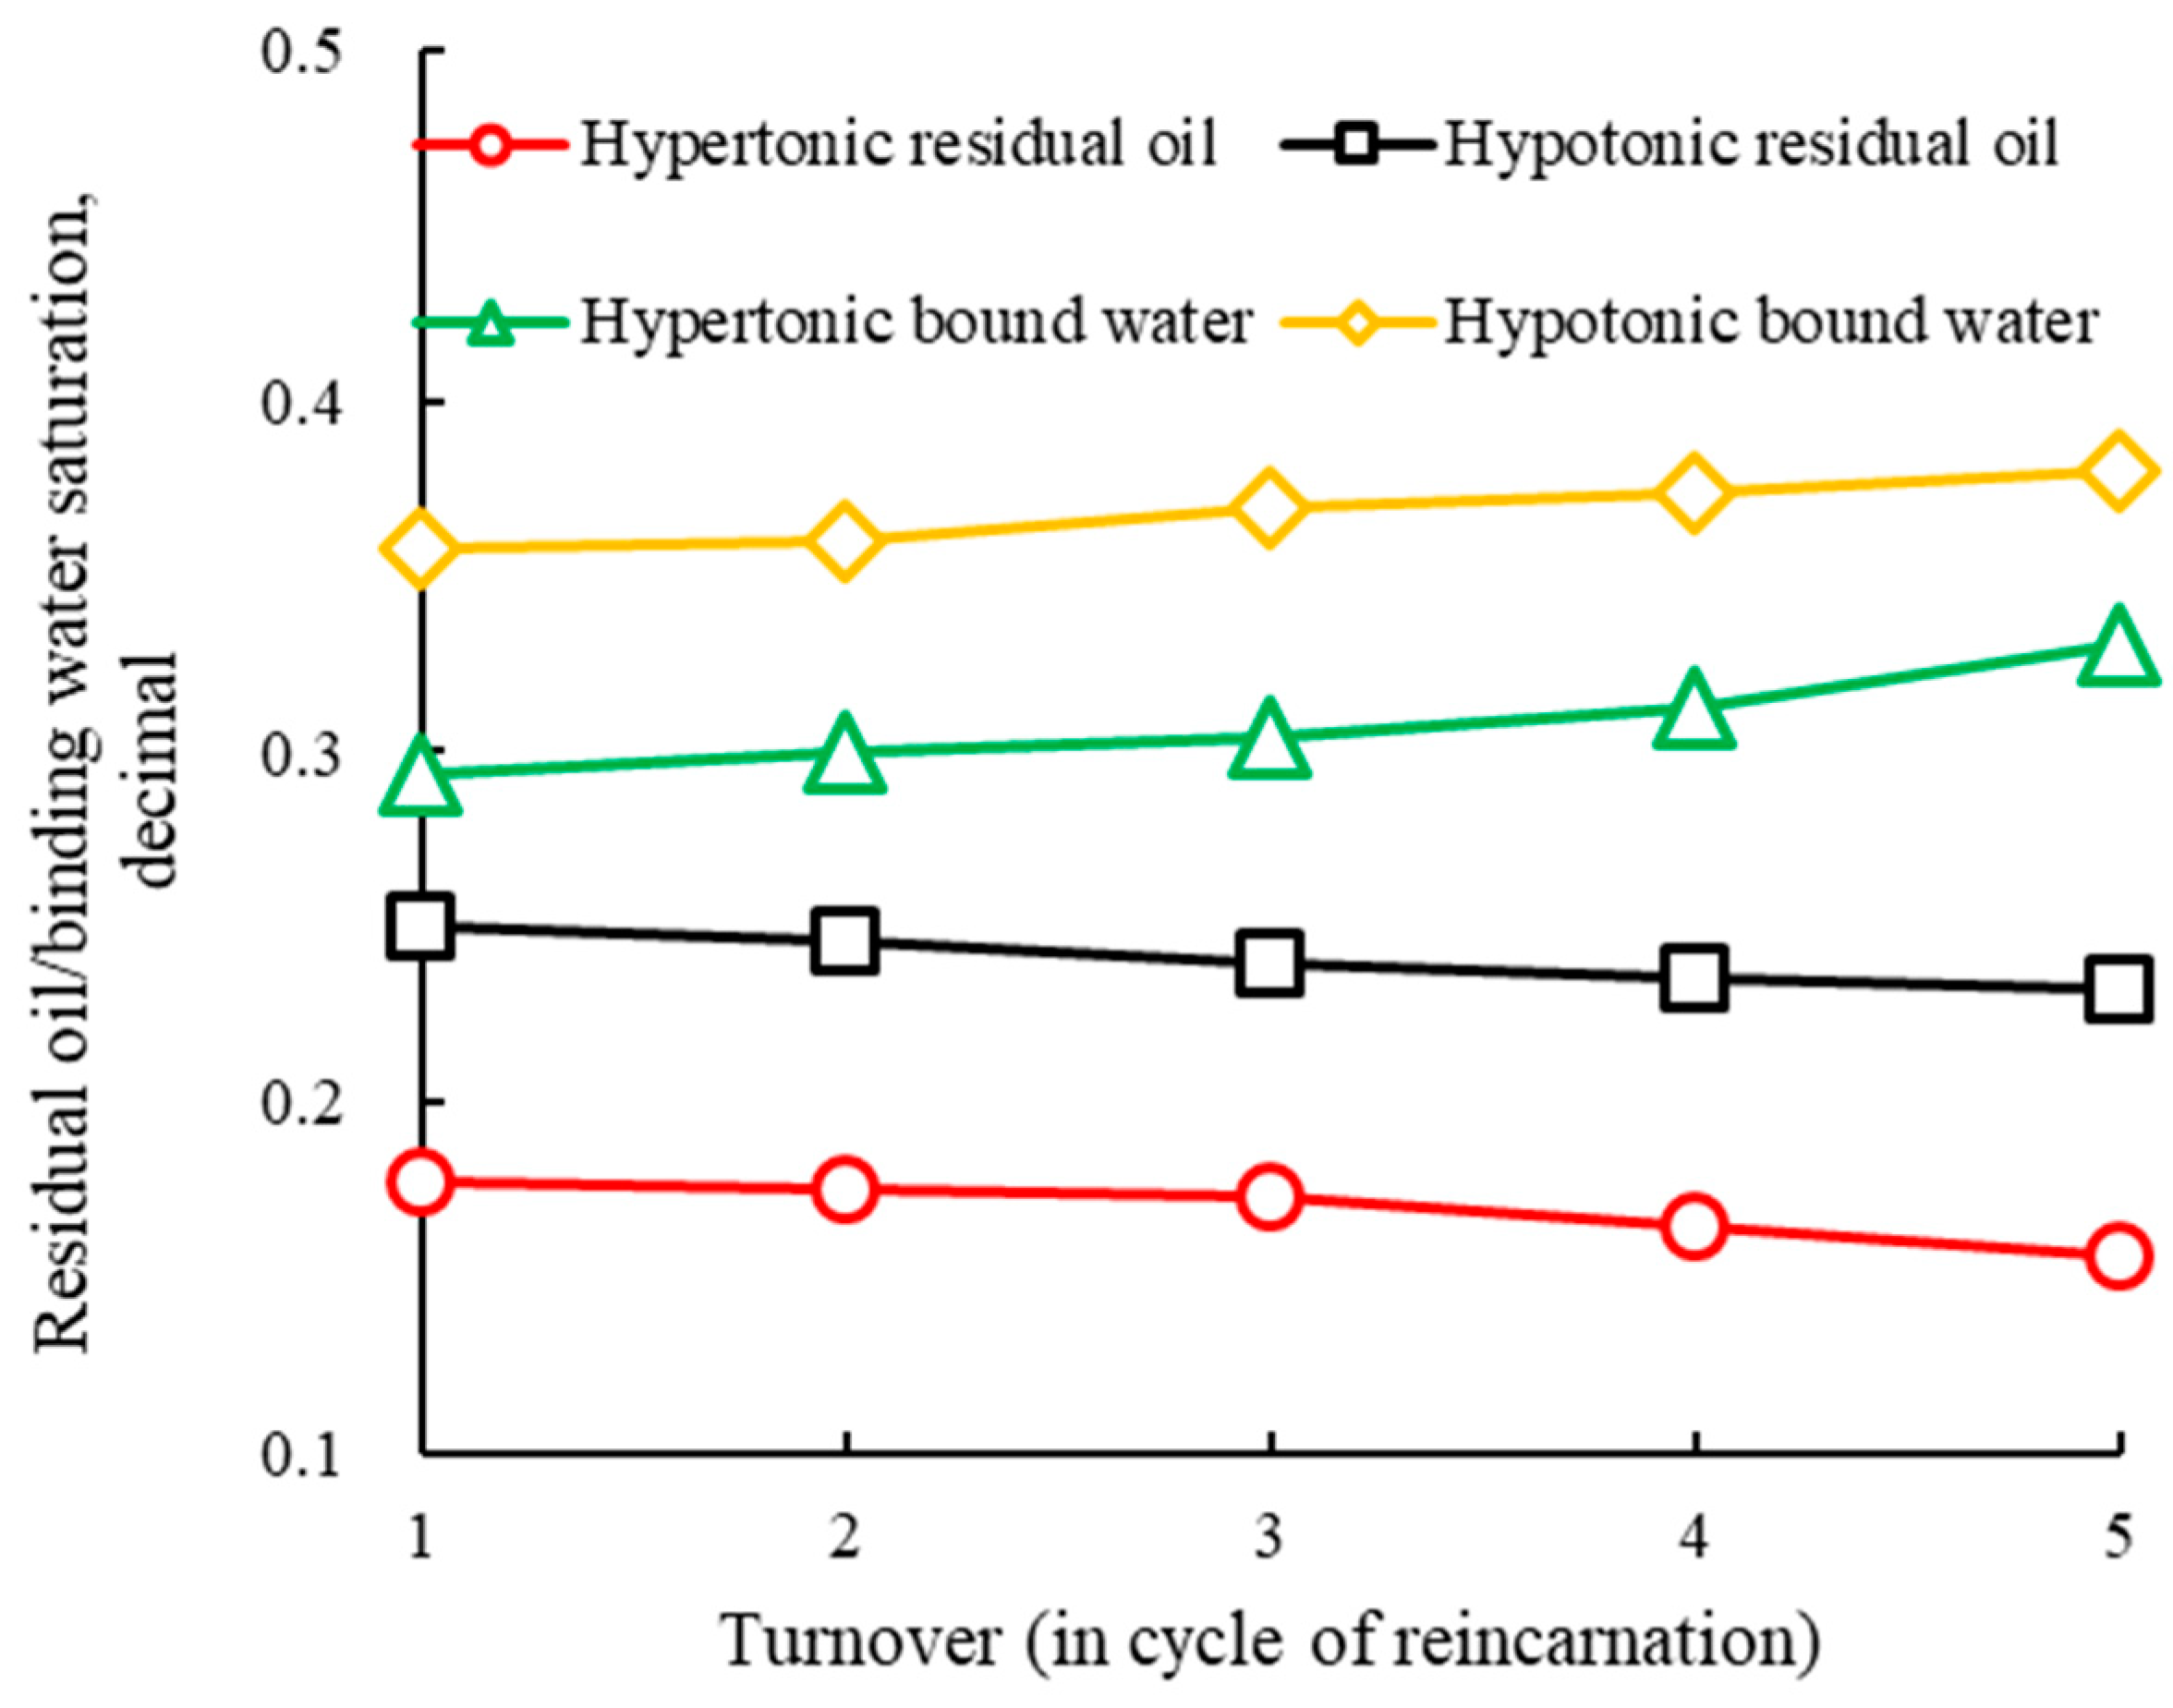
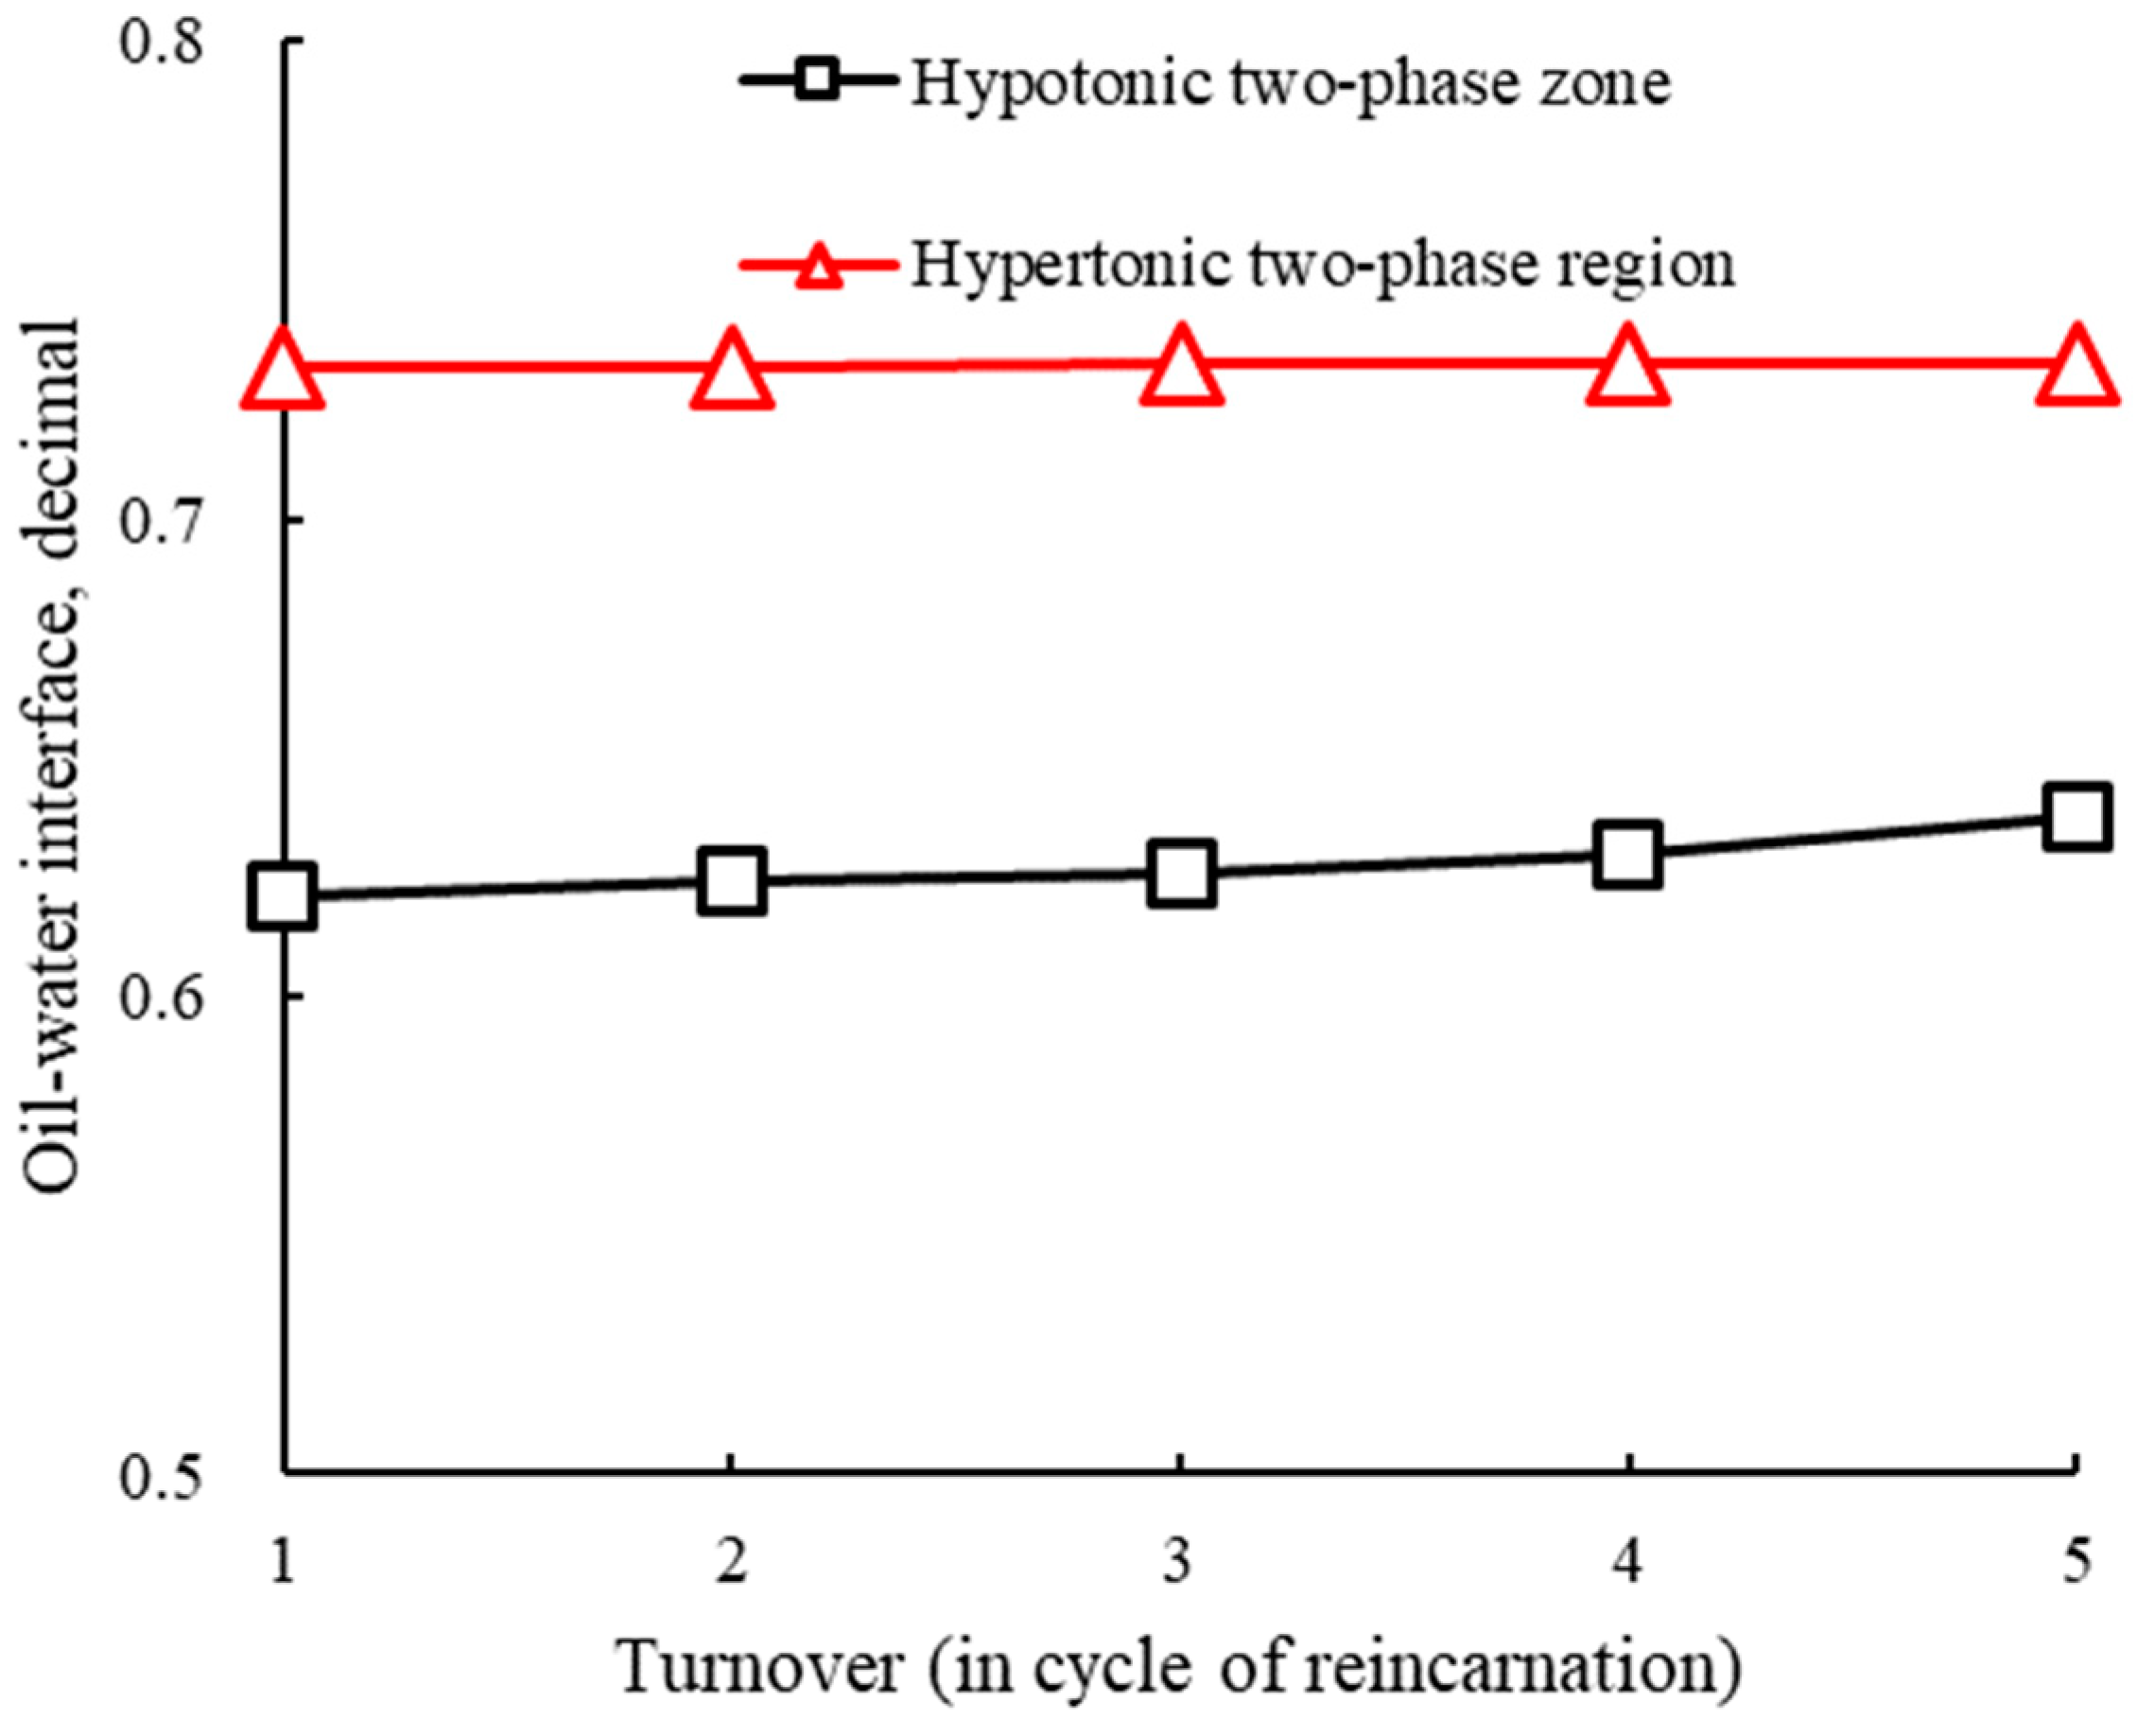
Based on the results of five rounds of oil–water and oil–gas mutual drive experiments of relatively low-permeability (Core 1) and high-permeability (Core 2) rock samples, the relative permeability of the gas phase (oil phase) and the saturation of water (oil) were calculated using the above equation. The oil–water relative permeability curves are plotted as shown in Figure 4. Residual oil/binding water saturation change curves for multiple rounds of oil–water drive are also plotted in Figure 5, while two-phase zone change curves for multiple rounds of oil–water drive are also plotted in Figure 6.
From the results, it can be seen that the relative permeability of the oil phase under multiple rounds of oil–water reciprocal driving conditions is all lower in the discharge driving process than in the inhalation process, while the permeability of the water phase is the opposite, and the oil phase flow ability is stronger in the water-driven oil driving process in gas extraction than in the water-driven oil driving process in gas injection, i.e., it is more difficult for the non-wetting phase to drive for the wetting phase. As the number of reciprocations increases, the trend is for Kro to increase and Krw to decrease, and the isotonic point is shifted to the lower right, indicating that the oil-phase flowability is enhanced and the water phase flowability is reduced after multiple rounds of driving (Figure 4).
As the number of rounds of reciprocal drilling increased, the residual oil saturation of both high- and low-permeability rock samples showed a decreasing trend, while the bound water saturation increased, but the oil-water two-phase zone did not change much (Figure 5). The higher the absolute permeability of the core, the lower the residual oil saturation, the lower the bound water saturation, and the larger the area of the two-phase co-seepage zone, and the difference in saturation between the two types of samples in the co-seepage zone is about 13.5% (Figure 6).
The bound water saturation of hypertonic rock samples changed from 29.4% to 33.0%, about 3.5 percentage points; the bound water saturation of low-permeability rock samples changed from 35.8% to 38.0%, about 2.2 percentage points; the residual oil saturation of high-permeability rock samples changed from 17.7% to 15.6%, about 2.1 percentage points lower; and the residual oil saturation of low-permeability rock samples changed from 25.1% to 23.3%, a decrease of about 1.8 percentage points.

4.3.2. Oil and Gas Interdrive

The oil–gas relative permeability curves were plotted as shown in Figure 7. Residual gas/residual oil saturation change curves for multiple rounds of oil–gas drive are also plotted as shown in Figure 8, while two-phase zone change curves for multiple rounds of oil–gas drive are plotted as shown in Figure 9.
From the results, it can be seen that under the condition of multiple rounds of oil and gas mutual driving, the relative permeability of the oil phase is higher in the process of displacement (gas-driven oil) than in the process of inhalation (oil-driven gas), and the change rule of the relative permeability of the gas phase is reversed, i.e., the gas-phase flow capacity is stronger in the case of extraction (oil-driven gas) than in the case of injection (gas-driven oil). As the number of reciprocations increases, Kro decreases, Krg increases, the iso-permeability point is shifted to the lower left, and both the injection and extraction capacities increase (Figure 7).
With the increase in the number of mutual driving, the residual oil saturation shows a decreasing trend while the residual gas saturation increases, but the increase is small; the oil and gas two-phase zone does not change much, but the overall trend shows a small increase, that is, with the increase in the number of driving rounds, the reservoir capacity of oil and gas zones is slightly increased (Figure 8). The higher absolute permeability of the core corresponds to the relatively lower residual oil saturation, the relatively lower bound water saturation, and the larger area of the two-phase co-seepage zone, and the difference in saturation between the co-seepage zones of the two types of samples is about 10.2% (Figure 9).
The residual gas saturation of the high-permeability rock sample changes from 10.0% to 10.9%, an increase of about 1 percentage point; the residual gas saturation of the low-permeability rock sample changes from 12.1% to 12.8%, an increase of about 0.7 percentage point. The residual oil saturation of the hypertonic rock sample changes from 16.8% to 15.8%, a decrease of about 1 percentage point; and the residual oil saturation of the low-permeability rock sample changes from 25.2% to 23.5%, a decrease of about 1.7 percentage points.

4.4. Multi-Rotation Drive-By Expansion Analysis

According to the reservoir capacity calculation formula derived from the material balance equation by Pan et al. [27] and the material balance model for gas reservoirs in condensate reservoirs established by Fan et al. [28], there is a material balance equation for condensate reservoir-type reservoirs:
N p B o + N p R p R s B g + W p B w = m 1 V gascap + N B o + R si R s B g B oi + V gascap 1 S wi ( C w S wi + C f ) Δ p + N B oi 1 S wi ( C w S wi + C f ) Δ p + W e + W i B w + G i B g
where N and Np are the original geological reserves of crude oil and cumulative oil production in place, 104 m3; Gp is the cumulative gas production at the surface, 104 m3; Gi is the cumulative manual gas injection, 104 m3; Bo, Bg, Bw, and Boi are the formation crude oil volume factor, the natural gas volume factor, the formation water volume factor, and the formation crude oil raw volume factor; Rp, Rs, and Rsi are the cumulative production gas/oil ratio, the dissolved gas/oil ratio, and the original dissolved gas/oil ratio of formation crude oil, m3/m3; Wp, We, and Wi are the cumulative water production, cumulative water intrusion, and cumulative water injection, 104 m3; m is the multiple of volumetric expansion of the hydrocarbon system as the condensate head gas decompresses from original formation conditions to pressure p; Vgascap is the top volume of underground condensate, 104 m3; Swi is the stratigraphic bound water saturation, %; Cw and Cf are the stratified water and the compression factor of stratified rock, MPa−1; and Δp is the soil pressure drop (Δp = pip), MPa.
According to the conservation of matter principle, the reservoir capacity Nk is the actual underground real storage volume, i.e., the underground volume of extracted oil and gas minus the volume of injected gas, the volume expansion of the gas roof, the volume expansion of bound water and rock in the gas roof area, the volume expansion of crude oil in the oil ring area, and the volume expansion of bound water and rock in the oil ring area. However, since the expansion rate of natural gas is much higher than the elastic expansion rate of reservoir rock and formation water in the process of multi-cycle injection and extraction in the reservoir, the influence of the elastic expansion of the latter two is ignored, so the formula for calculating the storage capacity of condensate reservoir can be obtained as
N k = G p B g + N p B o ( m 1 ) V gascap N B o + ( R si R s ) B g B oi / B g
At the same time, the capacity expansion rate is defined as the ratio of the volume expansion of the reservoir before and after the gas injection and production synergy to the original volume, which is used to describe the effect of the gas injection and production synergy:
η cer = Q t Q t i Q t i
where ηcer is the capacity expansion rate; Qti is the initial total capacity; and Qt is the current total capacity.
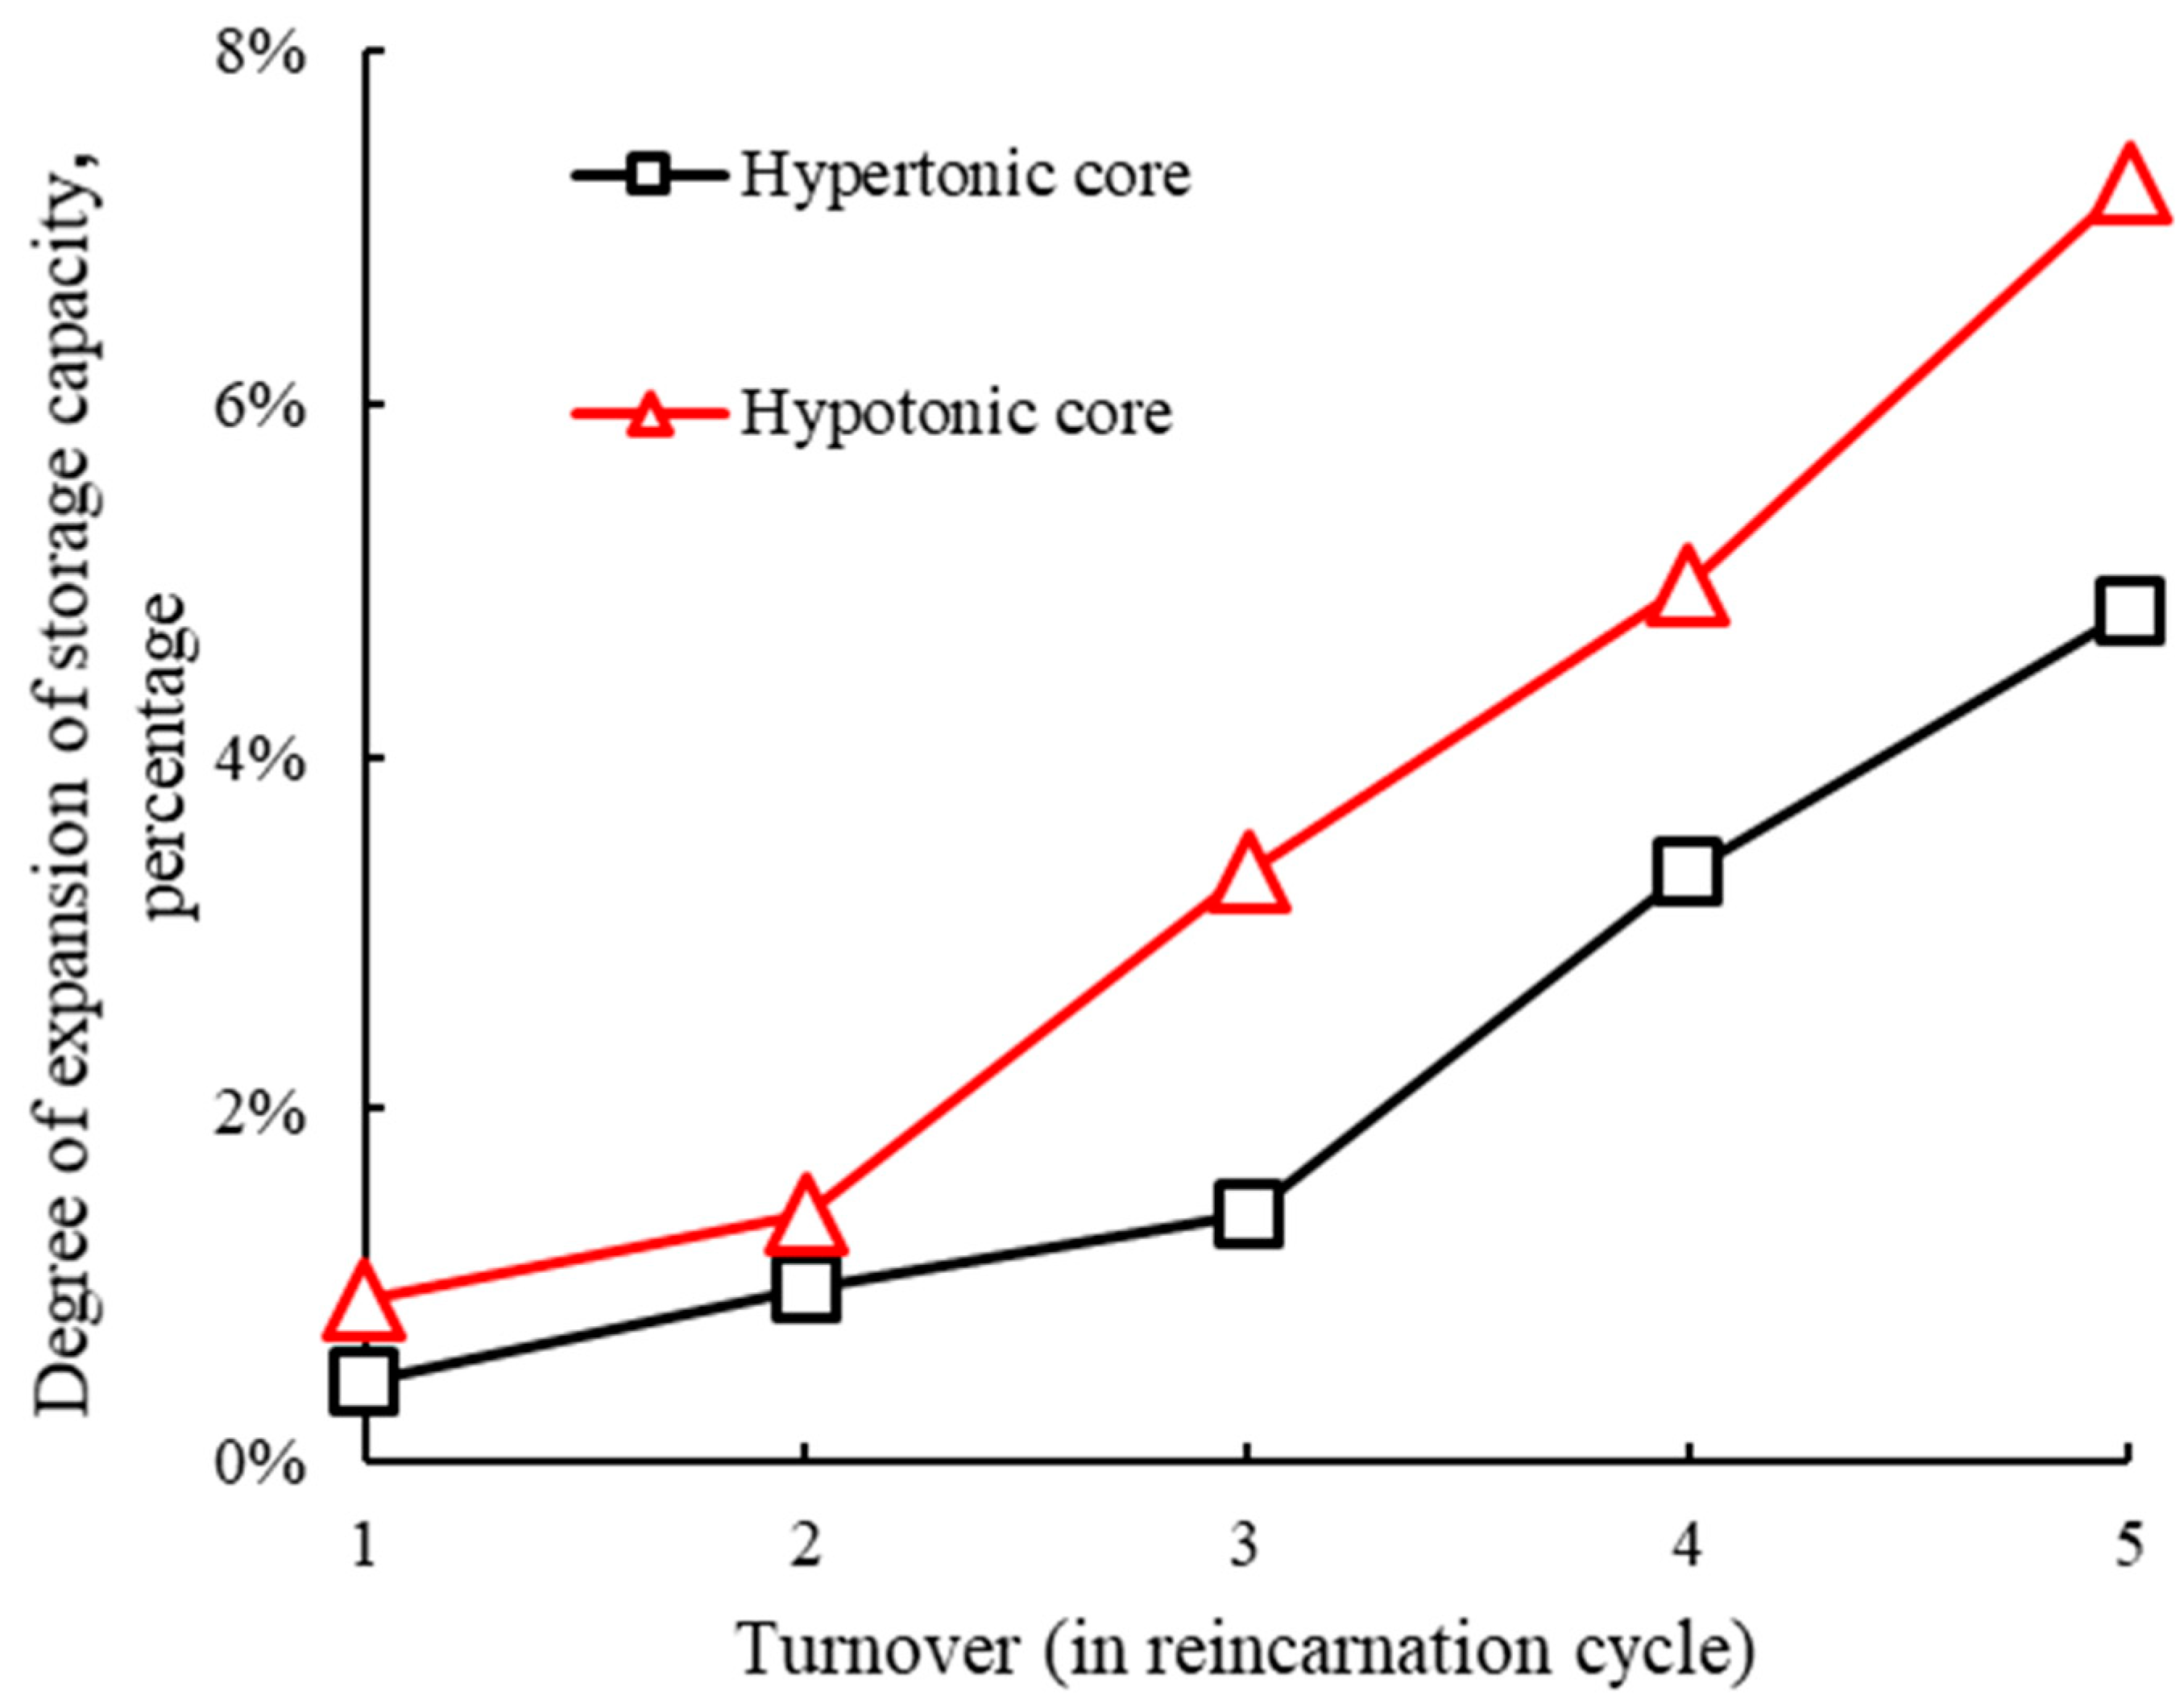
By incorporating the results of multiple rounds of replacement experiments in the previous paper, the expansion effect after each round of replacement can be calculated (Figure 10) based on Equation (9). After the last five rounds of replacement experiments, the total increase in the reservoir capacity of the high-permeability rock samples is about 4.84%, and the total increase in the reservoir capacity of the low-permeability rock samples is about 7.26%, which indicates that the expansion of the reservoir capacity can be achieved to a certain extent by multiple rounds of injection and replacement in the process of synergistic reservoir construction by gas injection and extraction in condensate reservoirs.
At the same time, the residual oil saturation of the high-permeability core is relatively lower, and the area of the two-phase co-permeability zone is larger, which is more suitable for reservoir construction; whereas the gas drive in the low-permeability core reduces the potential of residual oil saturation, and the potential for capacity expansion is relatively larger. In addition, the potential for capacity expansion in low-permeability reservoirs is greater; that is, low-permeability reservoirs are more likely to be contaminated by condensate and unable to form an effective reservoir and, through multiple rounds of dry gas injection, can be used through the anti-evaporation extraction and drying and pressure maintenance to drive the use of this difficult-to-use anti-concalcitonous oil, thus enabling expanding the reservoir capacity while condensate extraction at the same time. The experiments were carried out under laboratory conditions, but the initial formation temperature was 92 °C. Due to the temperature sensitivity of permeability in sandstone reservoirs, permeability decreases with increasing temperature and increases with decreasing temperature. Therefore, the expansion effect after multiple injections under actual formation conditions will be better than the experimental results for both low-permeability and high-permeability rock samples.

5. Numerical Simulation Studies

5.1. Numerical Modelling

In order to better analyse the effect of synergistic reservoir design for gas injection and extraction in condensate reservoirs, and the effect of the counter-evaporation and extraction of condensate during multiple rounds of displacement [29], a numerical model (Figure 11) was created using the tNavigator reservoir simulation software according to the geological parameters of the study area, i.e., the fluid parameters, which contain 65 × 181 × 65 grids in the I, J, and K directions. At the same time, combined with the results of the phase infiltration experiments in the previous section, the high-pressure physical properties of the fluid were fitted in the PVTi module of Eclipse, and the corresponding keywords were output and imported into the tNavigator numerical simulator to establish a time-varying fluid model of phase infiltration, so as to simulate the dilatation effect of the multiple rounds of expulsion.

5.2. History Matching

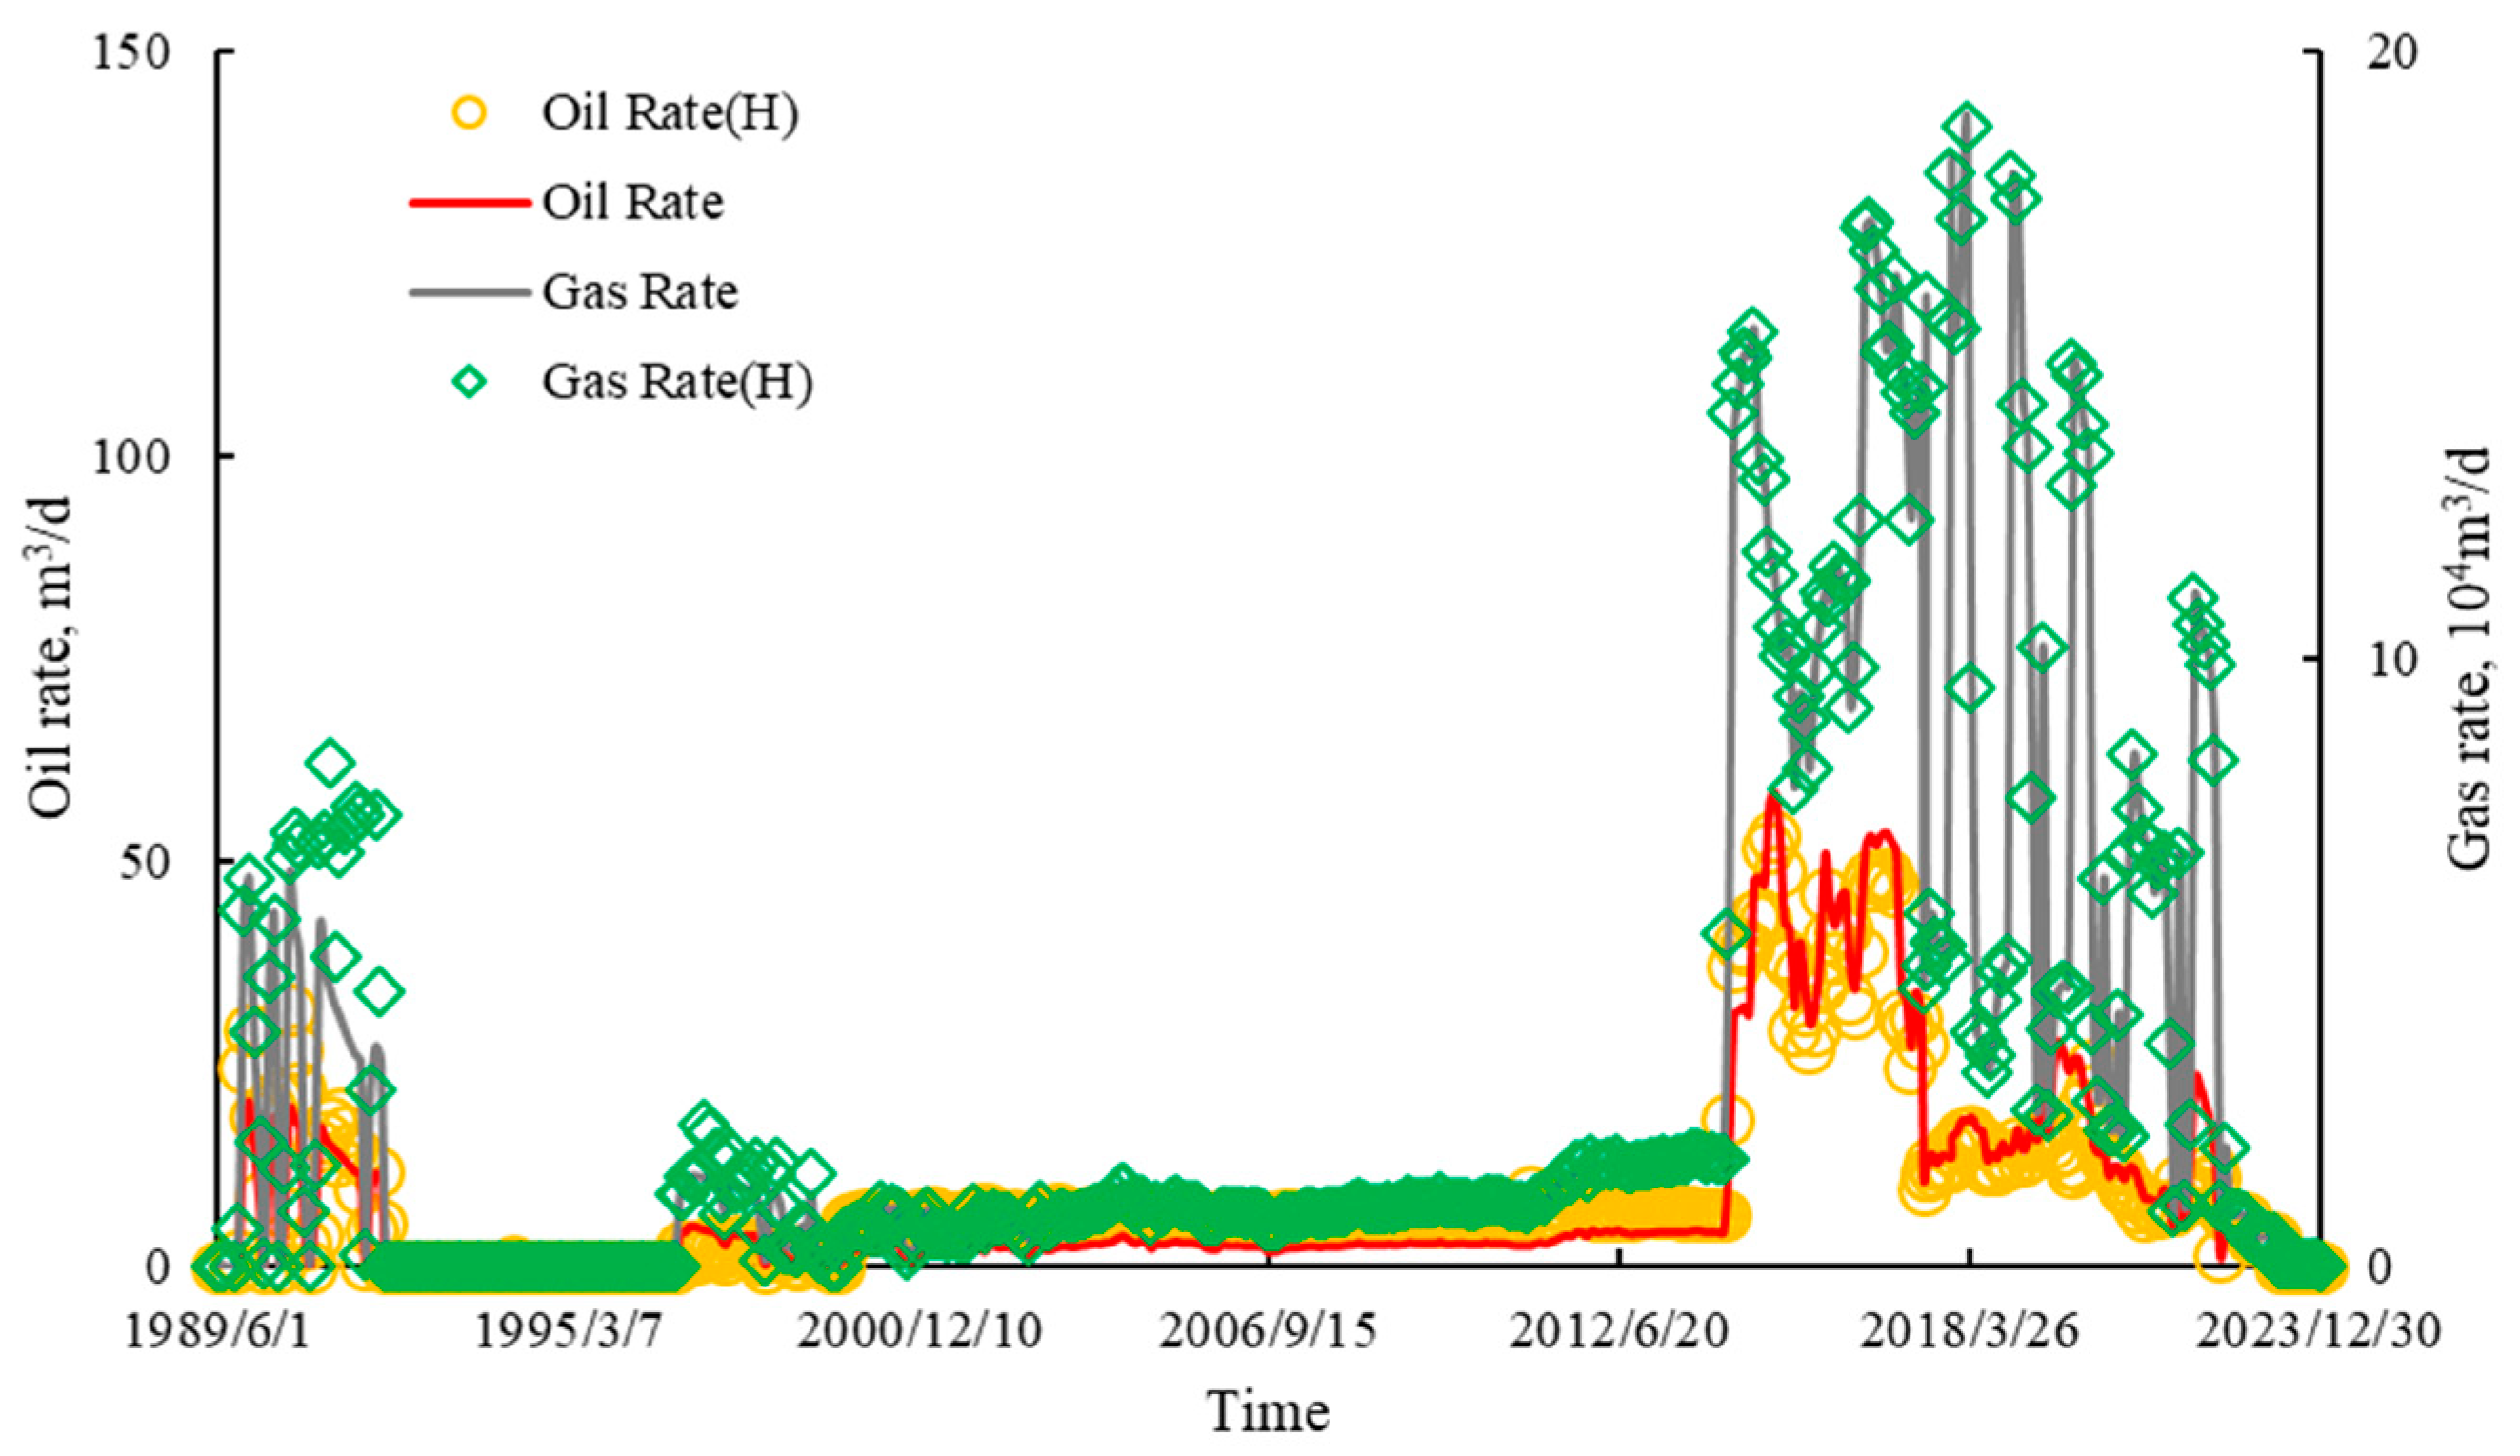
The study area has been produced by the development of decay since 1984, with a total of five production wells and a cumulative total of 0.72 billion cubic metres of gas injected, 315 million cubic metres of gas produced, and 110,500 tonnes of oil produced, with a geological reserve recovery of 48.8% for gas and 15.3% for oil. A historical fit was performed using historical production data (Figure 12), and the key fit indicators are shown below, with an overall fit of more than 95%. Currently, the old wells have been plugged to complete the reservoir construction, and new horizontal wells will be added during the subsequent reservoir construction to increase the injection and withdrawal capacity of the reservoir and to achieve the planned working gas volume and peak shifting capacity.

5.3. Programme Simulation

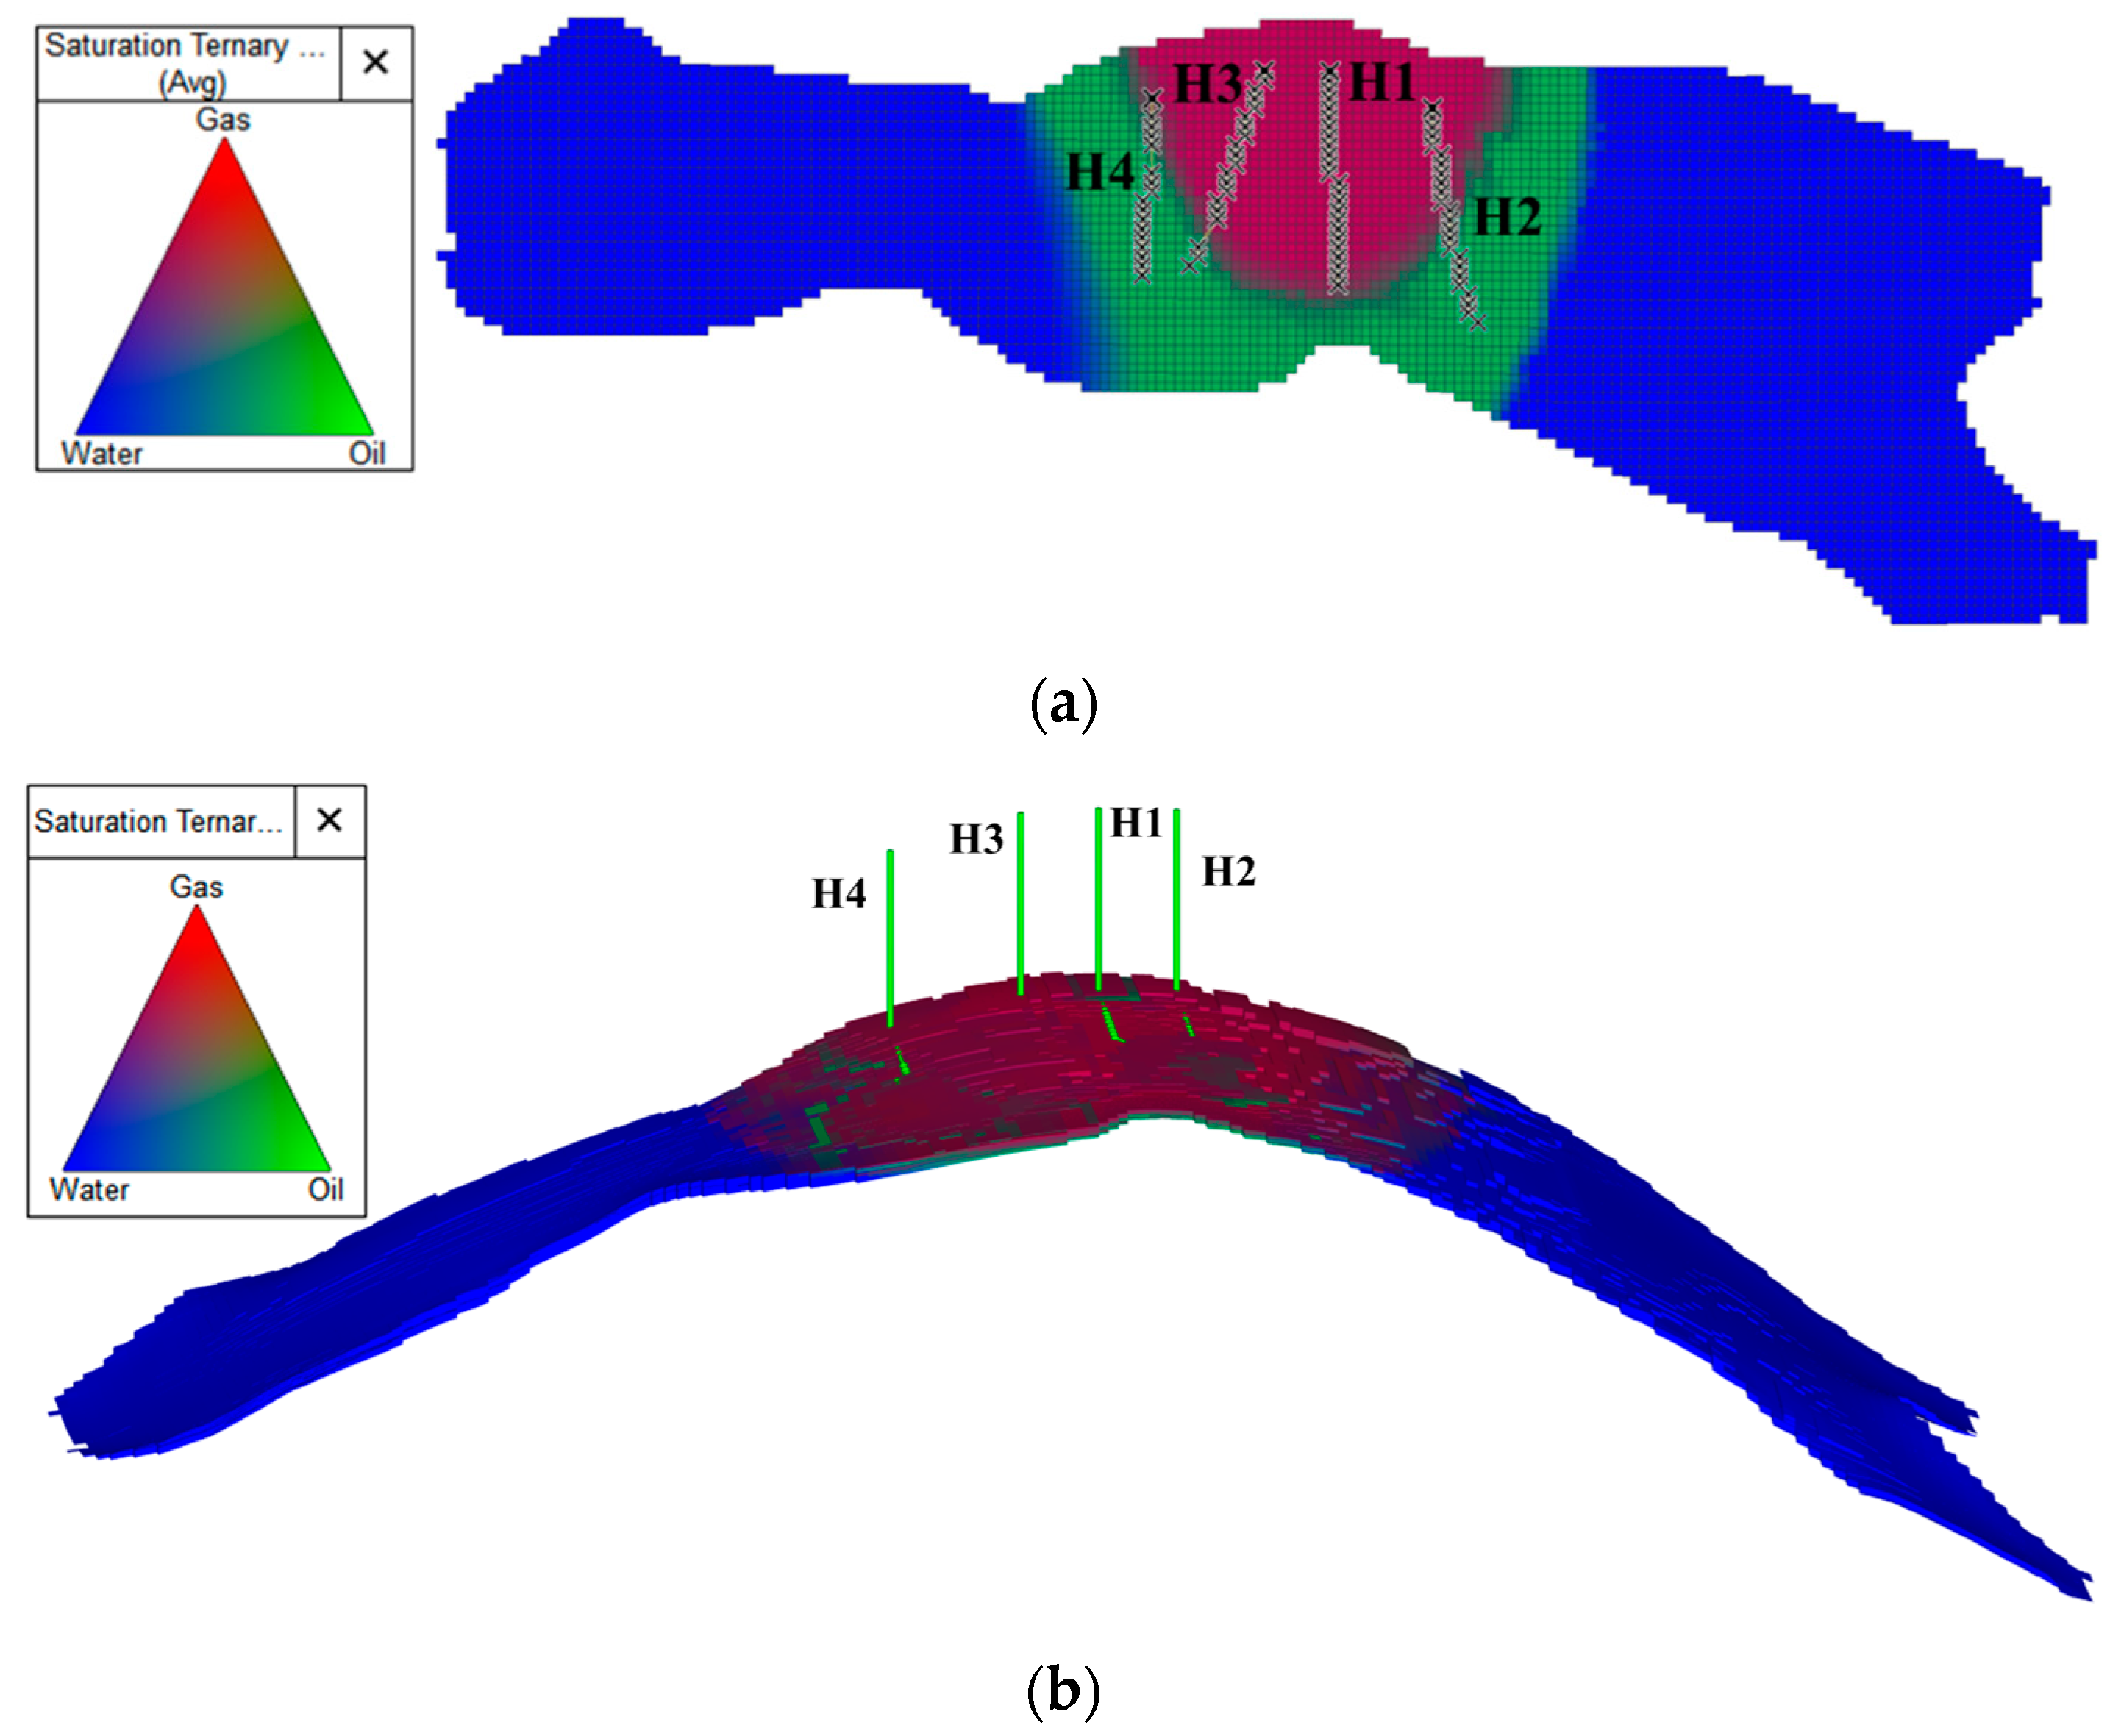
According to the well settings in the reservoir planning scheme, four horizontal wells, H1, H2, H3, and H4, are used as reservoir injection and withdrawal wells (Figure 13), and a synergistic cyclic injection and withdrawal expansion scheme was designed to simulate production for 5 years. As shown in the figure, all four injection wells are located in the gas top zone, and all four wells are injected equally to simulate reservoir operation and demonstrate the feasibility and effectiveness of increasing capacity by the counter-evaporation and pumping effect on the current oil ring through multi-cycle injection. H1, H2, H3, and H4 are all set to 40/80 × 104 m3/d for gas injection/extraction, the average daily gas injection/production is set to 160/320 × 104 m3/d, the design working gas volume is 3.0 × 10⁸ m3, and the design reservoir capacity is 5.7 × 10⁸ m3.

5.4. Analysis of the Results

Through the cycle of gas injection at the top, the increase in the number of injections and extractions can obviously improve the condensate recovery rate and expand the reservoir capacity through anti-evaporation and extraction; and the increase in the daily injection volume can significantly drive the crude oil to the side of water, and at the same time, by anti-evaporation and extraction to expand the space of injection and extraction and improve the degree of condensate recovery rate.
According to the construction and operation experience of gas storage reservoirs, and considering the construction risk, the effective reservoir capacity is determined separately in different regions [30]:
(1)
The entire area of the pure gas zone can be used as storage capacity;
(2)
Considering the risk of water intrusion on the construction of gas storage facilities, the current utilisation rate of movable storage capacity in the waveable area below the gas–water interface is about 50 percent.
Therefore, the total effective storage capacity is equal to the sum of the current effective storage capacity above the gas–water interface and the current effective storage capacity in the waveable area below the gas–water interface, i.e.:
Q total = Q p + Q f = V e a + V e d = ( V a + V c a × 50 % ) B gi
where Qtotal is the total capacity; Qp is the current storage capacity in pure gas area; Qf is the current storage capacity in the following pure gas zones; Vea is the current effective volume above the air–water interface; Ved is the effective injection volume after downward displacement of the gas–water interface with the injection and extraction process; Va is the volume of flow across the air–water interface; and Vca is the volume change after the downward shift of the gas–water interface during the injection and extraction process.
Using Equation (3) for calculation, the original reservoir capacity is 5.7 × 10⁸ m3, and the reservoir capacity of the scheme at the end of the simulation period reaches 6.1 × 10⁸ m3. Calculated from Equation (3), the capacity expansion rate is 7.02%, which is close to the experimental results above, indicating that through multiple rounds of injection and extraction, it is indeed possible to effectively expand the space of injection and extraction through the role of counter-evaporation and extraction to improve the degree of condensate extraction and expand the reservoir capacity.

6. Conclusions

In this paper, for the condensate reservoir-type gas storage, we carried out the research by combining numerical simulation and experimentation. By designing multi-round replacement experiments, we investigated the oil and gas two-phase seepage characteristics in the process of gas injection and extraction synergistic reservoir construction, and combined with numerical simulation studies, we clarified the principle, effect, and feasibility of multi-round replacement expansion. The specific conclusions are as follows:
(1)
After several rounds of oil–water mutual drive, the residual oil saturation of both high-permeability rock samples and low-permeability rock samples showed a decreasing trend; meanwhile, the bound water saturation increased, and the oil–water two-phase zone did not change much, but the higher the absolute permeability of the core, the wider the two-phase co-permeability zone. After several rounds of oil and gas mutual drive, the residual oil saturation of the high-permeability rock samples and low-permeability rock samples showed a decreasing trend, while the residual gas saturation increased but with a small amplitude. The oil and gas two-phase zone did not change much, but the overall trend shows a small increase; the higher the absolute permeability of the core, the wider the range of the two-phase co-seepage zone.
(2)
After multiple rounds of replacement, the oil-phase flow capacity can be effectively improved and the injection and recovery capacity can be enhanced, thereby increasing the condensate recovery rate and increasing the reservoir capacity. The reservoir capacity of the high-permeability rock samples increased by approximately 4.84%, and the reservoir capacity of the low-permeability rock samples increased by approximately 7.26%.
(3)
By numerically modelling the reservoir operation scheme, the reservoir capacity at the end of the simulation period reached 6.1 × 10⁸ m3, and the reservoir capacity was enlarged by 7.02%, which is close to the experimental results, indicating that condensate extraction can indeed be effectively improved and the reservoir capacity enlarged by multiple rounds of injection.
The research results in this paper provide a reference for the subsequent operations in the study area and the research of similar blocks. At the same time, the research in this paper only carried out experimental and numerical simulation on the cooperative reservoir construction for gas injection and extraction, and future research could include experimental and numerical simulation studies on the synergistic operation of drainage and capacity expansion.

Author Contributions

Data curation, simulation modelling, and writing—original draft preparation, J.G.; project administration and data curation, H.Z.; project administration and funding acquisition, P.Y.; experiment and writing—review and editing, S.Q.; data curation and simulation modelling, M.W.; data curation and supervision, B.C. All authors have read and agreed to the published version of the manuscript.

Funding

This research was funded by the Major R & D Plan of Sichuan Province [No. 20QYCX0028].

Data Availability Statement

The original contributions presented in the study are included in the article, further inquiries can be directed to the corresponding author.

Conflicts of Interest

Hu Zhang, Mutong Wang and Baoxin Chen were employed by the PetroChina Tarim Oilfield Company. Simin Qu was employed by the PetroChina Southwest Oil & Gas Field Company. The remaining authors declare that the research was conducted in the absence of any commercial or financial relationships that could be construed as a potential conflict of interest.

References

  1. Lawal, K.A.; Ovuru, M.I.; Eyitayo, S.I.; Matemilola, S.; Adeniyi, A.T. Underground Storage as a Solution for Stranded Associated Gas in Oil Fields. J. Pet. Sci. Eng. 2017, 150, 366–375. [Google Scholar] [CrossRef]
  2. Hassan, A.; Abdalla, M.; Mahmoud, M.; Glatz, G.; Al-Majed, A.; Al-Nakhli, A. Condensate-Banking Removal and Gas-Production Enhancement Using Thermochemical Injection: A Field-Scale Simulation. Processes 2020, 8, 727. [Google Scholar] [CrossRef]
  3. He, X.; Huang, S.; Sun, C.; Xu, J.; Zhang, X.; Yang, X. Gas-water Relative Permeability Variation in Multi-cycle Injection/production of Underground Gas Storage in Flooded Depleted Gas Reservoir. Oil Gas Storage Transp. 2015, 34, 150–153. [Google Scholar]
  4. Du, S.; Bai, M.; Shi, Y.; Zha, Y.; Yan, D. A Review of the Utilization of CO2 as a Cushion Gas in Underground Natural Gas Storage. Processes 2024, 12, 1489. [Google Scholar] [CrossRef]
  5. Gao, G.; Liu, W.; Zhu, S.; He, H.; Wang, Q.; Sun, Y.; Xiao, Q.; Yang, S. Discussion on the Reconstruction of Medium/Low-Permeability Gas Reservoirs Based on Seepage Characteristics. Processes 2022, 10, 756. [Google Scholar] [CrossRef]
  6. Ma, X.; Zhao, P. Practical Techniques for Underground Gas Storage Design; Petroleum Industry Press: Beijing, China, 2009. [Google Scholar]
  7. Shen, R.; Tian, L.; Yuan, G.; Wang, T. Research and Practice of Underground Gas (Oil) Storage Engineering Technology; Petroleum Industry Press: Beijing, China, 2009. [Google Scholar]
  8. Huaxia Industrial Economy Research Institute. China Underground Gas Storage Industry Market Development Status and Investment Planning Recommendation Report, 2023–2029; Huaxia Industrial Economy Research Institute: Beijing, China, 2023. [Google Scholar]
  9. Yan, Z.; Wang, Z.; Wu, F.; Lyu, C. Stability Analysis of Pingdingshan Pear-Shaped Multi-Mudstone Interbedded Salt Cavern Gas Storage. J. Energy Storage 2022, 56, 105963. [Google Scholar] [CrossRef]
  10. Ma, X.; Zhen, D.; Shen, R.; Wang, C.; Luo, J.; Sun, J. Key Technologies and Practice for Gas Field Storage Facility Construction of Complex Geological Conditions in China. Pet. Explor. Dev. 2018, 45, 489–499. [Google Scholar] [CrossRef]
  11. Zhao, L.; Zhang, Y.; He, Y.; Shi, J.; Wang, X.; Song, J.; Yu, H. Consistency Checks for Pressure-Volume-Temperature Experiment of Formation Oil and Gas at High Temperature. Processes 2023, 11, 2727. [Google Scholar] [CrossRef]
  12. Jiao, G.; Zhu, S.; Xie, F.; Yang, S.; Xiang, Z.; Xu, J. Study of the Characterisation Method of Effective Two-Phase Seepage Flow in the Construction of Gas Storage Reservoirs. Energies 2022, 16, 242. [Google Scholar] [CrossRef]
  13. Barrufet, M.A.; Bacquet, A.; Falcone, G. Analysis of the Storage Capacity for CO2 Sequestration of a Depleted Gas Condensate Reservoir and a Saline Aquifer. J. Can. Pet. Technol 2010, 49, 23–31. [Google Scholar] [CrossRef]
  14. Brannon, A.W. Prediction of The Effects of Compositional Mixing in a Reservoir on Conversion to Natural Gas Storage. Ph.D. Thesis, West Virginia University, Morgantown, WV, USA, 2011. [Google Scholar]
  15. Rouhbakhsh Arfaee, M.I.; Sedaee Sola, B. Investigating the Effect of Fracture–Matrix Interaction in Underground Gas Storage Process at Condensate Naturally Fractured Reservoirs. J. Nat. Gas Sci. Eng. 2014, 19, 161–174. [Google Scholar] [CrossRef]
  16. Deng, P.; Chen, Z.; Peng, X.; Wang, J.; Zhu, S.; Ma, H.; Wu, Z. Optimized Lower Pressure Limit for Condensate Underground Gas Storage Using a Dynamic Pseudo-Component Model. Energy 2023, 285, 129505. [Google Scholar] [CrossRef]
  17. Wang, J.; Shi, L.; Zhang, Y.; Zhang, K.; Li, C.; Chen, X.; Sun, J.; Qiu, X. Simulation of Petroleum Phase Behavior in Injection and Production Process of Underground Gas Storage in a Gas Reservoir. Pet. Explor. Dev. 2022, 49, 1386–1397. [Google Scholar] [CrossRef]
  18. Long, K.; Tang, Y.; He, Y.; Luo, Y.; Hong, Y.; Sun, Y.; Rui, Z. Full-Cycle Enhancing Condensate Recovery-Underground Gas Storage by Integrating Cyclic Gas Flooding and Storage from Gas Condensate Reservoirs. Energy 2024, 293, 130724. [Google Scholar] [CrossRef]
  19. Song, R.; Wang, S.; Pei, G.; Liu, J. Study on Multi-cycle Gas-water Displacing Mechanism in Underground Gas Storage of Low-permeability Reservoir Based on PNM. Energy Storage 2024, 6, e643. [Google Scholar] [CrossRef]
  20. Jiang, T.; Wang, J.; Wang, Z.; Zhou, D. Practice and Understanding of Collaborative Construction of Underground Gas Storage and Natural Gas Flooding. Nat. Gas Ind. 2021, 41, 66–74. [Google Scholar]
  21. Yang, J.; Luo, M.; Peng, H.; Sun, C.; Yang, L.; Wang, H. Economic Evaluation on Collaborative Constructing Gas Injection EOR and Strategic Gas Storage: Examples from an Oil Reservoirs, Tarim Oilfield: An Example from an Oil Reservoirs in Tarim Oilfield. Nat. Gas Technol. Econ. 2020, 14, 72–78. [Google Scholar]
  22. Mi, L.; Zeng, D.; Liu, H.; Guo, Y.; Zhang, G.; Chen, M.; Zhang, J. Parameter Design for Collaborative Gas Storage Construction of Gas Injection and Production in Gas Condensate Reservoirs with Oil Rings. In Proceedings of the 2nd Annual China Natural Gas Development Technology Conference, Qingdao, China, September 2023; p. 1. [Google Scholar]
  23. He, X.; Huang, Z.; Lian, N.; Chen, R.; Fu, Y.; Zhou, W. Key Technologies for Enhancing the Recovery of Condensate Gas Reservoirs by Gas Injection-Storage Coordination. Nat. Gas Ind. 2023, 43, 86–95. [Google Scholar]
  24. Liu, H.; Xie, B.; Xin, X.; Zhao, H.; Liu, Y. Investigation on the Extent of Retrograde Condensation of Qianshao Gas Condensate Reservoir Using PVT Experiments and Compositional Reservoir Simulation. Processes 2024, 12, 503. [Google Scholar] [CrossRef]
  25. Johnson, E.F.; Bossler, D.P.; Bossler, V.O.N. Calculation of Relative Permeability from Displacement Experiments. Trans. AIME 1959, 216, 370–372. [Google Scholar] [CrossRef]
  26. Jones, S.C.; Roszelle, W.O. Graphical Techniques for Determining Relative Permeability from Displacement Experiments. J. Pet. Technol. 1978, 30, 807–817. [Google Scholar] [CrossRef]
  27. Pan, H.; Liu, F.; Liu, C.; Pan, W. Gas Injection Flooding for EOR and Its Impacts on The Proposed Underground Gas Storage Capacity: A Case Study from the Xinggu 7 Buried Hill Oil Reservoir in The Western Liaohe Depression. Nat. Gas Ind. 2014, 34, 93–97. [Google Scholar]
  28. Fan, J.; Wu, Z.; Yu, S.; Zhou, D.; Yan, G.; Qang, C. Factors Influencing Effective Storage Capacity of Abnormally-High-Pressure Water-Containing Condensate Gas Reservoirs. Xinjiang Pet. Geol. 2022, 43, 463–467. [Google Scholar]
  29. Tananykhin, D.S.; Struchkov, I.A.; Khormali, A.; Roschin, P.V. Investigation of the Influences of Asphaltene Deposition on Oilfield Development Using Reservoir Simulation. Pet. Explor. Dev. 2022, 49, 1138–1149. [Google Scholar] [CrossRef]
  30. Zhang, Z. Study on Seepage Mechanism and Application in Gas Condensate Reservoir Reconstruction and Storage; Southwest Petroleum University: Nanchong, China, 2018. [Google Scholar]
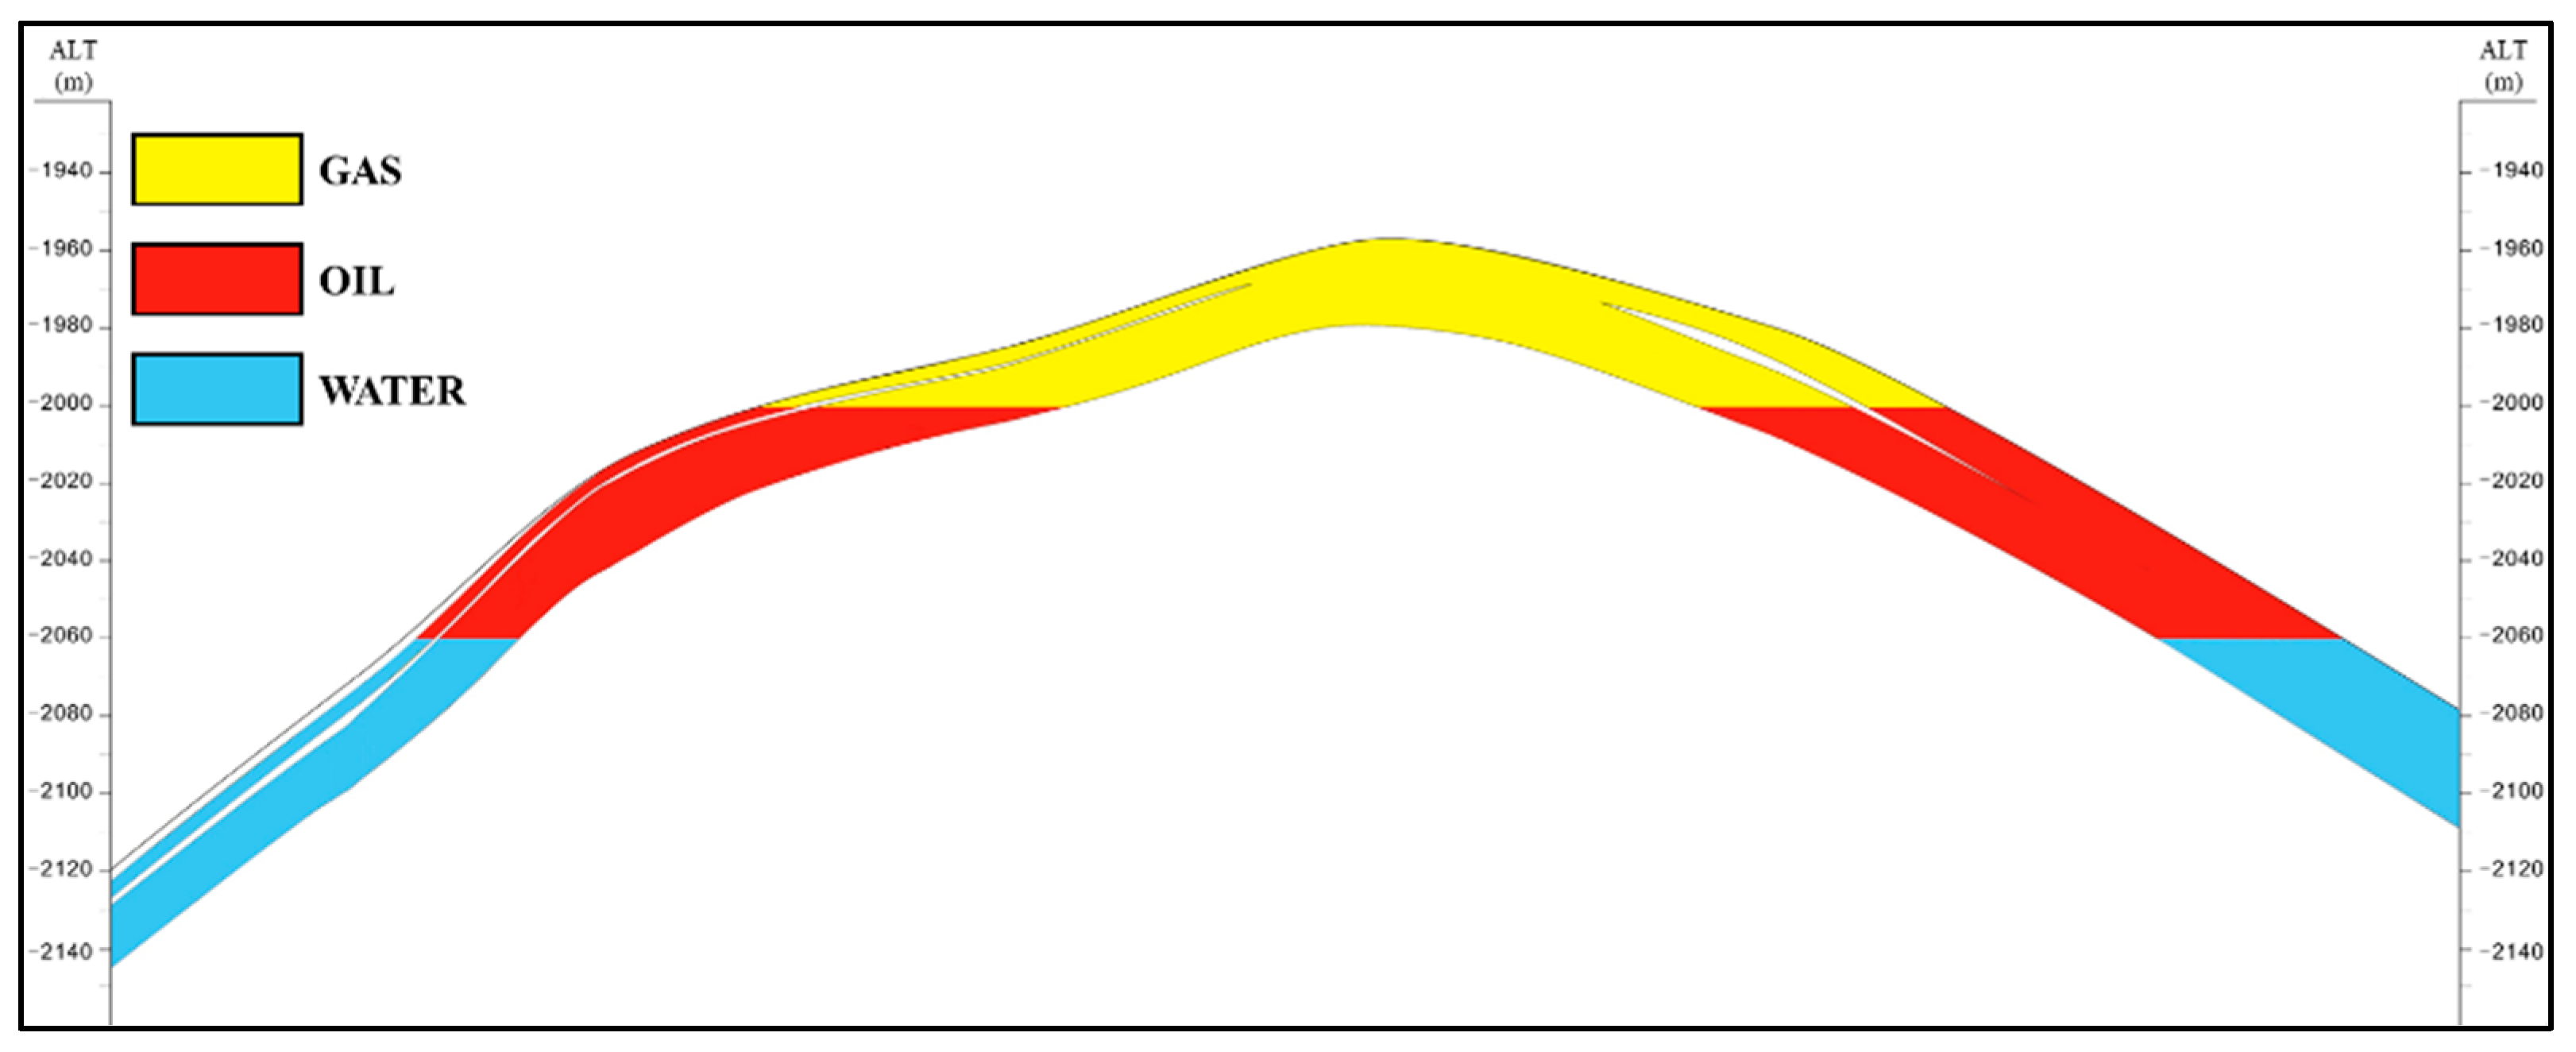
Figure 1. Profile of sand bodies in the study area.
Processes 12 02668 g001
Figure 2. Schematic representation of the synergistic reservoir design principle for gas injection and production in condensate. (a) Starting; (b) pre-existing condition; (c) post-expansion.
Processes 12 02668 g002
Figure 3. Diagram of the experimental set up for multiple rounds of exclosures. (1) Gas source; (2) Oil source; (3) Water source; (4) Pressure booster; (5) Pressure regulator; (6) Multi-channel valve; (7) Core gripper; (8) Return valve; (9) Hand pump; (10) Value recorder; (11) Pressure sensor; (12) Water metering tube; (13) Gas metering tube; (14) Oil metering tube; (15) Balance bottle.
Processes 12 02668 g003
Figure 4. Multi-round (5 rounds out of 10) non-stationary phase infiltration of oil and water drive. (a) Relatively hypertonic samples; (b) Relatively hypotonic samples.
Processes 12 02668 g004
Figure 5. Variation of residual oil/binding water saturation for multiple rounds of oil–water displacement in hypertonic/hypertonic rock samples.
Processes 12 02668 g005
Figure 6. Variation of two-phase zones for multiple rounds of oil–water displacement in hypertonic/hypertonic rock samples.
Processes 12 02668 g006
Figure 7. Multi-round (5 rounds of 10) unsteady phase infiltration for oil and gas displacement. (a) Relatively hypertonic samples; (b) Relatively hypotonic samples.
Processes 12 02668 g007
Figure 8. Variation of residual gas/residual oil saturation for multiple rounds of oil/gas displacement in hypertonic/hypertonic rock samples.
Processes 12 02668 g008
Figure 9. Variation of two-phase zones for multiple rounds of hydrocarbon drive-off in hypertonic/hypertonic rock samples.
Processes 12 02668 g009
Figure 10. Expansion volume of hypertonic/hypertonic rock samples after each round of exfoliation.
Processes 12 02668 g010
Figure 11. Numerical modelling diagram of the study area. (a) Porosity; (b) permeability; (c) three saturations.
Processes 12 02668 g011aProcesses 12 02668 g011b
Figure 12. Historical matching chart.
Processes 12 02668 g012
Figure 13. Well deployment map. (a) Plane figure; (b) three-dimensional figure.
Processes 12 02668 g013
Table 1. Physical property test results from core samples.
Core
Number
Lengths
(cm)
Calibre
(cm)
Appearance
Volume (cc)
Densities
(g/cm3)
Porosity
(%)
Permeability (mD)
17.5472.42534.8392.23413.1645.27
25.3562.42124.6432.23115.2560.64
35.7842.42726.7452.19315.9788.75
47.4572.41934.2542.23714.3278.34
56.1192.42928.3402.23914.4862.29
Table 2. Composition of condensate well streams.
CompositionMole Fraction/%CompositionMole Fraction/%
CO2/nC50.354
N22.743C60.253
C184.254C70.180
C26.880C80.241
C32.094C90.219
iC40.365C100.156
nC40.813C11+0.314
iC51.134
Table 3. Condensate well stream composition.
CompositionMole Fraction/%CompositionMole Fraction/%
CO20.98nC52.9
N20.18C66.83
C143.73C75.49
C23.06C85.81
C31.35C94.77
iC40.38C103.79
nC40.93C11+18.36
iC51.44
Table 4. Statistical table of chemical properties of formation water.
Relative Density (mg/L)CationicAnionicTDSWater-Based
K+, Na+Ca2+Mg2+ClSO42−HCO3
1.097548,4578545126492,93368093139,567CaCl2
Disclaimer/Publisher’s Note: The statements, opinions and data contained in all publications are solely those of the individual author(s) and contributor(s) and not of MDPI and/or the editor(s). MDPI and/or the editor(s) disclaim responsibility for any injury to people or property resulting from any ideas, methods, instructions or products referred to in the content.