Article

Rapid and Non-Destructive Determination of Fatty Acid Profile and Oil Content in Diverse Brassica carinata Germplasm Using Fourier-Transform Near-Infrared Spectroscopy

by
Misteru Tesfaye
1,2,*,
Tileye Feyissa
2,
Teklehaimanot Hailesilassie
2,
Eu Sheng Wang
1,
Selvaraju Kanagarajan
1 and
Li-Hua Zhu
1
1
Department of Plant Breeding, Swedish University of Agricultural Sciences, P.O. Box 109, 234 22 Lomma, Sweden
2
Institute of Biotechnology, Addis Ababa University, Addis Ababa P.O. Box 1176, Ethiopia
*
Author to whom correspondence should be addressed.
Processes 2024, 12(2), 244; https://doi.org/10.3390/pr12020244
Submission received: 19 December 2023 / Revised: 12 January 2024 / Accepted: 18 January 2024 / Published: 24 January 2024

Abstract

:
Brassica carinata is one of the oilseeds in the Brassicaceae family, possessing seed quality traits such as oil with various fatty acid profiles suitable for many industrial applications. Determination of such quality traits using conventional methods is often expensive, time-consuming, and destructive. In contrast, the Near-Infrared Spectroscopic (NIRS) technique has been proven fast, cost-effective, and non-destructive for the determination of seed compositions. This study aimed to demonstrate that NIRS is a rapid and non-destructive method for determining the fatty acid profile and oil content in diverse germplasms of B. carinata. A total of 96 genetically diverse B. carinata germplasms that include accessions, advanced breeding lines, and varieties were used in this study. Reference data sets were generated using gas chromatography and the Soxhlet oil extraction method for fatty acid profile and oil content, respectively. Spectra data were taken from the wavenumber range of 11,500 to 4000 cm−1 using the Fourier-transform near-infrared (FT-NIR) method. NIRS calibration equations were developed using partial least square (PLS) regression with OPUS software, version 7.5.1. Higher coefficient of determination (R2val) and ratio of performance to deviation (RPD) > 3 were obtained for oleic acid (R2val = 0.92, RPD = 3.6), linoleic acid (R2val = 0.89, RPD = 3.2), linolenic acid (R2val = 0.93, RPD = 3.8), erucic acid (R2val = 0.92, RPD = 3.5), and oil content (R2val = 0.93, RPD = 3.6). Thus, the NIRS calibration models for the aforementioned fatty acids and oil content were found to be strong enough for prediction. However, the calibration models for palmitic acid (R2val = 0.78, RPD = 2.1) and stearic acid (R2val = 0.75, RPD = 2.0) showed relatively smaller R2val and thus became weaker in their prediction capacity. Despite their relatively lower R2, the calibration equations for palmitic and stearic acids could be used for approximate estimation and rough screening purposes. In conclusion, the calibration models that we have developed will be useful in applying NIRS as a high-throughput, non-destructive method for the screening of large germplasms in terms of their fatty acid profiles and oil content during the oil quality breeding efforts conducted on B. carinata.

1. Introduction

Brassica carinata (carinata), also called Ethiopian mustard or Abyssinian mustard, is an agriculturally important oilseed species of the genus Brassica that evolved through natural hybridization between the diploid species B. nigra (BB, 2n = 16) and B. oleracea (CC, 2n = 18). Currently, the crop is considered as an emerging oilseed crop dedicated to the production of specialty oil for industrial use [1]. The high levels of very-long-chain fatty acids (VLCFA), especially erucic acid (C22:1) and its derivatives, make carinata suited to industrial applications such as biofuel, lubricants, cosmetics, and other oleochemical industries [2,3,4].
There are several types of fatty acids found in vegetable oil, which vary in the number of carbon atoms, the position of double bonds in the carbon chain, and functional groups. The five major fatty acids that usually draw the attention of oilseed breeders are palmitic (C16:0), stearic (C18:0), linoleic (C18:2), linolenic (C18:3), and erucic (C22:1). Studies on the extent and distribution of fatty acids, including the oil content, have long been the major traits targeted by oilseed breeders [5]. Breeding for oil quality improvement in oilseed brassica, including carinata, is usually determined based on the end use of the oil, either for food or non-food applications. In rapeseed, for example, the first research effort on the development of canola for edible oil was realized by reducing its erucic acid content from 40% to zero, as a higher erucic acid content is assumed to be harmful to human health [6]. Similar attempts were also made for carinata but with much less effort and progress than rapeseed. As a result, the development of a canola-like carinata remains the research agenda of oilseed breeders [7,8]. Nevertheless, several studies have been conducted on the development of carinata with high erucic acid for non-food industrial applications [9,10,11].
When applying different conventional breeding approaches for quality improvement in crops, breeders usually need to conduct screening of better individuals from large populations. In order to speed up the breeding process and reduce analytical costs, a screening procedure for analyzing important seed components should be fast, cheap, and reliable. Standard or conventional methods such as gas chromatography and Soxhlet extraction are usually used for determining the fatty acid profile and total oil content, as well as other seed components. Such methods, however, are time-consuming, expensive, seed-destructive, and require chemicals, which could be hazardous to human health [12]. The evolving spectroscopic techniques, such as near-infrared spectroscopy (NIRS) [13], along with powerful chemometric applications, offer more efficient methods for screening breeding materials from large populations. Near-infrared spectroscopy (NIRS) has been one of the novel phenotyping methods used in plant breeding in recent years. It allows an estimation of the contents of total seed oil, fatty acids, and other seed components using the spectra information in the NIR region around 800–2500 nm wavelengths along with chemical characteristics [14]. NIRS is advantageous compared to conventional or standard procedures since it provides fast analysis results at a low cost for a large number of samples without destruction of the seed samples and can analyze several parameters simultaneously [12,15].
The use of NIRS for fatty acid analysis in oilseed brassicas started with the determination of erucic acid content from intact seeds of rapeseeds [16]. Since then, similar studies have been conducted on the determination of fatty acids and other seed quality parameters [5,17,18]. NIRS calibration for the fatty acid profile and oil content of carinata has been reported by different authors [19,20,21]. Nevertheless, the previous studies did not include wider genetic sources such as landraces, and rather focused on advanced lines or mutants [21], and a limited number of carinata genotypes were included in those studies [20]. In our study, however, we used diverse carinata germplasms sourced from three groups of genetic materials, namely, accessions, advanced breeding lines, and varieties. The accessions used in the current study were core collections of specific locations that were systematically identified from the major carinata-growing regions in Ethiopia in order to capture the maximum genetic variability. It is well known that accessions harbor many useful traits such as seed quality traits, agronomic traits, and disease resistance, since they include traditional varieties (landraces), which are the major reservoir of genetic variability [22]. The second source of the germplasms used in this study was advanced breeding lines, which were developed through crossing and recurrent selection. Such lines have been bred for various agronomic and quality traits from which candidate carinata varieties can be developed for future cultivation. The third group of germplasms were cultivated varieties of carinata, namely, Yellow Doddolla, Derash, Tesfa, and Holetta-1. These varieties, except Holetta-1, are yellow-seeded with high oil content. Since 1986, Yello doddolla has been a widely cultivated variety compared to Derash and Tesfa due to its adaptability [23].
Chemical analysis of seed for major quality parameters is a very important task in screening breeding materials of oilseed crops. The screening of carinata genotypes for seed quality traits, such as seed oil quality and quantity, from a large number of germplasms using conventional chemical analysis methods is often time-consuming and resource-demanding. For instance, determination of fatty acid profile and oil content using the conventional gas chromatography (GC) method requires a number of steps to be followed, such as sample homogenization, oil extraction, methylation, and GC analysis. This often leads to a high cost that is unaffordable for small breeding companies. Moreover, the use of certain chemicals would also increase the health risks to workers. On the other hand, the use of NIRS for the determination of fatty acid profile and other important seed components would facilitate the screening of a large number of carinata genotypes for desired quality parameters with non-destructive and very limited sample preparation and at low cost. Such analysis, however, first requires the development of a spectroscopy calibration model by combining laboratory data and spectra data.
The objective of this study was to develop an NIRS calibration model for the rapid and non-destructive determination of fatty acids and oil content in diverse genetic germplasms of B. carinata. For this purpose, we used Fourier-transform near-infrared (FT-NIR) spectroscopy for spectra data acquisition with the range of 11,500 to 4000 cm−1. The FT-NIRS device, in combination with its chemometric software package (OPUS version 7.5.1), was used for calibration using partial least square regression (PLS) analysis. The calibration model will facilitate the screening of a large number of samples based on their fatty acid profile and oil content simultaneously in a non-destructive way for future oil quality breeding programs.

2. Materials and Methods

2.1. Genetic Materials

A total of 96 carinata seed samples consisting of 42 accessions, 50 advanced breeding lines, and 4 varieties were used in this study. The accessions were acquired from the Ethiopian Biodiversity Institute (EBI), which holds core collections obtained from five major regional states of Ethiopia, namely Oromia; Amhara; the South Nations, Nationalities, and Peoples’ Region (SNNP); the South West Ethiopia Peoples’ Region (SWEP); and Benishangul-Gumuz. The specific areas of the regional states from which the seed samples were taken were systematically identified based on their carinata cultivation history as well as considering the possibility of capturing variability. Advanced breeding lines used in this study were those genotypes tested under a preliminary yield trial in 2020 at Holetta Agricultural Research Center (HARC) in randomized block design (RCBD) with three replications. The four varieties were taken from released varieties maintained by the oilseed research program of HARC. Detailed descriptions of the carinata germplasms used in this study are presented in Table S1. Figure 1 shows the regions where accessions were collected, including the HARC location where the advanced breeding lines and 4 varieties were acquired.

2.2. Seed Sampling for NIRS and Reference Data

About 30–35 g of intact seeds of 96 genotypes were prepared from cleaned, homogenous, and dried seed lots of accessions, advanced breeding lines, and varieties. Seeds from accessions were sampled from pure conserved seed lots collected from targeted areas. Seeds from advanced breeding lines were sampled from bulk seeds of 10 selected plants of each line from the preliminary yield trial. Breeder seeds of carinata from HARC were used as sources of seeds for the four varieties. A portion of 5 g of the seeds per genotype was used in triplicate for NIRS analysis and the remaining portion of the seeds was used for chemical analysis to generate reference data sets.

2.3. Spectra Data Acquisition and Analysis

For spectra data acquisition, bulk seed samples were placed in a rotating sample cup of 5 cm diameter and positioned at the beam outlet of a Bruker TANGO-FT-NIR spectrometer (Bruker, TANGO Optics GmbH, Ettlingen, Germany). For each sample, the spectrum was recorded in total reflectance mode in the wavenumber range 11,500 to 4000 cm−1 by averaging 32 scans with approximately 1 min of analysis. The raw spectra data were captured in the logarithm of reflectance (log 1/R) and subjected to Principal Component Analysis (PCA) using Soft Independent Modeling of Class Analogy (SIMCA version 17).

2.4. Generation of Reference Data

2.4.1. Fatty Acid Profiling

Total lipids of 96 carinata genotypes were extracted according to the method described by Deme et al. [24] with some modifications. In brief, 0.5 g of seeds for each genotype in triplicate was homogenized using an IKA® T18 basic (ULTRA TURRAX ®) homogenizer in a mixture of 3.75 mL methanol (MeOH)/chloroform (CH3Cl3) at 2:1 (v/v) and 1 mL of 0.15 M acetic acid (HAc). Following homogenization, 1.25 mL CHCl3 and 0.9 mL H2O were added to the tubes and the samples were mixed thoroughly by vortexing for 30 s. The mixture was centrifuged at 3000 rpm for 3 min to separate the mixture into two phases. A total of 200 µL of the lower chloroform phase was transferred to a new glass screw-cap tube and allowed to dry completely under a stream of nitrogen gas on a heated sand bed set to 70 °C. The dried samples were re-dissolved in 100 µL of heptane (GC grade) and the fatty acids were methylated by adding 2 mL of a methylation solution (2% concentrated H2SO4 in anhydrous methanol) followed by incubation at 90 °C for 1 h. The methylated samples containing fatty acid methyl esters (FAMEs) were allowed to cool down to room temperature before 1 mL of H2O and 0.75 mL of heptane (GC grade) were added to the samples. The samples were mixed thoroughly by vortexing for 30 s and centrifuged at 2000 rpm for 2 min. A total of 100 µL of the upper heptane phase containing the FAMEs was transferred to a GC vial for gas chromatography (GC) analysis. Analysis of FAMEs was performed on an Agilent (Model 8860) gas chromatography machine equipped with a flame ionization detector (FID) and separation of FAMEs was achieved through a WCOT fused-silica capillary column (50 m × 0.32 mm) coated with CP-wax 58 (Agilent) with a split ratio of 10:1, and an oven program of 150 °C for 0.2 min, 4 °C/min to 210 °C, 10 °C/min to 250 °C, and then holding at 250 °C for 5 min. The fatty acid profile for each sample was obtained based on the retention times of their respective FAMEs with reference to a certified Me63 fatty acid methyl ester mixture (Larodan Fine Chemicals AB, Malmo, Sweden) as an external standard.

2.4.2. Determination of Oil Content

For seed oil content analysis, three grams of the seeds from each of the 96 genotypes in triplicate was taken and ground into powder using a metal grinder. The oil was extracted in hexane using the FOSS Soxtec 8000 apparatus. The samples were boiled at 65 °C for 20 min, rinsed for 30 min, and the oil was then recovered for 20 min. The extraction was repeated once to maximize the oil recovery. The samples were finally dried at 90 °C for 10 min. The oil content was calculated as the percentage of weight difference between the extraction cup and the residue with the extraction cup divided by the sample weight.

2.5. Development of Calibration Model

Spectra data were preprocessed using various pretreatment algorithms using OPUS spectroscopic software version 7.5.1. We employed PCA on each pretreated set of spectra to select the most appropriate pretreatment method for model development. After preprocessing of spectra, reference data were imported in a Bruker TANGO FT-NIR machine for calibration. The data were divided into two sets, of which two-thirds were used as a calibration set and one-third were used as a validation set or test set control. Calibration models were developed for major fatty acids (C16:0, C18:0, C18:1, C18:2, C18:3, and C22:1) and oil content using partial least square (PLS) regression. The statistics of the calibration and validation sets were obtained using OPUS version 7.5.1 spectroscopic software with QUANT module (Bruker, Optics GmbH, Germany). The calibration model was expressed based on the coefficient of determination for calibration (R2cal) along with the residual mean square error of calibration (RMSEC). The prediction capacity of the model was evaluated using test set validation statistics R2val, residual mean square error of prediction (RMSEP), and the ratio of performance to deviation (RPD).

3. Results and Discussion

3.1. Spectra Data Analysis

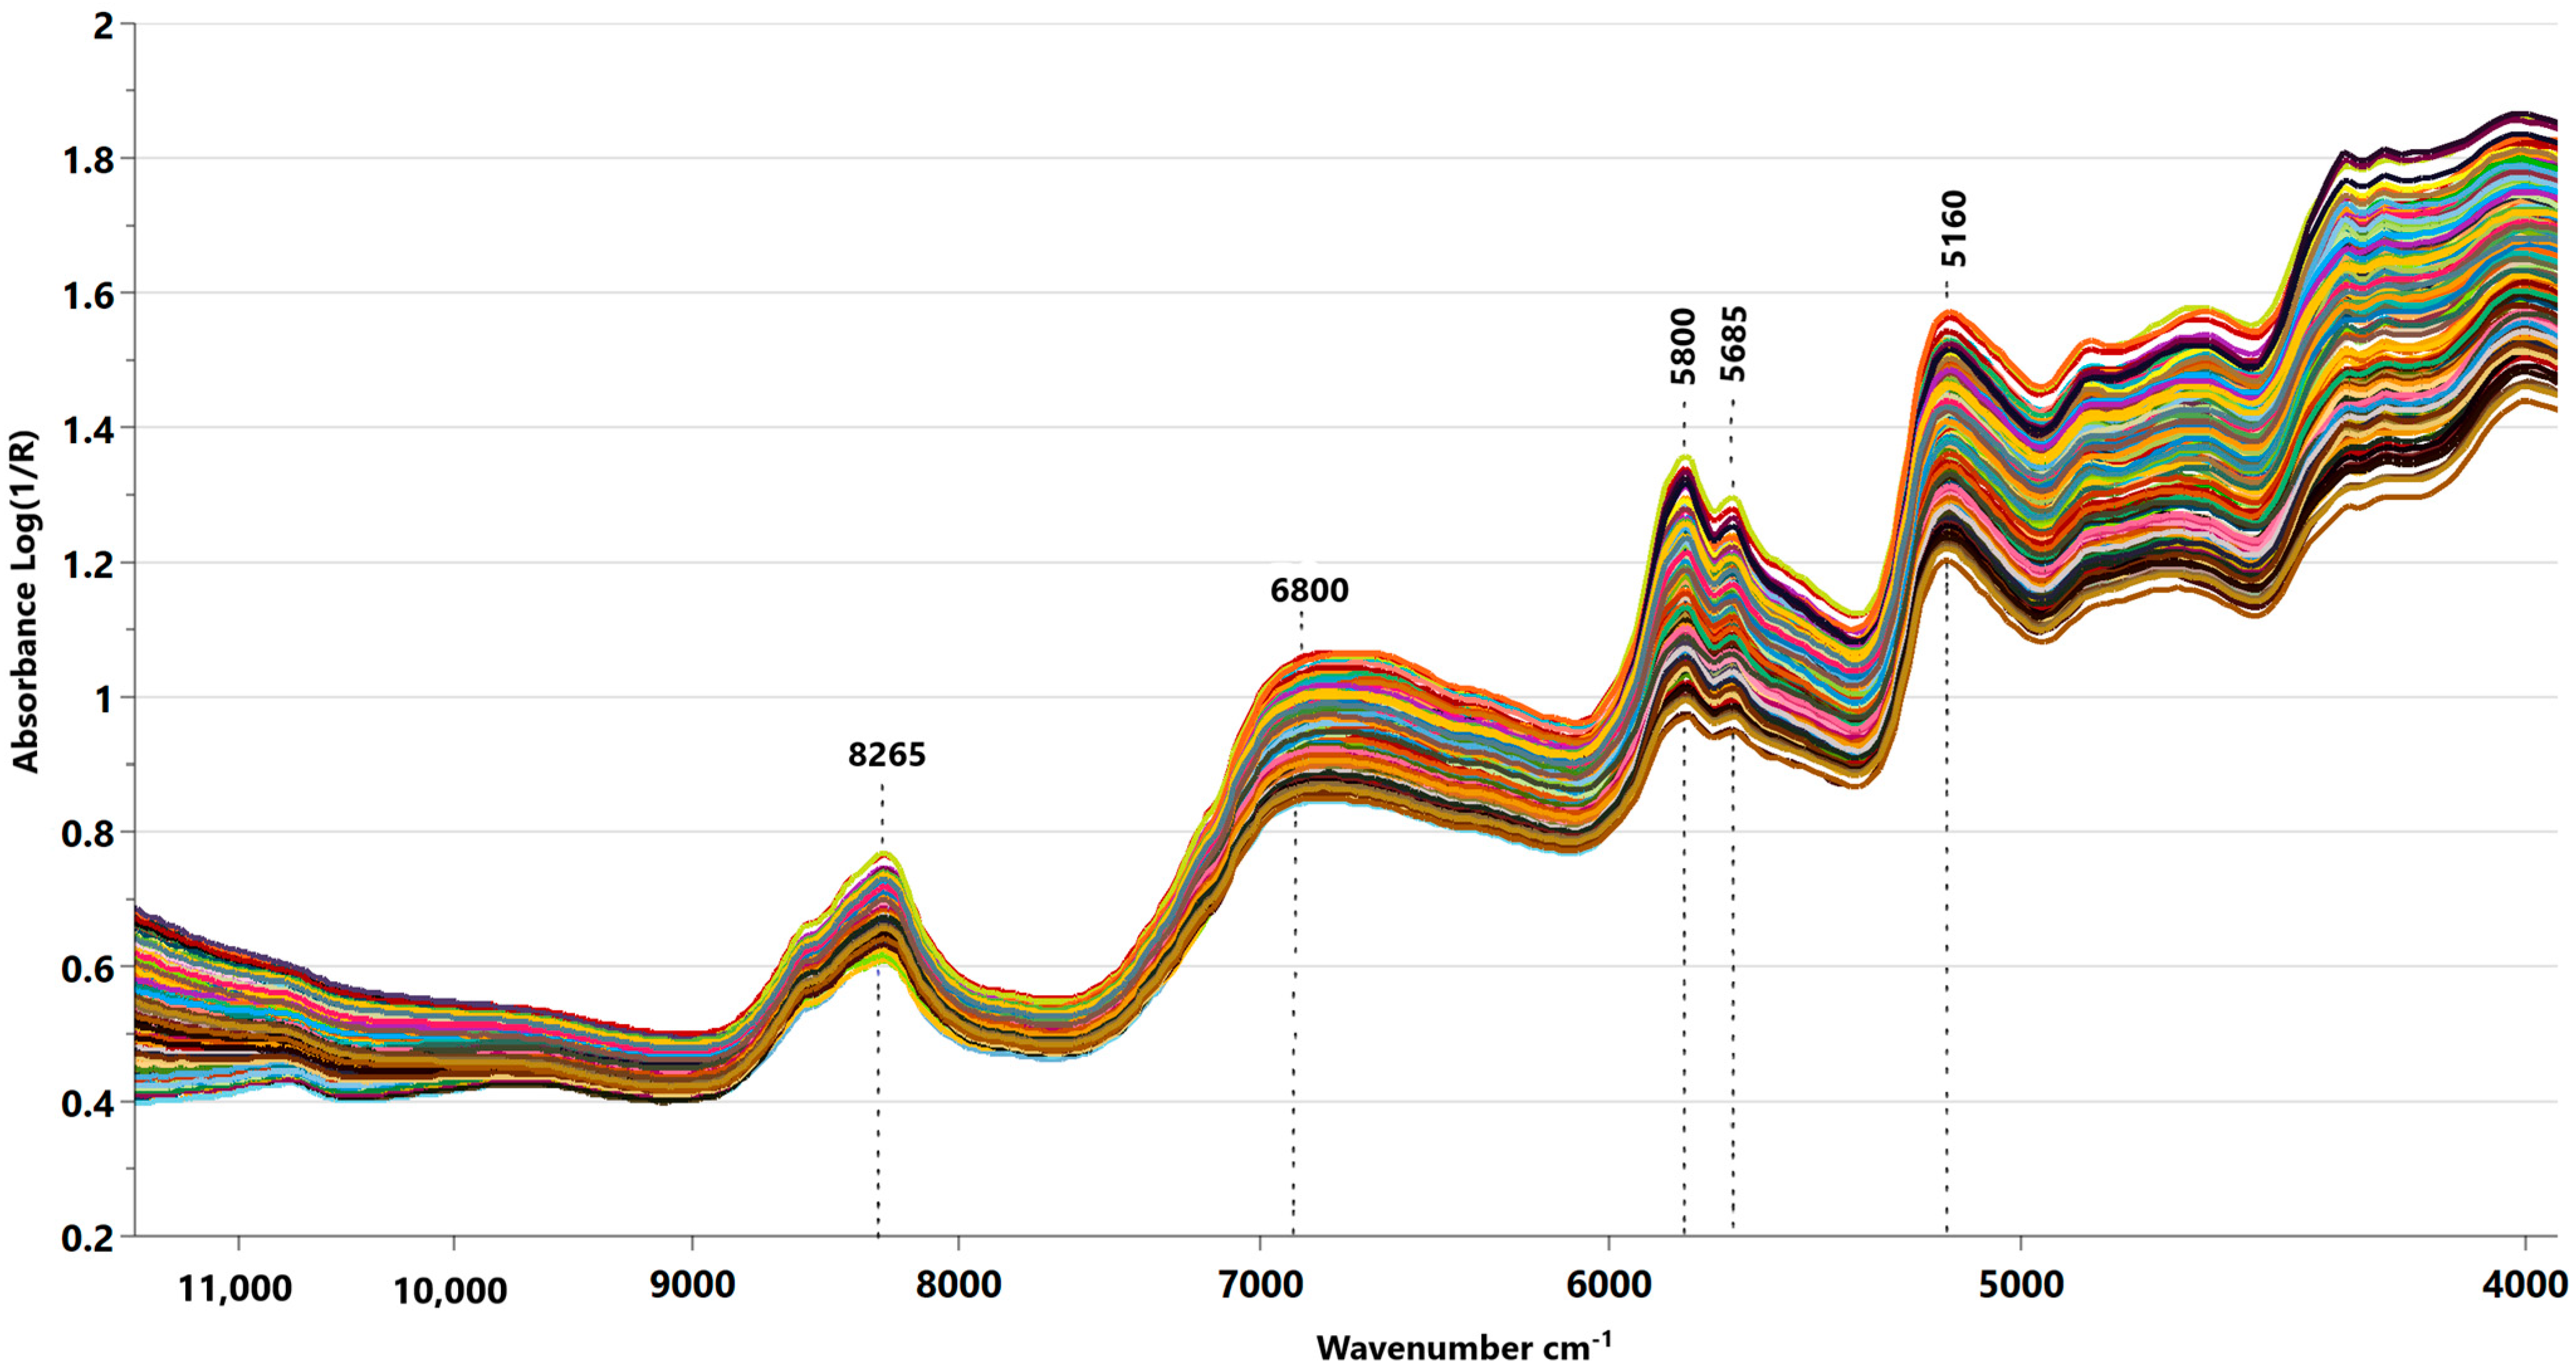
The raw NIR spectra of the 96 carinata samples were observed at wavenumbers between 11,500 and 4000 cm−1 (Figure 2). The spectra data were spread along the Y-axis due to the change in absorbance among different samples, while the spectra pattern across the range of wavenumbers (X-axis) seems to be very similar among all samples. The formation of multiple absorption bands is commonly caused by the presence of various chemical components as well as the difference in the particle size, shape, and orientation of the samples [25]. As is shown in Figure 2, peaks and valleys were obviously observed in the spectra, which are associated with the characteristics of chemical components of carinata samples or functional groups (C-H, N-H, and O-H). The first intense absorption band was located at approximately 8265 cm−1, which is linked to the second overtone of C=C-H stretching that is related to unsaturated fatty acids. The absorption band at 6800 cm−1 refers to the first overtone of O-H stretching and is related to moisture. The absorption band associated with aliphatic residues of lipids was found at wavelengths ranging around 5800 cm−1 (first overtone of C-H stretching; -CH3) and 5685 cm−1 (first overtone of C-H stretching; -CH2). Another region linked to moisture was found at 5160 cm−1, which refers to the first overtone of O-H stretching in combination with H-O-H deformation.
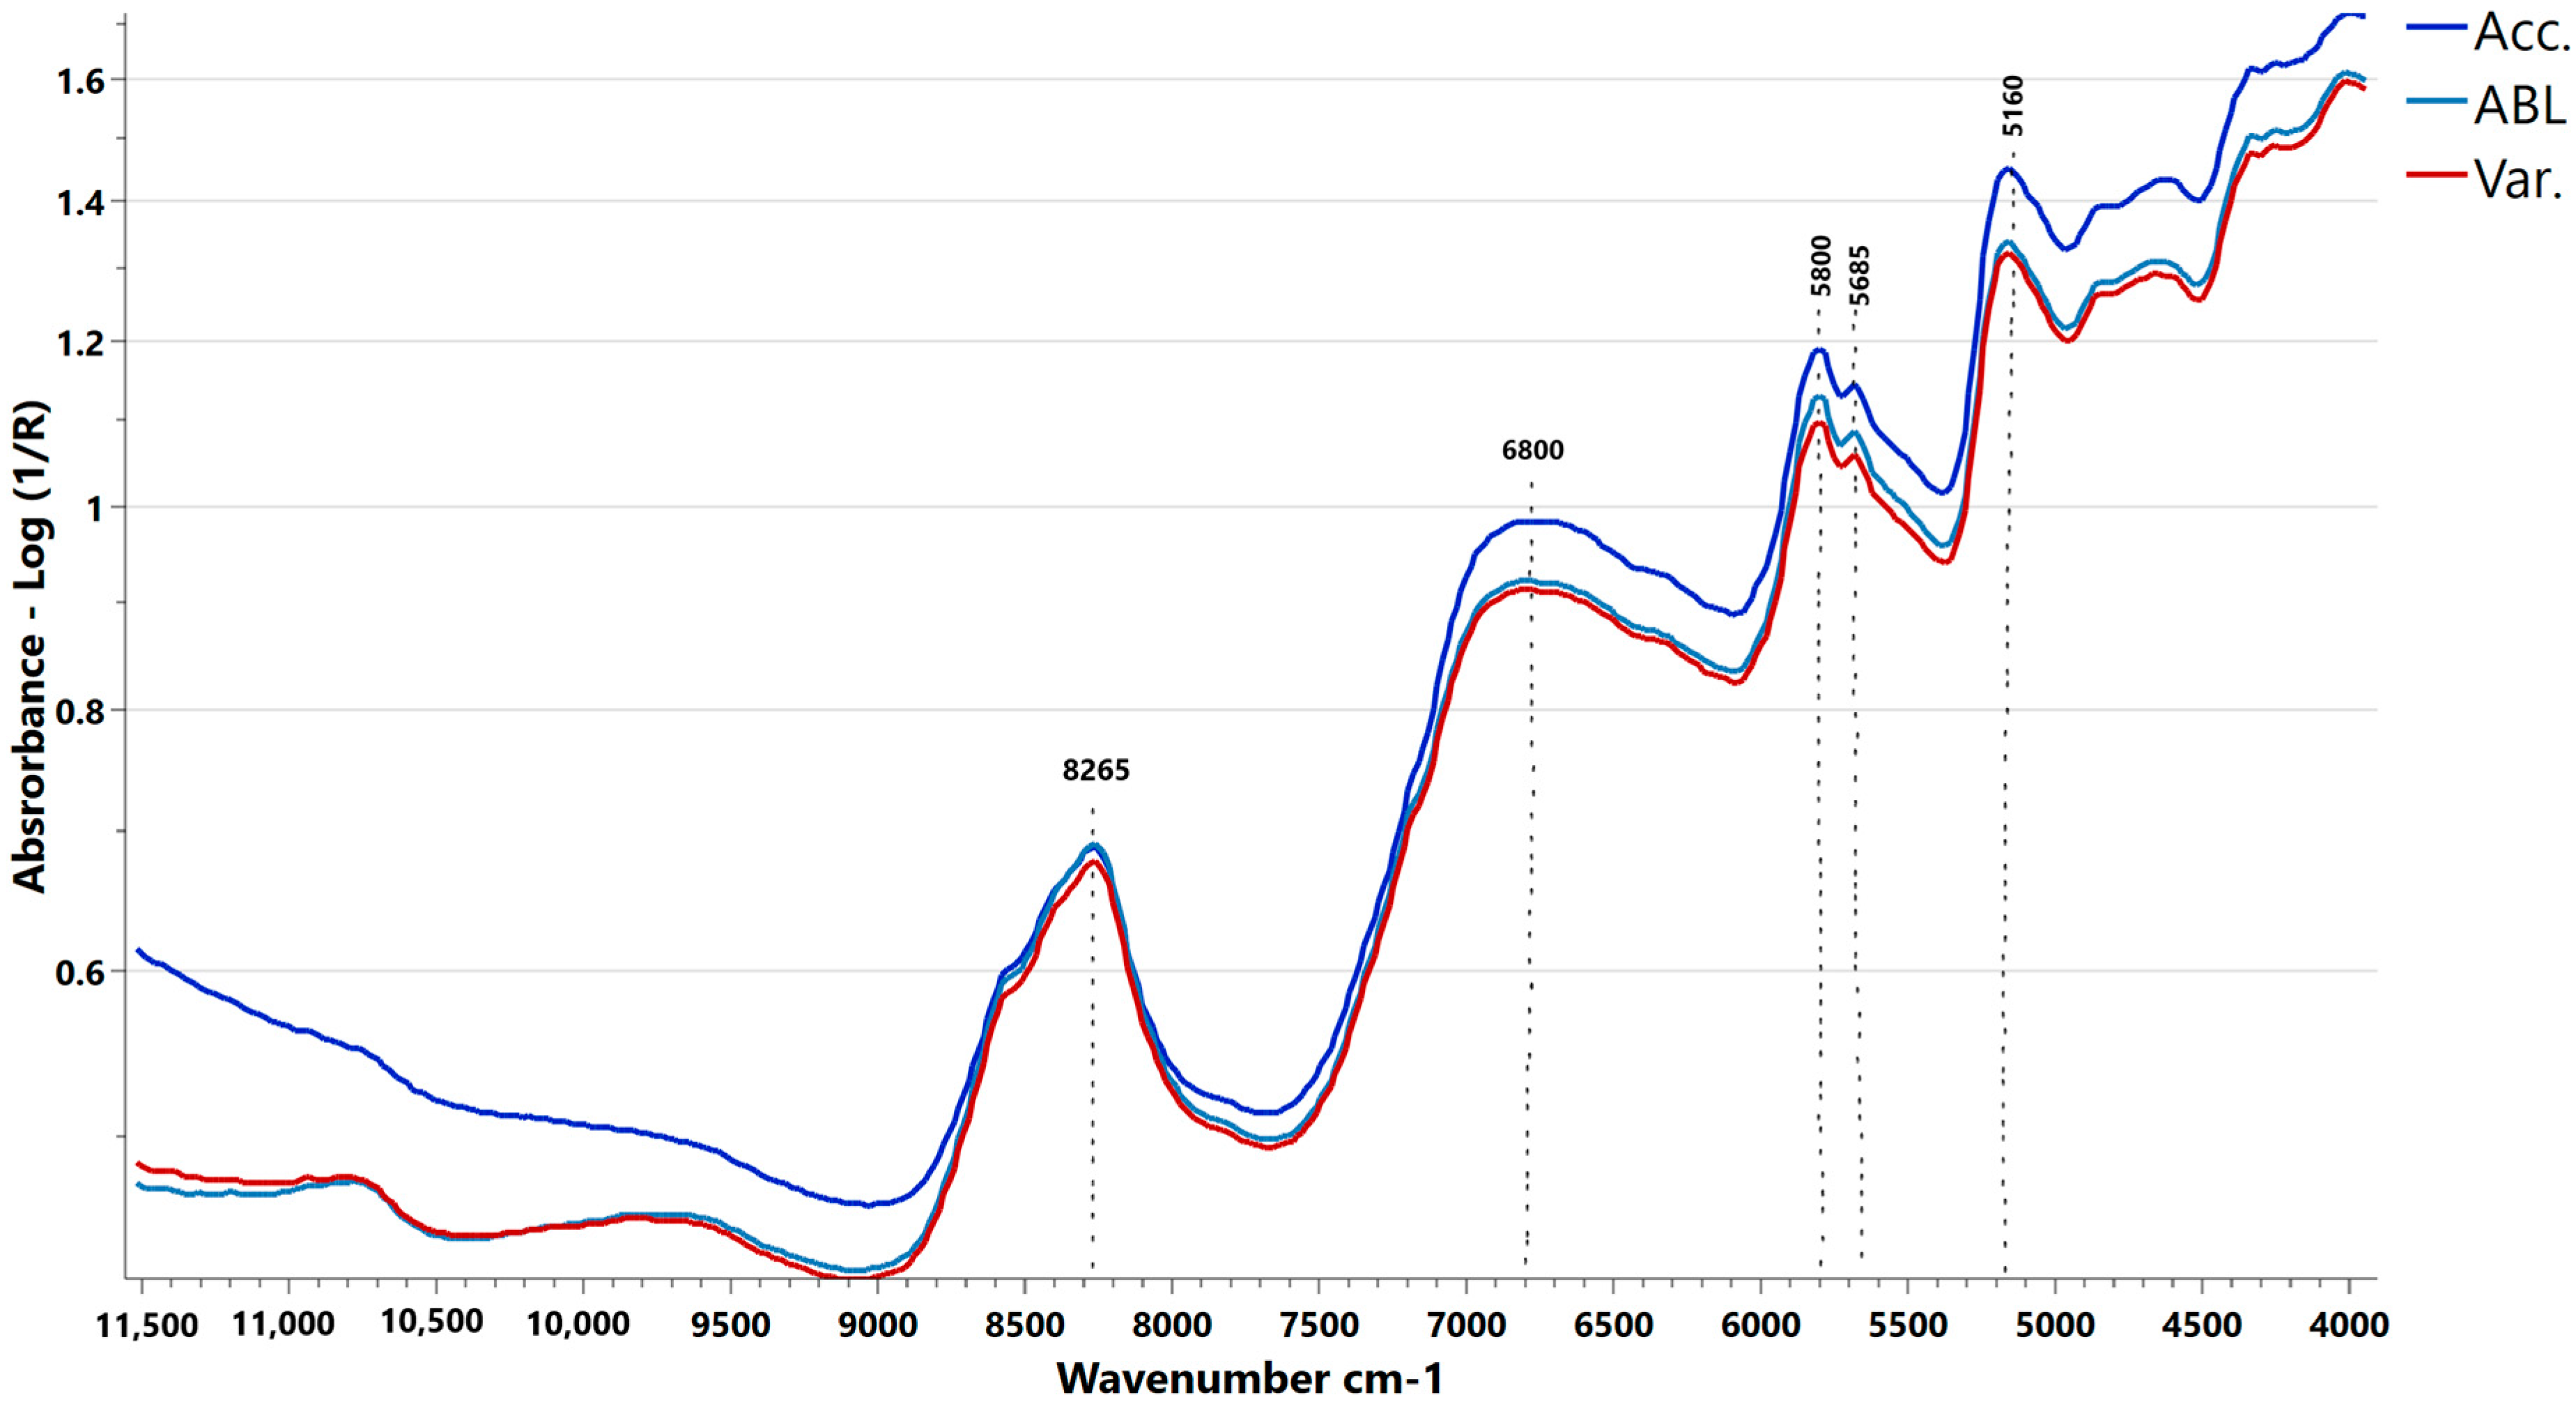
Further analysis of the NIRS spectra was conducted using the mean spectra values of the three group genotypes, namely accessions (Acc.), advanced breeding lines (ABL), and varieties (Var.). The absorbance value of Acc. was generally higher than ABL and Var. in most of the wavenumbers (Figure 3). The absorbance variation in Acc. in relation to ABL Var. was much higher at wavenumbers between 11,500 and 9000 cm−1. The absorbance value of Acc. Was also found to be higher at main absorption bands of 6800 cm−1 and 5160 cm−1, which are related to moisture, and at the 5800 cm−1 and 5685 cm−1 regions that are ascribed to aliphatic chain lipids (Figure 3). In previous study by Petisco et al. [20] dealing with NIRS qualitative spectra analysis of intact seed of two Brassica species, they found that B. napus showed higher absorbance values than B. carinata and the higher absorption value of B. napus was also observed in a major absorption band associated with water and aliphatic chain fatty acids, as observed in the current study.

3.2. Principal Component Analysis (PCA)

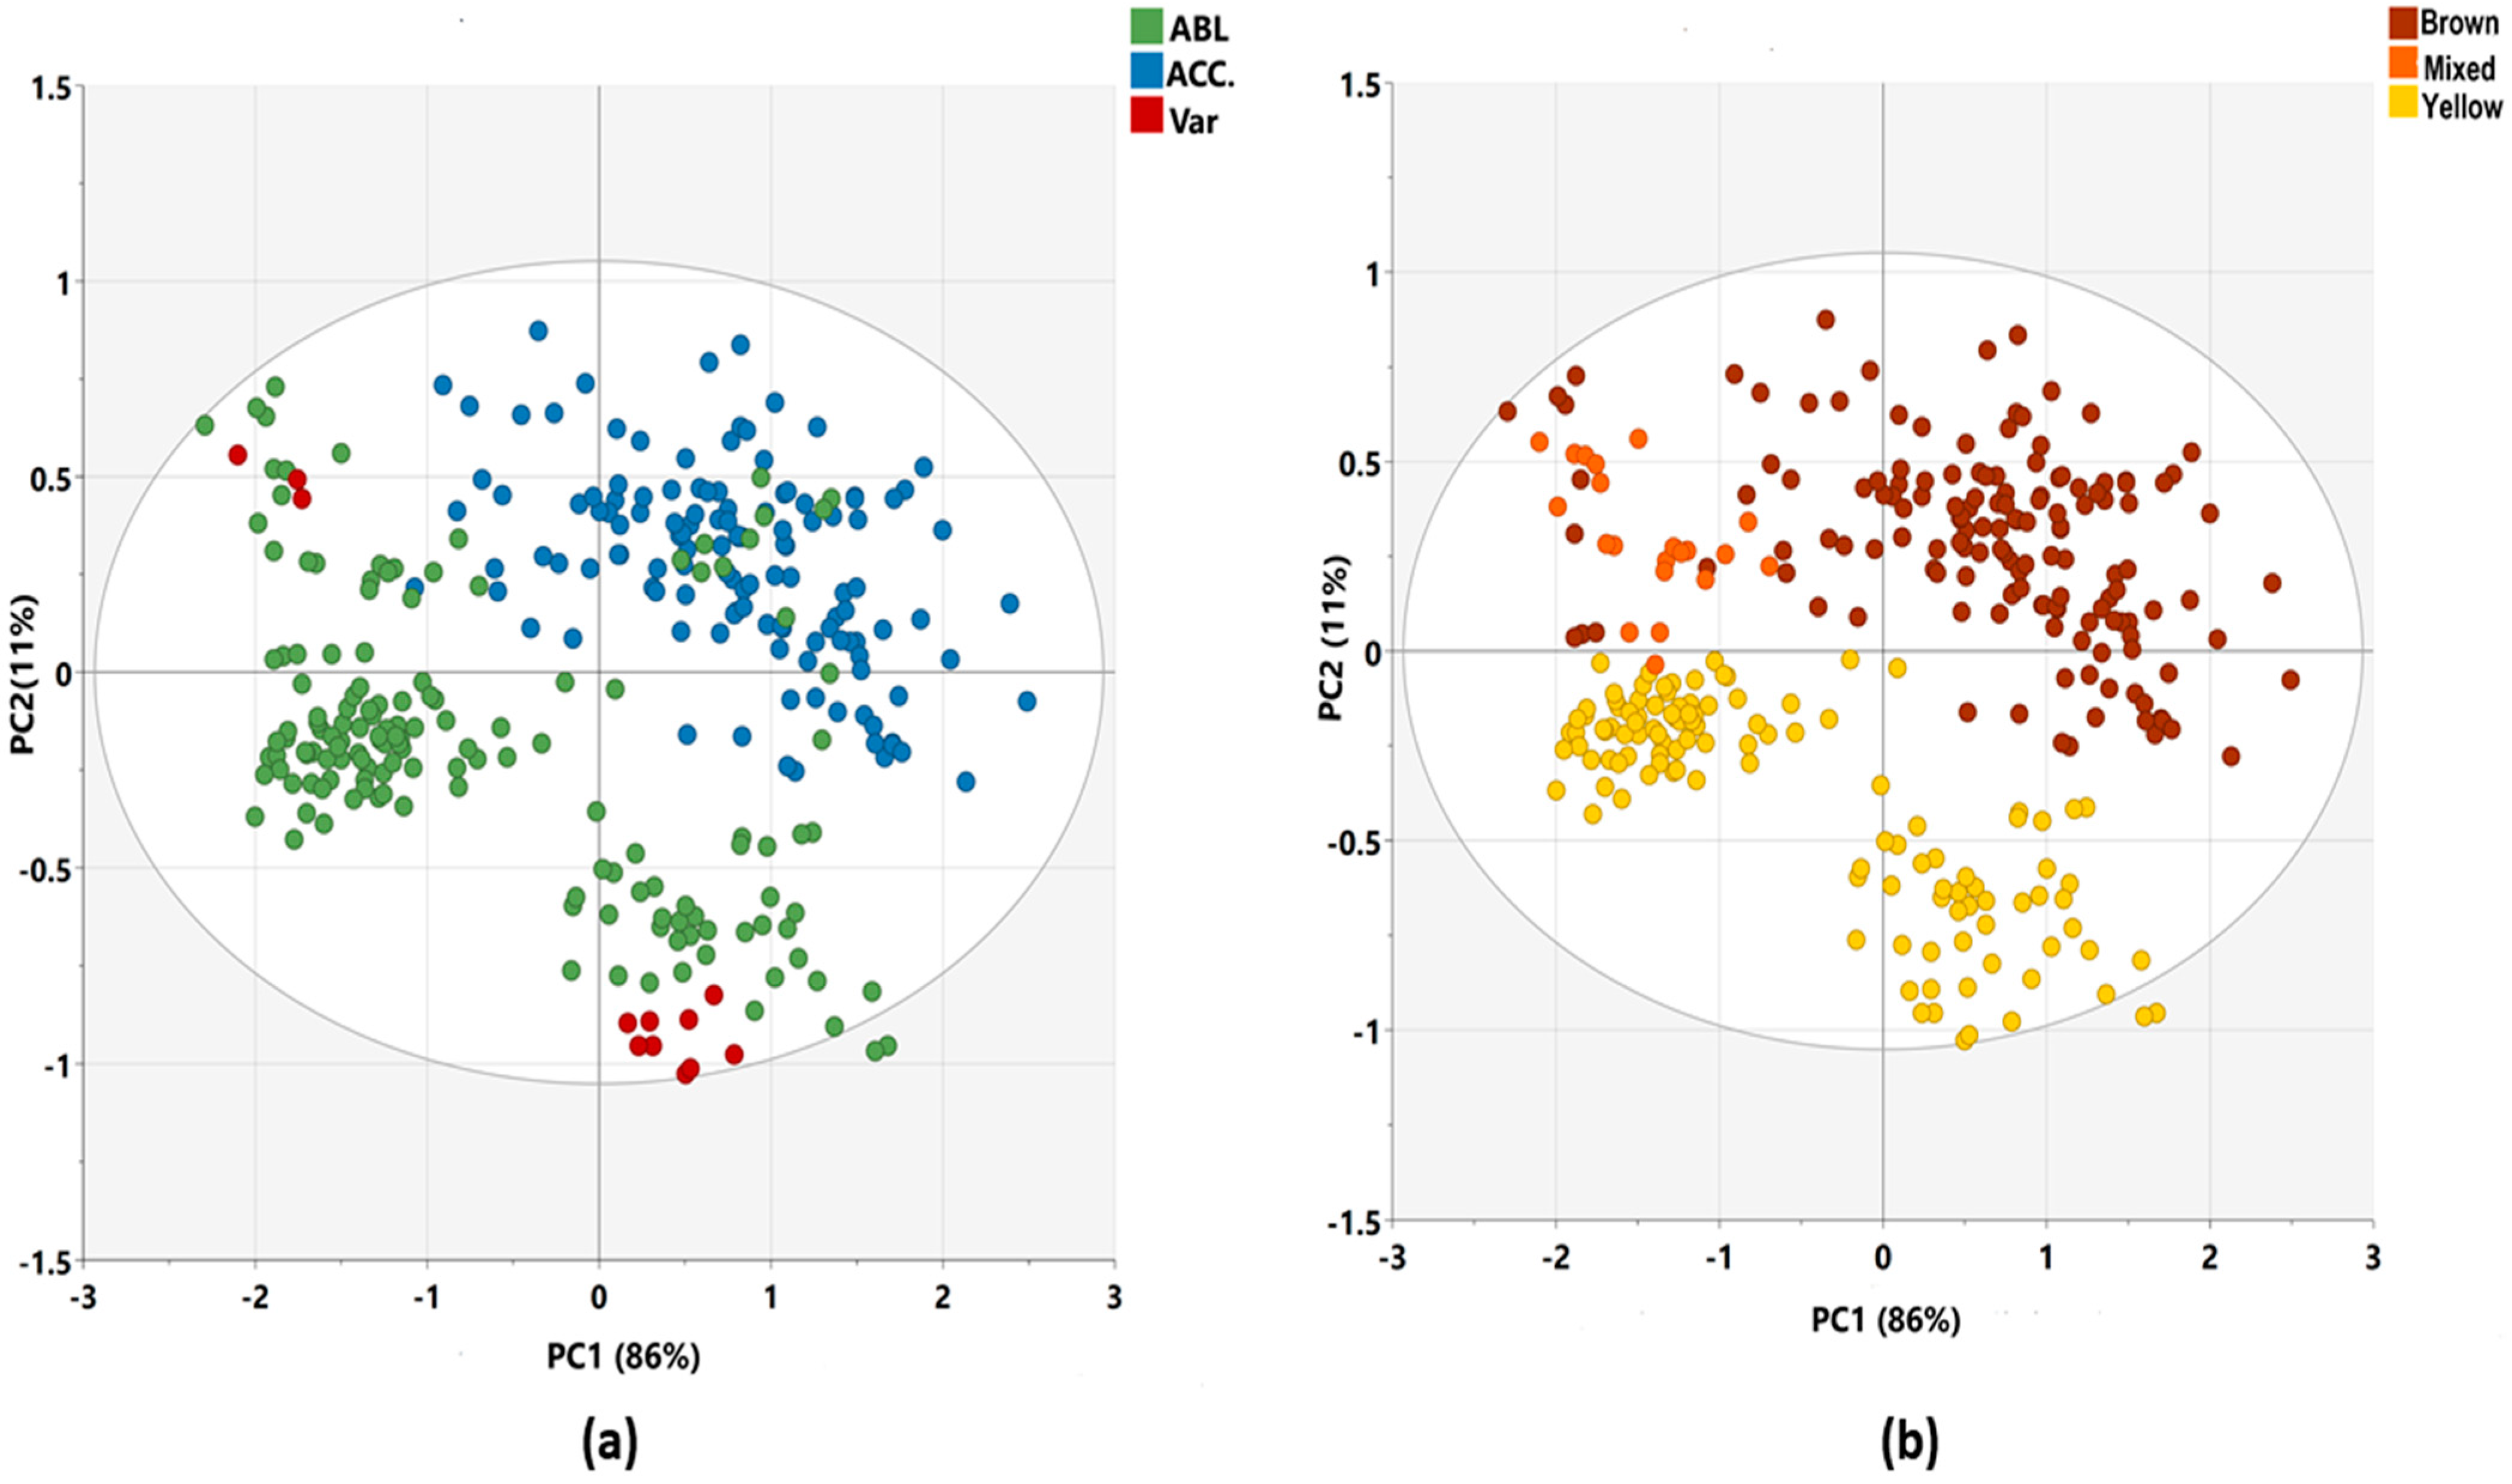
The PCA classified the 96 carinata genotypes into two principal components: PC1 explained 86% of the variation, while PC2 accounted for 11% of the total variance in the PCA of NIR spectra as indicated in Figure 4. The PCA axis differentiated the three groups of genotypes based on their absorbance values (Figure 4a). The PCA was also conducted based on the seed color that showed aggregation of the majority of genotypes having similar seed colors (Figure 4b). The majority of accessions (Acc.) are brown in color and located in the upper right corner of the PCA plot, while most of the ABL and Var., which are dominantly yellow-seeded, were found at the bottom of the PCA (Figure 4a,b).
The three varieties labeled with a red-colored dot in Figure 4a were found collectively at the right bottom of the PCA, which implies that they might share similar features. These varieties, namely, Yellow Doddolla, Derash, and Tesfa, which are yellow-seeded, did not show a significant difference in their fatty acid profiles (Table 1 and Table S1). The present finding seems to be consistent with the spectroscopy analysis of the aforementioned varieties by Zinnabu et al. [26], who found insignificant differences in spectra patterns, particularly at the regions above 721 cm−1. Interestingly, one of the varieties (i.e., Holetta-1) with red dots was distinctly located in the upper left corner of the PCA, indicating its distinction from the yellow-seeded varieties (Figure 4a). This variety is mixed in seed color and showed a significant variation in fatty acid profile and oil content from the rest of the varieties (Table 1). The PCA also showed the two replicates of one sample of ABL to be located outside the 95% confidence area of Hotelling’s T2 ellipse in the PCA score plot. These samples, being outliers, were thus removed for further analysis.

3.3. Fatty Acid and Oil Content Analysis

The descriptive statistics of fatty acid profiles and oil content obtained from the wet chemistry analysis of 96 carinata germplasms is presented in Table 2. A wide range of variation was observed in oil content (OC) and erucic acid (C22:1) followed by linolenic acid (C18:3). The total OC ranges from 26.89 to 48.23% with the mean value of 36.88%, while the C22:1 and C18:3 percentages were found with the range of 34.93–48.1% (mean, 41.66%) and 9.68–22.65% (mean, 14.64%), respectively (Table 2). Such variation in the aforementioned quality parameters was also observed in previous studies by Teklewold and Becker [27] and Velasco et al. [5], who used 66 and 114 carinata samples, respectively. The mean value of erucic acid in this study was 41.66%, which is in agreement with the result (42.1%) reported by Warwick et al. [28], but greater than that (33.4%) reported by Teklewold and Becker [27]. Genotypes with an above-average erucic acid content (>41.66) are useful for various oleochemical chemical industry applications such as in the biofuel, lubricant, detergent, cosmetics, and pharmaceutical industries [4,29]. The levels of oleic acid (C18:1) and linoleic acid (C18:2) were found to be within the ranges of 7.23–12.6% (mean, 9.22%) and 13.26–21.81% (mean, 16.93%), respectively. A high proportion of oleic acid contributes to stabilizing heat in the oil, which is suited for both the food industry for deep-frying and in non-food applications for increasing lubrication performance [29]. Unlike polyunsaturated fatty acids, saturated fatty acids showed narrow variation among the germplasms, whereby palmitic acid (C16:0) varies with a range of 2.47–3.84 (mean value 3.18%), while stearic acid (C18:0) ranged between 0.78 and 1.45% (mean value 1.15%). The low concentration of saturated fatty acids in carinata makes the oil suitable for processing into high-quality oil, such as “drop-in” biofuel [30].

3.4. Calibration Model Development

3.4.1. NIRS Spectra Pretreatment

Prior to calibration, the NIRS spectra data were tested with various spectra pretreatment algorithms. Initially, the spectra data were pretreated using Standard Normal Variate (SNV) and Multiplicative Scatter Correction (MSC) along with Savitzky–Golay (SG) smoothing at 15 points, followed by SNV + SG and MSC + SG in combination with first derivatives (D1). The first derivatives were used to enhance and correct overlapping peaks [31]. Each pretreated spectrum was subjected to PCA to select the most appropriate pretreatment method for model development. Although the PCAs of SNV + SG and MSC + SG showed almost the same and relatively higher total variance, 80%, than SNV + SD1 (79.5%) and MSC + SD1 (76.9%), there were outlier samples that could affect further analysis (Table 3). Therefore, we selected SNV + SGD1 as a pretreatment for calibration model development since it had relatively higher cumulative amount of variance explained by the first two PCAs (79.5%) without the outliers. The spectra of each pretreatment method are presented in Supplementary Figure S1.

3.4.2. NIRS Calibration Model

The fatty acid profile and oil content calibration and validation statistics are presented in Table 4. The calibration model results of C18:1 (R2cal = 0.88, RMSEC = 0.39), C18:2 (R2cal = 0.90, RMSEC = 0.45), C18:3, (R2cal = 0.86, RMSEC = 0.89), and C22:1 (R2cal = 0.87, RMEC = 0.89) showed higher R2cal values. The prediction capacity of the calibration equations of the aforementioned fatty acids was strong, as explained by validation statistics (C18:1, R2val = 0.92, RPD = 3.6), (C18:2, R2val = 0.89, RPD = 3.2), (C18:3, R2val = 0.93, RPD = 3.8), and (C22:1 R2val = 0.92, RPD = 3.5), respectively. The values of RPD > 3 are usually acceptable in determining the estimation power of calibration as explained by Williams and Sobering [32]. Moreover, the RMSEC values of the above fatty acids were found to be lower, which signifies a closer alignment of the calibration data with the regression line, which in turn suggests the higher accuracy of the prediction model. The calibration model results of saturated fatty acids C16:0 (R2cal = 0.64, RMEC = 0.13) and C18:0 (R2cal = 0.67, RMSEC = 0.06), however, showed low prediction performance as revealed by relatively lower R2val values and RPD < 3. Despite their lower R2 values, the calibration models of C16:0 and C18:0 can be used for rough screening and approximate prediction since their R2val values are found within the range of 0.78–0.75, as explained by Williams [33], and they have lower RMSEC values.
The above results of this study support previous findings by Velasco et al. [5] and Oblath et al. [17], who conducted NIRS analyses on different Brassica species such as B. napus, B. juncea, and B. rapa, including carinata. These studies reported that the prediction models of mono- and polyunsaturated fatty acids were strong in prediction, while saturated fatty acids showed low performance. C18:1 is a monounsaturated fatty acid that is a precursor for the formation of the polyunsaturated fatty acids C18:2 and C18:3 through the action of enzyme ∆12-desaturates and ∆15-desaturates, respectively [34]. After desaturation, the polyunsaturated fatty acid extends to C22:1 and other very long-chain fatty acids through the action of fatty acid elongase (FAE1) [35]. The NIRS calibration models developed from the current study will enable us to analyze these inter-related fatty acids simultaneously.
The calibration model of oil content (OC) showed an RMSEC value of 0.82 with a coefficient of determination R2cal = 0.93 (Table 4). OC showed strong prediction capacity as verified by higher R2val 0.93 and RPD 3.6. Other similar studies in related Brassica species reported lower validation statistics (standard error performance) that range from 0.86 to 1.92 for oil content [5,36]. In another study by Petisco et al. [20] and Oblath et al. [17], the RPD values were 6.9 and 7.3, respectively, which were higher than in the current study. This might be due to the wider Vis-NIR wavelength range applied (i.e., 400–2500 nm) or the relatively narrow genetic base of the materials used as compared to those used in this study.
The NIRS calibration model of fatty acids was presented using a scatter plot (Figure S2), which was developed using partial least square (PLS) regression. According to the scatter plot, the reference values were highly correlated with the NIRS-predicted values in all analyzed fatty acids. The degree of correlation was explained by the correlation coefficient value (r), which ranges from 0.80 to 0.92. Similarly, the scatter plot of the oil content calibration model showed a high correlation of the reference value with the NIRS-predicted value with a correlation coefficient r = 0.92, as presented in Figure S2. The slope of regression equation indicates the change in the predicted value with a unit change in the reference value. The slope can also indicate the accuracy of the model if its value is close to 1. The values of the slopes in this study for those traits that showed better prediction capacity were (C8:1, 0.87), (C18:2, 0.91), (C18:3, 0.85), (C22:1, 0.88), and (OC, 0.94) (Figure S2).

4. Conclusions

This study demonstrated NIRS calibration model development using diverse germplasms of carinata for rapid measurements of fatty acid profile and oil content. The NIRS calibration equations obtained for oleic acid (C18:1), linoleic acid (C18:2), linolenic (C18:3), and erucic acid (C22:1) as well as oil content showed good prediction performance. Despite a relatively lower coefficient of determination (R2), the calibration equations for palmitic acid (C16:0) and stearic acid (C18:0) can still be used for preliminary screening. The NIRS calibration model from the current study will be useful for fast screening of germplasms based on their fatty acid profile and oil content. It will reduce the cost of chemical analysis and make it possible to capture many quality parameters simultaneously. Since NIRS is a non-destructive method of analysis, it provides an opportunity for maintaining the seeds of breeding materials for further breeding work, which is particularly important for materials with limited amounts of seeds. The robustness of the NIRS prediction model can be enhanced by incorporating more samples of carinata from additional environments or genetic sources.

Supplementary Materials

The following supporting information can be downloaded at https://www.mdpi.com/article/10.3390/pr12020244/s1. Table S1: Brassica carinata germplasm used for NIRS calibration development. Figure S1: Pretreated NIRS spectra using (a) SNV with SG 15 point smoothing; (b) MSC with SG 15 point smoothing; (c) SG + SNV+ D1, 15 point smoothing; and (d) SG + MSC+ D1, 15 point smoothing. Figure S2: Scatter plot of the reference and NIRS predicted values for fatty acids and oil content calibrations.

Author Contributions

Conceptualization: M.T. and T.F.; methodology: M.T., E.S.W. and T.H.; formal analysis: M.T. and E.S.W.; conducting the experiment and writing the original draft of manuscript: M.T.; reviewing and editing of manuscript: L.-H.Z., T.H., T.F., S.K. and E.S.W.; project administration and supervision: L.-H.Z. and T.F. All authors have read and agreed to the published version of the manuscript.

Funding

This work is financially supported by the Swedish International Development Cooperation Agency (Sida) and the Research and Training Grant awarded to the Addis Ababa University and the Swedish University of Agricultural Sciences (AAU-SLU, Biotech; https://sida.aau.edu.et/index.php/biotechnology-phd-program/; accessed on 25 September 2021).

Data Availability Statement

The data that support the findings of this study are available from the corresponding author upon reasonable request.

Acknowledgments

The authors acknowledge the support of the Swedish International Development Cooperation (Sida) for financing this study. We also thank the Department of Plant Breeding of the Swedish University of Agricultural Science for the chemical analysis and the provision of software for NIRS spectra analysis. Ethiopian Biodiversity Institute (EBI) and Holetta Agricultural Research Center (HARC) are acknowledged for providing the initial seeds of carinata used in this study. We would like to thank Yadessa Abeshu for the technical support in spectra data collection.

Conflicts of Interest

The authors declare no conflicts of interest.

References

  1. Taylor, D.C.; Falk, K.C.; Palmer, C.D.; Hammerlindl, J.; Babic, V.; Mietkiewska, E.; Jadhav, A.; Marillia, E.; Francis, T.; Hoffman, T.; et al. Brassica carinata–a new molecular farming platform for delivering bio-industrial oil feedstocks: Case studies of genetic modifications to improve very long-chain fatty acid and oil content in seeds. Biofuels Bioprod. Biorefining 2010, 4, 538–561. [Google Scholar] [CrossRef]
  2. Leonard, E.C. High-erucic vegetable oils. Ind. Crops Prod. 1992, 1, 119–123. [Google Scholar] [CrossRef]
  3. McVetty, P.B.; Scarth, R. Breeding for improved oil quality in Brassica oilseed species. J. Crop Prod. 2002, 5, 345–369. [Google Scholar] [CrossRef]
  4. Roslinsky, V.; Falk, K.C.; Gaebelein, R.; Mason, A.S.; Eynck, C. Development of B. carinata with super-high erucic acid content through interspecific hybridization. Theor. Appl. Genet. 2021, 134, 3167–3181. [Google Scholar] [CrossRef] [PubMed]
  5. Velasco, L.; Goffman, F.D.; Becker, H.C. Development of calibration equations to predict oil content and fatty acid composition in Brassicaceae germplasm by near-infrared reflectance spectroscopy. J. Am. Oil Chem. Soc. 1999, 76, 25–30. [Google Scholar] [CrossRef]
  6. Stefansson, B.; Hougen, F.W.; Downey, R. Note on the isolation of rape plants with seed oil free from erucic acid. Can. J. Plant Sci. 1961, 41, 218–219. [Google Scholar] [CrossRef]
  7. Getinet, A.; Rakow, G.; Raney, J.; Downey, R. Glucosinolate content in interspecific crosses of Brassica carinata with B. juncea and B. napus. Plant Breed. 1997, 116, 39–46. [Google Scholar] [CrossRef]
  8. Kumar, A.; Banga, S.S.; Meena, P.D.; Kumar, P.R. Brassica Oilseeds: Breeding and Management; CABI: Wallingford, UK, 2015. [Google Scholar]
  9. Ghanevati, M.; Jaworski, J.G. Engineering and mechanistic studies of the Arabidopsis FAE1 β-ketoacyl-CoA synthase, FAE1 KCS. Eur. J. Biochem. 2002, 269, 3531–3539. [Google Scholar] [CrossRef]
  10. Jadhav, A.; Katavic, V.; Marillia, E.F.; Giblin, E.M.; Barton, D.L.; Kumar, A.; Sonntag, C.; Babic, V.; Keller, W.A.; Taylor, D.C. Increased levels of erucic acid in Brassica carinata by co-suppression and antisense repression of the endogenous FAD2 gene. Metab. Eng. 2005, 7, 215–220. [Google Scholar] [CrossRef]
  11. Mietkiewska, E.; Giblin, E.M.; Wang, S.; Barton, D.L.; Dirpaul, J.; Brost, J.M.; Katavic, V.; Taylor, D.C. Seed-specific heterologous expression of a nasturtium FAE gene in Arabidopsis results in a dramatic increase in the proportion of erucic acid. Plant Physiol. 2004, 136, 2665–2675. [Google Scholar] [CrossRef]
  12. Font, R.; del Río-Celestino, M.; de Haro-Bailón, A. The use of near-infrared spectroscopy (NIRS) in the study of seed quality components in plant breeding programs. Ind. Crops Prod. 2006, 24, 307–313. [Google Scholar] [CrossRef]
  13. Munck, L. A new holistic exploratory approach to systems biology by near infrared spectroscopy evaluated by chemometrics and data inspection. J. Chemom. A J. Chemom. Soc. 2007, 21, 406–426. [Google Scholar] [CrossRef]
  14. Montes, J.M.; Melchinger, A.E.; Reif, J.C. Novel throughput phenotyping platforms in plant genetic studies. Trends Plant Sci. 2007, 12, 433–436. [Google Scholar] [CrossRef] [PubMed]
  15. Murray, I.; Cowe, I.A. Making Light Work: Advances in Near Infrared Spectroscopy; Wiley-VCH: Weinheim, Germany, 1992. [Google Scholar]
  16. Koester, S.; Paul, C. Application of Near Infrared Reflectance Spectroscopy (NIRS) in Breeding Rapeseed for Improved Quality; Vortraege fuer Pflanzenzuechtung: Göttingen, Germany, 1989. [Google Scholar]
  17. Oblath, E.A.; Isbell, T.A.; Berhow, M.A.; Allen, B.; Archer, D.; Brown, J.; Gesch, R.W.; Hatfield, J.L.; Jabro, J.D.; Kiniry, J.R.; et al. Development of near-infrared spectroscopy calibrations to measure quality characteristics in intact Brassicaceae germplasm. Ind. Crops Prod. 2016, 89, 52–58. [Google Scholar] [CrossRef]
  18. Tkachuk, R. Oil and protein analysis of whole rapeseed kernels by near infrared reflectance spectroscopy. J. Am. Oil Chem. Soc. 1981, 58, 819–822. [Google Scholar] [CrossRef]
  19. Font, R.; Del Río, M.; Fernández, J.; Arthur, E.; Bancroft, I.; Chinoy, C.; De Haro, A. Seed oil content analysis of Ethiopian mustard (Brassica carinata A. Braun) by near infrared spectroscopy. Crucif. Newsl. 2002, 5–6. [Google Scholar]
  20. Petisco, C.; García-Criado, B.; Vázquez-De-Aldana, B.; de Haro, A.; García-Ciudad, A. Measurement of quality parameters in intact seeds of Brassica species using visible and near-infrared spectroscopy. Ind. Crops Prod. 2010, 32, 139–146. [Google Scholar] [CrossRef]
  21. Velasco, L.; Fernández-Martínez, J.; De Haro, A. Determination of the fatty acid composition of the oil in intact-seed mustard by near-infrared reflectance spectroscopy. J. Am. Oil Chem. Soc. 1997, 74, 1595–1602. [Google Scholar] [CrossRef]
  22. Pelc, S.E.; Couillard, D.M.; Stansell, Z.J.; Farnham, M.W. Genetic diversity and population structure of collard landraces and their relationship to other Brassica oleracea crops. Plant Genome 2015, 8, plantgenome2015-04. [Google Scholar] [CrossRef]
  23. Tesfaye, M.; AdugnaWakjira, A.T.; Terefe, G.; Weyessa, B.; Semahegn, Y. Achievements, Challenges and Future Prospects Edible Oilseeds Research and Development in Ethiopia. In Agricultural Research for Ethiopian Renaissance, Challenges, Opportunities and Directions; Proceedings of the National Conference on Agricultural Research for Ethiopian Renaissance held on January 26–27, 2016 in UNECA, Addis Ababa; Alemu, D., Derso, E., Asefa, G., Kirub, A., Eds.; Ethiopian Institute of Agricultuiral Research: Addis Ababa, Ethiopia, 2016; pp. 81–94. [Google Scholar]
  24. Deme, T.; Haki, G.D.; Retta, N.; Woldegiorgis, A.; Geleta, M. Fatty acid profile, total phenolic content, and antioxidant activity of niger seed (Guizotia abyssinica) and linseed (Linum usitatissimum). Front. Nutr. 2021, 8, 674882. [Google Scholar] [CrossRef]
  25. Williams, P.; Norris, K. Near-Infrared Technology in the Agricultural and Food Industries; American Association of Cereal Chemists, Inc.: St. Paul, MN, USA, 1987. [Google Scholar]
  26. Redda, Z.T.; Laß-Seyoum, A.; Yimam, A.; Barz, M.; Jabasingh, S.A. Solvent extraction and characterization of Brassica carinata oils as promising alternative feedstock for bio-jet fuel production. Biomass Convers. Biorefinery 2022, 1–20. [Google Scholar] [CrossRef] [PubMed]
  27. Teklewold, A.; Becker, H.C. Geographic pattern of genetic diversity among 43 Ethiopian mustard (Brassica carinata A. Braun) accessions as revealed by RAPD analysis. Genet. Resour. Crop Evol. 2006, 53, 1173–1185. [Google Scholar] [CrossRef]
  28. Warwick, S.; Gugel, R.; McDonald, T.; Falk, K. Genetic variation of Ethiopian mustard (Brassica carinata A. Braun) germplasm in western Canada. Genet. Resour. Crop Evol. 2006, 53, 297–312. [Google Scholar] [CrossRef]
  29. Scarth, R.; Tang, J. Modification of Brassica oil using conventional and transgenic approaches. Crop Sci. 2006, 46, 1225–1236. [Google Scholar] [CrossRef]
  30. Seepaul, R.; Small, I.M.; Mulvaney, M.J.; George, S.; Leon, R.G.; Paula-Moraes, S.V.; Geller, D.; Marois, J.J.; Wright, D.L. Carinata, the Sustainable Crop for a Bio-Based Economy: 2018–2019 Production Recommendations for the Southeastern United States; University of Florida Institute of Food and Agricultural Sciences: Gainesville, FL, USA, 2019; pp. 1–12. [Google Scholar]
  31. Næs, T.; Isaksson, T.; Fearn, T.; Davies, T. A User-Friendly Guide to Multivariate Calibration and Classification; NIR: Chichester, UK, 2002. [Google Scholar]
  32. Williams, P.C.; Sobering, D. Comparison of commercial near infrared transmittance and reflectance instruments for analysis of whole grains and seeds. J. Near Infrared Spectrosc. 1993, 1, 25–32. [Google Scholar] [CrossRef]
  33. Williams, P. Implementation of near-infrared technology. In Near-Infrared Technology in the Agricultural and Food Industries, 2nd ed.; American Association of Cereal Chemists: St. Paul, MN, USA, 2001. [Google Scholar]
  34. Los, D.A.; Murata, N. Structure and expression of fatty acid desaturases. Biochim. Biophys. Acta BBA Lipids Lipid Metab. 1998, 1394, 3–15. [Google Scholar] [CrossRef]
  35. Taylor, D.C.; Francis, T.; Guo, Y.; Brost, J.M.; Katavic, V.; Mietkiewska, E.; Giblin, E.M.; Lozinsky, S.; Hoffman, T. Molecular cloning and characterization of a KCS gene from Cardamine graeca and its heterologous expression in Brassica oilseeds to engineer high nervonic acid oils for potential medical and industrial use. Plant Biotechnol. J. 2009, 7, 925–938. [Google Scholar] [CrossRef]
  36. Tillmann, P.; Reinhardt, T.-C.; Paul, C. Networking of near infrared spectroscopy instruments for rapeseed analysis: A comparison of different procedures. J. Near Infrared Spectrosc. 2000, 8, 101–107. [Google Scholar] [CrossRef]
Figure 1. The geographical location of the 42 carinata accessions used in the study (SNNP and SWEP refer to the South Nations, Nationalities, and Peoples’ Region and the South Western Peoples’ Region states, respectively; HARC refers to Holetta Agricultural Research Center, where the 50 advanced breeding lines and 4 varieties were taken for this study).
Processes 12 00244 g001
Figure 2. Near-infrared reflectance (NIR) spectra of intact seeds of 96 carinata germplasms.
Processes 12 00244 g002
Figure 3. Mean spectra data of intact seeds of carinata from the three groups of genotypes (accessions, advanced breeding lines, and varieties).
Processes 12 00244 g003
Figure 4. PCA classification of 96 carinata genotypes based on the three group of genotypes (a), and based on seed color (b). Spectroscopic outliers are visualized as samples outside the boundaries of Hotelling’s T2 statistics ellipse.
Processes 12 00244 g004
Table 1. Fatty acid profile and oil content of carinata varieties used for NIRS analysis.
VarietiesFatty Acid Profile (%)Oil Content (%)
C16:0C18:0C18:1C18:2C18:3C22:1
Yellow Doddolla3.18 ± 0.10 b1.09 ± 0.07 a8.25 + 0.39 b19.78 + 0.15 a13.52 + 0.67 b42.79 + 0.23 a,b42.03 + 0.15 b
Dersash3.02 ± 0.03 b1.08 ± 0.03 a8.99 + 0.28 a19.88 + 0.01 a11.84 + 0.48 c41.74 + 0.13 b44.75 + 0.95 a
Tesfa3.01 ± 0.09 b1.09 ± 0.04 a8.25 + 0.29 b19.52 + 0.47 a12.58 + 0.34 b,c42.98 + 0.55 a41.62 + 0.73 b
Holetta-13.54 ± 0.09 a0.94 ± 0.02 b7.26 + 0.02 c18.60 + 0.25 b17.71 + 0.33 a39.17 + 0.62 c39.67 + 0.15 c
Means followed by different letters indicate significant differences at p = 0.05.
Table 2. Descriptive statistics summary of fatty acid profile and oil content of 96 carinata germplasms.
Fatty Acid or Oil ContentRange (%)Mean (%) ± SD
C16:0 (palmitic acid)2.47–3.843.18 ± 0.25
C18:0 (stearic acid)0.78–1.451.15 ± 0.11
C18:1(oleic acid)7.23–12.609.22 ± 1.15
C18:2 (linoleic acid)13.26–21.8116.93 ± 1.41
C18:3 (linolenic acid)9.68–22.6514.64 ± 2.70
C22:1 (erucic acid)34.93–48.1041.66 ± 2.56
OC (Oil content)26.89–48.2336.88 ± 4.96
SD, standard deviation.
Table 3. PCA analysis results of spectra with different pre-processing methods.
PretreatementPCA1 (%)PCA2 (%)Number of Outlier Samples
SNV + SG smoothing76.14.24
MSC + SG smoothing76.14.15
SNV + SGD152.327.20
MSC + SGD251.525.41
Table 4. Calibration and validation statistics of NIRS calibration models developed for fatty acid and oil content in carinata.
Fatty Acid and Oil ContentCalibration StaisticsValidation Statistics
R2calRMSECR2valRMSEPRPD
C16:0 (palmitic acid)0.640.130.780.122.1
C18:0 (stearic acid)0.670.050.750.062.0
C18:1(oleic acid)0.880.390.920.223.6
C18:2 (linoleic acid)0.900.450.890.273.2
C18:3 (linolenic acid)0.860.890.930.593.8
C22:1 (erucic acid)0.870.890.920.573.5
OC (oil content)0.930.820.931.413.6
SD, standard deviation; R2val, coefficient of determination; RMSEP, residual mean square of prediction; RPD, ratio of performance to deviation.
Disclaimer/Publisher’s Note: The statements, opinions and data contained in all publications are solely those of the individual author(s) and contributor(s) and not of MDPI and/or the editor(s). MDPI and/or the editor(s) disclaim responsibility for any injury to people or property resulting from any ideas, methods, instructions or products referred to in the content.