Article

Parameter Calibration for Discrete Element Simulation of the Interaction between Loose Soil and Thrown Components after Ginseng Land Tillage

1
College of Engineering and Technology, Jilin Agricultural University, Changchun 130118, China
2
College of Biological and Agricultural Engineering, Jilin University, Changchun 130021, China
*
Author to whom correspondence should be addressed.
Processes 2024, 12(2), 246; https://doi.org/10.3390/pr12020246
Submission received: 9 December 2023 / Revised: 18 January 2024 / Accepted: 19 January 2024 / Published: 24 January 2024

Abstract

:
Given the lack of accurate and reliable discrete element simulation parameters to study the interactions between soft soil and soil casting components after ginseng land cultivation in Northeast China and the design of ginseng land-specific borders, this paper calibrates the relevant model parameters of ginseng soil using the Hertz–Mindlin with JKR contact model in EDEM to standardize the contact parameters between soil particles and between soil and Q235 steel in soft soil after cultivation in ginseng land. Taking the soil particle accumulation angle as the response value, a Box–Behnken design (BBD) was introduced to establish a regression model for the soil accumulation angle; the surface energy, static friction coefficient, rolling friction coefficient, and coefficient of restoration parameters were obtained, respectively, through the optimization of the model, at which time, the simulated value of the soil accumulation angle was 37°, which is a 4% relative error to the actual measured accumulation angle of 35.5°. Taking the sliding friction angle of the soil on the Q235 steel plate as the response value, the regression model of the soil sliding friction angle was obtained based on the BBD. The static friction factor, rolling friction factor, and coefficient of restitution between the soil particles and the Q235 steel were obtained, respectively. Based on the combination of these parameters, the simulated value of the sliding friction angle was 32.2°, which is a 2% relative error to the measured accumulation angle of 31.5°. To verify the accuracy of the optimized simulation parameters, field and simulation tests of soil-throwing components were conducted. The results show that the maximum relative error between the measured value and the simulation value is 5.6% and 3.4%. The error is within an acceptable range, and the simulation test and field test soil-throwing effects are the same, which verifies the accuracy and reliability of the reference soil parameter calibration. The results of the study can be used for discrete element simulation analysis of the interaction between ginseng loam and touchdown components and their structural optimization.

Graphical Abstract

1. Introduction

Ginseng is known as the “king of all herbs” and the first of the famous “three treasures of the Northeast” and has always been regarded as a tonic and valuable traditional Chinese medicine; ginseng has been an important cash crop in the three northeastern provinces for many years and will continue to be so in the foreseeable future [1,2]. Before sowing ginseng, the soil needs to be tilled several times, with the stones removed. In addition, the soil must be rotary-plowed several times until the soil is soft and then manually sprinkled with water until the technical standards for ginseng planting are achieved. Therefore, the research and development of ginseng bedding and the special equipment used to reduce soil erosion and facilitate moisture preservation are crucial for the development of agriculture in the northeast region. In the design and development of ginseng border components, the interaction relationship between soil and soil-touching components can be analyzed via the discrete element method [3,4]. During the operation of a machine, the soil-touching components are in direct contact with the soil, and for different types of soil, their operating effects are significantly different. Therefore, to help provide a theoretical basis for the design and optimization of the ginseng border walker based on the discrete element method, it is necessary to study the simulation parameters of the ginseng soil discrete element model comprehensively and systematically [5].
In recent years, the discrete element method has been widely used in mining, agriculture, soil–mechanism interactions, mixing and grinding, and geotechnical engineering applications, and an increasing number of scholars are using discrete elements to design, optimize, and analyze discrete material handling systems and equipment [6]. At present, scholars worldwide have performed considerable research on the interaction aspects of soil-touching components and soil using this method. Junwei Li et al. [7] calibrated the parameters based on the Hertz–Mindlin with JKR cohesion model for clay-heavy black soils with different moisture contents and verified the contact parameters using stacking angle and slope test methods. Ma Shuai et al. [8] selected the hysteretic spring contact model (HSCM) and linear cohesion model (LCM) as the contact model between soil particles and calibrated the parameters of the discrete metamodel for cold-proof soils in northern grape-producing areas using a combination of physical and simulation tests. Song Shaolong et al. [9] chose the Hertz–Mindlin no-slip contact model as the contact model of soil and used the stacking method and slope method to optimally calibrate the parameters between the soil particles and between the layered fertilizer application devices to provide a reference for the parameter setting for the discrete element simulation of the soil of a post-tillage cotton field. Sun Jingbin et al. [5] chose the Hertz–Mindlin with JKR cohesion model as the contact model to calibrate the contact parameters of typical sloping soils on the Loess Plateau, as well as the contact parameters of soil particles and rotary knives. These results, combined with sloping rotary plowing field tests and simulation tests, were used to calibrate the discrete element parameters of sloping rotary plowing soils. Fangping Xie [10] calibrated all the contact parameters of soils that are cohesive and susceptible to plastic deformation based on the Edinburgh elasto-plastic adhesion (EEPA) model in response to axial strain, unconfined compressive strength, and nonlinear stress–strain characteristics of the soil in compression.
The above soils are mainly used for the calibration of the discrete elemental parameters of pre-tillage and clay–plastic soils. Because ginseng soils have been tilled many times, the degree of looseness has changed, and the soils are rich in humus and have a high water content. Therefore, the results of the above studies do not apply to the study of post-tillage soft soils of ginseng lands. Therefore, in this paper, the Hertz–Mindlin with JKR model was chosen as the contact model between the soils for the post-tillage soft soil of ginseng land with sandy loam texture in Northeast China. The contact parameters between the soils were calibrated by combining simulation tests of the stacking angle and physical tests, the contact parameters between the ginseng soils and the touching parts (Q235 steel) were calibrated by using soil sliding simulation tests and physical experiments, and comparative analysis of the field and simulation tests was conducted by a soil-throwing knife ridging operation to verify the calibrated and optimized simulation parameters and to further improve the accuracy of the rethrowing operation of the discrete element method. It is helpful to provide a theoretical basis for designing and optimizing ginseng soil-throwing parts based on discrete element method [8].

2. Materials and Methods

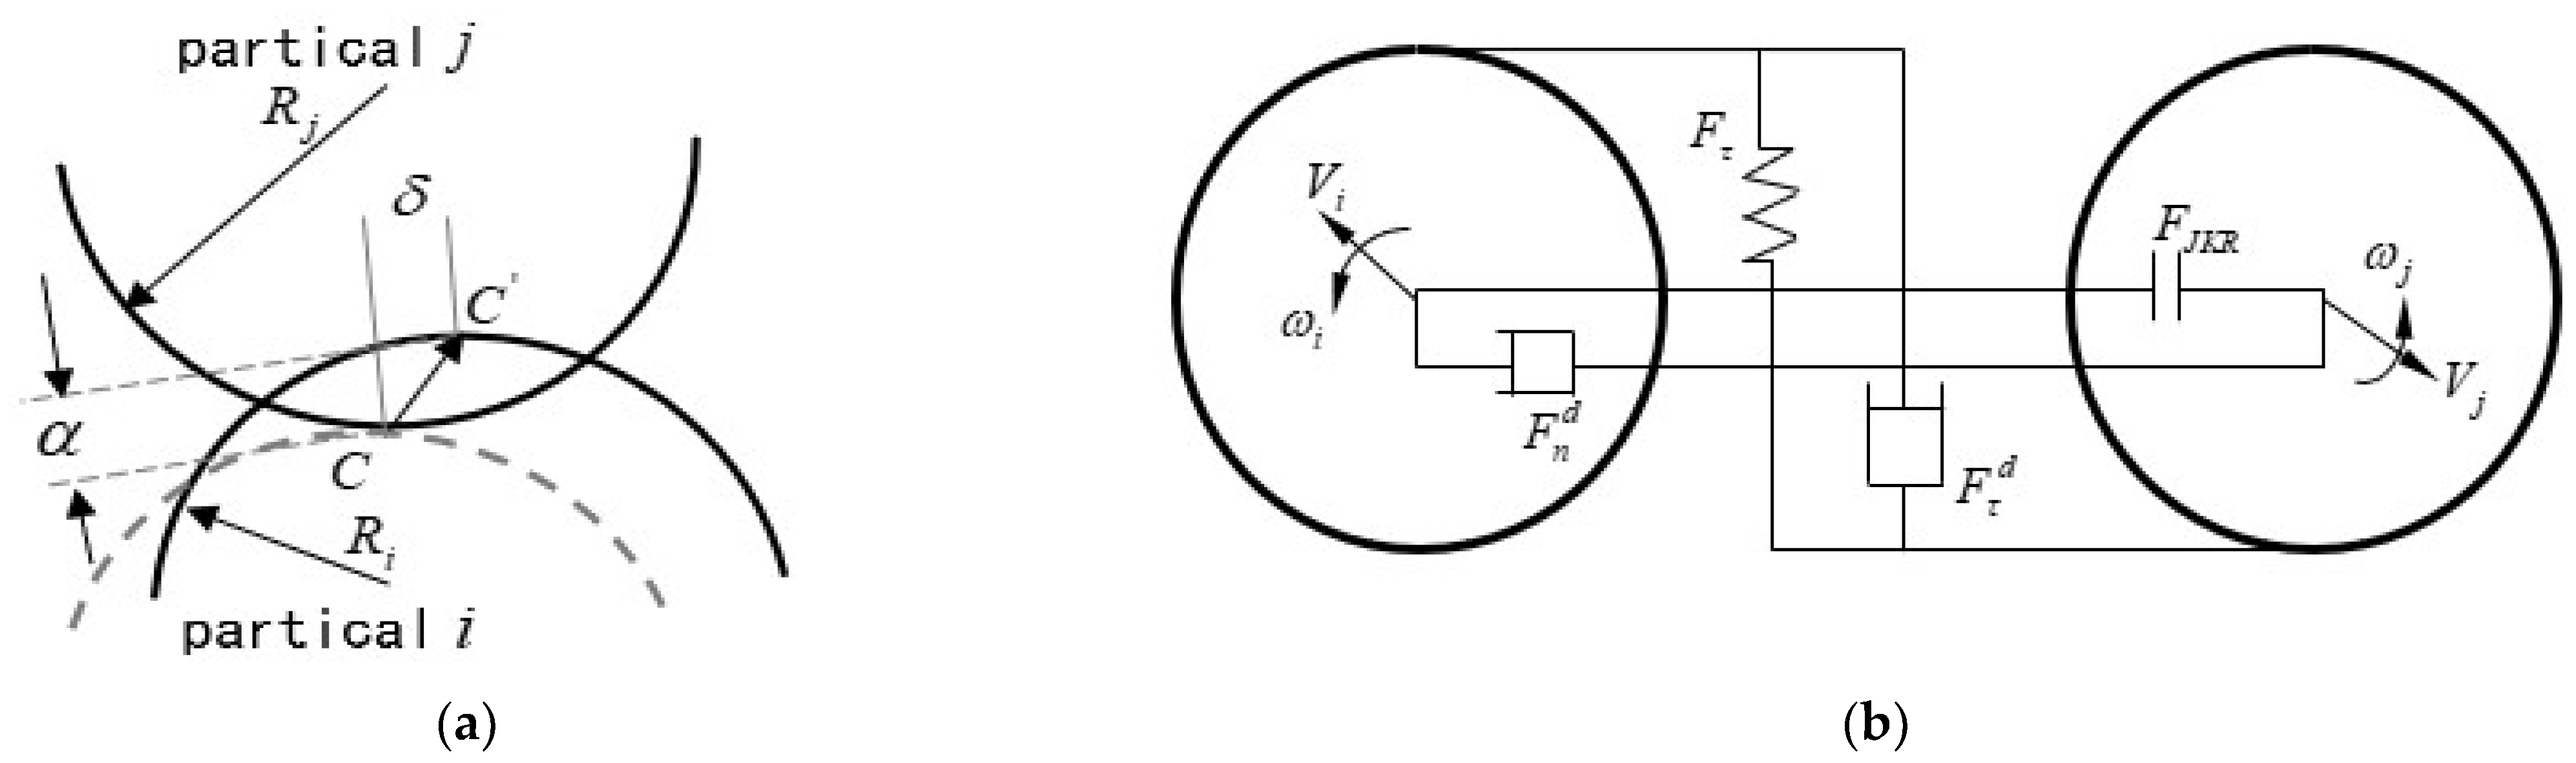
2.1. Selection of the Contact Model

For different soil texture types, EDEM2018 software provides different contact models; the most common models are the Hertz–Mindlin with bonding model, the Hertz–Mindlin no-slip model, the EEPA model, and the Hertz–Mindlin with JKR cohesion model. Among them, the Hertz–Mindlin with bonding model is suitable for simulating brittle materials, such as cemented materials and rocks; the Hertz–Mindlin model is suitable for cohesionless and incompressible materials; the EEPA model is appropriate for viscoelastic materials, such as cohesive soils and wet sands; and the JKR model is suitable for simulating viscous and wet soils with high moisture content [11,12,13,14]. The contact model is based on the discrete unit method, which directly affects the analysis and calculation of the magnitude of the forces and moments applied to the particles [15,16]. In this paper, ginseng soil in Jingyu County, Baishan city, Jilin Province was selected as the research object. The soil texture was sandy loam, and the soil was presented with a relatively high humidity and loose state through a series of operations, such as artificial sprinkling and plowing. During the machine operation process, the ginseng soil that interacts with the machine has a certain moisture content. The action of water causes interactions between soil particles due to forces such as Van der Waals forces and liquid bridge forces. The JKR model is a contact model for cohesive particles, which can be used to simulate the bonding between dry powders and wet particles and to characterize the bonding between particles based on the Hertz–Mindlin model by surface energy. Four forces act between adjacent soil particles during soil throwing and accumulation: normal elastic force, normal damping force, tangential elastic force, and tangential damping force. Among them, the normal elastic force can effectively characterize the viscoelastic properties between soil particles. The JKR model is shown in Figure 1 [17,18].
Based on the theory of the Hertz–Mindlin model, the mechanical analysis between soil particles is shown below:
(1) The normal elastic force of the JKR model is given as:
F J K R = 4 π γ E * α 3 2 + 4 E * 3 R * α 3
where FJKR is the normal elastic contact force and γ is the surface energy.
(2) The normal phase damping force for the JKR model is given as:
F n d = 2 5 6 β S n m * V n r e ¯ l
Among them,
S n = 2 E * R * α
1 E * = 1 v i 2 E i + 1 v j 2 E j
where Fnd denotes the normal damping force; Sn denotes the normal stiffness; Vnrel denotes the normal component of the relative velocity of the contact spheres; E* denotes the equivalent modulus of elasticity; and Ei and Ej are the equivalent elastic modulus of the two particles.
(3) Tangential elasticity of the JKR model:
F τ = S τ δ τ
where Fτ is the tangential elastic force and δτ is the tangential overlap.
The tangential force is related to friction; friction can be expressed by μr Fn, where μr denotes the coefficient of static friction and Fn denotes the normal force among soil particles.
Rolling friction is an important parameter for discrete element simulation; this can be explained in terms of torque on the contact surface as in the following equation:
T i = μ r F n R i ω i
where μr denotes the coefficient of rolling friction; Ri is the distance from the center of mass to the point of contact; and ωi is the unit angular velocity vector at the point of contact.
(4) The tangential damping force Fτd for the JKR model can be described by the following equation:
F τ d = 2 5 6 β S τ m * V τ r e ¯ l
The damping factor β can be described by the following equation:
β = ln e ln 2 e + π 2
The tangential stiffness Sτ can be described by the following equation:
S τ = 8 G * R * α
The equivalent shear modulus G* can be described by the following equation:
G * = 2 v i 2 G i + 2 v j 2 G j
The equivalent particle radius R* can be described by the following equation:
1 R * = 1 R i + 1 R j
The equivalent mass m* can be described by the following equation:
1 m * = 1 m i + 1 m j
In the above equation, Vrel is the tangential component of the relative velocity of the contacting particles; e is the coefficient of restitution; α is the normal overlap; Gi and Gj are the shear moduli of the two soil particles; Vi and Vj are the Poisson’s ratios of the two soil particles; Ri and Rj are the particle radii of the two soil particles; R* denotes the equivalent particle radius; and mi and mj denote the masses of the two particles.

2.2. Selection of Calibration Parameters

The discrete element simulation model parameters include material intrinsic parameters, contact parameters, and model parameters. Among them, the material intrinsic parameters include particle shape and size, density, shear modulus, and Poisson’s ratio, which are measured directly by experiments or obtained from the literature. The material contact parameters include static friction between particles, rolling friction, and the restitution coefficient, which can be directly determined experimentally or calibrated by simulation. The contact model parameter is mainly the JKR surface energy, and for ginseng soil with a high moisture content, the bond between particles is the main consideration, so the surface energy is used to characterize the bond between particles in the EDEM JKR model [7,16].
In situ soil samples were collected from the ginseng test field in Jingyu County, Baishan city, Jilin Province (42°22′ N, 126°47′ E). Soil samples were taken from a 0 to 30 cm depth of entry. The sieving method was used to measure the percentage of the grain size of ginseng soil samples, and the results showed that the percentage of soil with grain sizes of 0~2 mm, 2~4 mm, and greater than 4mm were 21.49%, 38%, and 45.51%, respectively, and that the soil texture belonged to sandy loam. In discrete element simulation, the multisphere method and particle size amplification method are regarded as simple, efficient, and cost-effective methods [19,20,21], so three-sphere and four-sphere particles are used to replace different shapes of soil particles to generate straight-line three-sphere particles, which accounted for 21.49% of the particles; triangular three-sphere particles accounted for 38%, and frontal body four-sphere particles accounted for 45.51%. The average moisture content of the soil layer from a 0 to 270 mm depth was measured as (23 ± 1%) by the oven drying method (KH-35AS drying box); the density of the soil was measured using the pycnometer method (volume 100 cm3) to extract the soil and an electronic balance (range 500 g, accuracy 0.01 g); the test was repeated 6 times for the average value, and 1061.4 kg/m3 was taken as the final parameter of the simulation. Referring to the literature [22], the Poisson’s ratio and shear modulus of the test soil samples were set to be 0.25 and 2.73 × 10⁶, respectively, the shear modulus of the Q235 steel plate was 7.92 × 10¹⁰, and Poisson’s ratio was 0.3.

2.3. Test Methods

In this paper, the contact parameters between soil and soil, and between soil and Q235 steel, are calibrated by combining physical test and EDEM simulation test. The simulation test and physical test of the soil–soil stacking angle are carried out by cylinder lifting method, and the optimal solution is obtained based on the principle of minimum error, to determine the contact parameters between soil and soil. Similarly, the slip test is used to carry out the simulation test and physical test of the sliding friction angle between soil and Q235 steel, and the optimal solution is obtained based on the principle of minimum error to determine the contact parameters between soil and Q235 steel.
(1)
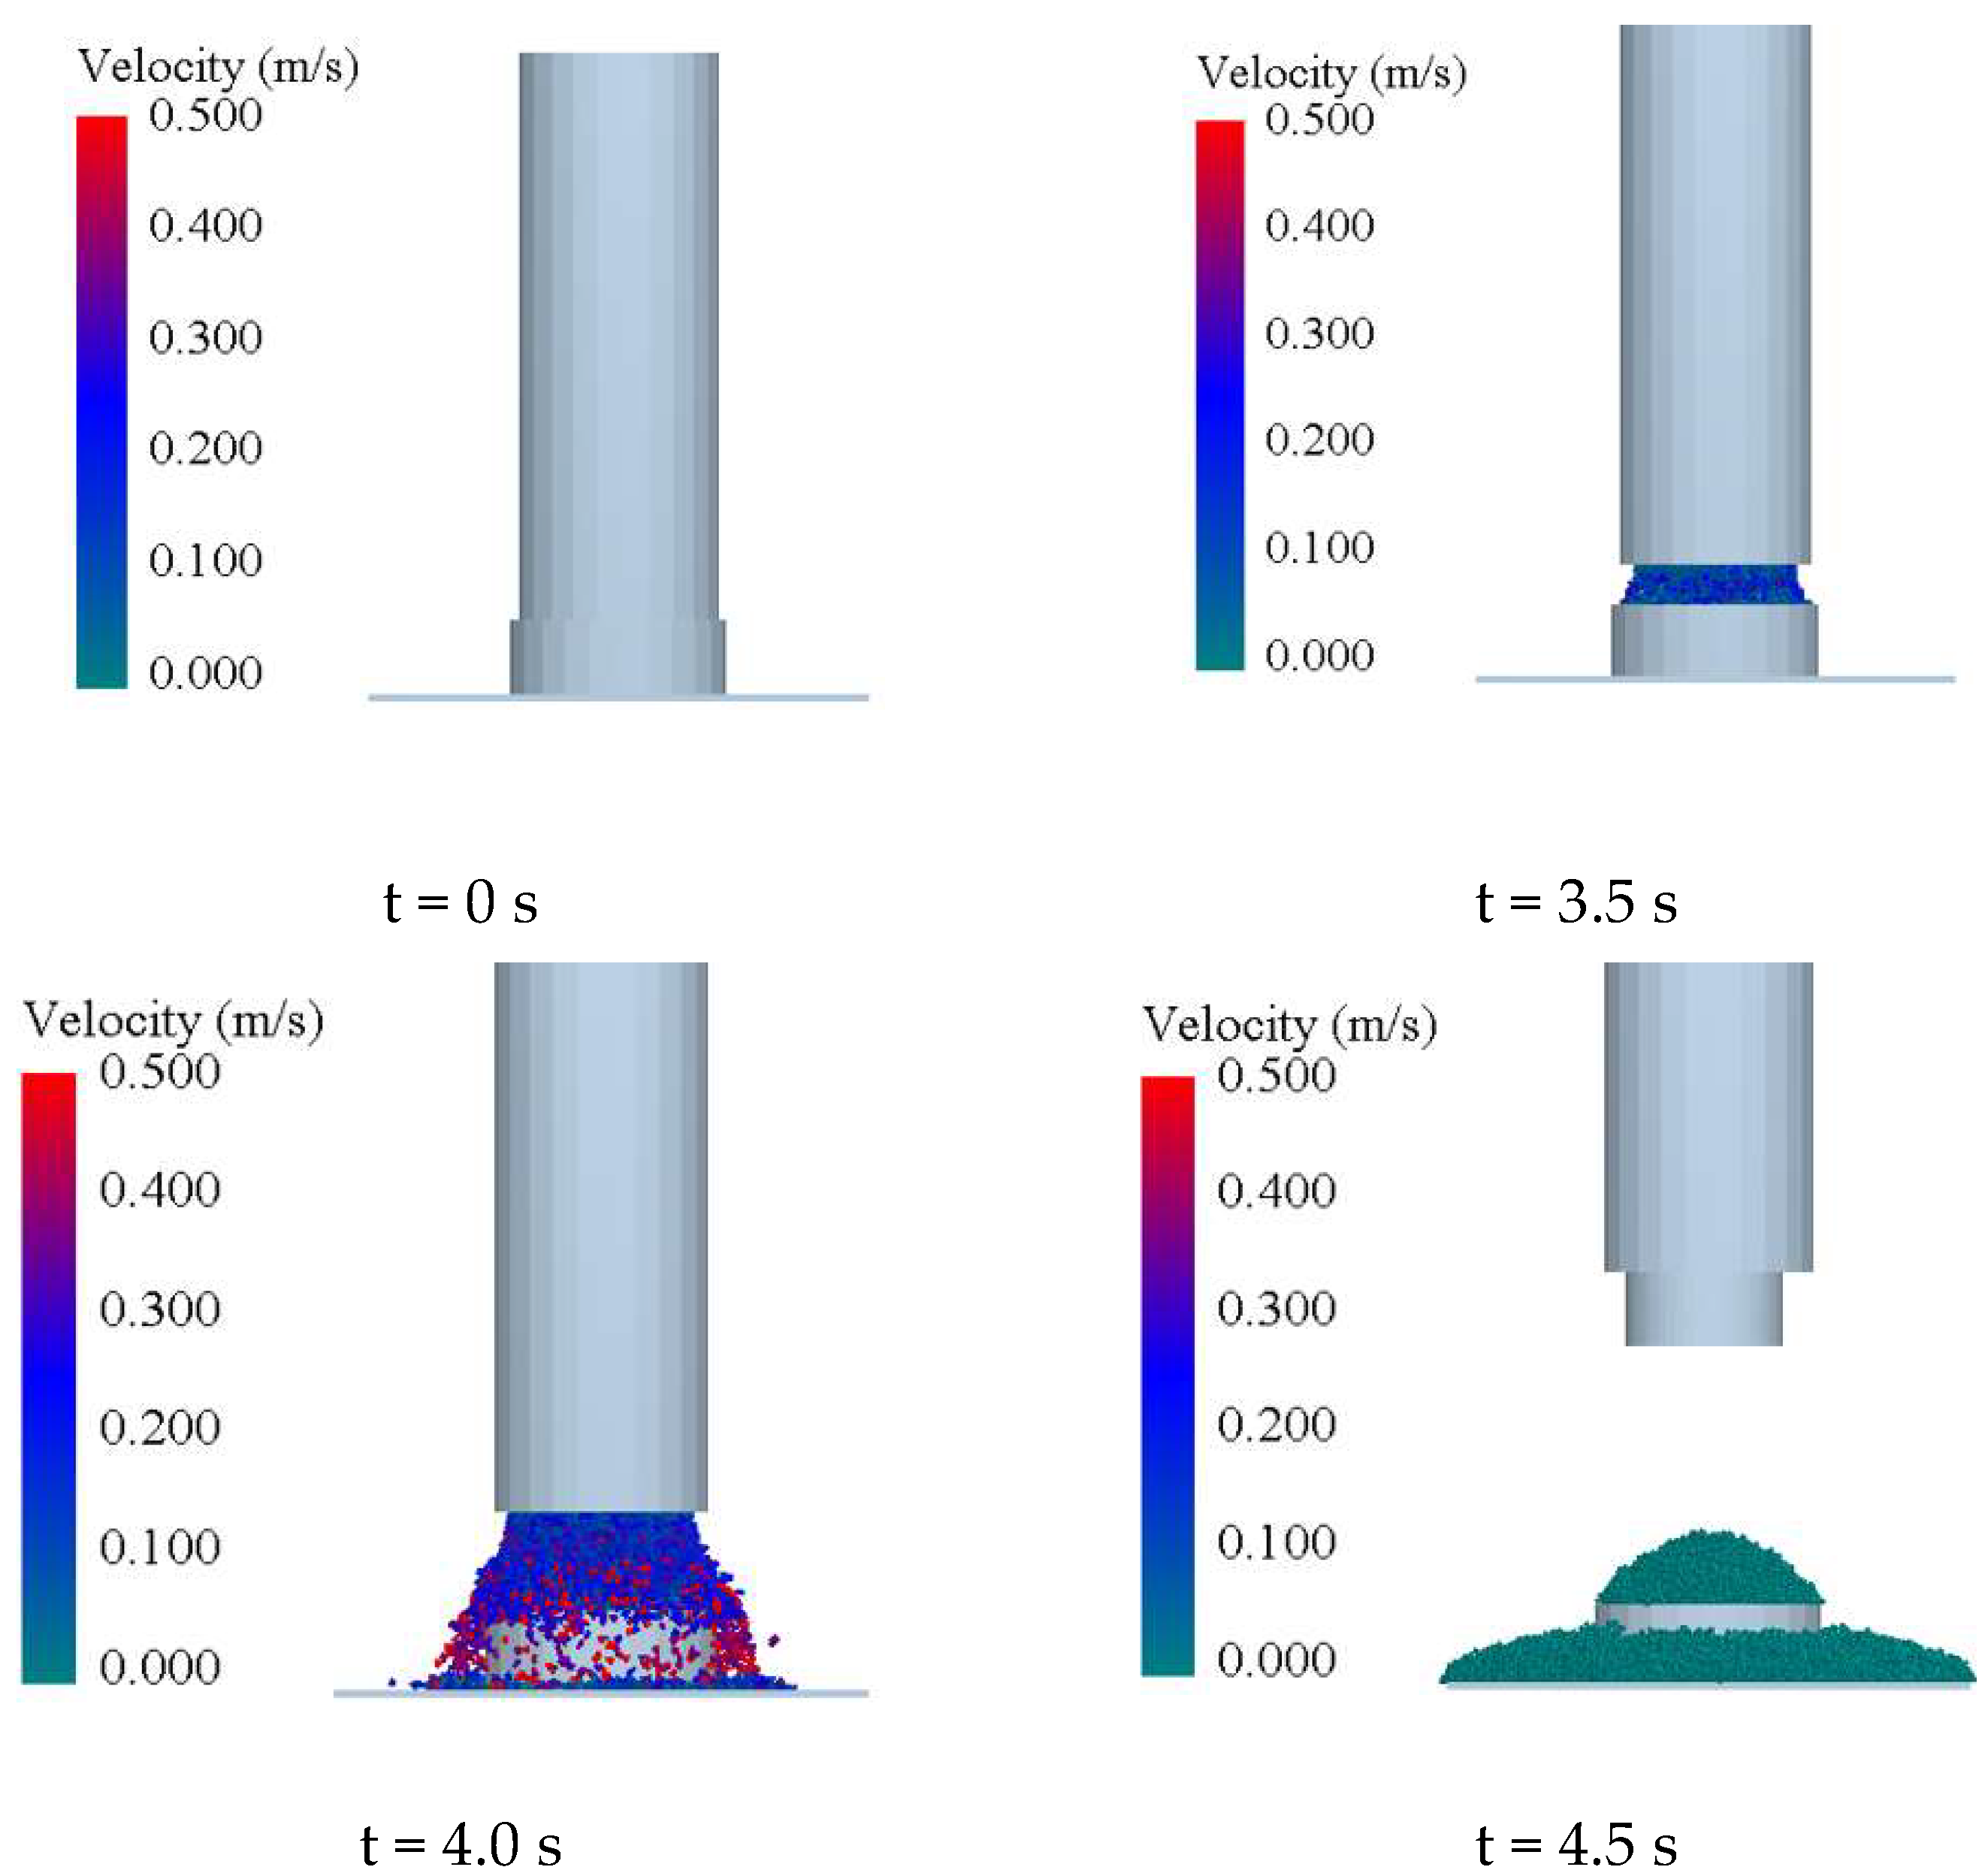
Soil accumulation test
The soil stacking angle simulation test was performed using EDEM2018 software based on Solidworks2018 software to establish a three-dimensional model of the test bench, as shown in Figure 2. The geometric dimensions and physical testing of the cylinder size were used to maintain consistency. The Hertz–Mindlin JKR model was selected as the contact model. The particle factory was used to randomly generate three kinds of spherical soil particles above the cylinder, in which the radius of the particles was 1 mm, and the total mass of the soil particles generated was 700 g. After waiting for the soil particles to pile up and stabilize underneath the cylinder, the screen was cut off vertically, the angles were determined from the X and Y directions of the stacking angle through the Protractor with Clipping tool of the EDEM postprocessing, and the average value was taken as the final simulation result.
(2)
Soil slip test
The inclined plane drawn with the 3D software SolidWorks was imported into EDEM software in STL format, and a soil particle factory was set up above the inclined plane. After setting the particle factory to produce 200 g of soil particles, the plane was rotated along the rotary axis with an angular velocity of 2°/s. When the soil particles just started to slide down the inclined plane, the simulation was stopped, a vertical screenshot of the inclined plane was taken, and the angle of the inclined plane at that moment was measured by Screen Protractor V4.0, a screen angle software. The soil slip simulation test is shown in Figure 3.

2.4. Experimental Design

According to the literature [5,7,22], the contact model parameters, namely the JKR surface energy X1 (0.1~0.3), coefficient of static friction X2 (0.32~1), coefficient of rolling friction X3 (0.01~0.3), and restitution coefficient X4 (0.1~0.5) were selected for the contact model between soil particles to conduct four-factor and three-level tests. The static friction coefficient r1 (0.1~0.6), rolling friction r2 (0.02~0.4), and restitution coefficient r3 (0.1~0.5) were selected for the contact model between soil and Q235 steel plate to conduct three-factor and three-level tests, and the soil–soil stacking angle Y1, and soil–Q235 steel plate sliding friction angle Y2 were selected as the evaluation indices. The design of the following Box–Behnken design (BBD) simulation test factor level coding is shown in Table 1 and Table 2.

3. Simulation Results and Analysis

3.1. Soil Accumulation and Sliding Simulation Test Results

Design-Expert 10.0.4.0 was applied to process and analyze the experimental data, and the results of the stacking angle and sliding simulation tests are shown in Table 3 and Table 4, respectively.

3.2. Analysis of Simulation Results

Design-Expert 10.0.4.0 software was applied to perform analysis of variance (ANOVA) and multiple regression fitting on the stacking angle test data, and the ANOVA tables for the stacking angle Y1 and sliding friction angle Y2 are shown in Table 5. Multiple regression models for the stacking angle and sliding friction angle were established and tested for significance.
As shown in Table 5, the response surface regression models of the stacking angle and sliding friction angle p < 0.01, indicating that the regression model is highly significant. The coefficients of determination of the two models, R2, were 0.83 and 0.99, and the precision was 8.03 and 87.3, which were greater than 4. This indicates that the accuracy of the two regression models was satisfactory and that the prediction of the stacking angle and the sliding friction angle could be carried out according to the regression model. The regression term X3 has a highly significant effect on the stacking angle, the quadratic terms X12 and X32 have a significant effect, and the remainder of the interaction terms and linear and quadratic terms have a nonsignificant effect on the stacking angle. The static friction factor r1 has a highly significant effect on the sliding friction angle, the rolling friction r2 and the restitution coefficient r3 have a nonsignificant effect on the sliding friction angle, the interaction terms have a nonsignificant effect, and the quadratic term r12 has a highly significant effect. From the absolute magnitude of the coefficients of the regression equation, the order of significance of the effect of each factor on the modeled stacking angle and sliding friction angle was obtained: X3 > X4 > X2 > X1, r1 > r2 > r3.
Y 1 = 45.48 + 0.7508 X 1 0.8075 X 2 + 4.72 X 3 1.25 X 4 + 1.65 X 1 X 2 0.06 X 1 X 3 + 2.29 X 1 X 4 + 1.13 X 2 X 3 + 0.7725 X 2 X 4 2.69 X 3 X 4 + 5.34 X 1 2 + 1.92 X 2 2 5.12 X 3 2 0.0767 X 4 2
Y 2 = 20.76 + 12.04 r 1 0.1375 r 2 0.05 r 3 + 0.15 r 1 r 2 + 0.275 r 1 r 3 0.025 r 2 r 3 0.955 r 1 2 0.005 r 2 2 + 0.27 r 3 2
where X1, X2, X3, and X4 are the level codes of the soil–soil surface energy, static friction, rolling friction, and restitution coefficient, respectively; r1, r2, and r3 are the level codes of the static friction, rolling friction, and restitution coefficient of the soil particles–Q235 steel plate, respectively; Y1 is the soil–soil stacking angle; and Y2 is the soil–Q235 steel plate sliding friction angle.

4. Calibration Parameter Determination and Experimental Verification

4.1. Optimal Calibration Parameter Determination

(1)
Determination of the stacking angle
The calibration of contact parameters between soil particles is conducted via the soil stacking test, and the actual stacking angle of the soil is determined by the cylinder lifting method before calibration [23,24]. The soil has a moisture content of 23 ± 1%, the test device consists of a cylinder (diameter of 70 mm, height of 220 mm), as shown in Figure 4, a soil accumulation steel plate, a steel plate ruler, a camera, and other components. The test cylinder has an upward lifting speed of 0.1 m/s, the stacking plate is Q235 steel, the cylinder lifting soil falls into the stacking steel plate, and the stacking angle is formed. After all the soil flowed out and was still, photographs were taken of the pile shape shot vertically from the five directions to measure the average value of the stacking angle as the measurement value of one test. After 10 repetitions of each set of tests, the pile angle of soil with a 23% moisture content was 35.5°.
(2)
Determination of the soil sliding friction angle
The calibration of soil–Q235 steel contact parameters is based on the soil inclined plane slip test [25,26], which mainly determines the sliding friction angle between soil and Q235 steel; it also provides a reference for contact parameter calibration. The test device mainly consists of a homemade slope and inclinometer (resolution: 0.1°, accuracy: ±0.2°), in which the inclined material is Q235 steel. The soil samples in the field test area were placed on the slope, and the inclination angle of the inclined plane was adjusted by the motor drive. The soil on the inclined plane began to slide when a certain angle was reached, the motor drive was stopped, the value of the inclination angle of the inclined plane at this time was read out, and the angular value at this time was the sliding friction angle between the soil and the Q235 steel, as shown in Figure 5. The test was repeated 10 times, taking the average value as the sliding friction angle between the soil and Q235 steel, that is, 31.5°.
The measured soil stacking angle and sliding friction angle results were inserted into Equations (1) and (2), respectively, to obtain multiple sets of optimized solutions. The set of soil parameters for which the simulation test stacking angle and sliding friction angle were closest to the physical measurements were selected. Therefore, the soil model parameters needed in the field simulation test are shown in Table 6.

4.2. Physical Test Verification
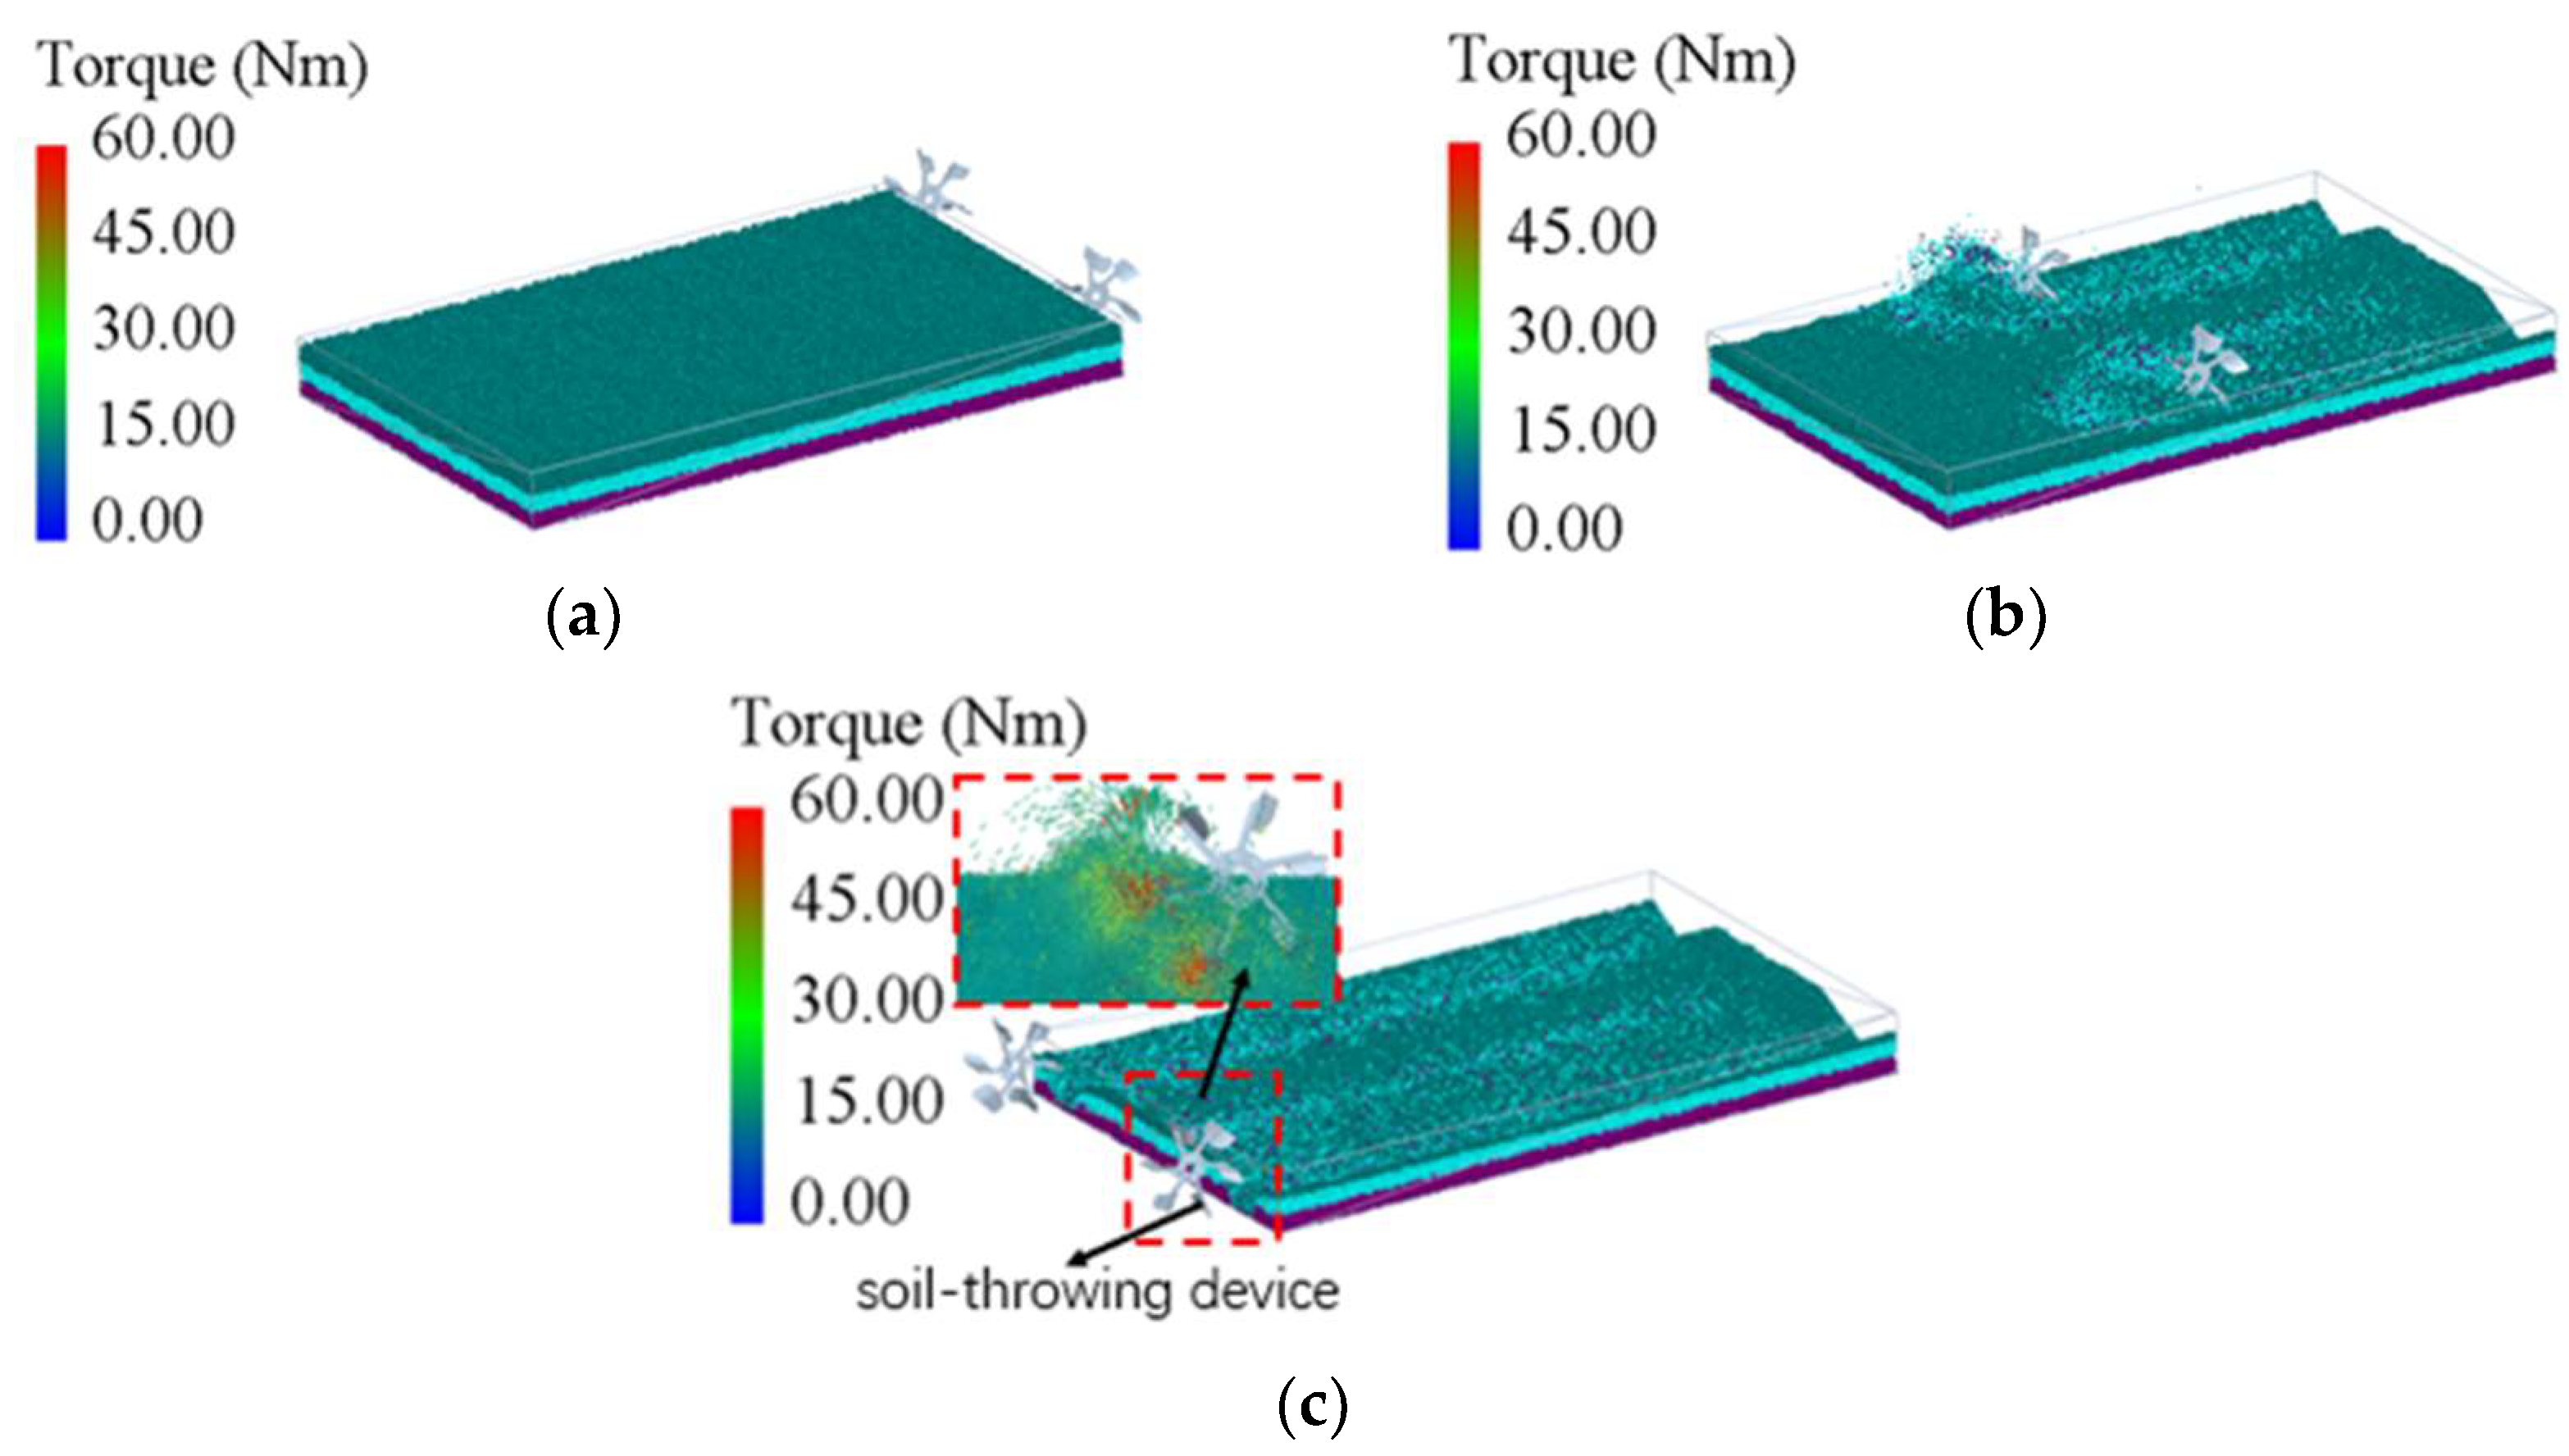
To verify the accuracy of the calibrated soil contact parameters, the values of the soil contact parameters after the test calibration were imported into EDEM software to simulate the soil stacking test and sliding test, to measure the stacking angle of the soil and the sliding friction angle between the soil and the Q235 steel, and to compare the results with those of the physical tests of the stacking angle and the sliding friction angle, as shown in Table 7.
As shown in Table 7, the errors of the simulated stacking angle and soil sliding friction angle after calibration of the soil contact parameters and the actual physical test results are 4% and 2%, respectively, and the simulated stacking angle and sliding friction angle after optimized calibration are very close to the actual test values.

5. Field Trials

5.1. Preparation of Test Conditions

The main equipment used in the field test included the following: a Kubota M954(G4) tractor, a ginseng seedbed ridger, a steel plate ruler, a tape measure, aluminum blocks, a marker, and a soil firmness meter (model: TYD-2 Zhejiang Top Instrument Co., Ltd., Hangzhou, China), and flags. The experiment was carried out in a special test field in the Agricultural Machinery Laboratory of Jilin Agricultural University. First, the water content suitable for ginseng planting is shaped on the land where ginseng has been planted by rotary tillage and where artificial watering and other processes have been carried out many times; the soil firmness was determined by a firmness meter with a range of (38~51.8 kPa).

5.2. Field Trials

During the soil-throwing operation of the machine, the soil was displaced by the disturbing action of the throwing knife, and this displacement was used to characterize the interactions between soil particles and the soil and the touching parts [27]. Therefore, in this study, aluminum blocks were used as soil tracers to track soil displacement, as established in the literature [28]. First, each soil tracer was dyed cyan, blue, and purple and numbered with a marker pen, and then the tracers were arranged in the three soil layers. That is, 18 tracers were buried in each of the three layers, namely 0~50 mm in the surface layer, 50~100 mm in the middle layer, and 100~150 mm in the deeper layer, and by using the burial scheme of Figure 6a. Flags were placed at the initial 2D coordinates of the tracers. Next, the soil-throwing operation was carried out using the team’s self-developed ginseng seedbed ridger supporting tractor (Kubota M954(G4)). The working conditions of the tractor were as follows: a knife shaft speed of 250 r/min, an operating speed of 1km/h, and a depth of entry into the soil of 160 mm. Finally, all the tracers were tracked manually, the final 2D coordinates were measured and recorded with a coordinate measuring frame, and the absolute difference between the final 2D coordinates and the initial 2D coordinates of each tracer was taken to obtain the displacement of the tracers in the vertical and horizontal directions. The average of the absolute differences of the tracer displacements for each soil layer was taken as the final result [29].

5.3. Simulation Test Verification

To further verify the accuracy of the soil contact parameters, EDEM software was again used to simulate the soil-throwing operation process. The forward speed of the soil-throwing device of the ginseng border walker was set to 1 km/h, the speed of the soil-throwing knife shaft was set to 250 r/min, the depth of entry to the soil was set to 160 mm, the simulation time step was set to 1 × 10⁻⁵, the simulation time was set to 20 s, the data saving interval was set to 0.01 in the EDEM solving module, and the simulated operation state of the soil-throwing device in EDEM is shown in Figure 7.
Postprocessing analysis was based on the Analyst module. Within the width of the ginseng seedbed ridger, different depths of soil layers were set up, namely the shallow layer (the particles in the range of 0~50 mm were set as cyan), the middle layer (the particles in the range of 50~100 mm were set as blue), and the deep layer (the particles in the range of 100~150 mm were set as purple). Based on the “Export Results Data”, the mean values of the coordinates of the particles of each color in the vertical (X-axis) and horizontal (Y-axis) directions before and after the simulation were exported, and the difference in the mean values was used to obtain the displacement of the soil along the vertical and horizontal directions in the three different depth ranges.

5.4. Test Results and Analysis

In the field test, according to the coordinate position of the soil tracer before and after the completion of the soil-throwing operation, the average value of the tracer displacement in the depth range of each soil layer is calculated. The displacement of the deep soil is larger than that of the middle and shallow layers because of the stable work of the soil-throwing knife, and the deeper the depth of the soil is, the greater the linear velocity, so the farther the soil is thrown. The results obtained from the simulation test are the same as those obtained from the test. In addition, no matter what the soil depth is, the soil displacement along the machine direction (vertical direction) is always greater than the lateral (horizontal direction) displacement; the lateral soil displacement is thrown on the border, a very small amount of soil is thrown back to the soil or falls into the other side of the ditch, and the lateral soil displacement meets the agronomic requirements.
To verify the feasibility of the calibrated discrete element simulation contact parameters, the horizontal and vertical soil displacements of the three layers obtained from the field test and simulation were compared (Figure 8).
According to Figure 8a, the relative errors of the horizontal displacement of soil particles are 1.2% for surface soil, 5.6% for middle soil, and 2.8% for deep soil, and according to Figure 8b, the relative errors of the vertical displacement of soil particles are 1.8% for surface soil, 3.4% for middle soil, and 2.2% for deep soil.

6. Conclusions

(1) The surface energy, static friction coefficient, rolling friction coefficient, and restitution coefficient between soil particles are taken as test factors; the stacking angle is taken as the evaluation index; the regression model of stacking angle is obtained according to the Box–Behnken optimization method in Design-Expert; and the optimization is carried out to obtain the surface energy, static friction coefficient, rolling friction coefficient, and restitution coefficient of soil, which are 0.2 J/m2, 0.596, 0.01, and 0.207, respectively; the simulation result of the stacking angle under the optimal combination is 37°, and the relative error with the result of the physical test of 35° is 4%.
(2) Ginseng soil with 23% moisture content was used as the research object, and the ranges of the static friction coefficient, rolling friction coefficient, and restitution coefficient between soil and Q235 steel were obtained through pre-experiments and references. With the above three factors as the test factors and the sliding friction angle of the soil as the evaluation index, the regression model of the sliding friction angle of the soil was obtained based on the Box–Behnken optimization method in Design-Expert, and the actual sliding friction angle was used as the evaluation index for optimization, and the static friction coefficient, rolling friction coefficient, and restitution coefficient between the soil particles and the Q235 steel are 0.589, 0.146, and 0.369, respectively, and the sliding friction angle under the optimal combination is simulated as 32.2°, with a relative error of 2% compared with that of the physical test result of 31.5°.
(3) Through the comparative analysis of field tests and simulation tests, the maximum errors of horizontal and vertical displacements of soil particles were obtained to be 5.6% and 3.4%, respectively, which were within the permissible range of error, indicating that the parameters of the calibrated discrete element simulation model were accurate and reliable.

Author Contributions

Conceptualization, K.D. and Y.G.; methodology, K.D. and Y.G.; software, K.D., M.L. and Y.W.; validation, K.D., W.F. and P.W.; formal analysis, P.W.; investigation, Y.G.; resources, Y.N.; data curation, D.F. and K.D.; writing—original draft preparation, K.D.; writing—review and editing, Y.G.; visualization, L.C.; supervision, J.W.; project administration, J.W.; funding acquisition, Y.G. and J.W. All authors have read and agreed to the published version of the manuscript.

Funding

This research was funded by the [Task Book of Major Science and Technology Special Project in Jilin Province], with the title of [Research and demonstration application of key technologies of ginseng variety breeding and its propagation], with the number of [20230304001YY]; Task book of major science and technology special project (sub-project) in Jilin Province, with the title of [Ginseng (American Ginseng) research and demonstration of key technologies and supporting machinery for continuous cropping bed soil improvement in farmland], with the number of [20200504003YY].

Data Availability Statement

Data are contained within the article.

Acknowledgments

In this paper, we received technical support from the College of Biological and Agricultural Engineering at Jilin University, including the Licensed software of EDEM and the coupling interface.

Conflicts of Interest

The authors declare no conflicts of interest.

References

  1. Wang, X. Jilin Ginseng Industry Optimization and Upgrading Development Space Is Huge. Economic Reference News, 7 June 2023. [Google Scholar] [CrossRef]
  2. Zhang, J. Analyzing the strategy to achieve leapfrog development of ginseng industry in Jilin Province. South. Agric. 2019, 13, 123+127. [Google Scholar] [CrossRef]
  3. Milkevych, V.; Munkholm, L.J.; Chen, Y.; Nyord, T. Modeling approach for soil displacement in tillage using discrete element method. Soil Tillage Res. 2018, 183, 60–71. [Google Scholar] [CrossRef]
  4. Jia, H.L.; Wang, W.P.; Chen, Z.; Zheng, T.Z.; Zhang, P.; Zhuang, J. Current status and prospect of research on optimization of soil-touching components of agricultural machinery. J. Agric. Mach. 2017, 48, 1–13. [Google Scholar]
  5. Sun, J.; Liu, Q.; Yang, F.; Liu, Z.; Wang, Z. Calibration of discrete element simulation parameters for soil and rotary ploughing component interactions on slopes of the Loess Plateau. J. Agric. Mach. 2022, 53, 63–73. [Google Scholar]
  6. Coetzee, C.J. Calibration of the discrete element method. Powder Technol. 2017, 310, 104–142. [Google Scholar] [CrossRef]
  7. Li, J.W.; Tong, J.; Hu, B.; Wang, H.; Mao, C.; Ma, Y. Calibration of discrete element simulation parameters for the interaction between clay-heavy black soil and touchdown components with different water content. J. Agric. Eng. 2019, 35, 130–140. [Google Scholar]
  8. Ma, S.; Xu, L.; Yuan, Q.; Niu Cong Zeng, J.; Chen, C.; Wang, S.; Yuan, X. Calibration of parameters for discrete element simulation of grapevine cold-proof soil interacting with soil-clearing components. J. Agric. Eng. 2020, 36, 40–49. [Google Scholar]
  9. Song, S.; Tang, Z.; Zheng, X.; Liu, J.; Meng, X.; Liang, Y. Calibration of discrete elemental parameters of a post-tillage soil model for cotton fields in Xinjiang. J. Agric. Eng. 2021, 37, 63–70. [Google Scholar]
  10. Xie, F.; Wu, Z.; Wang, X.; Liu, D.; Wu, B.; Zhang, Z. Calibration of soil discrete element parameters based on unconfined compressive strength test. J. Agric. Eng. 2020, 36, 39–47. [Google Scholar]
  11. Yuan, J. Simulation Analysis and Experimental Research on the Operation Process of Self-Excited Vibration Deep Pine Machine Based on DEM-MBD Coupling; Jilin University: Changchun, China, 2022. [Google Scholar] [CrossRef]
  12. Yan, D. Soybean Seed Particle Modelling and Simulation Analysis and Experimental Research on Seed Casting and Mulching Compaction Process; Jilin University: Changchun, China, 2021. [Google Scholar] [CrossRef]
  13. Johnson, K.L.; Kendall, K.; Roberts, A.D. Surface energy and contact in elastic solids. Proc. R. Soc. Lond. A Math. Phys. Sci. 1971, 324, 301–313. [Google Scholar]
  14. Hu, G.-M. Analytical Simulation of Granular Systems by Discrete Element Method—An Introduction to Industrial Applications of Discrete Element Method and Edem Software; Wuhan University of Technology Press: Wuhan, China, 2010. [Google Scholar]
  15. Guan, C. Basic Research on the Technology of Double-Axis Layered Rotary Ploughing and Soil Breaking and Ridging; Jiangsu University: Zhenjiang, China, 2021. [Google Scholar] [CrossRef]
  16. Tian, X. Research on the Technology of Corn Stalk Mixed Burying and Returning to the Field in Black Soil Area and Its Supporting Key Components; Jilin University: Changchun, China, 2022. [Google Scholar] [CrossRef]
  17. Yang, T. Analysis of Interaction between Elastic Wheels and Soft Ground Based on Discrete Element Method; Jilin University: Changchun, China, 2021. [Google Scholar]
  18. Xia, R.; Li, B.; Wang, X.; Li, T.; Yang, Z. Measurement and calibration of discrete elemental parameters of wet bulk coal. Measurement 2019, 142, 84–95. [Google Scholar] [CrossRef]
  19. Franco, Y.; Rubinstein, D.; Shmulevich, I. Determination of discrete element model parameters for soil-bulldozer blade interaction. In Proceedings of the 15th International Conference of the ISTVS, Hayama, Japan, 25–29 September 2005; pp. 25–29. [Google Scholar]
  20. Asaf, Z.; Shmulevich, I.; Rubinstein, D. Predicting soil-rigid wheel performance using distinct element methods. Trans. ASABE 2006, 49, 607–616. [Google Scholar] [CrossRef]
  21. Tamas, K.; Bernon, L. Role of particle shape and plant root system in discrete element modelling of soil-sweep interaction. Biosyst. Eng. 2021, 211, 77–96. [Google Scholar] [CrossRef]
  22. Xu, T.; Zhang, R.; Wang, Y.; Jiang, X.; Feng, W.; Wang, J. Simulation analysis of the mulching and compaction operation process of precision seeding unit based on the coupled model of DEM and MBD. Processes 2022, 10, 1103. [Google Scholar] [CrossRef]
  23. Zhang, J.; Zhang, P.; Zhang, H.; Tan, C.; Wan, W.; Wang, Y. Study on the Parameter Calibration of Discrete Element Simulation of Cotton Straw in Xinjiang. J. Agric. Mach. pp. 1–10. Available online: http://kns.cnki.net/kcms/detail/11.1964.s.20231115.1136.012.html (accessed on 25 December 2023).
  24. Zhou, H.; Che, H.; Geng, D.; Zhou, H.; Che, H.; Geng, D.; Chen, M.; Zhang, Y. Establishment of discrete element model and parameter calibration of typical soil in cornfield. J. Agric. Mach. 2023, 54, 49−60+113. [Google Scholar]
  25. Zhang, X.; Yang, Y.; Liu, H.; Liu, J.; Zhang, Z.; Cao, S. Design and test of double-fixed knife sliding-cutting anti-winding banana stalk crushing and returning machine. J. Agric. Mach. pp. 1–17. Available online: http://kns.cnki.net/kcms/detail/11.1964.S.20231213.1343.008.html (accessed on 25 December 2023).
  26. Li, X.; Liao, Q.; Wang, L.; Li, M.; Du, W. Design and test of the perforated wheel of the high-speed pneumatic collector for rice, wheat and oil. J. Agric. Eng. 2023, 39, 35–48. [Google Scholar]
  27. Fang, H.; Ji, C.; Chandio, F.A.; Guo, J.; Zhang, Q.; Arslan, C. Analysis of soil kinematic behaviour during rotary ploughing based on discrete element method. J. Agric. Mach. 2016, 47, 22–28. [Google Scholar]
  28. Zeng, Z.; Ma, X.; Chen, Y.; Qi, L. Modelling residue incorporation of selected chisel ploughing tools using the discrete element method (DEM). Soil Tillage Res. 2020, 197, 104505. [Google Scholar] [CrossRef]
  29. Ding, Q.; Ren, J.; Adam, B.E.; Zhao, J.; Ge, S.; Li, Y. Discrete meta-analysis of deep loosening process in wet clay rice soil. J. Agric. Mach. 2017, 48, 38–48. [Google Scholar]
Figure 1. DEM contact model for Hertz–Mindlin elastic/dissipative contact. (a) Contact displacement between particles. (b) Normal and tangential force–displacement DEM model.
Processes 12 00246 g001
Figure 2. Simulation test of stacking angle test.
Processes 12 00246 g002
Figure 3. Simulation test of soil sliding.
Processes 12 00246 g003
Figure 4. Physical experiment of soil accumulation.
Processes 12 00246 g004
Figure 5. Physical test of sliding friction angle.
Processes 12 00246 g005
Figure 6. Field test. 1. Kubota M704 tractor 2. Soil-throwing device 3. Aluminum blocks 4. Steel plate ruler. (a) Burying scheme of soil tracer. (b) Tractor border-making machine set. (c) Experimental system of soil displacement.
Processes 12 00246 g006
Figure 7. Trenching operation process of soil-throwing device. (a) Before the machine works. (b) While the machine is working. (c) After the machine works.
Processes 12 00246 g007
Figure 8. Movement and displacement of soil in different positions. (a) Horizontal displacement of soil particles. (b) Vertical displacement of soil particles.
Processes 12 00246 g008
Table 1. Coding of simulation test factors of soil accumulation angle.
Factor
CodeJKR Surface EnergySoil–Soil Static
Friction Coefficient
Soil–Soil Rolling
Friction Coefficient
Soil–Soil Restitution Coefficient
X1/(J·m−2)X2X3X4
−10.10.320.010.1
00.20.660.1550.3
10.310.30.5
Table 2. Coding of factors in soil sliding simulation test.
Factor
CodeSoil–Q235 SteelSoil–Q235 SteelSoil–Q235 Steel
Static Friction
Coefficient r1
Rolling Friction
Coefficient r2
Restitution
Coefficient r3
−10.10.020.1
00.350.210.3
10.60.40.5
Table 3. Design and results of simulation test scheme for soil repose angle.
Factor
NO.JKR Surface EnergySoil–Soil Static
Friction Coefficient
Soil–Soil Rolling Friction
Coefficient
Soil–Soil
Restitution
Coefficient
Repose
AngleY1/
X1/(J·m−2)X2X3X4(°)
10.310.1550.354.6
20.10.660.30.346.5
30.110.1550.349.8
40.20.320.010.340
50.20.660.30.152.3
60.30.660.1550.553.65
70.30.320.1550.353.2
80.20.660.1550.344.73
90.20.320.30.349.7
100.10.660.1550.550.34
110.10.320.1550.355
120.30.660.30.350.65
130.20.660.010.139.7
140.210.30.349.4
150.10.660.1550.155
160.20.660.1550.345
170.20.660.30.536.3
180.10.660.010.337.25
190.30.660.010.341.64
200.20.660.1550.345
210.30.660.1550.149.16
220.20.660.1550.346.45
230.20.320.1550.546.64
240.210.1550.547.8
250.20.320.1550.145
260.210.1550.143.07
270.20.660.010.534.46
280.210.010.335.18
290.20.660.1550.346.22
Table 4. Scheme and results of soil sliding simulation test.
Factor
NO.Soil–Q235 SteelSoil–Q235 SteelSoil–Q235 SteelSliding Friction
Static Friction Coefficient r1Rolling Friction Coefficient r2Restitution Coefficient r3Angle
Y2/(°)
10.10.210.18.4
20.60.210.532.3
30.10.020.37.9
40.350.40.520.7
50.60.40.332
60.350.210.321
70.350.40.121
80.10.210.57.9
90.350.020.521.1
100.350.210.320.6
110.350.210.320.8
120.350.210.320.4
130.350.020.121.3
140.10.40.37.4
150.350.210.321
160.60.210.131.7
170.60.020.331.9
Table 5. Variance analysis of regression model of soil accumulation angle and sliding friction angle.
VarianceSum ofDegree ofMeanFP
SourceSquaresFreedomSquare
Model832.421459.464.800.0029
X16.7716.770.54620.4721
X27.8217.820.63180.4400
X3267.151267.1521.570.0004
X418.85118.851.520.2376
X1X210.89110.890.87930.3643
X1X30.014410.01440.00120.9733
X1X420.93120.931.690.2146
X2X35.1115.110.41240.5311
X2X42.3912.390.19270.6674
X3X428.94128.942.340.1486
X12185.281185.2814.960.0017
X2223.90123.901.930.1865
X32169.981169.9813.720.0024
X420.038110.03810.00310.9565
Pure Error2.5140.6280
Cor Total1005.8228
Model1163.839129.312107.57<0.0001
r11159.2111159.2118,892.85<0.0001
r20.151310.15132.470.1604
r30.020010.02000.32600.5859
r1r20.090010.09001.470.2651
r1r30.302510.30254.930.0618
r2r30.002510.00250.04070.8458
r123.8413.8462.59<0.0001
r220.000110.00010.00170.9681
r320.306910.30695.000.0604
Pure Error0.272040.0680
Cor Total1164.2616
Table 6. Calibration results of soil parameters.
Simulation Test ParametersValue
JKR surface energy 0.2
Soil–soil static friction coefficient0.596
Soil–soil rolling friction coefficient0.01
Soil–soil restitution coefficient0.207
Soil–Q235 steel static friction coefficient0.589
Soil–Q235 steel rolling friction coefficient0.146
Soil–Q235 steel restitution coefficient0.369
Table 7. Comparison of test results.
ParameterSimulation TestPhysical TestRelative Error/%
Soil angle of repose/(°)3735.54
soil sliding friction angle/(°)32.231.52
Disclaimer/Publisher’s Note: The statements, opinions and data contained in all publications are solely those of the individual author(s) and contributor(s) and not of MDPI and/or the editor(s). MDPI and/or the editor(s) disclaim responsibility for any injury to people or property resulting from any ideas, methods, instructions or products referred to in the content.

