Article

Development and Optimization of a SPME-GC-FID Method for Ethanol Detection

1
Center of Textile Science and Technology, University of Minho, 4800-058 Guimaraes, Portugal
2
Centre of Biological Engineering, University of Minho, Campus de Gualtar, 4710-057, Braga, Portugal
3
LABBELS—Associate Laboratory, 4710-057 Braga, Portugal
4
Fibrenamics, Institute of Innovation, University of Minho, 4800-058 Guimaraes, Portugal
*
Authors to whom correspondence should be addressed.
Processes 2024, 12(2), 247; https://doi.org/10.3390/pr12020247
Submission received: 22 December 2023 / Revised: 17 January 2024 / Accepted: 22 January 2024 / Published: 24 January 2024

Abstract

:
A solid-phase microextraction (SPME) injection gas chromatography was validated with the flame ionization detection method (GC-FID) using a capillary column to detect ethanol. The method was used to determine ethanol in fluids with biomedical, clinical, and forensic importance, including water, phosphate-buffered saline (PBS), and artificial sweat. The strategy produced good peak resolution and showed a linear correlation between the concentration and peak areas for ethanol in all matrices. The inter- and intra-day precisions of the method were below 15.5% and 6.5%, respectively, varying according to the matrix. The method achieved detection limits below 1.3 mg/L, varying according to the matrix. Lower limits were obtained for the aqueous solution (0.22 mg/L), followed by the PBS solution (0.96 mg/L), and finally, the sweat solution (1.29 mg/L). This method is easy to perform and suitable for use in routine clinical biochemistry and forensic laboratories, allowing ethanol detection at lower concentrations using lower temperature and time of extraction, when compared with other studies.

Graphical Abstract

1. Introduction

The detection of ethanol in biological samples is essential in various fields, including medical, forensic, traffic safety, and even in the environment and the food industry. Ethanol is a psychoactive substance consumed worldwide, and its excessive consumption can lead to severe health damage as well as dangerous and illegal behaviors such as driving under the influence of alcohol. Therefore, the accurate and reliable detection of ethanol in biological samples is crucial to assess ethanol exposure and consumption and support criminal investigations. For example, low concentrations of ethanol or its metabolites in animal or plant tissues can be used as biomarkers of exposure or toxicity to ethanol-containing substances in the environment [1,2]. In the food and beverage industry, ethanol detection is important to monitor the fermentation process in the production of wine, beer, and other fermented products. For example, low levels of ethanol in fruit juices or soft drinks may indicate fermentation or spoilage, while low levels of ethanol in alcoholic beverages could affect their taste, aroma, or alcohol content [3,4].
In toxicology, the concentration of ethanol in biological samples, such as blood, urine, and even sweat, is required to establish the extent of alcohol impairment in cases of driving under the influence of alcohol. Even small amounts of ethanol found in these biological fluids may be relevant to determine if the person was under the influence of alcohol at the time of an accident, a crime, or a drug test [5,6]. Finally, in medical diagnostics, the concentration of ethanol in the blood may reflect alcohol-related diseases, such as liver cirrhosis, and monitor the effectiveness of treatments [5,7,8].
Several methods have been developed for the detection of ethanol in biological samples, including liquid chromatography (HPLC), near-infrared spectroscopy (NIR), nuclear magnetic resonance spectroscopy (NMR), gas chromatography (GC), mass spectrometry (MS), and sensor technologies [1,2,3,4,5,6]. Each technique has advantages and limitations, and the method used is determined by the sample type, detection limit, and specificity needed. HPLC is a popular technique for detecting ethanol, although it requires sample derivatization before analysis. The derivatization process can be time-consuming and may affect the accuracy of the results. A study by Hameedat et al. [7] reported that sample derivatization before HPLC analysis for ethanol detection in human blood samples can lead to inaccurate and unreliable results due to the instability of the derivatizing agent [7]. NIR is a non-invasive technique for ethanol detection that has been applied to saliva, blood, and breath samples. However, the accuracy of NIR analysis is often affected by the interference of other compounds present in the sample. In a study by Spiehler V. [8], it was observed that ethanol analysis in saliva samples by NIR presented limitations due to interference from other compounds present in the sample [8,9]. NIR is a non-destructive technique that does not require sample derivatization, but it has limited sensitivity for ethanol detection [10,11]. MS is a highly sensitive technique that can provide detailed information about the molecular structure of the analyte, but it requires expensive equipment and expertise [12,13]. SPME (solid-phase microextraction) GC (gas chromatography) FID (flame ionization detection) is a widely used analytical technique for the detection of volatile organic compounds, including ethanol [3,14,15,16,17]. This method is highly sensitive and selective, making it reliable for detecting low concentrations of ethanol in a wide range of sample matrices, such as air, water, and biological fluids. The SPME component of the method allows for the extraction and preconcentration of the target analyte, which is then introduced into the GC for separation and detection by the FID. It is a promising technique for ethanol detection in biological samples without the need for derivatization.
Summing up, several methodologies can be considered, each with its advantages and limitations:
  • Alternative Chromatographic Techniques: In addition to gas chromatography, liquid chromatography techniques, such as high-performance liquid chromatography (HPLC), could be explored. Each technique has its advantages, and the choice depends on factors such as sensitivity, selectivity, and the nature of the samples. On the other hand, liquid chromatography (LC) techniques, such as high-performance liquid chromatography (HPLC), may also be used for ethanol analysis. However, the choice between SPME-GC-FID and LC depends on the specific requirements of the analysis and the properties of the target analyte. Liquid chromatography generally excels in separating and analyzing a broader range of compounds, including those with higher molecular weights or polar characteristics. However, some studies reveal that for volatile compounds like ethanol, SPME-GC-FID often provides better sensitivity and faster analysis times [1,2,3,4];
  • Spectroscopic Techniques: Techniques like NIR, NMR, and MS could be considered for the direct detection of ethanol. These methods might provide alternative approaches with different detection sensitivities and specificities; however, studies reveal that the direct injection of ethanol in aqueous matrices reveals lower sensitivity [8,9,10,11];
  • Sensor Technologies: The use of sensors, such as electrochemical or optical sensors, could provide real-time detection and potentially offer advantages in terms of simplicity and rapidity. There are several available commercial sensors capable of transdermal monitoring of alcohol consumption using insensible sweat, such as the SCRAM™ and the WrisTAS™ biosensors. These sensors can provide information about days of abstinence, and even distinguish between heavy or sporadic alcohol ingestions. However, the reported devices have disadvantages, such as limited specificity and time delay after alcohol intake. Recent reports have demonstrated wearable alcohol biosensors capable of greater specificity and near real-time monitoring through amperometric detection in sweat [18].
While we chose SPME injection gas chromatography for its specific advantages in our study, we acknowledge that alternative methodologies could provide valuable insights and complement our approach.
Therefore, the choice of the solid-phase microextraction gas chromatography with flame ionization detection (SPME-GC-FID) method for ethanol detection in aqueous samples is supported by a combination of factors that collectively contribute to its suitability for the primary motivation of this work, which consists of detecting low ethanol concentrations in biological fluids for forensic purposes. Furthermore, this method can be used for future investigations in the fields of environmental analysis and the food and beverage industry. SPME allows for the selective preconcentration of volatile and semi-volatile compounds, including ethanol, from complex aqueous matrices [19]. The extraction phase of the SPME fiber, coated with a suitable material, facilitates the selective adsorption of the target analyte while minimizing interference from matrix components. Aqueous samples, such as water, sweat, and PBS, often contain a diverse range of compounds that can interfere with the accurate detection of ethanol. SPME serves to minimize matrix effects by selectively isolating ethanol, thus enhancing the method’s specificity and reducing potential interferences. The flame ionization detector (FID) provides excellent sensitivity, a wide linear range, and low detection limits for compounds like ethanol since it operates based on the principle of detecting ions produced during the combustion of organic compounds. When a sample is introduced into the flame, it undergoes combustion in the presence of excess air (oxygen) [20]. The resulting ions and electrons contribute to the electrical current, which is then measured and correlated to the concentration of the analyte. This ensures that even trace amounts of ethanol in aqueous samples can be accurately quantified. The GC separation coupled with FID detection offers relatively short analysis times, which is particularly advantageous when dealing with routine analyses or situations where a rapid turnaround is essential, especially in applications such as clinical biochemistry and forensic analysis, where accuracy is paramount. The ease of method execution and reproducibility contribute to the method’s practicality for routine use in different analytical settings. Furthermore, unlike some other chromatographic techniques, the SPME-GC-FID method allows for the direct analysis of ethanol without the need for derivatization, which simplifies the analytical process and reduces the potential for method-induced errors. In conclusion, the SPME/GC-FID method was specifically chosen for its ability to address the challenges associated with ethanol detection in aqueous samples. The method’s selectivity, sensitivity, and quantitative accuracy make it a robust choice for applications where precise and reliable ethanol quantification is paramount. Overall, SPME-GC-FID is recognized as a reliable and robust method for detecting ethanol, with the added advantages of simplicity of sample preparation and lower sample size requirements when compared to the other analytical methods mentioned before.
Researchers have made significant advancements in this field, focusing on improving the method’s sensitivity, selectivity, and accuracy. The study conducted by L. Znidersic et al. [16] aimed to enhance the sensitivity of ethanol detection using SPME-GC-FID by optimizing the SPME parameters, such as fiber type, extraction time, and desorption conditions [16]. They reported improved detection limits and enhanced quantification accuracy, contributing to the advancement of SPME-GC-FID for ethanol analysis [16]. Another study by Joseph et al. (2022) addressed the challenge of matrix effects in ethanol analysis using SPME/GC-FID. They developed a sample preparation method to minimize matrix interferences, enabling a more accurate and reliable quantification of ethanol in complex biological samples [18]. In order to advance the state of the art, further research can focus on exploring novel SPME fiber coatings with improved extraction efficiency and selectivity for ethanol. Additionally, optimizing the sample preparation and analysis conditions to minimize matrix interferences and enhance the sensitivity and precision of ethanol detection would be valuable. Furthermore, the investigation of the applicability of SPME-GC-FID for real-time or in situ monitoring of ethanol levels in biological samples could be a potential area of advancement. This could provide valuable insights into the evaluation of dynamic changes in ethanol concentrations over time, enabling a better understanding of ethanol metabolism and its effects [21,22,23].
Optimizing SPME-GC-FID methods for ethanol detection is important for achieving the highest level of accuracy, precision, repeatability, and sensitivity in the analysis. By considering the various parameters involved in the analysis, we aimed herein to improve the performance of SPME-GC-FID for ethanol detection, by studying different parameters like fiber type, time and temperature of extraction, and type of matrix, and to obtain reliable results for various applications. In addition to testing with water samples, tests using an artificial sweat matrix will be undertaken to replicate the ethanol content in human fluids for forensic analysis using the SPME-GC-FID technology [24]. Following the optimization of the SPME/GC-FID method, a comprehensive characterization by evaluating various quantitative and qualitative parameters, including precision, linearity, limit of detection, and limit of quantification, was performed. This information can be used to make informed decisions about the suitability of the method for a particular application and to identify areas for improvement and optimization.
In summary, while significant advancements have been made in the detection of ethanol using SPME-GC-FID, there is still room for improvement in terms of sensitivity, selectivity, matrix effects, and real-time monitoring. The present study aims to evaluate the effectiveness of the SPME-GC-FID technique and to contribute to the field by exploring novel approaches or techniques to enhance the accuracy, precision, and efficiency of ethanol analysis using SPME-GC-FID. Therefore, the main contributions of this paper are:
(i)
Validation of a SPME injection gas chromatography with flame ionization detection method (GC-FID) using a capillary column for the accurate detection of ethanol, exploring different factors that can influence its sensitivity and reproducibility;
(ii)
Application of the method for the determination of ethanol in fluids with biomedical, clinical, and forensic importance, including water, phosphate-buffered saline (PBS), and artificial sweat;
(iii)
Establishment of a strategy that yields good peak resolution, demonstrating a linear correlation between concentration and peak areas for ethanol in all matrices. The method exhibits inter- and intra-day precisions below 15.5% and 6.5%, respectively, with detection limits below 1.3 mg/L across matrices. Notably, this approach allows for ethanol detection at lower concentrations using a lower temperature and time of extraction, distinguishing it from previous studies.
By overcoming the limitations of other detection methods, GC-FID can provide accurate and reliable results for ethanol detection in biological samples in a wide range of applications.

2. Materials and Methods

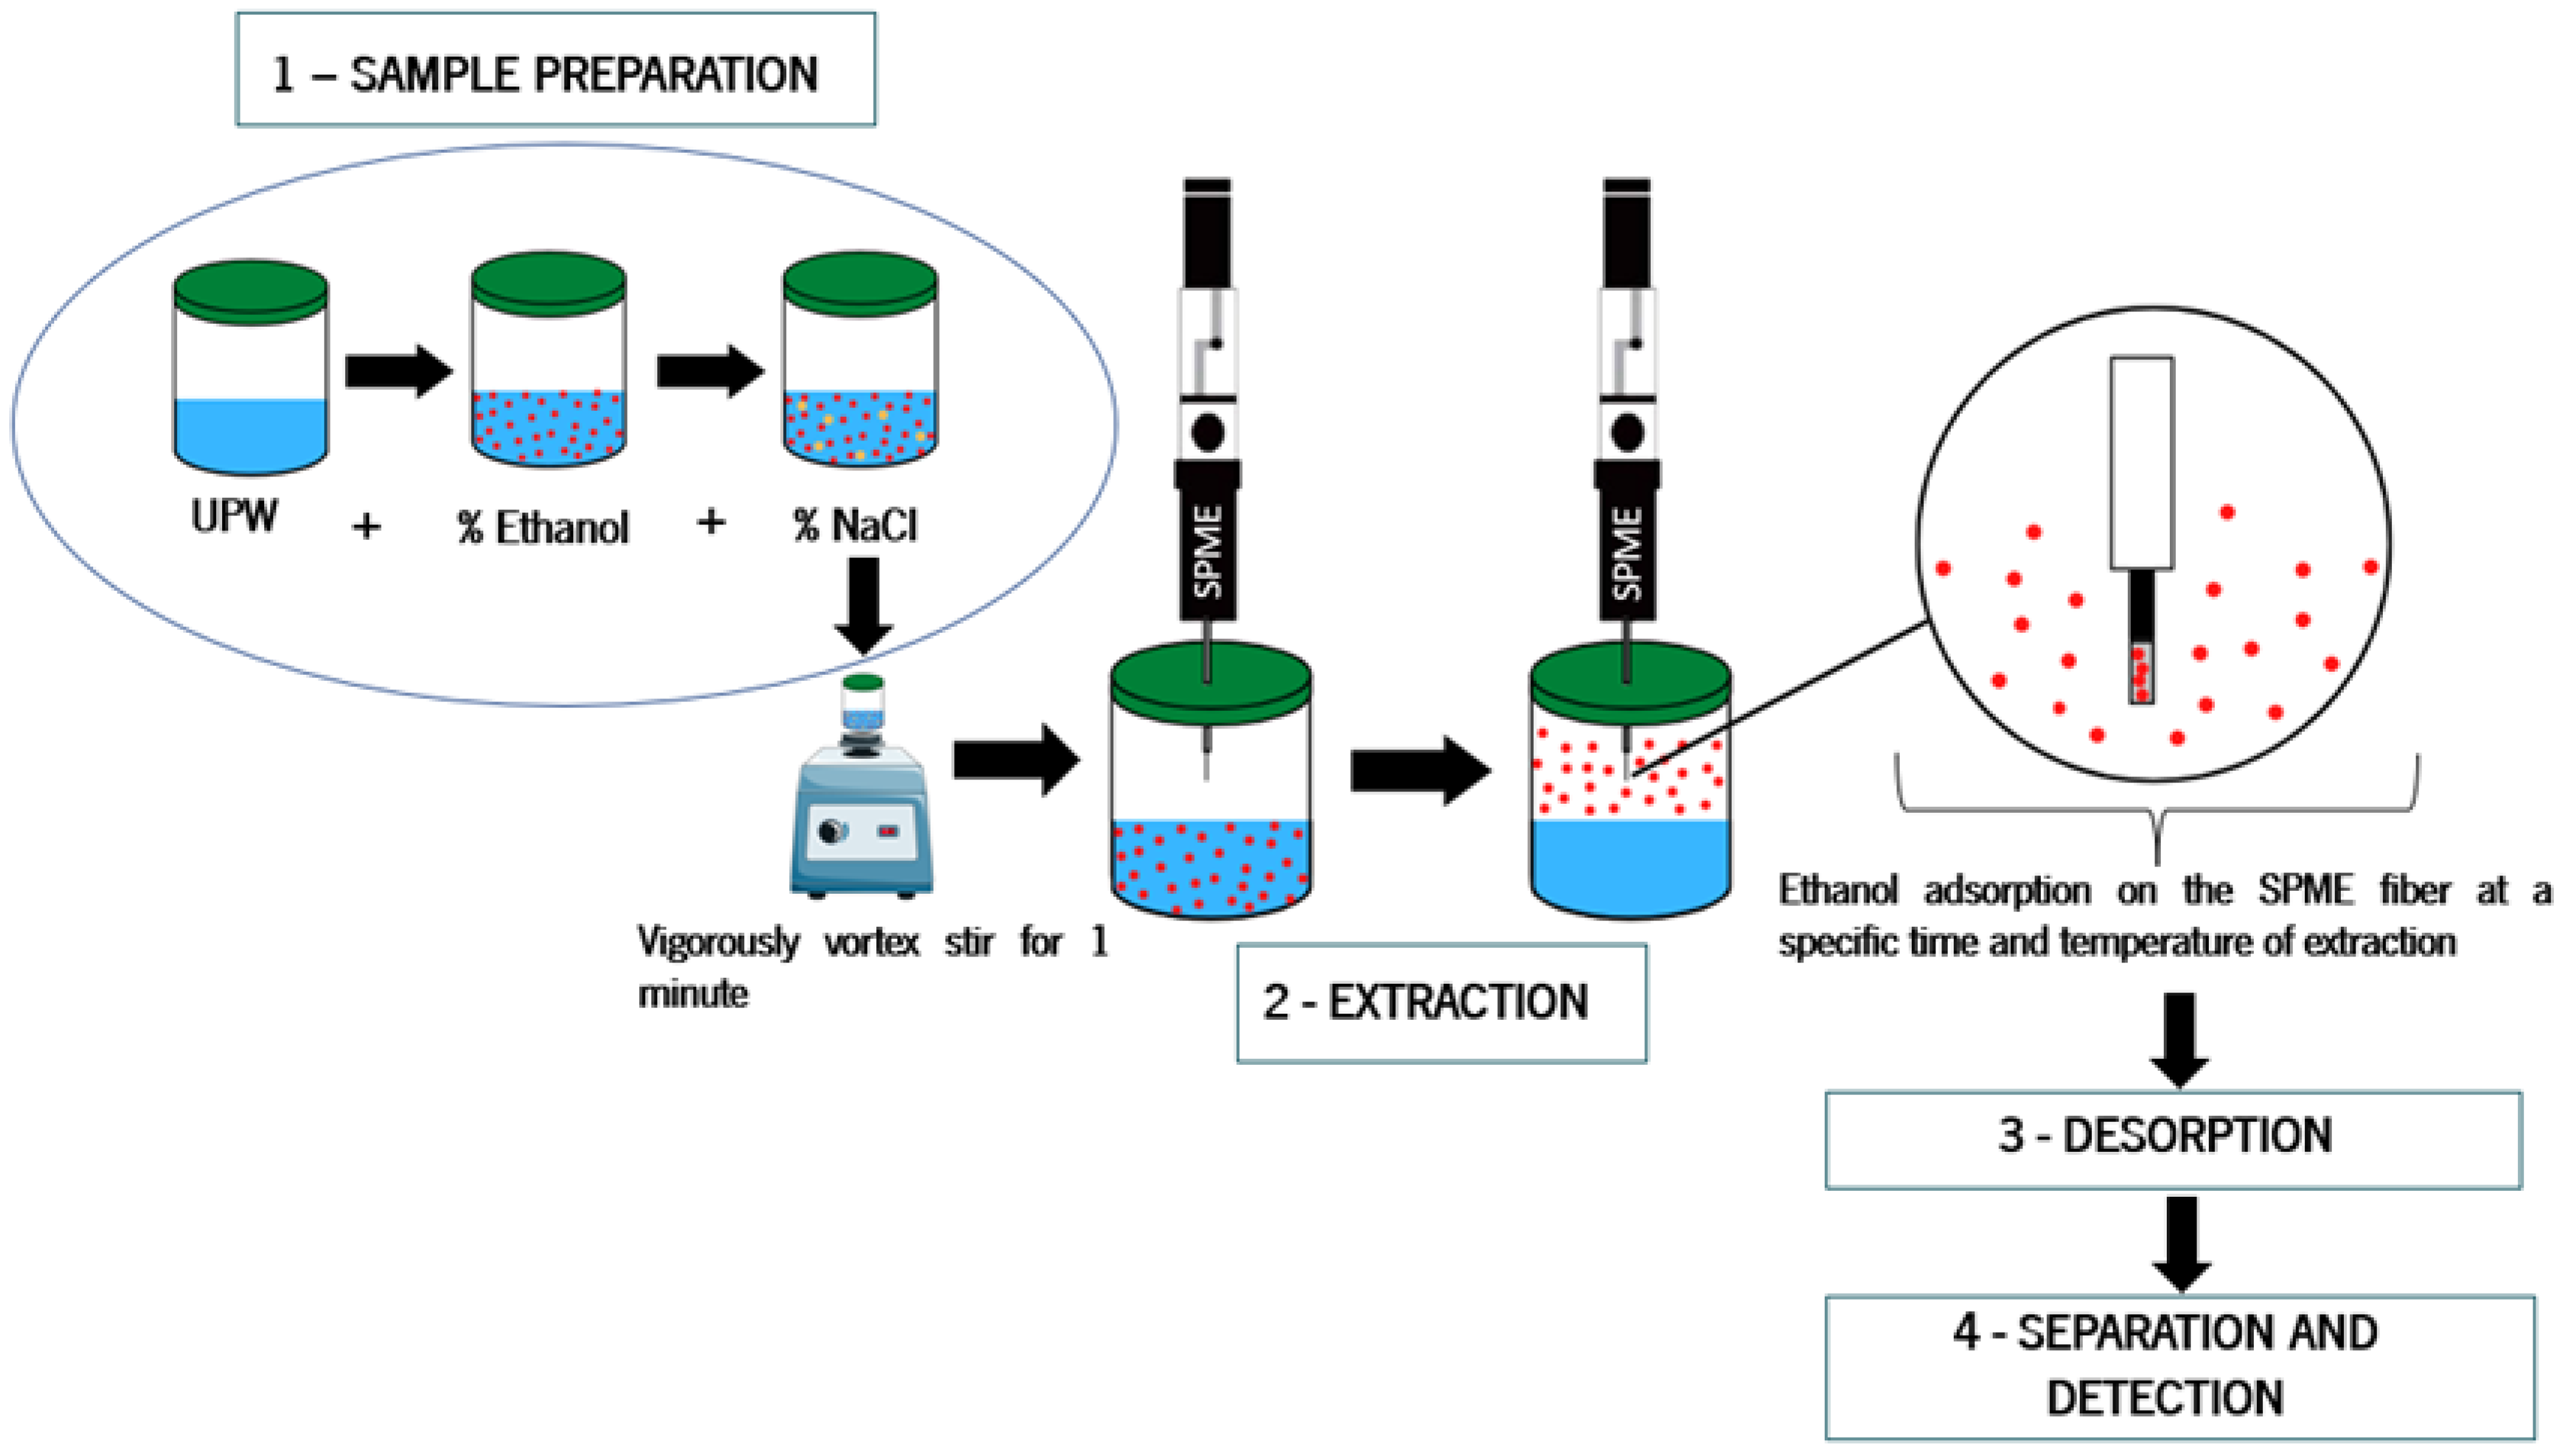
2.1. Samples Preparation and GC-FID Procedure

To evaluate the performance of the SPME-GC-FID method for ethanol detection, a series of aqueous solutions containing different concentrations of ethanol were prepared. The solutions were prepared by adding known amounts of ethanol (purity >99%) to 2 mL of ultrapure water (UPW). The ethanol concentrations were selected to cover a range of 0.1–10 mg/L, which are considered relevant for forensic toxicology, clinical diagnosis, food and beverage industries, as well as for environmental monitoring. Sodium chloride (Sigma-Aldrich, Milwaukee, WI, USA) 30% (w/v) was added to the samples followed by magnetic stirring for 1 min at room temperature. A volume of 0.5 mL of each solution was transferred to a 20 mL glass vial for SPME analysis. Artificial sweat samples and PBS samples containing different concentrations of ethanol were also prepared for comparison with the ultrapure water samples, being subjected to the same time and temperature of extraction.
Summing up, the SPME-GC-FID optimized procedure involved four main steps, including (Figure 1):
  • Sample preparation: the samples were prepared as mentioned before;
  • Extraction: the SPME fiber was exposed to the sample matrix headspace and the volatile compounds adsorbed into the fiber coating for 20 min at 30 °C;
  • Desorption: after extraction, the fiber was inserted into the GC injection port, where the compounds were thermally desorbed from the fiber coating and transferred to the GC column;
  • Separation and detection: the separated compounds were detected by a flame ionization detector (FID).
Figure 1 presents the scheme of the main steps mentioned above.

2.2. Artificial Sweat and PBS Sample Solutions

The composition of the artificial sweat solution is presented in Table 1, being prepared similarly as described elsewhere [25].

2.3. GC Conditions

A VARIAN 4000 gas chromatograph (GC) equipped with a split/splitless injector, a flame ionization detector (FID), and a capillary column, coated with Meta-WAX, 50 m × 0.25 mm i.d., 0.25 µm film thickness, TEKNOKROMA), was used. The oven temperature was initially held at 55 °C for 5 min, then programmed to rise from 55 °C to 150 °C at 4 °C min−1, and then raised to 250 °C at 20 °C min−1 which was held for 5 min. The total time of analysis was 38.67 min, which includes the complete duration of the chromatographic run, covering the separation and detection of multiple compounds present in the sample matrix, not just ethanol, which is detected at 2.9 min. The total analysis time of 38.7 min serves the purpose of adequately purging any residual components that might be adsorbed onto the fiber, thereby eliminating potential contaminations in subsequent readings. This duration allows for a thorough cleaning of the system, ensuring the reliability and accuracy of subsequent analyses. The injection port was equipped with the 11.5 mm septa (TEKNOKROMA) and 0.75 mm × 5.0 × 54 SKY liner SPME (RESTEK) designed to optimize recovery in SPME analysis. The injection port was operated at 250 °C in the splitless injection mode. The detector temperature was set to 220 °C. The carrier gas was helium at a flow rate of 1 mL min−1 (12.1 psi at the head of the column) [22,23,24,26,27].

2.4. Statistical Analysis

Statistical analysis was performed using GraphPad Prism (version: 9.5.1). As the data followed a non-parametric distribution, statistical analysis was conducted with the ANOVA test, followed by Dunn’s multiple comparisons tests, to compare each paired group. A confidence interval of at least 95% was chosen to define statistical significance (* p < 0.05, ** p < 0.005, *** p < 0.001, and **** p < 0.0001).

3. Results

SPME-GC-FID is a straightforward and efficient technique that was selected in this work to quantify ethanol. Several parameters were optimized in SPME-GC-FID including SPME fiber, salt concentration, extraction time, extraction temperature, and sample matrix. By optimizing these parameters, it was possible to improve the extraction efficiency, selectivity, and stability of the analyte, leading to more accurate and precise results. Each measure was carried out in triplicate. To ensure the linearity of the method, calibration curves were constructed using aqueous solutions with known concentrations of ethanol. The calibration curves were generated by plotting the peak area of ethanol obtained by SPME-GC-FID analysis against the concentration of ethanol in the sample solutions. The use of calibration curves derived from these solutions enables the accurate and precise quantification of ethanol in unknown samples, which is critical for quality control, regulatory compliance, and safety considerations in various industries. It is noteworthy that the retention time in GC-FID-SPME for ethanol was 2.9 min. The chromatograms corresponding to Figure 2, Figure 3, Figure 4, Figure 5 and Figure 6 are presented in the Supplementary Material section as Figures S1–S5, respectively.

3.1. SPME Fiber Selection

The choice of SPME fiber can have a significant impact on the extraction efficiency and selectivity of the analyte. Factors such as fiber coating material, fiber diameter, and fiber length can all influence the performance of the SPME fiber. The experiment’s first phase focused on selecting the most effective fiber coating for extracting ethanol from a standard solution of 100 mg/L of ethanol. In this first experiment, a higher concentration of ethanol (10 times higher than the other experiments) was used in order to be sure that all fibers detected ethanol. Three different coatings were assessed based on their thickness and polarity, considering that thicker coatings may need more time to reach extraction equilibrium but can provide higher sensitivity due to the higher mass of extracted analytes. The fiber coatings for VOC extraction testing included 100 µm PDMS (Polydimethylsiloxane), 75 µm CAR-PDMS (Carboxen-Polydimethylsiloxane), and 50/30 µm DVB/CAR/PDMS (Divinylbenzene-Carboxen-Polydimethylsiloxane). The standard solution was preincubated with the fibers before extraction. The results were analyzed based on the total peak area and the number of identified peaks (Figure 2).
Figure 2. Total peak area obtained by SPME-GC-FID analysis of ethanol (100 mg/L) using different fiber coatings. PDMS—100 µm Polydimethylsiloxane, CAR/PDMS—85 µm Carboxen/PDMS, Divinylbenzene/Carboxen/Polydimethylsiloxane (DVB/CAR/PDMS)—50/30 µm DVB/Carboxen/PDMS (SPME extraction at 50 °C for 30 min, ethanol concentration 100 mg/L). Results are shown as the mean ± SD (n = 3). * p < 0.05 for CAR/PDMS when compared with the PDMS fiber, using the ANOVA test, followed by Dunn’s multiple comparisons tests.
Processes 12 00247 g002
Among the different types of fiber coatings tested, the CAR/PDMS coating produced the highest peak areas in the SPME-GC-FID analysis. This suggests that the CAR/PDMS coating is the most effective at extracting ethanol from the sample. The peak area achieved with the CAR/PDMS fiber is roughly 77% greater than the peak area obtained with the DVB/CAR/PDMS fiber and approximately 98.5% higher than the peak area obtained with the PDMS fiber (* p < 0.05). The differences in extraction efficiency can be attributed to several factors, including the composition and properties of the fiber coatings. The CAR/PDMS fiber coating consists of a combination of Carboxen and Polydimethylsiloxane (PDMS). Carboxen is a porous carbon material that provides a high surface area and enhanced selectivity for analyte adsorption, while PDMS offers mechanical stability. The presence of Carboxen in the coating likely contributes to the higher extraction efficiency of ethanol due to its increased adsorption capacity for the analyte. The DVB/CAR/PDMS fiber coating includes divinyl benzene (DVB), Carboxen, and PDMS. DVB is a cross-linking agent that enhances the stability and selectivity of the fiber coating. The addition of DVB in the coating composition may slightly alter the adsorption properties compared to the CAR/PDMS coating, potentially leading to slightly lower extraction efficiency for ethanol. The PDMS fiber coating consists solely of Polydimethylsiloxane, which is known for its nonpolar nature and compatibility with nonpolar analytes. While it can still extract ethanol, the lack of additional selectivity-enhancing components like Carboxen or DVB may result in lower extraction efficiency compared to the CAR/PDMS and DVB/CAR/PDMS coatings. In summary, the higher peak areas observed with the CAR/PDMS fiber coating compared to the DVB/CAR/PDMS and PDMS fibers can be attributed to the presence of Carboxen, which likely provides higher adsorption capacity and selectivity for ethanol. The composition and properties of the fiber coatings play a crucial role in determining their extraction efficiency, and the specific combination of Carboxen and PDMS in the CAR/PDMS coating proves to be advantageous for ethanol extraction in this study.

3.2. Salt Concentration

The effect of salt on the efficacy of SPME headspace extraction of the ethanol was investigated by adding varying amounts of salt to the analyte solution to induce the salting-out effect. The salting-out effect occurs when salt is added to a solution containing analytes (molecules of interest), causing the analytes to become less soluble in the solution and precipitate out of the solution. Sodium chloride can improve the salting-out effect by raising the ionic strength of the solution, resulting in greater recovery rates for the analytes of interest. NaCl concentrations between 0 to 40% (w/v) were investigated and the results are shown in Figure 3.
Figure 3. The effect of salt concentration (NaCl—0%, 10%, 20%, 30%, and 40%) on ethanol extraction (ethanol concentration: 10 mg/L; extraction temperature: 50 °C; extraction time: 30 min; SPME fiber: CAR/PDMS). Results are shown as the mean ± SD (n = 3). * p < 0.05 for 30% and 40% NaCl when compared with 0% NaCl, using the ANOVA test, followed by Dunn’s multiple comparisons tests.
Processes 12 00247 g003
Overall, five concentrations of NaCl (0%, 10%, 20%, 30%, and 40% w/v) were tested, and it was found that the highest peak areas of ethanol quantification were obtained at a sodium chloride concentration of 30% w/v, with a statistical significance of * p < 0.05. Increasing the salt concentration beyond 30% resulted in a decrease in the obtained signals. At lower salt concentrations, the presence of some ions in the sample matrix can enhance the extraction of ethanol by promoting favorable interactions with the SPME fiber coating and the analyte molecules. However, when the salt concentration becomes too high, the excess ions can compete with the analyte for adsorption sites on the SPME fiber or disrupt the solubility of ethanol in the sample matrix. The solubility of NaCl in water is influenced by temperature, and even at 50 °C, the maximum solubility is approximately 35.7 g/100 mL. When attempting to create a 40% NaCl solution, the saturation point is exceeded, leading to the formation of a saturated solution where excess salt does not dissolve. Consequently, this results in an impractical concentration that lacks reproducibility in experimental settings. This information is reinforced through the chromatograms presented in Figure S6 of the Supplementary Material section. The excess undissolved salt can interfere with the extraction process, making it challenging to achieve consistent and reliable results. Therefore, our experimental findings indicate that a 40% NaCl concentration is not conducive to effective ethanol extraction due to its impracticality and lack of reproducibility. Therefore, the optimal salt concentration for this study is 30%.

3.3. Extraction Time

The amount of analyte extracted from the sample can also be affected by the extraction time. Longer extraction times can result in higher analyte recoveries but may also lead to the extraction of non-target compounds. As shown in Figure 4, we investigated the influence of different extraction durations (10, 20, and 30 min) on the recovery of the analyte from a 0.01 mg/mL ethanol solution employing the CAR/PDMS fiber with the addition of 30% w/v NaCl, at 50 °C.
Figure 4. Effect of extraction time on the total peak area of analyzed ethanol. Ethanol concentration: 10 mg/L; NaCl addition: 30%; extraction temperature: 50 °C; SPME fiber: CAR/PDMS. Results are shown as the mean ± SD (n = 3). * p < 0.05 for 20 min when compared with 10 min, using the ANOVA test, followed by Dunn’s multiple comparisons tests.
Processes 12 00247 g004
The results showed that increasing the extraction time from 10 to 20 min (* p < 0.05) led to an increase in the total peak area (8.9% greater). However, further extension of the extraction time to 30 min did not increase the sensitivity of extraction but only increased the overall analysis time. This is because it is possible that the SPME fiber achieves its maximal ethanol adsorption capacity after 20 min, resulting in no substantial further extraction. The fiber may become saturated at this stage, restricting its capacity to extract additional analyte. Longer extraction durations may also result in higher desorption of interfering chemicals from the fiber, which may impair the detection of the target analyte. This can reduce the signal-to-noise ratio and overall sensitivity.

3.4. Extraction Temperature

The extraction temperature can influence the analyte’s solubility and volatility, as well as the performance of the SPME fiber. Higher temperatures can enhance extraction efficiency but can also cause analyte thermal deterioration. Temperatures of 30 °C, 40 °C, 50 °C, and 60 °C were investigated while maintaining the previously optimal extraction length of 20 min and salt content (30%) constant.
The data shown in Figure 5 show that raising the temperature from 30 to 60 °C resulted in a continual decrease in the overall peak area. At temperatures above 30 °C, the peak area of the ethanol signal decreases continuously, indicating that the efficiency of extraction and/or desorption is decreasing. This might be due to several variables, including the fact that at higher temperatures, the ethanol in the sample may evaporate or volatilize more quickly. Furthermore, if the SPME fiber coating becomes saturated with ethanol at high temperatures, it may be unable to extract additional analyte from the sample matrix, contributing to a decrease in peak area. The greatest peak area obtained at 30 °C (* p < 0.05 when compared with 60 °C) may suggest this temperature as the optimal condition for the substance or mixture under study. These results agree with those reported by Lo et al. (2021) [24] where the sensitivity of adsorption of VOCs using the CAR/PDMS fiber increased at lower temperatures with a subsequent decrease after 30 °C.
Figure 5. Effect of extraction temperature on the total peak area of analyzed ethanol. Ethanol concentration 10 mg/L; NaCl addition: 30%; extraction time: 20 min; SPME fiber: CAR/PDMS. Results are shown as the mean ± SD (n = 3). * p < 0.05 for 30 °C when compared with 60 °C, using the ANOVA test, followed by Dunn’s multiple comparisons tests.
Processes 12 00247 g005

3.5. Sample Matrix

The nature of the sample matrix can influence the analyte extraction efficiency and selectivity. The efficacy of the SPME fiber to extract the analyte of interest can be influenced by factors such as pH, ionic strength, and the presence of other volatile organic molecules. Three different matrices were tested herein, namely, an aqueous sample, prepared as mentioned in Section 2.1 (Matrix A), a PBS sample (Matrix B), prepared as mentioned in Section 2.2, and an artificial sweat sample, prepared as mentioned in Section 2.3 (Matrix C). The pH of Matrix C was 6.3, which corresponds to the general pH of human sweat.
From Figure 6, it is possible to conclude that the aqueous sample (Matrix A) is more favorable to ethanol detection through the SPME-FID method when compared with PBS (Matrix B) and sweat (Matrix C), with a statistical significance of * p < 0.05 when compared to PBS. Several variables can contribute to the greater detectability of ethanol in watery samples. One probable explanation is that the aqueous sample’s composition is more compatible with the SPME-FID method’s extraction and detection processes. Interferents in the samples might reduce the extraction effectiveness of the SPME-FID technique. In the case of sweat and PBS, these matrices may include a variety of chemicals, such as salts, proteins, and other organic molecules, which might interfere with ethanol extraction by competing for adsorption sites on the SPME fiber. Artificial sweat matrices are mixtures of compounds that simulate the chemical composition of human sweat, including electrolytes, organic acids, and other components. By testing with an artificial sweat matrix, it was possible to study the behavior of ethanol in a controlled and reproducible manner, without the variability and complexity associated with real human sweat. This information can be used to refine and improve the analysis method and to better understand the behavior of ethanol in sweat.
Figure 6. Effect of sample matrix on the total peak area of analyzed ethanol. Ethanol concentration 10 mg/L; NaCl addition: 30%; extraction time: 20 min; extraction temperature: 30 °C. Matrix A—ultrapure water; Matrix B—PBS; Matrix C—sweat. Results are shown as the mean ± SD (n = 3). * p < 0.05 for matrix A when compared with matrix B, using the ANOVA test, followed by Dunn’s multiple comparisons tests.
Processes 12 00247 g006

3.6. Results Validation

Linearity, Precision (CV), Limit of Detection (LOD), and Limit of Quantification (LOQ)

Calibration curves were generated during the optimization of the GC method to select the most appropriate approach for ethanol detection using SPME in aqueous samples. A calibration curve was generated using the optimized fiber, NaCl concentration, extraction time, and temperature (30 °C, 20 min, 30% NaCl; Section 3.4), from now on called Matrix A. With the calibration curves obtained for each method, as demonstrated in Figure 7, one can evaluate the accuracy, precision, and sensitivity, and select the most appropriate approach for the specific application, as shown in Table 2. Quantitative parameters, such as limit of quantification (LOD), limit of detection (LOD), and precision (CV) were calculated through calibration curve data. Sensitivity (S) is the measure of how sharply the signal changes with variations in the concentration of the target analyte. Calibration curves can be generated with the gradual increase in the concentration of the analyte to determine the sensitivity of the sensor through the slope of the curve obtained in cases where hysteresis is insignificant, as it shown in Equation (1) [28]:
S = d Y d X  
Precision (CV) is the ability of the sensor to provide alike results every time a sample is measured, and accuracy indicates the sensor’s capacity to provide a mean value close to the true value when a sample is measured more than once and can be calculated through Equation (2), where “s” corresponds to standard deviation and “M” corresponds to data average. Reproducible signals provide high reliability and robustness to the inference made on the response of a biosensor [29].
C V % = s M   × 100  
The detection limit (LOD) indicates the minimum concentration of analyte that a sensor can distinguish from the assay background. In several medical and environmental monitoring applications, a biosensor is required to detect analyte concentration as low as ng/mL or even fg/mL to confirm the presence of traces of analytes in a sample. The signal–noise ratio with a value of 3.3 is generally acceptable [30]. Thus, the limit of detection (LOD) may be expressed by Equation (3):
L O D = 3.3 × s S
Quantification of limit (LOQ) is the lowest concentration of the analyte that is possible to be determined and can be expressed by Equation (4) [30]:
L O Q = 10 × s S
Linearity is the attribute that shows the accuracy of the measured response to a straight line, mathematically represented as shown in Equation (4) whereas the concentration of the analyte, is the output signal, and m is the sensitivity of the biosensor. It is necessary to use enough standard solutions (minimum of five) to adequately define the relationship between concentration and response. This parameter can be obtained through the Pearson correlation index acquired through the calibration curve performed. Linearity refers to the ability to generate results linearly proportional to the concentration of the target analyte.
y = S x + b  
The results indicate that a temperature of 30 °C, a time of extraction of 20 min, and the addition of 30% salt resulted in the best conditions for ethanol detection. The limit of quantification and limit of detection found indicate the lowest concentration of ethanol that can be accurately detected by the method, while the Pearson coefficient of 0.998 indicates a highly positive correlation between the measured variables. Furthermore, calibration curves for PBS, from now on called Matrix B, and artificial sweat, from now on called Matric C, were also prepared, as shown in Figure 8.
A method’s precision is how consistently it generates the same results when applied to the same sample or samples. A CV of less than 10% is a regularly used criterion for acceptable accuracy in analytical chemistry. As indicated in Table 3, the accuracy of a method optimized under specified circumstances (30 °C, 20 min, 30% NaCl) was tested both inter-day and intra-day. The variance in findings achieved when the procedure is applied to the same samples on various days is referred to as inter-day precision. The variance in findings achieved when the procedure is applied to the same samples on the same day but at various times is referred to as intra-day precision. These experiments yielded useful information on the repeatability and consistency of the improved approach. If the approach has good inter- and intra-day accuracy, it can be regarded as dependable for regular laboratory analysis. If the findings vary significantly, more optimization or tweaks may be required to increase the method’s precision.
The intra-day precision for aqueous samples was 3.8%, while the inter-day precision was 5.1%, according to the data. The intra-day precision for PBS samples was 6.4%, and the inter-day precision was 14.5%. The intra-day precision for sweat samples was 3.8%, and the inter-day precision was 15.2%. These findings suggest that the improved approach is more exact for watery samples, with decreased variability in measurements within and across days. The PBS and sweat samples, on the other hand, have less accuracy and increased variability in readings. This might be due to the complex matrix of biological samples, which can interfere with analyte extraction and detection. Overall, the precision of findings indicates that the refined approach may be suitable for the precise and reliable detection of ethanol in aqueous samples, but additional tuning may be required for the analysis of biological fluids such as PBS and sweat. Furthermore, the improved method’s limit of quantification (LOQ) was evaluated under particular circumstances for aqueous, PBS, and sweat samples. The LOQ is the lowest concentration of analyte that the technique can consistently quantify. The improved approach yielded LOQ values of 0.68 mg/L for aqueous samples, 0.96 mg/L for PBS samples, and 1.29 mg/L for sweat samples. These LOQ values demonstrate that the approach can detect and quantify ethanol in aqueous samples at lower concentrations than PBS and sweat samples. This might be because the matrix composition and complexity of the different sample forms vary. The LOQ values obtained for all sample types were within acceptable limits for ethanol detection, showing that the refined approach is sensitive enough to be employed in a variety of applications.

4. Conclusions

Based on the parameters investigated, it is possible to infer that ethanol detection through SPME-GC-FID was optimized by careful control of the extraction conditions (fiber selection, temperature and time of extraction, and salt addition). The fiber coating was a crucial element to consider because it influenced the extraction’s selectivity and sensitivity. Furthermore, the temperature and duration of extraction were crucial criteria that affected the extraction process’s efficiency. The salt concentration improved extraction efficiency by changing the solubility of the target analyte in the sample matrix. As such, optimizing these parameters resulted in a more accurate and reliable detection of ethanol in varied matrices. Overall, this work emphasizes the necessity of knowing the influence of various factors on the performance of SPME/GC-FID for ethanol detection and gives useful insights for future research in this sector. A technique for quantifying ethanol in aqueous samples using gas chromatography was developed and verified. To replicate the ethanol content in human fluids for forensic analysis using the SPME/GC-FID technology, tests using an artificial sweat matrix and a PBS matrix were undertaken. The improved SPME/GC-FID technique for ethanol detection was shown to have lower LOQ values in aqueous samples compared to PBS and sweat samples, presumably due to sample matrix composition variations. The approach was accurate for aqueous samples but less so for the PBS and sweat samples, indicating that additional improvements are required for assessing biological materials. Nonetheless, all the LOQ values produced were within acceptable limits, demonstrating that the approach is sensitive enough for a variety of applications. Our study sets the stage for further research, providing a foundation for improved methodologies in ethanol detection. It is important to recognize the dynamic nature of this field and the need for iterative improvements to meet the diverse challenges posed by different sample matrices, offering valuable insights for researchers in biochemistry and forensics. The method, while accurate for water samples, may require additional improvements for assessing biological materials like sweat and PBS, as indicated by the variation in LOQ values. Therefore, future studies should include a more in-depth investigation into the method’s performance across a broader range of matrices, especially those relevant to clinical and forensic applications, which would enhance the study’s applicability, considering the complexities of different sample matrices. This would involve a comprehensive investigation into the impact of matrix components on the method’s performance. Additionally, conducting comparative studies with alternative methodologies or existing techniques for ethanol detection mentioned before would provide valuable insights into the strengths and weaknesses of different approaches, which could contribute to establishing the method’s superiority in specific applications.
It is noteworthy that this methodology has some limitations, such as: matrix dependency: the method’s performance may be influenced by variations in sample matrices, such as water, phosphate-buffered saline (PBS), and artificial sweat; sample complexity: the presence of interfering compounds in biological samples may affect the method’s performance; temperature and extraction time sensitivity: while the lower temperature and shorter extraction time are advantageous, they may compromise sensitivity and precision, particularly in matrices with diverse compositions. The decision to extend the analysis time was driven by considerations of energy efficiency and the necessity for a gradual temperature decrease during the cleaning process of the fiber. In complex matrices, it is crucial to ensure thorough fiber cleaning to prevent contaminations in subsequent readings and mitigate the risk of yielding false results. The presence of residual analytes or matrix components from previous analyses on the fiber may introduce unwanted interferences, compromising the accuracy and reliability of the measurements. Achieving a complete cleaning process is particularly pertinent in intricate sample matrices where diverse compounds may be present, necessitating meticulous attention to minimize cross-contamination. In future studies, it is important to focus on exploring strategies to minimize the analysis duration while maintaining the efficacy of fiber cleaning. Otherwise, this methodology has practical advantages such as: versatility: the method demonstrates versatility by successfully detecting ethanol in fluids with biomedical, clinical, and forensic importance; ease of use: the methodology is user-friendly, making it suitable for routine applications in clinical biochemistry and forensic laboratories. Additionally, this method is easily performed and reproducible when compared with traditional direct injection methods commonly used in analytical chemistry. Direct injection methods involve injecting the sample directly into the chromatograph without a prior extraction or preconcentration step. The lack of preconcentration can result in a diluted signal, making it challenging to detect low concentrations accurately. Furthermore, complex matrices, such as those found in biological fluids or environmental samples, contain a variety of compounds that can co-elute with ethanol, which can lead to baseline noise and signal suppression, making it difficult to distinguish and accurately quantify low concentrations of ethanol [29,30]. In addition, it is noteworthy that, particularly when dealing with aqueous matrices, the inherent affinity of ethanol for water molecules poses a challenge in direct injection methods. This phenomenon can lead to a loss of analyte detection and potential inaccuracies in the analysis. In contrast, our SPME technique offers advantages by selectively concentrating the target analyte, improving sensitivity, and reducing matrix interference. Overall, our SPME/GC-FID approach demonstrates better results in terms of sensitivity and reproducibility. Furthermore, the simplicity and efficiency of our approach contribute to its practicality for routine applications.

Supplementary Materials

The following supporting information can be downloaded at: https://www.mdpi.com/article/10.3390/pr12020247/s1.

Author Contributions

N.G.C.: conceptualization, data curation, formal analysis, investigation, methodology, software, visualization, writing—original draft. D.S.F.: methodology, software, visualization. A.B.: methodology, validation; visualization. C.S.: conceptualization, data curation, funding acquisition, project administration, resources, supervision, validation, writing—review and editing. J.C.A.: conceptualization, data curation, methodology, funding acquisition, project administration, resources, supervision, validation, writing—review and editing. A.M.R.: conceptualization, data curation, funding acquisition, project administration, resources, supervision, validation, writing—review and editing. All authors have read and agreed to the published version of the manuscript.

Funding

The authors acknowledge the support of this research by the Centre for Textile and Technology (2C2T) and the Centre of Biological Engineering (CEB) from the University of Minho, within the scope of the strategic projects UID/00264/2020 of 2C2T and UIDB/04469/2020 of CEB, financed by the Portuguese Foundation for Science and Technology (FCT). Nuna G. Costa also acknowledges FCT for the scholarship funding (2022.11810.BDANA).

Data Availability Statement

Data are contained within the article.

Conflicts of Interest

The authors declare no conflicts of interest.

References

  1. Lin, Z.; Wang, H.; Jones, A.W.; Wang, F.; Zhang, Y.; Rao, Y. Evaluation and review of ways to differentiate sources of ethanol in postmortem blood. Int. J. Leg. Med. 2020, 134, 2081–2093. [Google Scholar] [CrossRef] [PubMed]
  2. van den Broek, J.; Abegg, S.; Pratsinis, S.E.; Güntner, A.T. Highly selective detection of methanol over ethanol by a handheld gas sensor. Nat. Commun. 2019, 10, 4220. [Google Scholar] [CrossRef] [PubMed]
  3. Tiscione, N.B.; Alford, I.; Yeatman, D.T.; Shan, X. Ethanol Analysis by Headspace Gas Chromatography with Simultaneous Flame-Ionization and Mass Spectrometry Detection. J. Anal. Toxicol. 2011, 35, 501–511. [Google Scholar] [CrossRef] [PubMed]
  4. De Martinis, B.S.; Ruzzene, M.A.M.; Martin, C.C.S. Determination of ethanol in human blood and urine by automated headspace solid-phase microextraction and capillary gas chromatography. Anal. Chim. Acta 2004, 522, 163–168. [Google Scholar] [CrossRef]
  5. Wasfi, I.A.; Al-Awadhi, A.H.; Al-Hatali, Z.N.; Al-Rayami, F.J.; Al Katheeri, N.A. Rapid and sensitive static headspace gas chromatography–mass spectrometry method for the analysis of ethanol and abused inhalants in blood. J. Chromatogr. B 2003, 799, 331–336. [Google Scholar] [CrossRef] [PubMed]
  6. Pragst, F.; Balikova, M.A. State of the art in hair analysis for detection of drug and alcohol abuse. Clin. Chim. Acta 2006, 370, 17–49. [Google Scholar] [CrossRef] [PubMed]
  7. Hameedat, F.; Hawamdeh, S.; Alnabulsi, S.; Zayed, A. High Performance Liquid Chromatography (HPLC) with Fluorescence Detection for Quantification of Steroids in Clinical, Pharmaceutical, and Environmental Samples: A Review. Molecules 2022, 27, 1807. [Google Scholar] [CrossRef] [PubMed]
  8. Spiehler, V.; Cooper, G. Drugs-of-Abuse Testing in Saliva or Oral Fluid. In Drug Testing in Alternate Biological Specimens; Springer: Berlin/Heidelberg, Germany, 2008; pp. 83–99. [Google Scholar] [CrossRef]
  9. Jessop, D.S.; Turner-Cobb, J.M. Measurement and meaning of salivary cortisol: A focus on health and disease in children. Stress Int. J. Biol. Stress 2008, 11, 1–14. [Google Scholar] [CrossRef]
  10. Fulgêncio, A.C.d.C.; Resende, G.A.P.; Teixeira, M.C.F.; Botelho, B.G.; Sena, M.M. Combining portable NIR spectroscopy and multivariate calibration for the determination of ethanol in fermented alcoholic beverages by a multi-product model. Talanta Open 2023, 7, 100180. [Google Scholar] [CrossRef]
  11. Naqvi, R.A.; Arsalan, M.; Batchuluun, G.; Yoon, H.S.; Park, K.R. Deep Learning-Based Gaze Detection System for Automobile Drivers Using a NIR Camera Sensor. Sensors 2018, 18, 456. [Google Scholar] [CrossRef]
  12. Fiorini, D.; Caprioli, G.; Sagratini, G.; Maggi, F.; Vittori, S.; Marcantoni, E.; Ballini, R. Quantitative Profiling of Volatile and Phenolic Substances in the Wine Vernaccia di Serrapetrona by Development of an HS-SPME-GC-FID/MS Method and HPLC-MS. Food Anal. Methods 2014, 7, 1651–1660. [Google Scholar] [CrossRef]
  13. Dziekońska-Kubczak, U.; Pielech-Przybylska, K.; Patelski, P.; Balcerek, M. Development of the Method for Determination of Volatile Sulfur Compounds (VSCs) in Fruit Brandy with the Use of HS–SPME/GC–MS. Molecules 2020, 25, 1232. [Google Scholar] [CrossRef] [PubMed]
  14. Charry-Parra, G.; DeJesus-Echevarria, M.; Perez, F.J. Beer Volatile Analysis: Optimization of HS/SPME Coupled to GC/MS/FID. J. Food Sci. 2011, 76, C205–C211. [Google Scholar] [CrossRef] [PubMed]
  15. Zhou, J.; Lu, X.; Tian, B.; Wang, C.; Shi, H.; Luo, C.; Li, X. A gas chromatography-flame ionization detection method for direct and rapid determination of small molecule volatile organic compounds in aqueous phase. 3 Biotech 2020, 10, 520. [Google Scholar] [CrossRef] [PubMed]
  16. Žnideršič, L.; Mlakar, A.; Prosen, H. Development of a SPME-GC-MS/MS method for the determination of some contaminants from food contact material in beverages. Food Chem. Toxicol. 2019, 134, 110829. [Google Scholar] [CrossRef] [PubMed]
  17. Kristoffersen, L.; Stormyhr, L.-E.; Smith-Kielland, A. Headspace gas chromatographic determination of ethanol: The use of factorial design to study effects of blood storage and headspace conditions on ethanol stability and acetaldehyde formation in whole blood and plasma. Forensic Sci. Int. 2006, 161, 151–157. [Google Scholar] [CrossRef] [PubMed]
  18. Costa, N.G.; Antunes, J.C.; Paleo, A.J.; Rocha, A.M. A Review on Flexible Electrochemical Biosensors to Monitor Alcohol in Sweat. Biosensors 2022, 12, 252. [Google Scholar] [CrossRef] [PubMed]
  19. Oliveira, A.P.; Silva, L.R.; Andrade, P.B.; Valentão, P.; Silva, B.M.; Pereira, J.A.; de Pinho, P.G. Determination of low molecular weight volatiles in Ficus carica using HS-SPME and GC/FID. Food Chem. 2010, 121, 1289–1295. [Google Scholar] [CrossRef]
  20. Poole, C.F. Ionization-based detectors for gas chromatography. J. Chromatogr. A 2015, 1421, 137–153. [Google Scholar] [CrossRef]
  21. Joseph, J.A.; Joseph, J.A.; Akkermans, S.; Akkermans, S.; Van Impe, J.F.M.; Van Impe, J.F.M. Processing Method for the Quantification of Methanol and Ethanol from Bioreactor Samples Using Gas Chromatography–Flame Ionization Detection. ACS Omega 2022, 7, 24121–24133. [Google Scholar] [CrossRef] [PubMed]
  22. Li, H.; Chai, X.-S.; Deng, Y.; Zhan, H.; Fu, S. Rapid determination of ethanol in fermentation liquor by full evaporation headspace gas chromatography. J. Chromatogr. A 2009, 1216, 169–172. [Google Scholar] [CrossRef] [PubMed]
  23. Wang, M.-L.; Choong, Y.-M.; Su, N.-W.; Lee, M.-S. A rapid method for determination of ethanol in alcoholic beverages using capillary gas chromatography. J. Food Drug Anal. 2003, 11, 3. [Google Scholar] [CrossRef]
  24. Savini, F.; Tartaglia, A.; Coccia, L.; Palestini, D.; D’Ovidio, C.; de Grazia, U.; Merone, G.M.; Bassotti, E.; Locatelli, M. Ethanol Determination in Post-Mortem Samples: Correlation between Blood and Vitreous Humor Concentration. Molecules 2020, 25, 2724. [Google Scholar] [CrossRef] [PubMed]
  25. Kilic, T.; Brunner, V.; Audoly, L.; Carrara, S. Smart e-Patch for drugs monitoring in schizophrenia. In Proceedings of the 2016 IEEE International Conference on Electronics, Circuits and Systems (ICECS), Monte Carlo, Monaco, 11–14 December 2016; pp. 57–60. [Google Scholar] [CrossRef]
  26. Mihretu, L.D.; Gebru, A.G.; Mekonnen, K.N.; Asgedom, A.G.; Desta, Y.H. Determination of ethanol in blood using headspace gas chromatography with flameionization detector (HS-GC-FID): Validation of a method. Cogent Chem. 2020, 6, 1760187. [Google Scholar] [CrossRef]
  27. Lo, M.-M.; Benfodda, Z.; Bénimélis, D.; Fontaine, J.-X.; Molinié, R.; Meffre, P. Development of a HS-SPME/GC-MS Method for the Extraction and Identification of the Volatile Compounds Emitted by Flowers of Tillandsia xiphioides. ACS Omega 2021, 6, 12691–12698. [Google Scholar] [CrossRef] [PubMed]
  28. Bariya, M.; Nyein, H.Y.Y.; Javey, A. Wearable sweat sensors. Nat. Electron. 2018, 1, 160–171. [Google Scholar] [CrossRef]
  29. Bruce, P.; Minkkinen, P.; Riekkola, M.-L. Practical method validation: Validation sufficient for an analysis method. Microchim. Acta 1998, 128, 93–106. [Google Scholar] [CrossRef]
  30. ICH. Validation of Analytical Procedures: Text and Methodology Q2(R1). 2014. Available online: www.somatek.com (accessed on 27 January 2022).
Figure 1. SPME-GC-FID procedure developed for ethanol detection.
Processes 12 00247 g001
Figure 7. Calibration curves for different extraction conditions. Ethanol concentration: 10 mg/L; NaCl addition: 30%; extraction time: 20 min; extraction temperature: 30 °C.
Processes 12 00247 g007
Figure 8. Calibration curves for different matrices in the optimized conditions (ethanol concentration: 10 mg/L; NaCl addition: 30%; extraction time: 20 min; extraction temperature: 30 °C. A—ultrapure water; B—PBS; C—sweat.
Processes 12 00247 g008
Table 1. Artificial Sweat and PBS Solution Composition.
CompoundConcentration
Artificial SweatPBS
NaClSodium Chloride20 g/L80 g/L
NH4ClAmonium Chloride17.5 g/L-
CH3COOHAcetic Acid5 g/L-
C3H6O3Lactc Acid15 g/L-
C6H8O6Ascorbic Acid0.0018 g/L-
C6H12O6Glucose0.030 g/L-
C5H9NO4Glutamic Acid0.054 g/L-
CH4N2OUrea0.006 g/L-
KCLPotassium Chloride-2 g/L
NH2HPO4Disodium phosphate-14.4 g/L
KH2PO4Monopotassium phosphate-2.4 g/L
Table 2. Quantitative Parameters Analysis from the Calibration Curve presented in Figure 7.
GC-ConditionsEquationR2LOD (mg/L)LOQ
(mg/mL)
30 °C_20min_30%NaCl (Matrix A)y = 12520.6x + 6790.30.998750.220.68
Table 3. Quantitative Parameters Analysis from the Calibration Curves presented in Figure 8.
MatrixEquationR2LOD
(mg/L)
LOQ
(mg/L)
Reproducibility
Intra Day
n = 5
Inter Day
n = 5
Ay = 12,710.7x + 6534.40.998750.220.683.8%5.1%
By = 1999.8x + 1124.80.988000.360.966.4%14.5%
Cy = 2130.2x + 1581.90.997890.431.293.8%15.2%
Disclaimer/Publisher’s Note: The statements, opinions and data contained in all publications are solely those of the individual author(s) and contributor(s) and not of MDPI and/or the editor(s). MDPI and/or the editor(s) disclaim responsibility for any injury to people or property resulting from any ideas, methods, instructions or products referred to in the content.

