Article

Utilization of Silicon Dust to Prepare Si3N4 Used for Steelmaking Additives: Thermodynamics and Kinetics

1
The State Key Laboratory of Refractories and Metallurgy, Wuhan University of Science and Technology, Wuhan 430081, China
2
Centre for Pyrometallurgy, Department of Materials Science & Metallurgical Engineering, University of Pretoria, Pretoria 0002, South Africa
3
Key Laboratory for Ferrous Metallurgy and Resources Utilization of Ministry of Education, Wuhan University of Science and Technology, Wuhan 430081, China
*
Author to whom correspondence should be addressed.
Processes 2024, 12(2), 301; https://doi.org/10.3390/pr12020301
Submission received: 9 January 2024 / Revised: 23 January 2024 / Accepted: 29 January 2024 / Published: 31 January 2024

Abstract

:
Silicone monomers are the basic raw materials for the preparation of silicone materials. The secondary dust generated during the preparation of silicone monomer by the Rochow–Müller method is a fine particulate waste with high silicon content. In this paper, the physical and chemical properties of silicon powder after pretreatment were analyzed, and an experimental study was conducted on the use of silicon dust in the preparation of Si3N4, a nitrogen enhancer for steelmaking, by direct nitriding method in order to achieve the resourceful use of this silicon dust. Furthermore, the thermodynamics and kinetics of the nitriding process at high temperatures were analysed using FactSage 8.1 software and thermogravimetric experiments. The results indicate that after holding at a temperature range of 1300~1500 °C for 3 h, the optimal nitriding effect occurs at 1350 °C, with a weight gain rate of 26.57%. The nitridation of silicon dust is divided into two stages. The first stage is the chemical reaction control step. The apparent activation energy is 2.36 × 10⁵ kJ·mol−1. The second stage is the diffusion control step. The silicon dust growth process is mainly controlled by vapor–liquid–solid (VLS) and vapor–solid (VS) mechanisms.

1. Introduction

Organosilicon materials find extensive applications in the aerospace, electrical and electronic, chemical and light industries, solar power generation, automotive, machinery, construction, agriculture, and pharmaceutical and medical sectors [1]. The silicone monomer serves as the fundamental raw material for synthesizing silicone materials. Currently, about 90% of the silicone monomers are produced through the Rochow–Müller process involving a direct reaction between chloromethane and industrial silicon [2] utilizing a copper-based catalyst [3]. However, the Rochow–Müller method generates significant quantities of fine silicon dust with low apparent density that poses challenges in storage and utilization. Accumulation of this dust not only leads to resource wastage but also presents potential environmental concerns. The Rochow–Müller waste is mainly composed of high boiling point organosilicon monomers and unreacted silicon dust, copper powder, and impurities such as Fe, Cl, etc. [4].
To effectively utilize solid waste generated during the preparation of organic silicon monomers, it is necessary to remove impurities such as copper and chlorine. For this reason, a variety of impurity removal methods have been developed. Fu [5] prepared SiCl4 with a mixture of organic silicon dust and chlorine in a fluidized bed, and the selectivity of SiCl4 was 95.76~96.11%. Feng [6] oxidized and leached the organic silicon dust using hydrochloric acid and hydrogen peroxide, removed impurities such as carbon powder, and obtained high-purity silicon powder with a purity of 99%. Nano-silicon was prepared as a high-performance anode material for lithium-ion batteries by He [7] using organic silicon dust, which improved the electrochemical performance. Lu [8] used the silicon dust obtained after acid leaching of organic silicon dust as a catalyst co-carrier for CO synthesis of methane. Additionally, the residual silicon in the organic silicon dust can be used as a silicon resource for direct synthesis. However, the above methods have some shortcomings, such as a thicker outer layer of oxidation, fewer defect sites to initiate the reaction, and smaller particle sizes. Therefore, researching the resource treatment of silicon dust is crucial to promote the development of the silicone industry.
The Rochow–Müller waste can be pretreated to remove impurities, briquetted, and nitrided at a high temperature to convert Si into Si3N4. Adding Si3N4 to liquid steel during secondary refining enhances the nitrogen content of the steel, effectively improving precipitation strengthening [9] and grain refining [10] in micro-alloyed steel.
The purpose of this paper is to explore ways of utilizing Rochow–Müller dust to prepare Si3N4 by high temperature nitriding of the dust after purification. The mechanism and kinetics of silicon dust nitriding were investigated by thermogravimetric analysis and scanning electron microscopy characterization. The relevant thermodynamic studies were carried out in conjunction with FactSage 8.1 software.

2. Materials and Methods

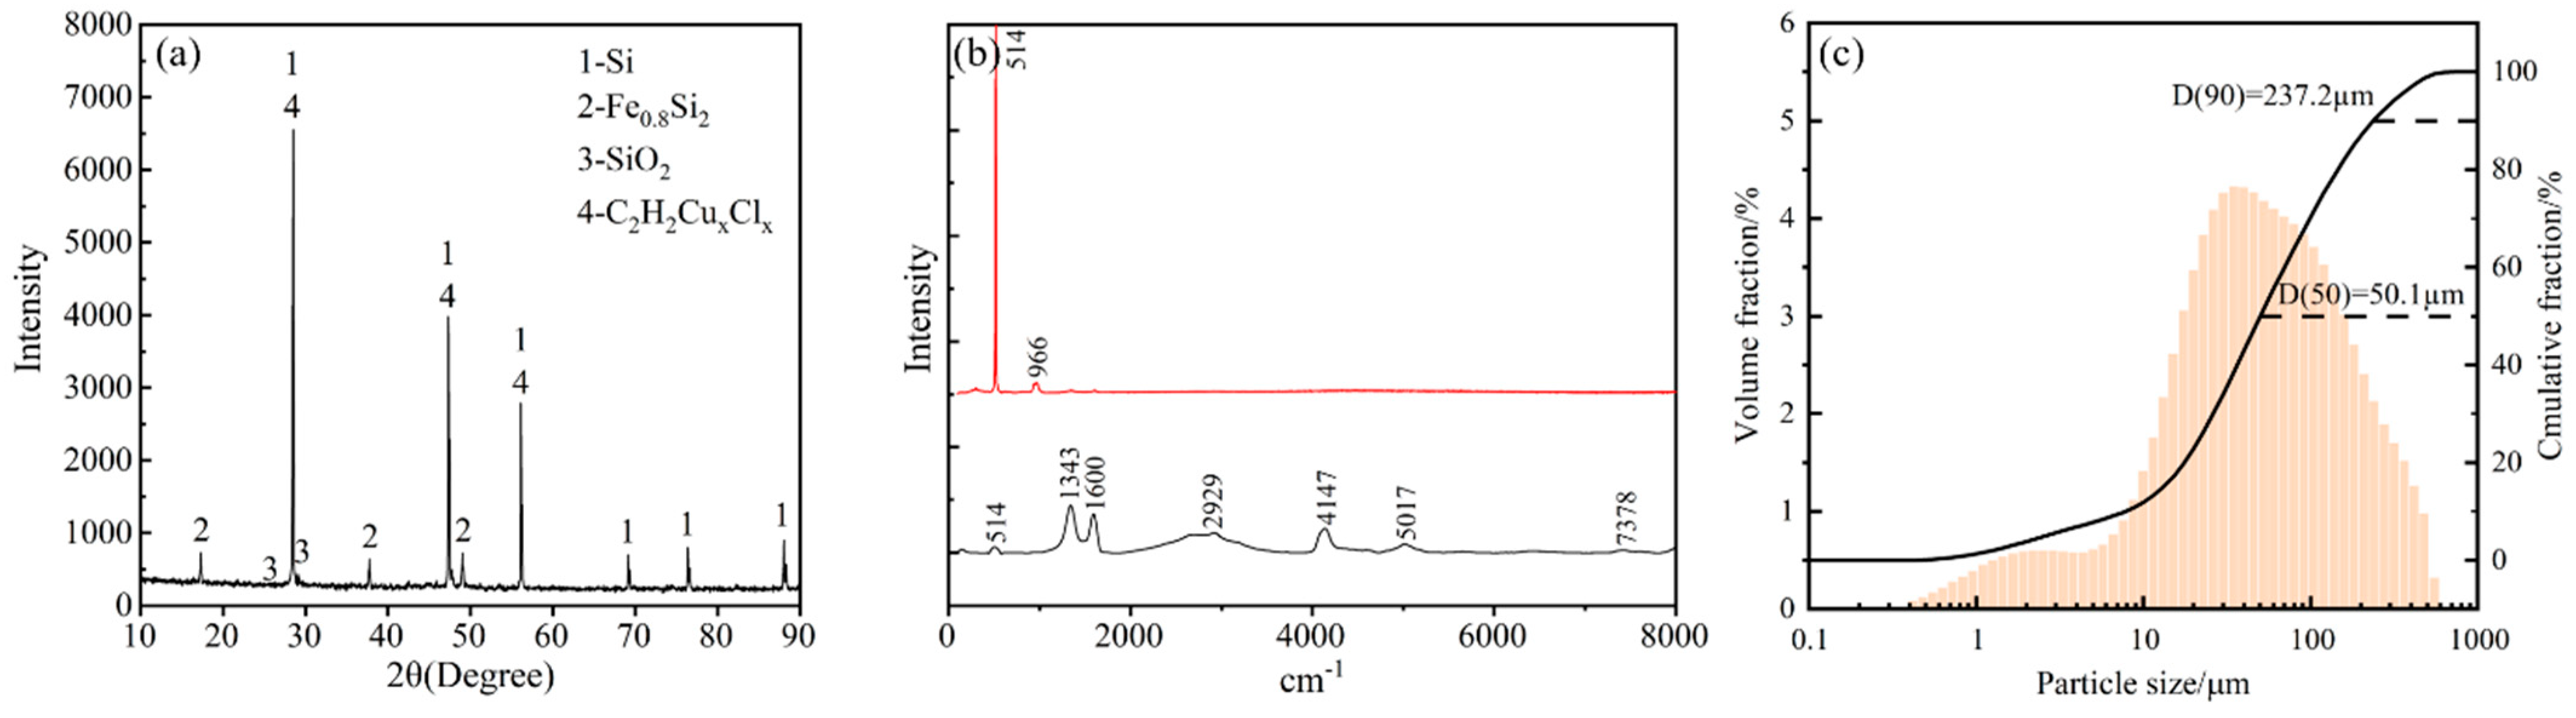
2.1. Analysis of Raw Materials

The raw material for this experiment was obtained by pretreatment of solid waste silicon slag produced by the Rochow–Müller method. After the silicon slag was washed to separate copper and slag, the washed silicon slag was placed in a steaming tank, and the steam was poured into the steaming tank to dry the silicon slag after steaming. After grinding and screening after drying, the obtained product is the raw silicon dust material used in the experiment to remove a large amount of chlorine, copper, and other impurity elements. The mass fractions C and S were analyzed by infrared carbon and sulfur analyzer (LECO, CS-996, St. Joseph, MI, USA), the mass fractions of O and N were determined by oxygen and nitrogen analyzer (LECO, ONH-836, St. Joseph, MI, USA), while the mass fractions of other elements were analyzed by fluorescence spectroscopy (XRF, Thermo Scientific, ARL 9900, Waltham, MA, USA). The results of the chemical analysis are shown in Table 1. As seen in Table 1, the main components of the pre-treated dust are Si and Fe, together with a variety of impurities.
Phase analysis was carried out using X-ray diffraction (XRD, X’Pert Pro, Bruker, Germany) and Raman spectrometry (Raman, Renishaw, inVia Qontor, Renishaw, UK). The X-ray diffraction analysis was performed using a Cu anode target with a wavelength λ of 1.54056 Å. The scanning was carried out by step scanning with a scanning speed of 0.02 °/step, and the diffraction angle 2θ was varied in the range of 10 to 90 °. For Raman spectroscopy analysis, a 532 nm laser was used as the laser light source with a minimum output power of 50 mW and a spectral range of 100–8000 cm−1. Dust particle size was determined using an MS200 laser particle size analyzer. Results of the XRD, Raman spectroscopy, and particle size analysis are shown in Figure 1a–c, respectively.
The silicon dust is not pure material, resulting in the characteristic curve of the Raman spectrum mainly composed of two lines of Figure 1b. The peak of the red curve is silicon and silicon dioxide. The peak value of the black curve represents the remaining impurities. Raman peaks of 514 cm−1 and 1342 cm−1 are characteristic of siloxane bonds [11], 1600 cm−1 is the characteristic peak of C=C bonding of aromatic compounds [12], 2929 cm−1 is the characteristic peak of aliphatic CH bonding [13], and 4147 cm−1, 5017 cm−1, and 7378 cm−1 are the characteristic peaks of Si-OH, Si-H, and C-H bonding of silanes, respectively [14]. The analysis shows that the main phases present in the pre-treated dust are Si and Fe0.8Si2, while the impurity elements copper and titanium exist in the form of chlorides. The dust also contains a small amount of SiO2, aromatic ring compounds, aliphatic compounds, alkanes, silanes, and other organic substances.
A scanning electron microscope (SEM, ZEISS ASIN EVO10, Carl Zeiss AG, Jena, Germany) equipped with an energy dispersive spectrometer (EDS, X-Max 80, Oxford Instruments, Abingdon, UK) was used to observe the microscopic morphology. The scanning electron microscope was analysed using a tungsten filament at an accelerating voltage of 0.2–30 kV, a pressure of less than 400 Pa, and a probe current continuously adjustable in the range of 0.5 PA–5 μA. As shown in Figure 2a, the local magnification reveals that it consists of two types of particles. Based on the EDS results, it was found that the first type of powder has bright white ferrosilicon particles attached to the surface, as shown in Figure 2b. The other type of powder particles have a mixture of Si and SiO2 on the surface, with pits of different sizes as shown in Figure 2c, and there are pits of different sizes, which are caused by the erosion by copper during the preparation of organosilicon monomers using the Rochow–Müller process [15].

2.2. Experimental Methods

Experimental work was divided into two phases. In the first phase the degree of nitridation as a function of temperature at a fixed reaction time was established. During the second phase the rate of nitridation at various temperatures was measured.
To prepare the sample, 15 g of silicon dust was weighed and pressed into a cylindrical specimen with a diameter of 20 mm using a press with a molding pressure of 30 MPa. The molded specimen was placed in a circulating drying oven and dried at 110 °C for 2 h and then prepared for use. The experiment was divided into two parts; firstly, the nitriding effect of the specimens at different temperatures was investigated: the dried samples were put in alumina crucibles and placed in a carbon tube resistance heating furnace and heated to a temperature between 1200 °C to 1650 °C at a rate of 25 °C/min. After reaching the target temperature the sample was held at temperature for 20 min before the furnace was cooled to room temperature. During heating the whole process, a high-purity nitrogen (99.999%) was flowing through the furnace at 5 L/minute.
Based on the results of the above experiments, a temperature range of 1300~1500 °C was selected for the kinetic study of the nitridation reaction. In order to avoid the nitridation of the silicon dust during the heating process, a flowing high-purity (99.999%) argon was used as the protective atmosphere. A flow of 5 L/min of higher-purity nitrogen was introduced immediately after the furnace reached the setpoint temperature. The mass of the specimen was measured continuously for 3 h using a balance with a precision of 0.001 g.

2.3. Characterization and Analytical Methods

Phase and composition of the samples were analyzed using X-ray diffraction and SEM-EDS analysis. Sample morphology was investigated by means of SEM.
In this experiment, thermogravimetric analysis was adopted to investigate the nitriding mechanism of silicon dust, and the nitriding rate (α) was calculated as shown in Equation (1) [16]:
α = Δ W Si W Si 0 × 100 %
where  W Si 0  and ΔWSi are the initial mass and mass of the sample, respectively.
The mass of Si in the specimen ( W Si 0 ) is equal to the product of the total mass of the specimen ( W 0 ) and the mass percentage of Si in the specimen ( ω Si ):
W Si 0 = ω Si W 0
The increase in mass of the specimen during nitriding (ΔW) is equal to the increase in nitrogen in Si3N4 in the product (ΔWN):
Δ W = Δ W N
According to the stoichiometric relationship of the reaction that produces Si3N4, there is the following relationship between the moles of Si and N:
Δ W N = 4 M N Δ W Si 3 M Si
In Equation (4), MSi and MN are the molar mass of Si and N, respectively. Combining Equations (1)–(4), the relationship between the nitriding rate of Si dust and the change of specimen mass during the nitriding process can be derived:
α = 3 M s Δ W 4 M N W 0 ω S i × 100 %

3. Results

Figure 3 shows the XRD pattern of the product after holding at 1200~1650 °C for 20 min. It can be seen that no Si3N4 had formed after annealing at 1200 °C. Small amounts of Si3N4 were detected in samples heated to 1300 °C, while for temperatures of 1400 °C and above, large Si3N4 peaks are seen indicating that the nitride formed rapidly at the higher temperatures.
At test temperatures of 1500 °C and lower, small Si2N2O peaks were seen. Above 1500 °C, this compound does not seem to be stable under the test conditions. Si peaks were present for all temperatures below 1650 °C. For samples nitride at 1650 °C, only Si3N4 and small amounts of FeSi were detected.
Observation of 1400 °C reaction temperature conditions are not fully reacted nitridation products, and it can be found that the product particles can mainly have two kinds of morphology. See Figure 4a,b for the two morphologies of the nitride products, and Figure 4c–f for the EDS results of the nitride products. As can be seen through Figure 4, nitridation mainly produced spherical particles (Figure 4a) and massive particles (Figure 4b). The spherical particles are coated with ferrosilicon and grow thicker needle-like Si3N4 whiskers. This is due to the ferrosilicon melting into a liquid at high temperatures, wrapping and driving the aggregation of silicon particles to form spherical particles. The presence of the liquid causes the nitriding mechanism to become a vapor–liquid–solid (VLS) mechanism, resulting in more robust needle-like Si3N4 whiskers. The massive particles morphology after the nitriding reaction in Figure 4b almost remains unchanged compared to the raw material in Figure 2c by comparison of these two figures. However, after nitriding, fibrous Si3N4 is produced at the f of its particles in Figure 4b. This is due to the fact that the surface oxide layer of the massive particles generates SiO gas and reacts with N2 to produce fibrous Si3N4.It is initially inferred that the different morphology of Si3N4 in Figure 4a,b is due to the different mechanism of nitriding [17,18], which will be discussed in detail below.
To study the kinetics and reaction mechanism, the mass change was continuously recorded for a period of 3 h at reaction temperatures of 1300 °C to 1500 °C. The change in sample mass was continuously recorded by the balance to study the relationship of the reaction rate with time. The findings are illustrated in Figure 5. The nitriding rate of silicon dust (slope of the TG curve) with the change of time is almost unchanged before the reaction platform period at temperatures of 1300 °C and 1350 °C. The initial reaction rate increased with a rise in temperature, in agreement with the findings of Wang et al. [19]. However, when the temperature was increased to 1400~1500 °C, the reaction rate gradually decreased with the nitriding reaction, and the TG curve increased slowly at the late stage. Comparison of the morphology of the raw materials and products at different temperatures, as illustrated in the bottom right of Figure 5, suggests that the silicon dust in a liquid phase agglomerates silicon particles to form a block phase at high temperatures, which leads to the briquettes becoming compact and durable and, consequently, disrupts the nitriding reaction from proceeding [20]. Especially when the temperature exceeds the melting point of Si at 1414 °C, melting of silicon dust is clearly seen. Additionally, due to the exothermic nature of the reaction, the temperature within the sample may surpass that of the furnace, leading to a substantial increase in liquid phase generation and a decrease in nitridation rates. As the reaction is exothermic, the temperature in the sample may exceed the furnace temperature, resulting in intensified lumpy gathering and diminished nitridation rates.
Phases formed after nitriding for 3 h at various temperatures are indicated in the XRD diffractograms in Figure 6. The products indicate various combinations of Si, FeSi2, FeSi, α-Si3N4, β-Si3N4, and Si2N2O, depending on the treatment temperature. The resulting nitriding products are due to the reaction of N2 reaction gas with O in the raw materials at high temperatures, producing different Si3N4 and Si2N2O phases [21]. At the same time, comparing Figure 5 and Figure 6, it can be found that the peak ratio of Si and nitride products is consistent with the change rule of the TG curve.
Meanwhile, by comparing the peak values of the products at different temperatures, it is evident that temperature significantly impacts the proportion of phase composition in the products. As the temperature increases, the proportion of peak values for α-Si3N4 and Si2N2O in the nitridation products gradually reduces. At the temperature of 1500 °C, there is a minor presence of α-Si3N4 and Si2N2O, whereas the majority of the products undergo nitridation, leading to the formation of β-Si3N4. The morphology of α-Si3N4 is primarily obtained via the reaction of Si vapor or SiO gas with nitrogen to produce fluffy and needle-shaped particles, and occasionally via the reaction of solid Si and N2, resulting in irregularly shaped particles. The formation of β-Si3N4 morphology predominantly results from the reaction between solid Si and N2 or the transformation of the α-phase, ultimately leading to the creation of irregular masses and prisms [22,23,24,25].
Comparison of the SEM images of nitriding at varying temperatures is depicted in Figure 7. When reacted at 1300 °C, the nitride products are basically all needle-like α-phase, as seen in Figure 7(a3). A reduction in the α-phase is observed with a rise in reaction temperature. Coincidingly, a gradual increment in the proportion of irregular, lumpy, and prismatic β-phase products with distinct features is noticeable. At 1500 °C reaction, its nitridation products are basically all lumpy β-phase, as seen in Figure 7(e3). Therefore, it can be deduced that high temperatures favour the conversion of the α-phase to the β-phase. Consistent with the findings in Figure 6, which displays the product XRD mapping, this observation is in agreement with the present outcome.

4. Discussion

4.1. Thermodynamic Analysis of Silicon Dust Nitriding

At 1300~1500 °C, the generation of Si3N4 during silicon dust nitriding is mainly related to direct nitriding (Equation (6)) and indirect nitriding (Equations (7) and (8)) [26], and the generation of Si2N2O is mainly related to the reaction (Equations (9) and (10)) [27].
3 Si ( s ) + 2 N 2 ( g ) = Si 3 N 4 ( s ) Δ r G m θ = 745.72 + 0.3314 T   kJ mol 1  
Si ( s ) + SiO 2 ( s ) = 2 SiO ( g ) Δ r G m θ = 710.03 0.3626 T   kJ mol 1
3 SiO ( g ) + 2 N 2 ( g ) = Si 3 N 4 ( s ) + 3 / 2 O 2 ( g ) Δ r G m θ = 445.09 + 0.7676 T   kJ mol 1
3 Si ( s ) + SiO 2 ( s ) + 2 N 2 ( g ) = 2 S i 2 N 2 O ( s ) Δ r G m θ = 927.02 + 0.3124 T   kJ mol 1  
4 SiO ( g ) + 2 N 2 ( g ) = 2 Si 2 N 2 O ( s ) + O 2 ( g )   Δ r G m θ = 1428.63 + 0.8400 T   kJ mol 1  
The phase equilibrium diagram of the Si-N-O system was calculated by Factsage 8.1. In this ternary system, if the partial pressure of N2 in the atmosphere is regarded as 1 atm, it can be seen from Figure 8a that at 1300 °C, it will be reacted to form SiO2 when the partial pressure of oxygen is greater than 1 × 10−17.4 atm. On the other hand, it will be reacted to form Si2N2O when the partial pressure of oxygen is between 1 × 10−23.7 atm and 1 × 10−17.4 atm, and only when the oxygen partial pressure is less than 1 × 10−23.7 atm, it will react to form Si3N4. Thus, in the production of Si3N4, a low oxygen partial pressure is vital for optimal silicon nitride synthesis [28].
By comparing the phase equilibrium diagrams illustrated for the Si-N-O system at various temperatures in Figure 8, it is evident that the dominant region of Si3N4 shifts towards the right with an increase in temperature. Furthermore, it reacts to generate Si3N4 at 1500 °C, provided that the partial pressure of oxygen is less than 1 × 10−18.3 atm. This observation indicates that increasing the temperature is beneficial for transforming silicon oxides to nitrides, and this is confirmed by the XRD analysis in Figure 3 and Figure 6.

4.2. Kinetic Analysis of Silicon Dust Nitriding

In order to obtain the kinetic parameters of the nitriding process, isothermal nitriding experiments were carried out at 1300~1500 °C, and the kinetic equation can be written as Equation (11).
G ( α ) = k t
where α is the reaction progress of the reactants, G(α) is the rate integral equation, t is the reaction time (min), and k is the chemical reaction rate constant (min−1). k can be described by the Arrhenius equation as shown in Equation (12):
k = A exp ( Δ E R T   )
where T is the reaction temperature, A is the preexponential factor, E is the apparent activation energy of the reaction, and R is the molar gas constant.
The nitridation of silicon dust is a gas–solid reaction, and the commonly used kinetic models for gas–solid reactions are chemical reaction, diffusion control, and phase–interface reaction. Table 2 consolidates the most frequently employed rate integral equations for solid–phase reactions [29].
In view of the characteristics of the TG curve in Figure 5, it can be found that the kinetic control mechanism changes with the reaction process under high temperature conditions. Based on the kinetic fitting results of different models, the reaction can be broadly segmented into two temperature and time intervals. The first phase pertains to the liquid-phase aggregation and solidification that did not occur, and exhibits linear mass change and reaction time. The second phase is characterized by the liquid-phase aggregation and solidification that occurs, and exhibits non-linear mass change and reaction time. Specific reaction temperature and time intervals are shown in Table 3, and graphs were fitted linearly based on the intervals specified in the table. Table 4 presents the results obtained from this analysis. Rx represents the fitting result of the x stage in Table 3, RAVG1 represents the fitting result of Phase I in Table 3, and RAVG2 represents the fitting result of Phase II in Table 3.
According to Table 4, it is evident that the R1 model exhibited the highest R value of 0.9979 in the initial stage and hence, can be deemed as the most compatible rate model [30]. The linear regression analysis outputs are illustrated in Figure 9a. Each curve’s slope signifies the corresponding chemical reaction rate constant, k, at the relevant temperature. For the convenience of computation, taking the base of both sides of Equation (12) to be the logarithm of a natural constant, respectively, leads to Equation (13). The rate constants k obtained at different temperatures were substituted into Equation (13) and plotted, and the results are shown in Figure 9b. According to the slope and the intercept, the apparent activation energy and the preexponential factor of the first step of the reaction can be obtained as 2.36 × 10⁵ kJ·mol−1 and 2.00 × 10⁵ min−1, respectively. The correlation coefficient of this fitting result R > 0.998 indicates that the reaction of nitriding silicon dust at 1300~1400 °C is indeed in accordance with the interfacial reaction model, and the reaction progress equation can be expressed as Equation (14).
ln k = Δ E R × 1 T + ln A
a = 2.00 × 10 5 exp ( 236,412 R T ) t
In the second stage, the D4 model achieved the highest R-value of 0.9963, suggesting that diffusion control is the most compliant control stage. Assuming that the silicon dust particles comprise numerous small spherical particles, nitrogen diffuses through the pores between the particles for the reaction. At high temperatures, the reaction temperature and heat of the reaction result in the liquefaction of a large number of Si particles, leading to liquid-phase aggregation and solidification. Consequently, the surface of the sample becomes denser, and porosity decreases. As a result, it is more challenging for N2 to enter the sample for reaction [31]. Thus, temperatures exceeding the melting point of Si at 1414 °C hinder the reaction process. Increased temperature leads to increased liquid-phase aggregation and solidification, resulting in lower reaction rates at 1500 °C compared to lower temperatures.

4.3. Nitriding Mechanism of Silicon Dust

Several fibrous and needle-like mechanisms for the growth of Si3N4 have been proposed in the literature, including the vapor–liquid–solid (VLS) and vapor–solid (VS) mechanisms [32]. To investigate the liquid-phase generation controlling VLS, we calculated the Fe-Si-N2 phase diagram using Factsage 8.1. For a nitrogen partial pressure of 1 atmosphere, it is observable from Figure 10 that the liquid-phase line temperature is 1279 °C when the Si content exceeds 22%. Hence, the liquid phase of ferrosilicon precipitates while nitriding takes place between 1300 °C and 1500 °C, accounting for the ferrosilicon phase encapsulation on the surface of Si particles in Figure 4a. Upon observation of Figure 4a, it is evident that numerous Si3N4 particles with bright white tips are present. Additionally, a specific area was selected and enlarged, resulting in Figure 11. Analysis with EDS revealed that the fibrous material is composed of Si3N4, with the tip particles made up of ferrosilicon. This phenomenon bears a resemblance to that reported by Yong et al. [17]. Using copper as a catalyst to facilitate the nitridation of Si, the formation process is governed by the VLS mechanism, with the liquid phase aiding in the volatilization and subsequent reaction of Si.
Figure 12a depicts the process controlled by the VLS mechanism during the nitriding of Si dust, As the temperature increases, the liquid phase of the Si-Fe alloy is generated and starts to adsorb N2 molecules, and when the dissolved N2 exceeds its solubility, it will precipitate on the surface and react with Si in the liquid phase to generate Si3N4 nuclei. These nuclei keep absorbing Si and N in the gas phase and generate Si3N4 along a certain direction and continue to grow against Si-Fe [33]. At the same time, the change in the morphology of the Si particles is due to the exothermic nitriding reaction. The reaction local heat is too high, which promotes the melting and volatilization of Si [34], thus forming spherical particles and promoting the nitriding reaction.
As shown in Figure 4b above, no droplets were observed on the Si3N4 fibrous tip, indicating that its growth is likely driven by the vapor–solid (VS) mechanism [35]. Figure 12b depicts the control process of the VS mechanism of the silicon dust nitriding process. According to reactions (15) and (16), it can be seen that the reaction generates a SiO gas phase at a high temperature with low O2 partial pressure [36]. The formed SiO undergoes the reaction of Equation (8) with N2 to generate Si3N4 nuclei. As SiO is continuously generated, Si3N4 grows in a certain direction to form the fibrous Si3N4. Simultaneously, due to the erosion of the silicon dust raw material by Cu, a lot of pits appear, which increases the effective area of the reaction and promotes the reaction of the VS mechanism to proceed.
Si ( s ) + SiO 2 ( s ) = 2 SiO ( g )
2 SiO 2 ( s ) = 2 SiO ( g ) + O 2 ( g )

5. Conclusions

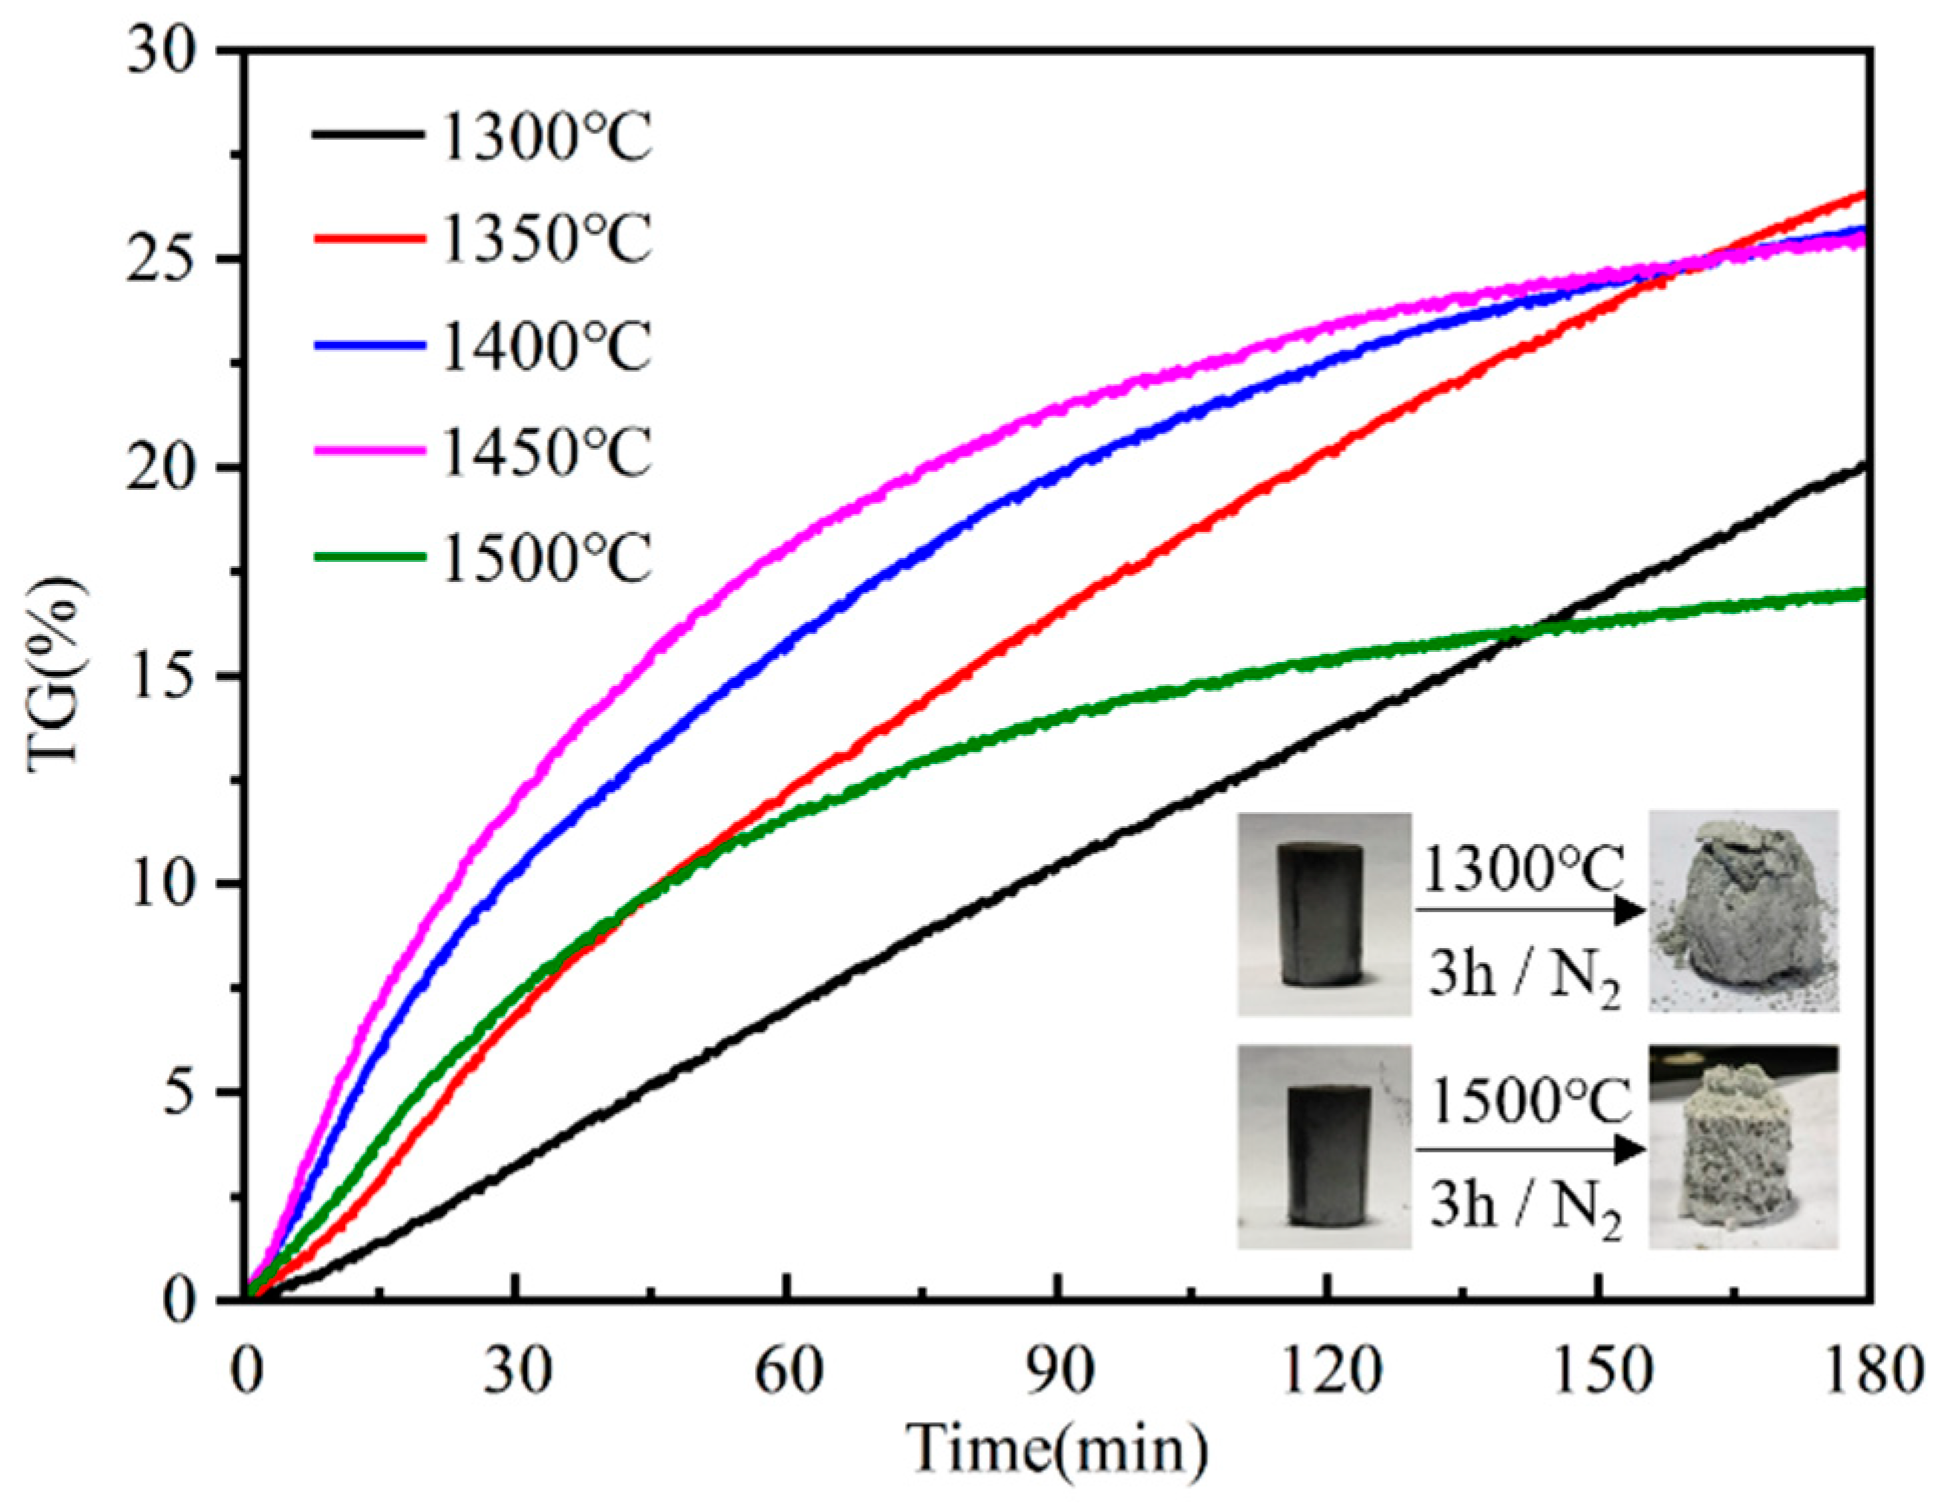
  • This study employs an isothermal thermogravimetric method to investigate the kinetics of the silicon dust nitriding reaction. The results show that when the silicon dust is held at temperatures of 1300, 1350, 1400, 1450, and 1500 °C for a duration of 3 h each, the weight gain rate is highest at 1350 °C (26.57%) and lowest at 1500 °C (16.97%). The reaction temperature of silicon dust nitriding is not the higher the better, but should be adjusted according to the specific reaction conditions.
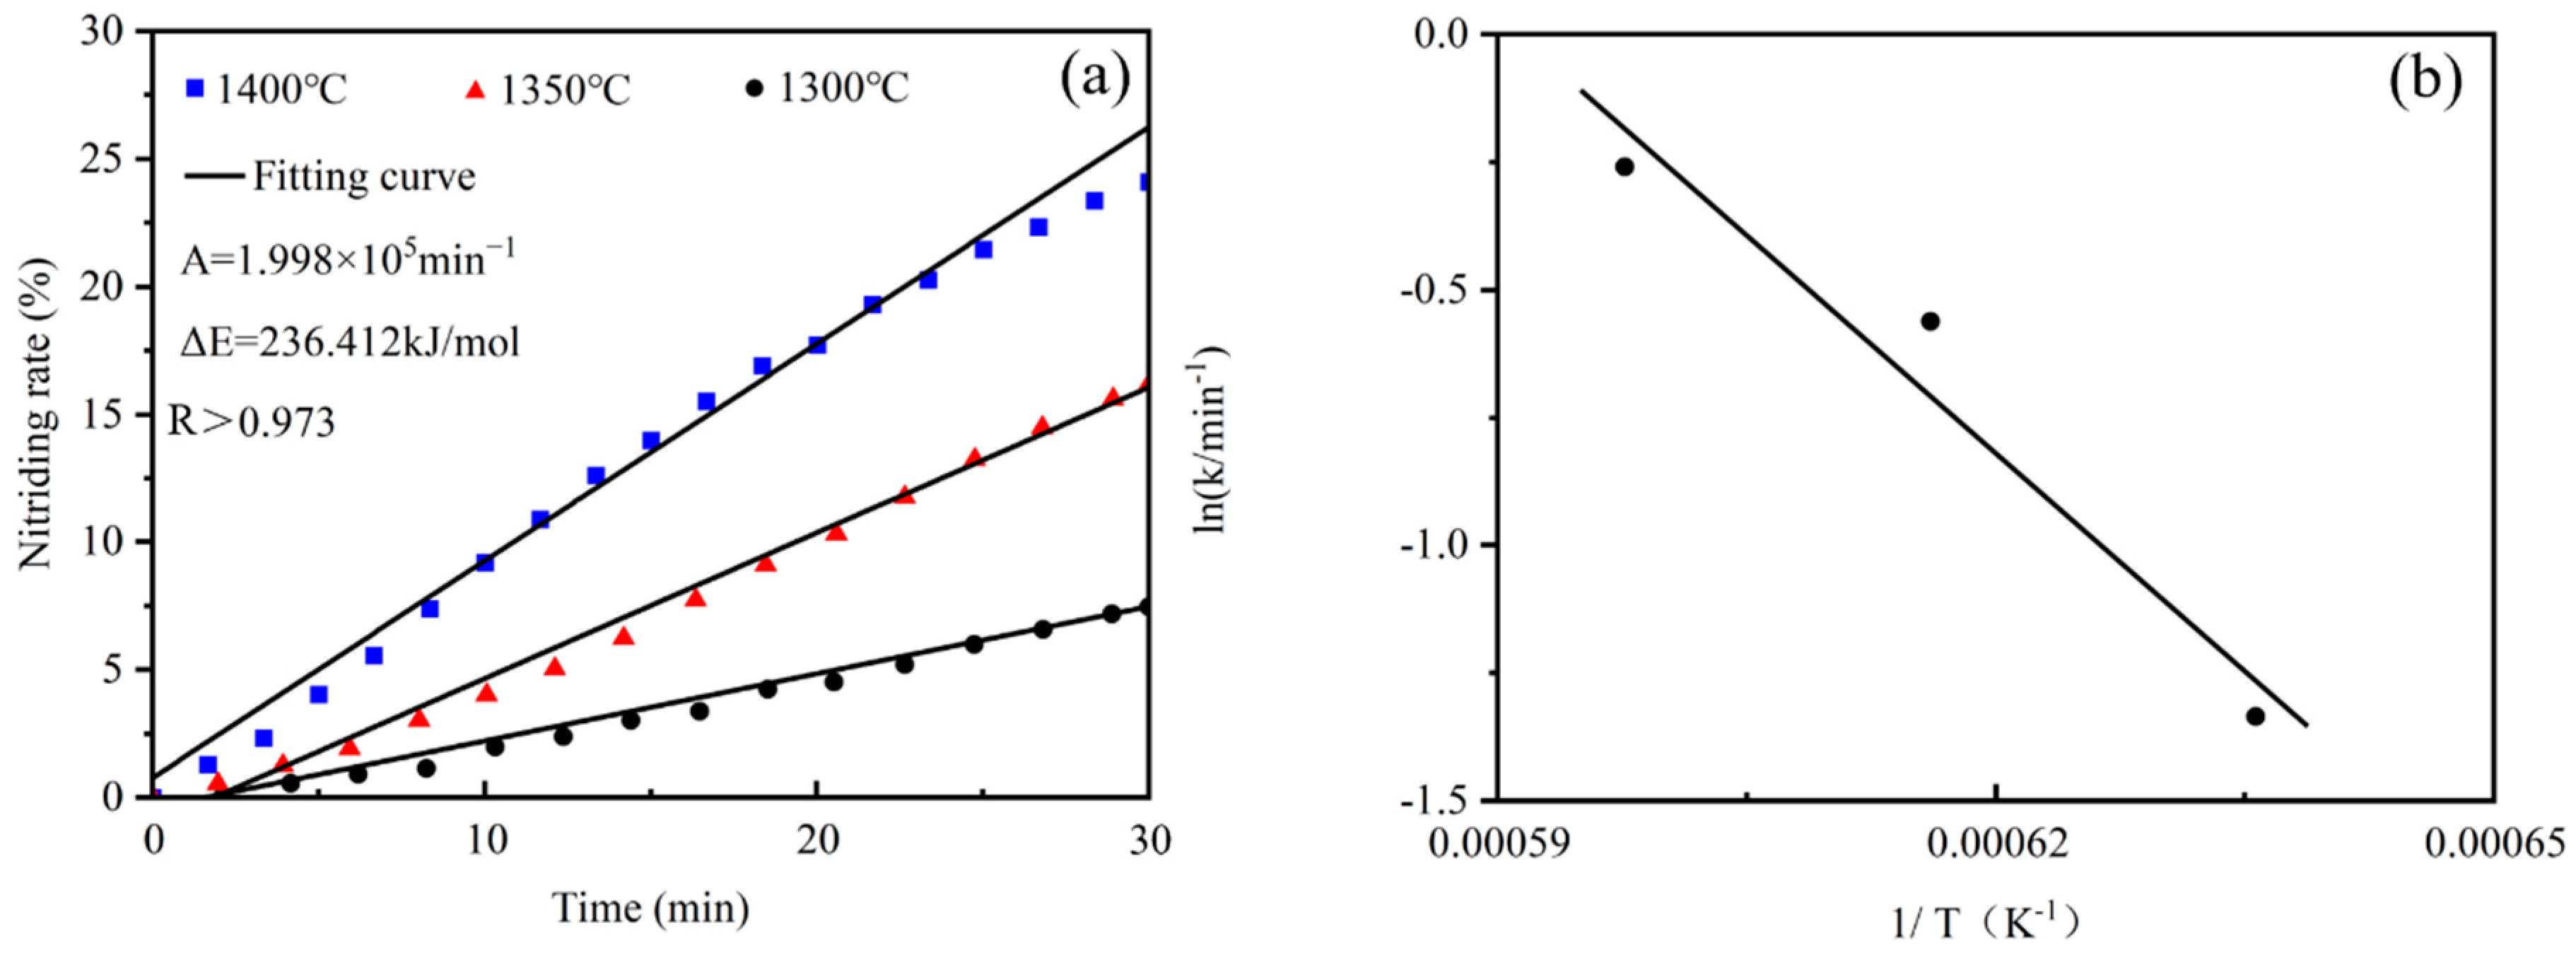
  • Silicon dust nitriding can be divided into two stages. For the first stage of the rate control step for the interfacial chemical reaction, the apparent activation energy is 2.36 × 10⁵ kJ·mol−1, the reaction progress equation. The second stage of the rate control step for the diffusion control is due to the high temperature of the silicon dust occurring in the liquid-phase aggregation and solidification, and the diffusion of N2 has become the limiting link of the reaction rate.
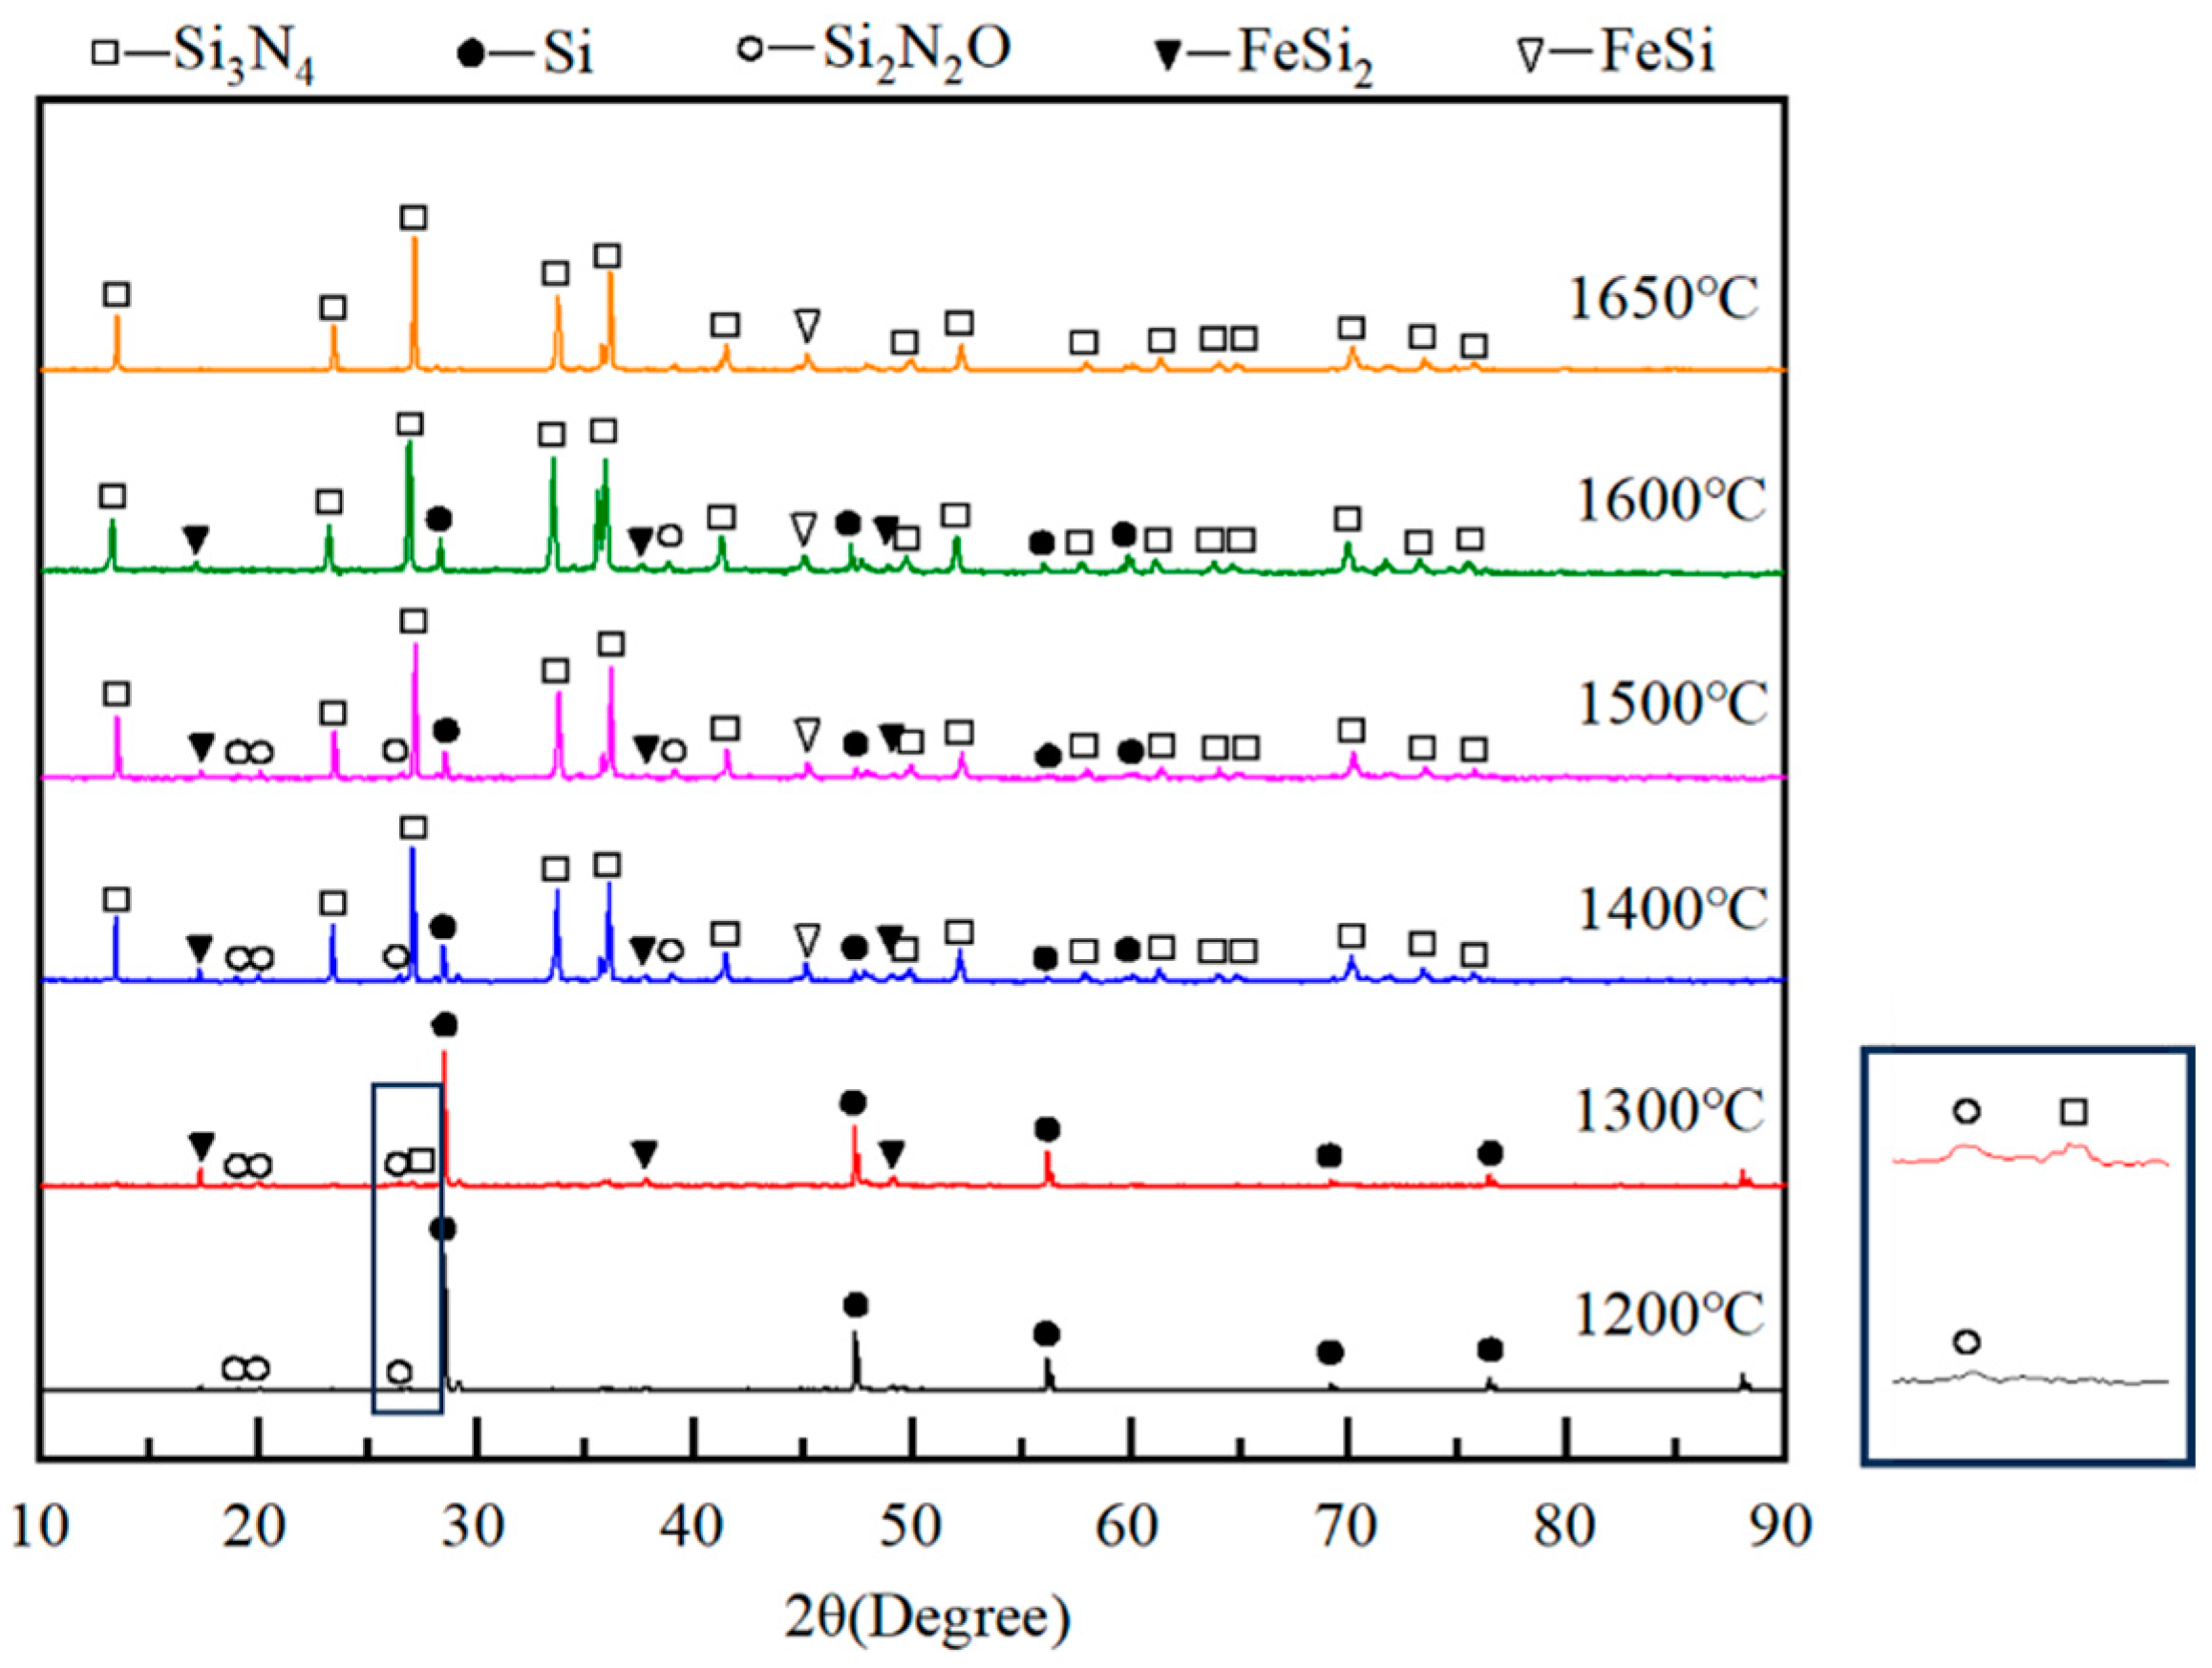
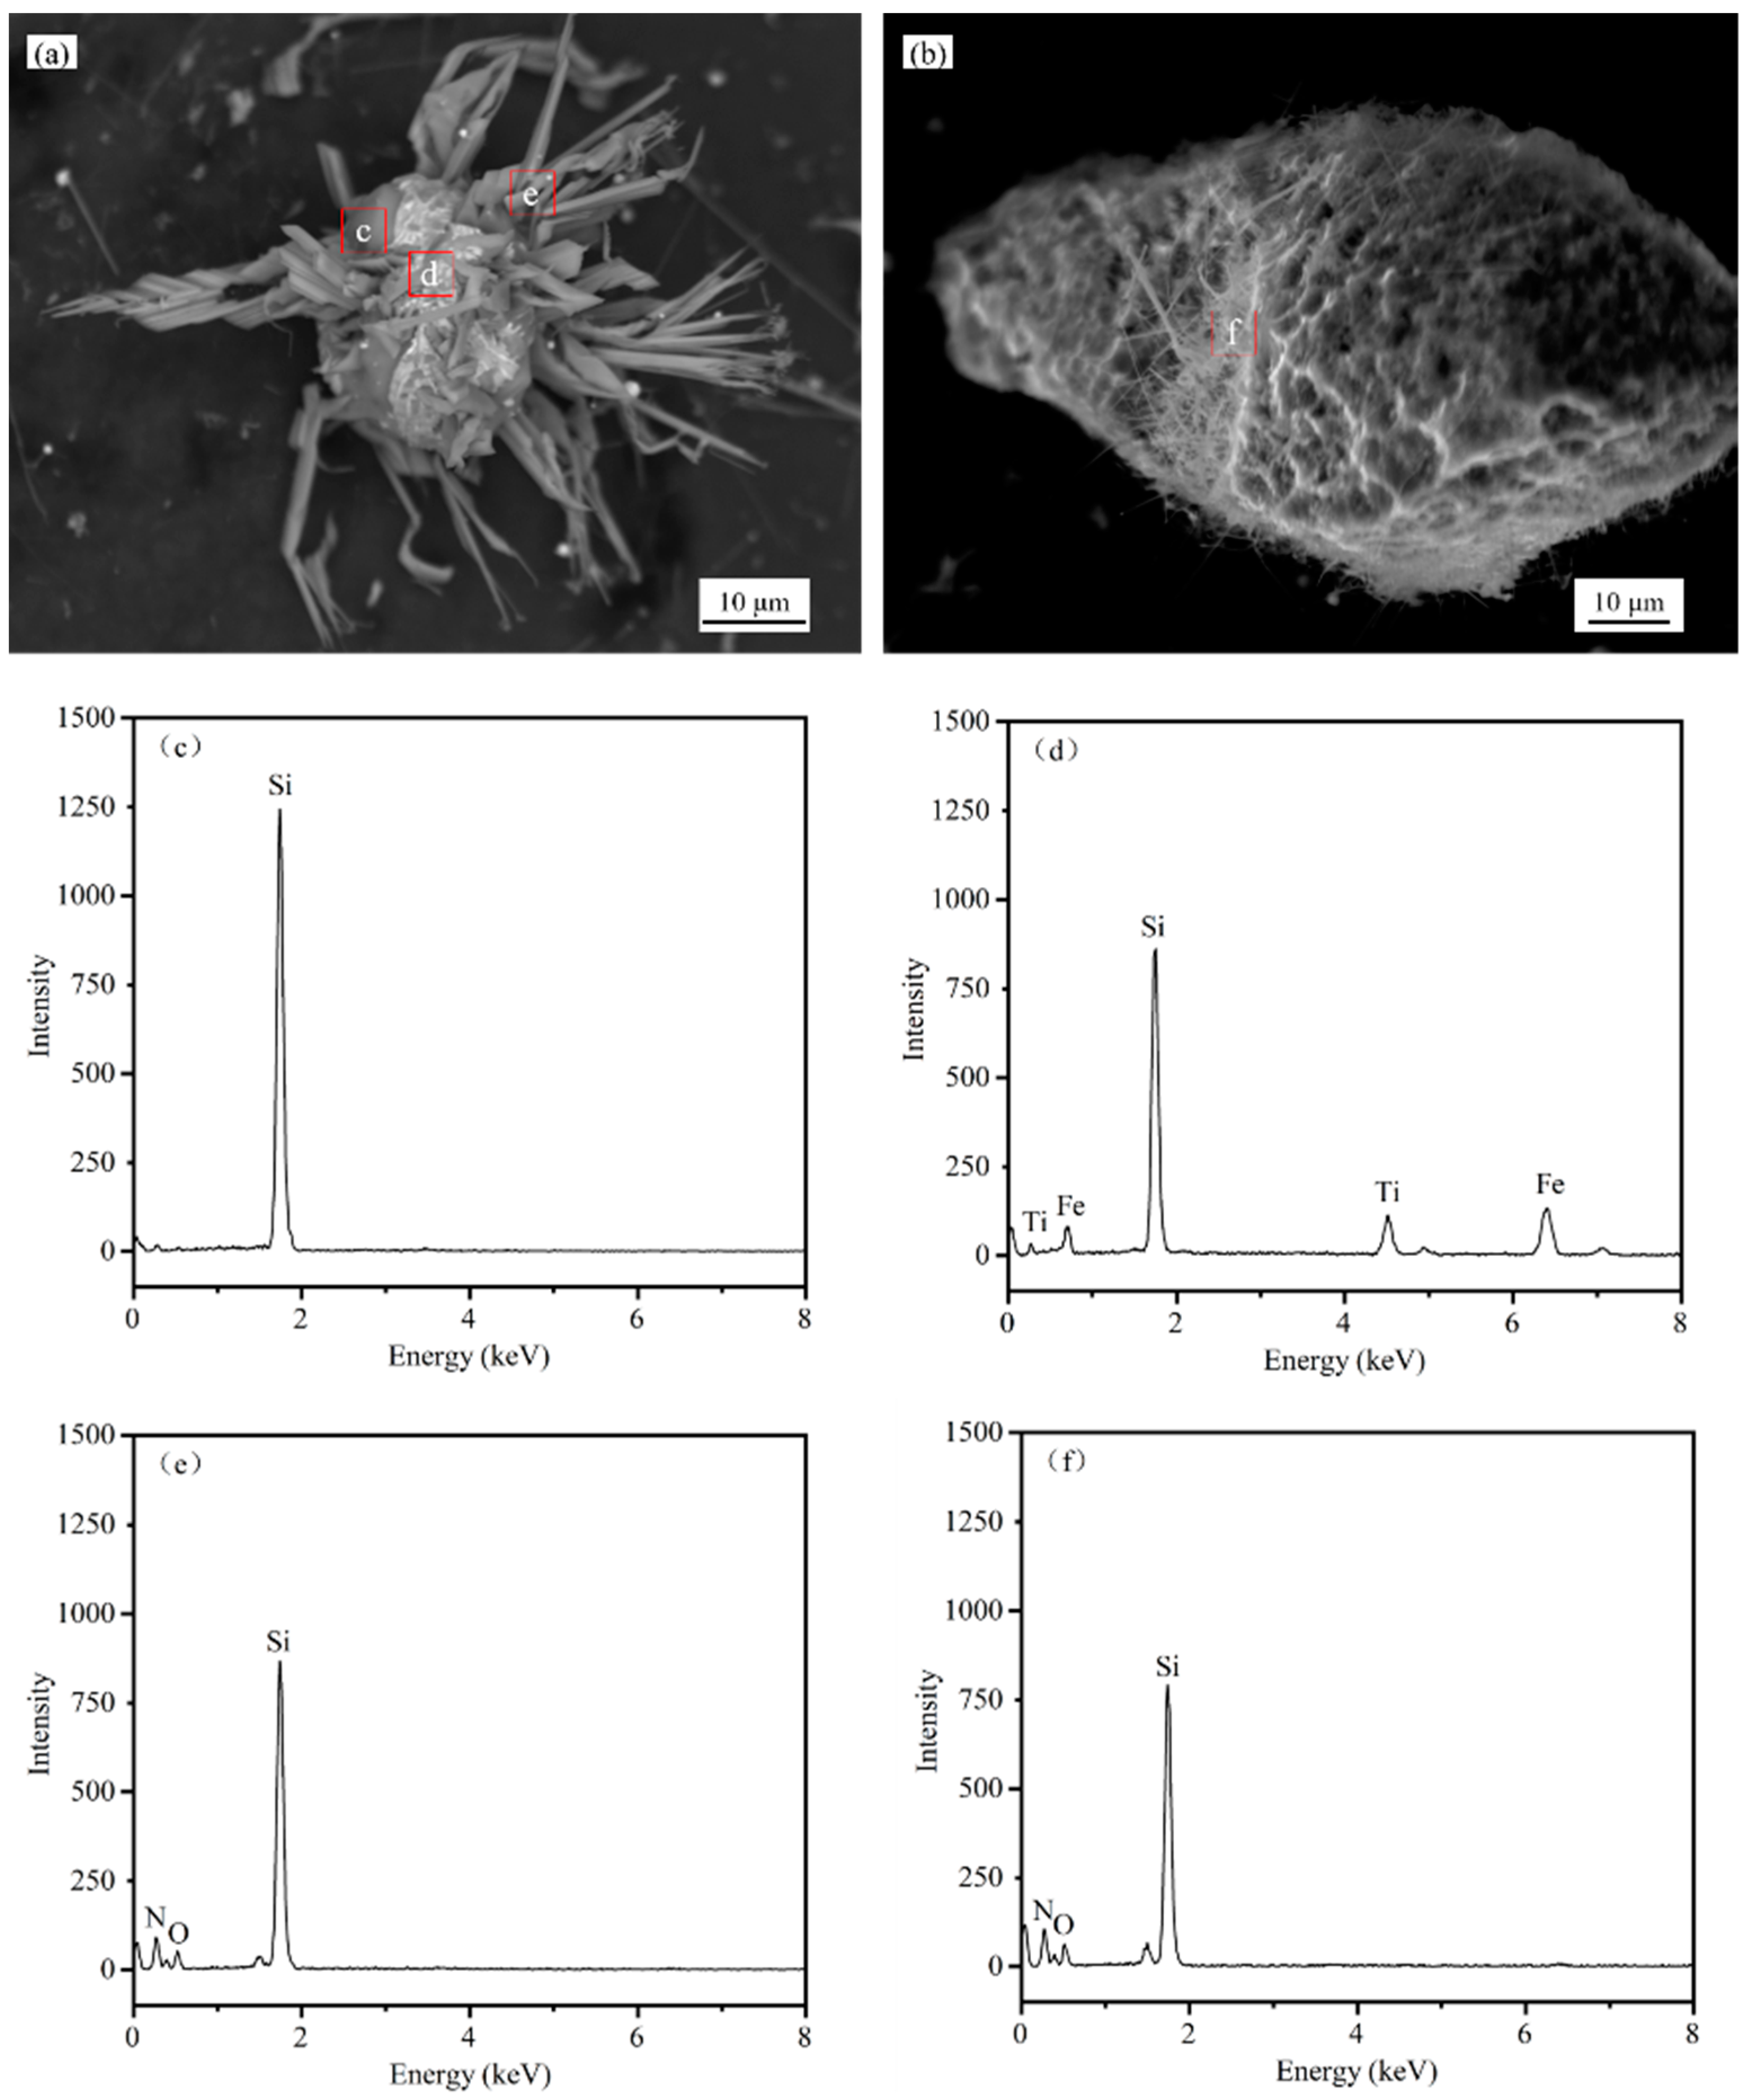
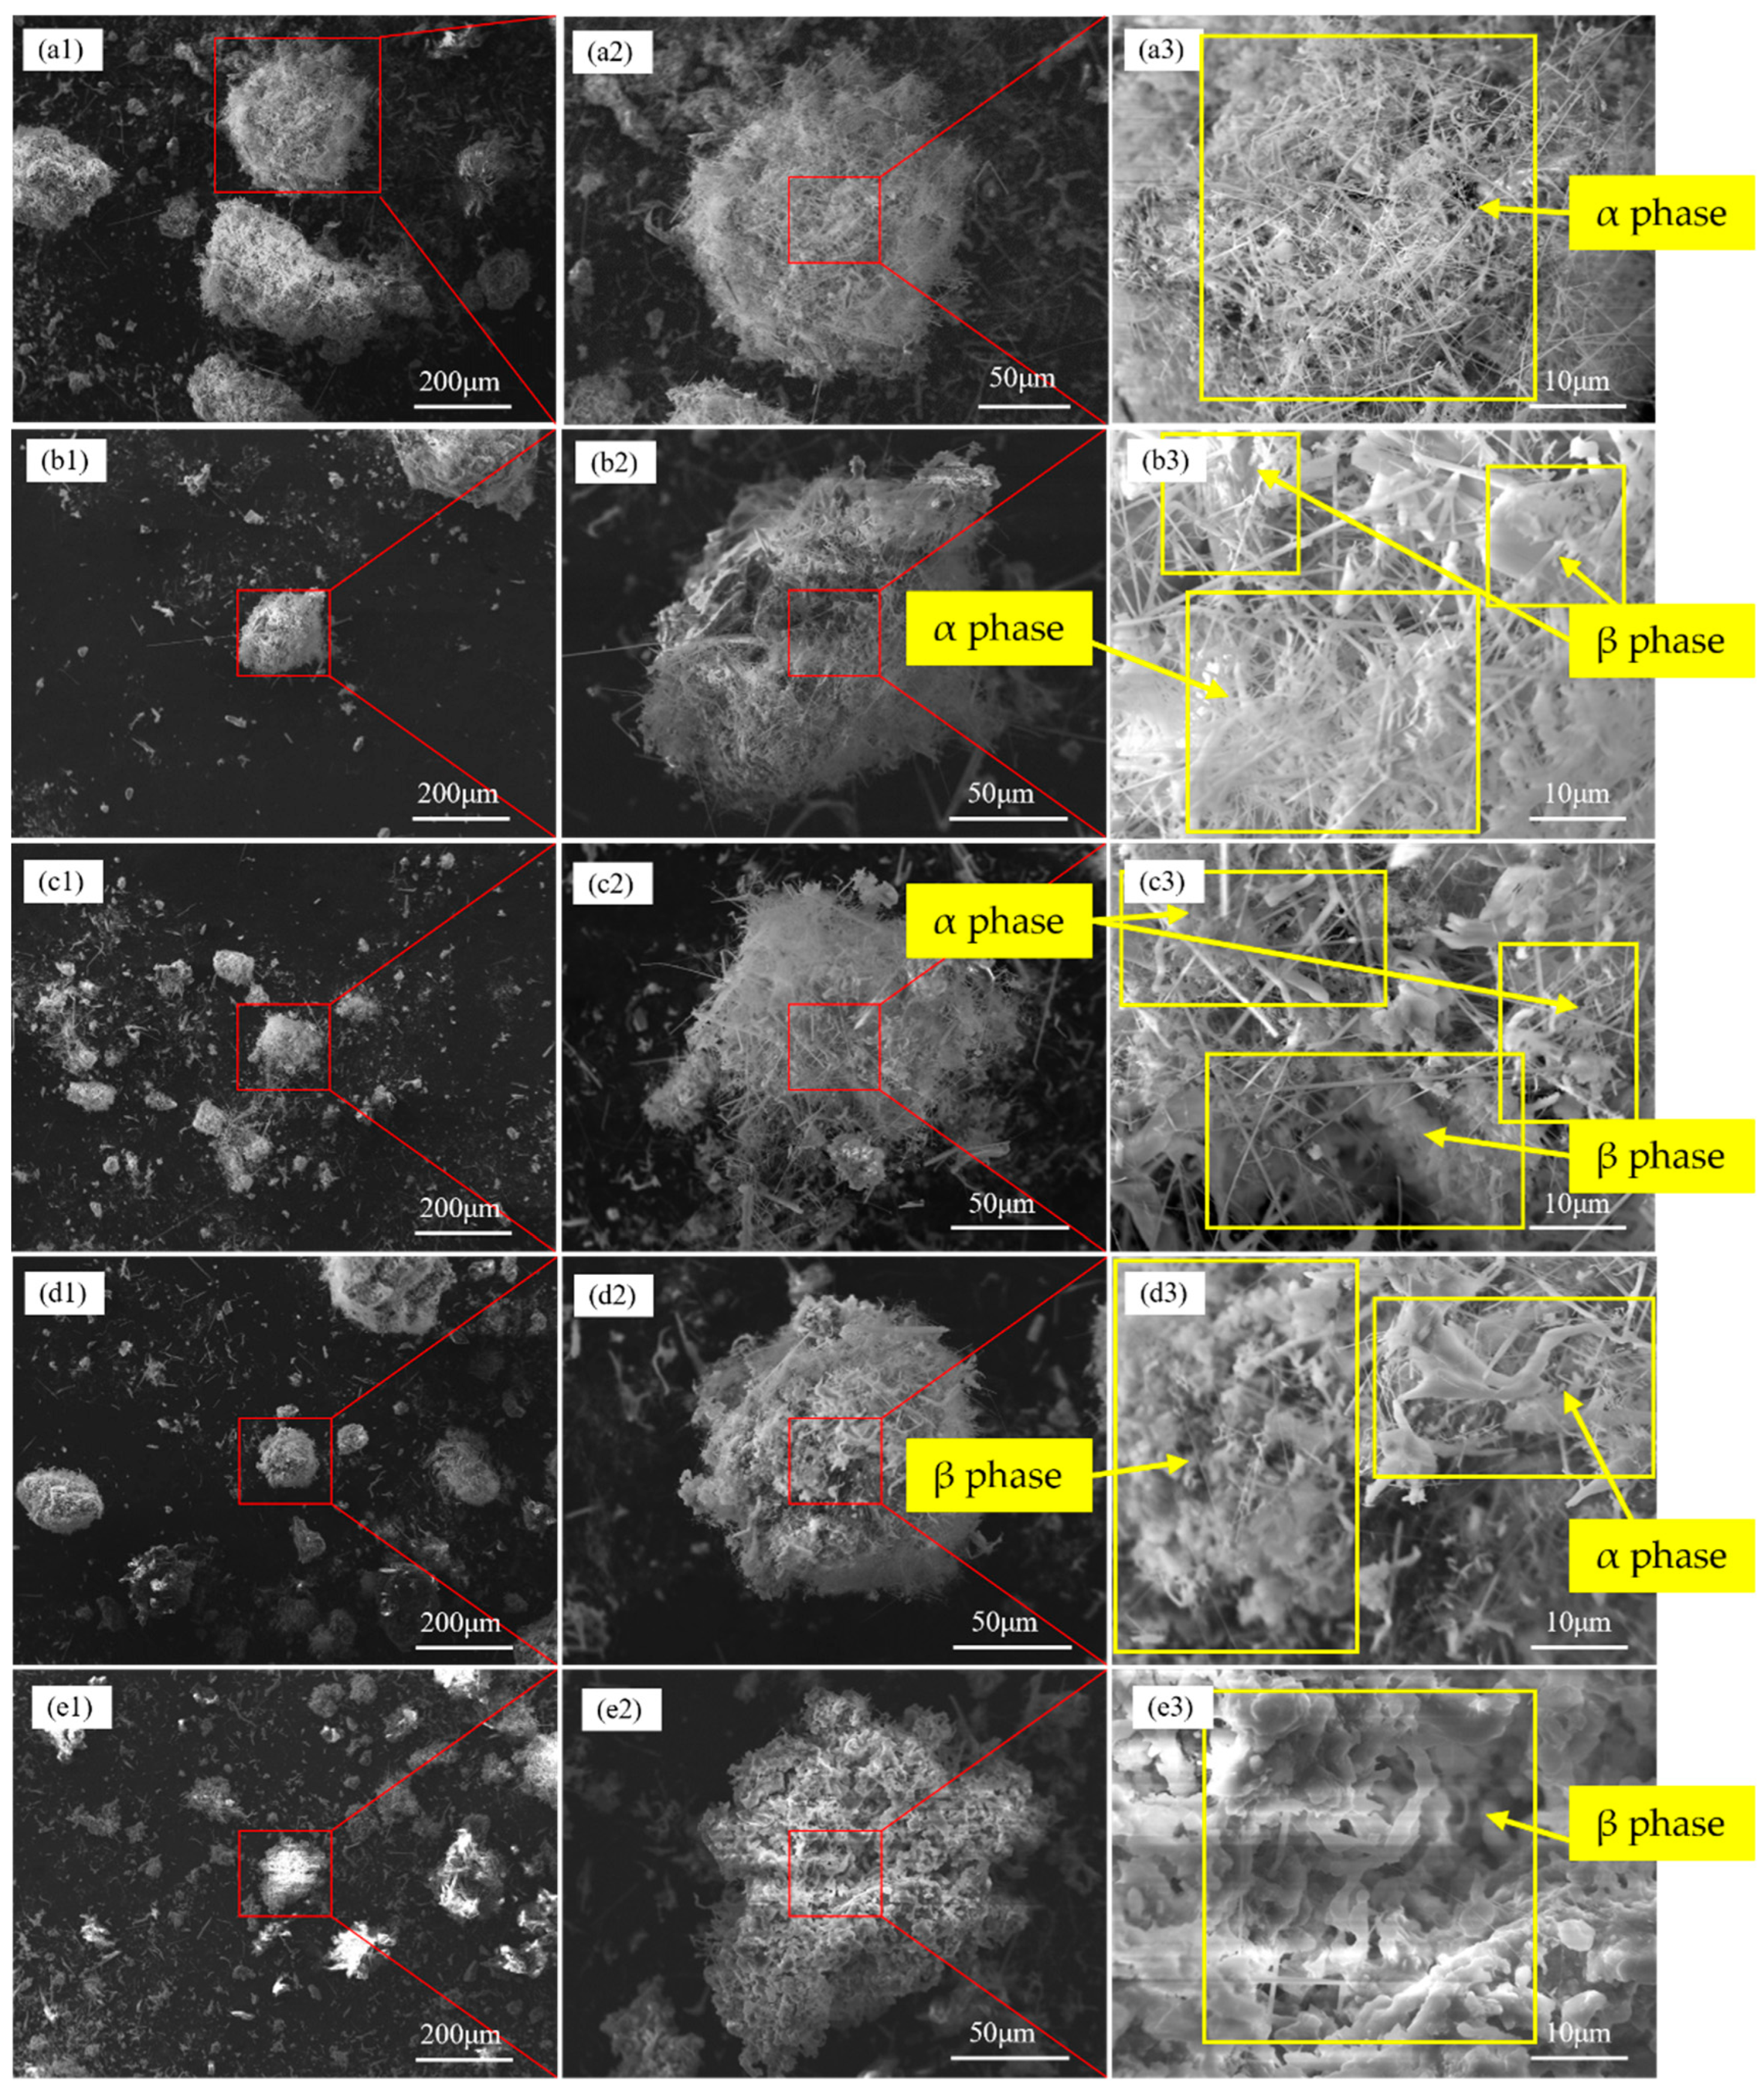
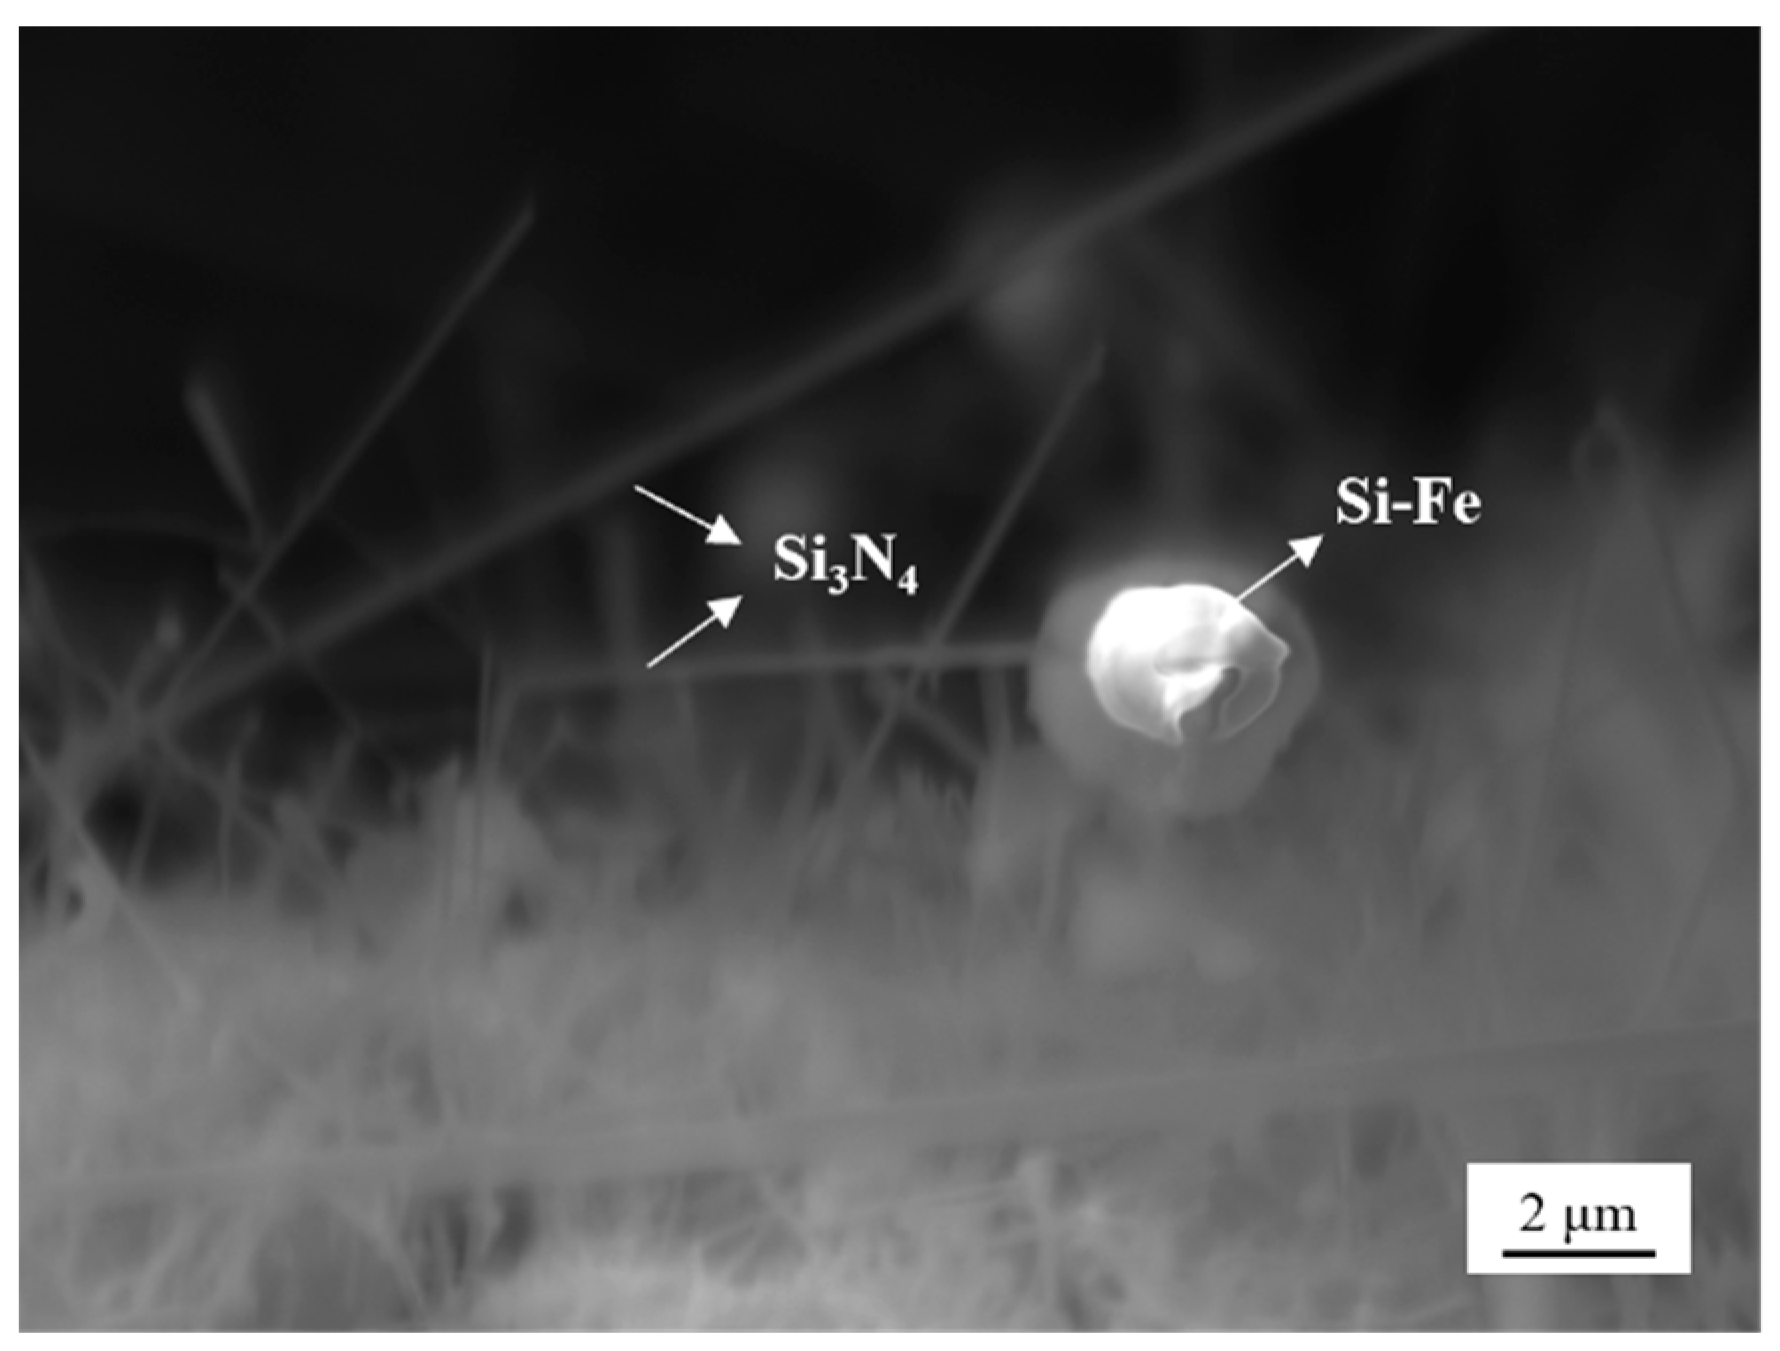
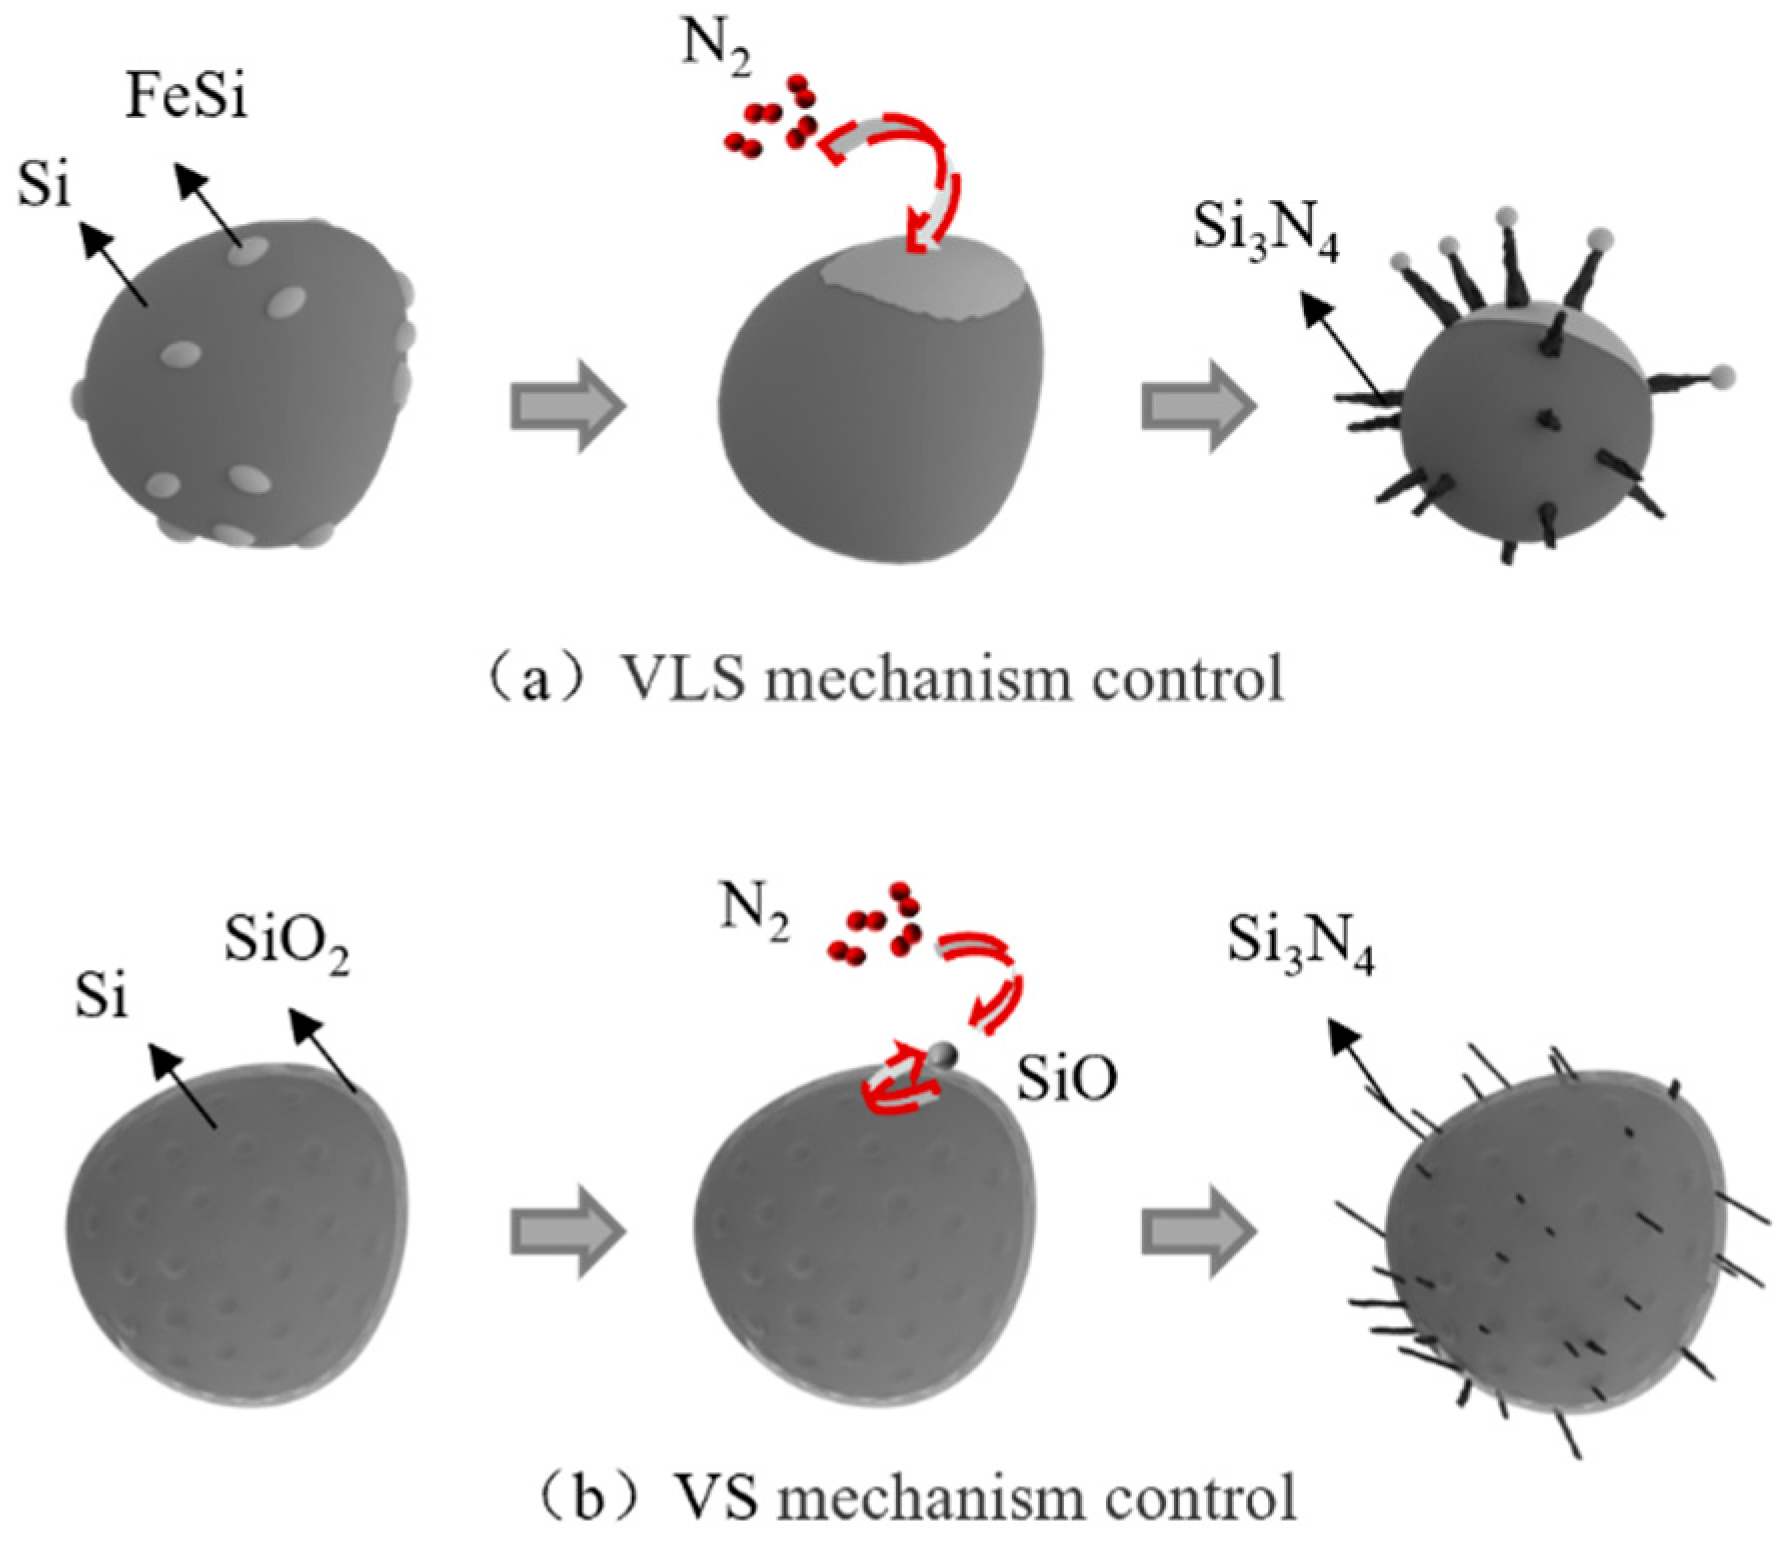
  • Silicon dust nitridation product is divided into spherical particles and massive particles, respectively, from the raw material of Si, Fe-aggregated particles and Si, SiO2-aggregated particles through the evolution of nitridation. Furthermore, the presence of Fe in the silicon dust as well as oxide layer on its surface can help to increase the rate of the reaction. Si particles growth primarily occurs during the vapor–liquid–solid (VLS) and the vapor–solid (VS) co-control process.

Author Contributions

Conceptualization, Z.X. and S.S.; methodology, Q.H., Z.X., S.S., R.C. and Y.C.; software, S.S.; formal analysis, Q.H.; investigation, Q.H., Z.X., S.S. and Y.C.; resources, Z.X. and S.S.; data curation, Q.H. and Y.C.; writing—original draft preparation, Q.H.; writing—review and editing, Z.X., S.S. and R.C.; visualization, Q.H. and Y.C.; supervision, Z.X. and S.S.; project administration, Z.X.; funding acquisition, Z.X. All authors have read and agreed to the published version of the manuscript.

Funding

This research received no external funding.

Data Availability Statement

Data are contained within the article.

Conflicts of Interest

The authors declare no conflict of interest.

References

  1. Zhang, Y.; Li, J.; Liu, H.; Ji, Y.; Zhong, Z.; Su, F. Recent advances in Rochow-Müller process research: Driving to molecular catalysis and to a more sustainable silicone industry. ChemCatChem 2019, 11, 2757–2769. [Google Scholar] [CrossRef]
  2. Hamawand, I.B.; Hanna, F.Z. Production of organosilane by the direct reaction of silicon with methyl chloride. Eng. Technol. J. 2007, 25, 1128–1138. [Google Scholar] [CrossRef]
  3. Jing, L.; Zhang, Z.L.; Ji, Y.J. One-dimensional Cu-based catalysts with layered Cu–Cu2O–CuO walls for the Rochow reaction. Nano Res. 2016, 9, 1377–1399. [Google Scholar]
  4. Lu, J.P.; Yang, L.; Tan, S.M.; He, W.; Lu, X. A Kind of Silicon Dregs Resource Treatment Method. CN 113666376 A 19 November 2021. [Google Scholar]
  5. Fu, X.H.; Wang, F.H.; Zhou, Z.S. Synthesis of Tetrachlorosilane from Spent Silicon Contact Mass. Silicone Mater. 2011, 25, 397–403. [Google Scholar]
  6. Feng, L.; Shen, Y.B.; Gao, L. Comprehensive utilization of the spent silicon contact mass. New Chem. Mater. 2014, 42, 226–228. [Google Scholar]
  7. He, Q.; Yu, J.; Wang, Y. Silicon nanoparticles prepared from industrial wastes as high-performing anode materials for lithium-ion batteries. Solid State Ion. 2018, 325, 141. [Google Scholar] [CrossRef]
  8. Lu, X.; Gu, F.; Liu, Q. Ni–MnOx catalysts supported on Al2O3-modified Si waste with outstanding CO methanation catalytic performance. Ind. Eng. Chem. Res. 2015, 54, 12516–12524. [Google Scholar] [CrossRef]
  9. Wang, H.X.; Li, Z.B. Experimental study on the use of Si3N4 for the production of HRB400 grade III steel bars. Iron Stell 2007, 1, 14. [Google Scholar]
  10. Yang, C.L.; Tang, G.B.; Liu, X. Experimental study and trial production of low cost hot rolled rebar by adding Si3N4. Mater. Heat Treat. 2011, 40, 5. [Google Scholar]
  11. Buscarino, G.; Vaccaro, G.; Agnello, S. Variability of the Si-O-Si angle in amorphous-SiO2 probed by electron paramagnetic resonance and Raman spectroscopy. J. Non-Cryst. Solids 2009, 355, 18–21. [Google Scholar] [CrossRef]
  12. Avdyukova, N.V.; Korobeinicheva, I.K.; Shmidt, É.N. Use of the Raman spectra for determining tri-and tetrasubstituted C=C bonds in terpene compounds. Chem. Nat. Compd. 1974, 10, 694–695. [Google Scholar] [CrossRef]
  13. Ichiro, S.; Hirofumi, O.; Keijiro, T.; Akihiro, Y.; Etsuo, N.; Charmian, J. Raman scattering study of the interaction of 3-aminopropyltriethoxy silane on silica gel. Time-dependent conformational change of aminopropylsilyl segments. Vib. Spectrosc. 1997, 14, 125–132. [Google Scholar]
  14. Flörke, O.W.; Köhler, H.B.; Langer, K.; Tönges, I. Water inmicrocrystalline quartz of volcanic origin: Agates. Contrib. Mineral. Petrol. 1982, 80, 324–333. [Google Scholar] [CrossRef]
  15. Zhang, P.; Zhang, D.; Dong, J. Direct synthesis of methylchlorosilanes: Catalysts, mechanisms, reaction conditions, and reactor designs. Org. Process Res. Dev. 2022, 26, 2270. [Google Scholar] [CrossRef]
  16. Chang, F.W.; Liou, T.H.; Tsai, F.M. The nitridation kinetics of silicon powder compacts. Thermochimica Acta. 2000, 35, 71–80. [Google Scholar] [CrossRef]
  17. Hou, Y.; Zhang, G.H.; Chou, K.C. Preparation of α-Si3N4 by direct nitridation using polysilicon waste by diamond wire cutting. Int. J. Appl. Ceram. Technol. 2020, 17, 84–93. [Google Scholar] [CrossRef]
  18. Yu, C.H.; Chiu, K.A.; Do, T.H. Formation of Aligned α-Si3N4 Microfibers by Plasma Nitridation of Si (110) Substrate Coated with SiO2. Coatings 2021, 11, 1251. [Google Scholar] [CrossRef]
  19. Wang, L.; Li, H.; Yang, Z. Preparation and Reaction Mechanism of Combustion Synthesis of α-Si3N4 Powder from Si Cutting Waste. Silicon 2023, 15, 3159–3163. [Google Scholar] [CrossRef]
  20. Li, Y.W.; Zhang, X.; Tian, H.B. Preparation of silicon nitride powder by direct nitridation process. Bull. Chin. Ceram. Soc. 2003, 22, 30–34. [Google Scholar]
  21. Yang, J.; Wu, P.; Wang, L. Study on rapid nitridation process of molten silicon by thermogravimetry and in situ Raman spectroscopy. J. Am. Ceram. Soc. 2022, 105, 5627. [Google Scholar] [CrossRef]
  22. Yao, G.S.; Li, Y.; Jiang, P. Formation mechanisms of Si3N4 and Si2N2O in silicon powdernitridation. Solid State Sci. 2017, 66, 50–56. [Google Scholar] [CrossRef]
  23. Jennings, H.M. Review on reactions between silicon and nitrogen-Part 1 Mechanisms. J. Mater. Sci. 1983, 18, 951–967. [Google Scholar] [CrossRef]
  24. Jennings, H.M.; Dalgleish, B.J.; Pratt, P.L. Reactions between silicon and nitrogen. J. Mater. Sci. 1988, 23, 2573–2583. [Google Scholar] [CrossRef]
  25. Jennings, H.M.; Richman, M.H. Structure, formation, mechanism and kinetics of reaction-bonded silicon nitride. J. Mater. Sci. 1976, 11, 2087–2098. [Google Scholar] [CrossRef]
  26. Han, L.; Wang, J.; Li, F. Low-temperature preparation of Si3N4 whiskers bonded/reinforced SiC porous ceramics via foam-gelcasting combined with catalytic nitridation. J. Eur. Ceram. Soc. 2018, 38, 1210. [Google Scholar] [CrossRef]
  27. Jin, X.; Ran, S.; Fang, Z. Recycling the diamond-wire saw silicon powder for preparing the regulable Si3N4 materials by non-catalytic nitridation. J. Clean. Prod. 2022, 371, 133656. [Google Scholar] [CrossRef]
  28. Jin, X.; Zhuang, Y.; Xing, P. Preparation of reactive sintering Si3N4-Si2N2O composites ceramics with diamond-wire saw powder waste as raw material. J. Hazard. Mater. 2020, 400, 123145. [Google Scholar] [CrossRef] [PubMed]
  29. Chen, Y.J.; Wang, Y.Y.; Peng, N. Isothermal reduction kinetics of zinc calcine under carbon monoxide. Trans. Nonferrous Met. Soc. China 2020, 30, 2274–2282. [Google Scholar] [CrossRef]
  30. Li, M.C.; Wang, L.; Yang, F. Reaction behavior of reduction of WO3 to WO2.72 under CO-CO2 mixed gases. Chin. J. Nonferrous Met. 2022, 32, 866–882. [Google Scholar]
  31. Jin, X.X.; Peng, F.Z.; Yan, X.K.; Jian, J.; Sheng, N.W.; Dong, H. Effect of Si3N4 diluent on direct nitridation of silicon powder. Ceram. Int. 2019, 45, 10943–10950. [Google Scholar] [CrossRef]
  32. Tian, Z.; Chen, K.; Sun, S. Synthesis of Si3N4 nanowires by catalyst-free nitridation of (Si + SiO2) mixture. Micro Nano Lett. 2019, 14, 919–921. [Google Scholar] [CrossRef]
  33. Liu, Z.; Chai, Z.; Yu, C. Liquid-Phase-Assisted Catalytic Nitridation of Silicon and In Situ Growth of α-Si3N4. Materials 2022, 15, 6074. [Google Scholar] [CrossRef] [PubMed]
  34. Zhang, J.; Li, F.; Dong, L. In situ combustion synthesis of spherical Si@Si3N4 granules. J. Am. Ceram. Soc. 2022, 105, 6529. [Google Scholar] [CrossRef]
  35. Lan, Y.; Huang, Y.; Li, X. Non-catalytic vapor synthesis of α-Si3N4 nano whiskers via direct nitridation of silicon powders. Ceram. Int. 2021, 47, 17789. [Google Scholar] [CrossRef]
  36. Wang, L.; He, G.; Yang, Z. Combustion synthesis of α-Si3N4 powders using in-situ nano-SiO2 coated Si and Si3N4 reactants—Science Direct. Ceram. Int. 2021, 47, 4854. [Google Scholar] [CrossRef]
Figure 1. Characterization of silicon dust (a) X-ray diffraction spectrum; (b) Raman spectral analysis; (c) Particle size distribution.
Processes 12 00301 g001
Figure 2. Microstructure of silicon dust particles. (a) Overall morphology; (b) silicon particles containing ferrosilicon on the surface; (c) silicon particles with surface pits.
Processes 12 00301 g002
Figure 3. XRD pattern of nitride products at reaction temperature of 1200–1650 °C for 20 min.
Processes 12 00301 g003
Figure 4. Typical micromorphologies of incomplete nitriding silicon dust. (a) Spherical particles; (b) massive particles; (cf) EDS of incomplete silicon nitride dusts.
Processes 12 00301 g004
Figure 5. TG curve at 1300~1500 °C for 3 h.
Processes 12 00301 g005
Figure 6. XRD patterns for samples after 3 h at temperature.
Processes 12 00301 g006
Figure 7. Micromorphologies of nitriding products of silicon dust at different temperatures for 3 h (a1a3) 1300 °C; (b1b3) 1350 °C; (c1c3) 1400 °C; (d1d3) 1450 °C; (e1e3) 1500 °C.
Processes 12 00301 g007
Figure 8. Phase equilibrium diagram of Si-N-O system at different temperatures (a) 1300 °C; (b) 1500 °C.
Processes 12 00301 g008
Figure 9. Dynamic fitting curve of experimental data obtained in the first stage. (a) Plot of reaction extent vs. reaction time; (b) Arrhenius plot for reaction process.
Processes 12 00301 g009
Figure 10. Fe-Si-N2 phase diagram.
Processes 12 00301 g010
Figure 11. SEM of Si3N4 whisker morphology.
Processes 12 00301 g011
Figure 12. Mechanism diagram of silicon dust nitriding.
Processes 12 00301 g012
Table 1. Chemical composition of silicon dust (mass fraction%).
SiFeCuAlTiZrVMnOClCCaPSN
68.569.523.391.251.050.1310.1270.1147.904.292.600.6360.1440.0540.039
Table 2. Common mechanism functions of gas–solid reaction [29].
ModelCodeG(α)Reaction Mechanism
Chemical reactionF1−ln(1 − α)1-order reaction
F2(1 − α) − 12-order reaction
F3(1 − α) − 23-order reaction
Diffusion reactionD1α2One-dimensional,
Parabolic equation
D2(1 − α)ln(1 − α) + αTwo-dimensional,
Valensi equation
D3[1 − (1 − α)1/3]2Three-dimensional,
Jander equation
D41 − 2α/3 − (1 − α)2/3Three-dimensional,
Ginstring-Brounshtein
Interfacial reactionR1αOne-dimensional
R21 − (1 − α)1/2Two-dimensional,
contraction cylinder
R31 − (1 − α)1/3Three-dimensional,
contraction sphere
Nucleation and growthA2[−ln(1 − α)]1/2Aevrami-Erofeev equation I
A3[−ln(1 − α)]1/3Aevrami-Erofeev equation II
Table 3. Fitting temperature and time interval in the process of silicon dust nitriding.
CorridorTemperature (°C)Time (min)
Phase I13000–180
13500–30
14000–30
Phase II135030–180
140030–180
14500–180
15000–180
Table 4. Correlation coefficients of linear fitting of kinetic mechanism functions.
ModelR1300R1350
(0–30)
R1400
(0–30)
RAVG1R1350
(30–180)
R1400
(30–180)
R1450R1500RAVG2
F10.9980 0.9935 0.9985 0.9967 0.9996 0.9974 0.9796 0.9753 0.9880
F20.9885 0.9910 0.9977 0.9924 0.9889 0.9997 0.9953 0.9866 0.9926
F30.9715 0.9880 0.9962 0.9852 0.9652 0.9966 0.9995 0.9941 0.9888
D10.9731 0.9458 0.9715 0.9635 0.9985 0.9991 0.9922 0.9947 0.9961
D20.9652 0.9432 0.9693 0.9592 0.9949 0.9995 0.9957 0.9961 0.9962
D30.9556 0.9404 0.9670 0.9544 0.9879 0.9987 0.9977 0.9971 0.9954
D40.9621 0.9422 0.9686 0.9576 0.9929 0.9993 0.9966 0.9965 0.9963
R10.9995 0.9955 0.9988 0.9979 0.9952 0.9892 0.9517 0.9604 0.9741
R20.9997 0.9946 0.9987 0.9977 0.9993 0.9940 0.9671 0.9683 0.9822
R30.9994 0.9942 0.9987 0.9974 0.9998 0.9953 0.9716 0.9707 0.9844
A20.9868 0.9963 0.9896 0.9909 0.9967 0.9888 0.9299 0.9274 0.9607
A30.9675 0.9871 0.9782 0.9776 0.9930 0.9844 0.8991 0.9003 0.9442
Disclaimer/Publisher’s Note: The statements, opinions and data contained in all publications are solely those of the individual author(s) and contributor(s) and not of MDPI and/or the editor(s). MDPI and/or the editor(s) disclaim responsibility for any injury to people or property resulting from any ideas, methods, instructions or products referred to in the content.

