Abstract
A fault is a common geological structure encountered in underground coal mining. Interactions between the discontinuous structure of a fault and mining activities are the key factors in controlling the rock bursts induced by the fault. It is of great importance to study the rock burst mechanism of an extra-thick coal seam under the combined influence of reverse faults and coal mining for the prediction and prevention of rock burst. In this study, we establish a sliding dynamics model of rock mass in a fault zone and analyze the mechanical distribution of fault-induced rock bursts under the combined action of mining disturbances. Additionally, we utilize theoretical calculation and a 3D numerical simulation method to clarify the rockburst mechanism in an extra-thick coal seam controlled by a thrust fault under mining disturbance and a fault. The results showed that the distribution range of the shear stress increment in the fault footwall was larger than that in the hanging wall, revealing a skewed distribution. The fault dip angle and mining thickness exhibit significant influence on the structure around the fault. With increases in the dip angle of the fault and mining thickness, the maximum vertical stress and peak stress first increase and then decrease. A position 80 m away from the fault is the dividing line between the fault-non-affected area and the fault-affected area. The 13,200 working face of the Gengcun coal mine is used as a case study to study the influence of mining disturbances on microseismic events. The results of this study are in good agreement with the theoretical calculations and numerical simulation results.
1. Introduction
Coal geological conditions and mining disturbances have an important influence on the stress distribution of a longwall face [1,2]. With the increase in coal mining depth, the geological conditions gradually deteriorate. A rock burst is a serious disaster and a dynamic instability phenomenon that can occur during the process of coal mining [3,4,5]. Mining in ultra-deep coal mines leads to frequent rock burst accidents, which restricts the safety and highly effective production of coal mines. A rock burst is influenced by many factors, such as fault geological structure, coal mining disturbance, and mining depth [6,7,8].
When coal is close to a fault structure, coal stress increases, and a rock burst is easily induced [9,10,11]. In Central and Western China, coal mining is characterized by thick roofs, large mining depths, high ground stresses, and complex structural conditions which may lead to rock burst disasters. For example, an “11·3” rock burst accident occurred in the Qianqiu coal mine in 2011. This was caused by working face mining near an F16 large-scale reverse fault. In 2012, a “4·12” accident occurred in the Chaoyang coal mine at the intersection of a 3110 isolated island working face with two faults (F3110-1 and F3109-1). In 2013, a “3·15” rock burst accident occurred in the Junde coal mine. This was caused by F1 and L1 faults. An “8·2” rock burst accident was caused by an F5010 fault and a syncline structure in the Tangshan Mine in 2019. In 2020, a “5·24” rock burst accident occurred in Mengcun Lane, which was affected by a DF29 fault and a fold. The above accidents have resulted in casualties and huge property losses.
A large number of scholars have researched the influence of geological structures on the stress distribution of surrounding rocks and rock burst occurrences. He et al. [12] pointed out that a roadway rock burst is closely linked to fault tectonic stress concentration and fault activation. Wang et al. [13] inverted the influence of fault structures on the appearance of roadway rock bursts using seismic tomography technology, putting forward a prediction method for rock burst disasters. Li and Yang et al. [14,15] emphasized that faults, lateral roof structures, and periodic roof failures have important influences on the emergence of rock burst disasters. Digital imaging technology has been used to study the evolution of fault structures during coal mining [16]. Physical similarity model tests have been carried out to study the effect of fault angles on surrounding rock stress [17]. Sainoki and Mitri [18] comprehensively considered factors such as fault dip and fall, revealing the sliding instability mechanism of fault structures under the influence of mining.
Fracture mechanics theory has also been used to study fracture damage development and fault slip mechanisms. Mechanical models of fault fracture damage and rock mass slip have been established, and the main factors affecting fault activation have been extensively analyzed [19,20]. Lv et al. [21] developed a simplified mechanical model dominated by horizontal tectonic stress. They emphasized that fault activation has an important influence on the stress analysis of stopes, revealing the rock burst mechanism in a roadway under the superimposed action of ground stress and mining. Wu et al. [22] developed a mechanical model of overburden movement in graben tectonic regions. A criterion formula for calculating the starting energy of a rock burst was given, and anti-scour technology for “breaking chain and increasing consumption” was proposed. Kong and Ji et al. [23,24] have researched the influence of different mining layouts on fault reactivation. They highlighted that mining disturbance has a significant effect on induced fault activation, noting, in particular, that mining activity perpendicular to the fault strike has a larger disturbance effect. By analyzing numerous accidents, Zhao et al. [25,26] have pointed out that rock burst accidents are influenced by many factors, highlighting that the combined action of multiple structures has a greater impact on the appearance of rock bursts. Cao et al. [27] hypothesized that the width of a coal pillar has an important influence on fault activation instability and energy variation within faults. Jiao et al. [28] suggested that there was a positive correlation between the risk of rock bursts in the surrounding rock near the fault and the mining depth. Tong and Zhao et al. [29,30] proposed criteria for evaluating structural activity using activation coefficients and damage factors, with the heterogeneity and non-uniform deformation of the rock considered in the criteria. Sainoki and Orlecka et al. [31,32,33] simulated the influence of joint roughness on fault activation and highlighted the effect of mining disturbances on the maximum shear displacement and energy of a fault. Similar simulation tests have also been carried out to identify the influence of footwall mining on fault dislocation instability, revealing that mining disturbance can induce fault activation instability [34,35,36]. Wang et al. [37,38,39] quantitatively analyzed the migration rule of overlying rock using digital speckle, highlighting that the coupled action of working face advancements and fault presence has a significant influence on rock burst occurrence.
Moreover, many scholars have also carried out research on rock burst evaluation methods to prevent and control the occurrence of rock bursts in coal mines. Based on changes in strain energy in coal and rock masses, Kidybifski et al. proposed evaluation indices for rock bursts and determined the values of different mining pressure development indices through laboratory tests [40]. Smoliński and Malashkevych found that mining conditions have an important effect on pressure production in working faces, and quantitative-qualitative indicators of mining were proposed to improve the efficiency of mining [41,42]. Mohammadali and Wojtecki et al. used conventional and numerical methods to assess rock burst disasters [43,44]. Konicek and Filippov et al. proposed monitoring rock bursts through acoustic signals and the use of energy absorption support to prevent rock bursts [45,46]. Kopytov et al. suggested that blasting and drilling for pressure relief could prevent stress accumulation in coal and rock masses [47]. Zhou et al. compared and analyzed research achievements and limitations, as well as future research directions for different rock burst evaluation methods [48]. A rock burst risk assessment method combining tomography and microseismic monitoring was established. It has been pointed out that longitudinal wave velocity can reflect the strength, energy, and dynamic load criteria of rock bursts [49]. A rock burst monitoring system based on stress and energy monitoring was established to prevent and control rock bursts in coal mines, and a critical stress index evaluation method for rock burst risk was proposed [50].
In summary, tectonic stress and fault activation are the primary factors influencing rock bursts in roadway construction. The phenomenon of fault reactivation induced by mining activities has been verified using theoretical analysis, model tests, field observations, and numerical calculations. However, few studies have considered the mechanics of rock bursts induced by the coupling of mining disturbances and thrust faults under the geological conditions of extra-thick conglomerates. In addition, most experimental, physical, and mechanical studies of fault activation have only focused on vibration mechanisms, and the influence of mining disturbance and thrust fault structure coupling on the stress distribution of the surrounding rock has been largely ignored. Therefore, the mechanism of rock bursts under these conditions requires further study. It can provide insights for predicting and preventing rock bursts in extra-thick coal seams subjected to thrust faults and mining activities. In this study, a sliding mechanical model of a rock mass in a fault zone is constructed and solved to obtain the stress distribution of a reverse fault. The stress distribution on the surrounding rock of the working face under different geological structures and mining conditions, including the influence of faults on this stress distribution, is clarified. By combining theoretical calculations and numerical analyses, the quantitative relationship between mining disturbance, fault activity, microseismic event monitoring, and rock bursts were revealed. The influence law of tectonic stress is analyzed, and the influence zone of the F16 fault is determined. We expound on the rock burst mechanism of extra-thick coal seams influenced by thrust faults and mining disturbances. Finally, the research results are verified by comparing them with the field monitoring results.
2. Engineering Background
- (1)
- Geological structural characteristics of the Gengcun coal mine
The Gengcun coal mine is located in Mianchi County, Sanmenxia City. It is 3.2 km north of Mianchi County and 15 km northeast of Yima City. It is 53 km west of Sanmenxia City and 69 km east of Luoyang City. The Gengcun coal mine benefits from convenient transportation. The Longhai Railway, 310 National Highway, and Lianhuo Expressway pass through the northern edge of Jingtian. The Mianchi Station is connected to the Longhai Railway via a special railway line.
There is an outcrop of 2–3 coal seams to the north and an F16 fault to the south of the coal mine. Prospecting line 41 is bound via the Qianqiu and Yuejin Mines to the east. The mining area is 11.503 km2.
The 13,200 working face is adjacent to the 13,180 and 13,230 working faces. To the west and south are 2–3 unmined coal entities. The designed mining length and inclined length are 749 m and 249 m, respectively. The maximum mining depth is 630 m. The coal seam thickness is approximately 19.3 m.
- (2)
- Developmental characteristics of the F16 fault
The strata were subjected to nappe tectonic stress, which caused the Triassic strata to push upward along the deep coal seam to form the F16 fault. Moreover, part of the coal seam under the nappe surface was shoveled away. The coal seam under the nappe surface becomes thinner, while the coal thickness in the nappe zone increases significantly. The 13,200 working face area is greatly affected by F16 fault thrust. The coal seam thicknesses at both ends of the 13,200 open cutting are both 13–15 m, which is less than that in the cutting hole. The upper and lower thrust lines of the F16 fault are the boundaries of the thick coal seam. The thick seam belt runs obliquely through the 13,200 working face. The lower thrust line of the F16 fault intersects with the lower roadway at 160 m, and the upper thrust line of the F16 fault intersects with the lower roadway at 620 m.
The roof structure exhibits a close relationship with the F16 fault. As a result, the roof structure changes with the advancement of the working face. The upper wall of the F16 fault is a Triassic rock layer with an angle of 50–75°. The immediate roof on the northern side of the upper thrust line of the F16 fault is Jurassic mudstone with a thickness of 25 m. The range of influence of the Jurassic immediate roof gradually increases from the open cutting to the end. The immediate roof on the south side of the downthrust nappe line of the F16 fault is a Triassic formation, which is grayish-white sandstone with a thickness of 7 m. The area affected by the immediate roof of the Triassic system gradually decreases by 160 m in front of the stop.
3. Mechanical Analysis
3.1. Mechanical Model
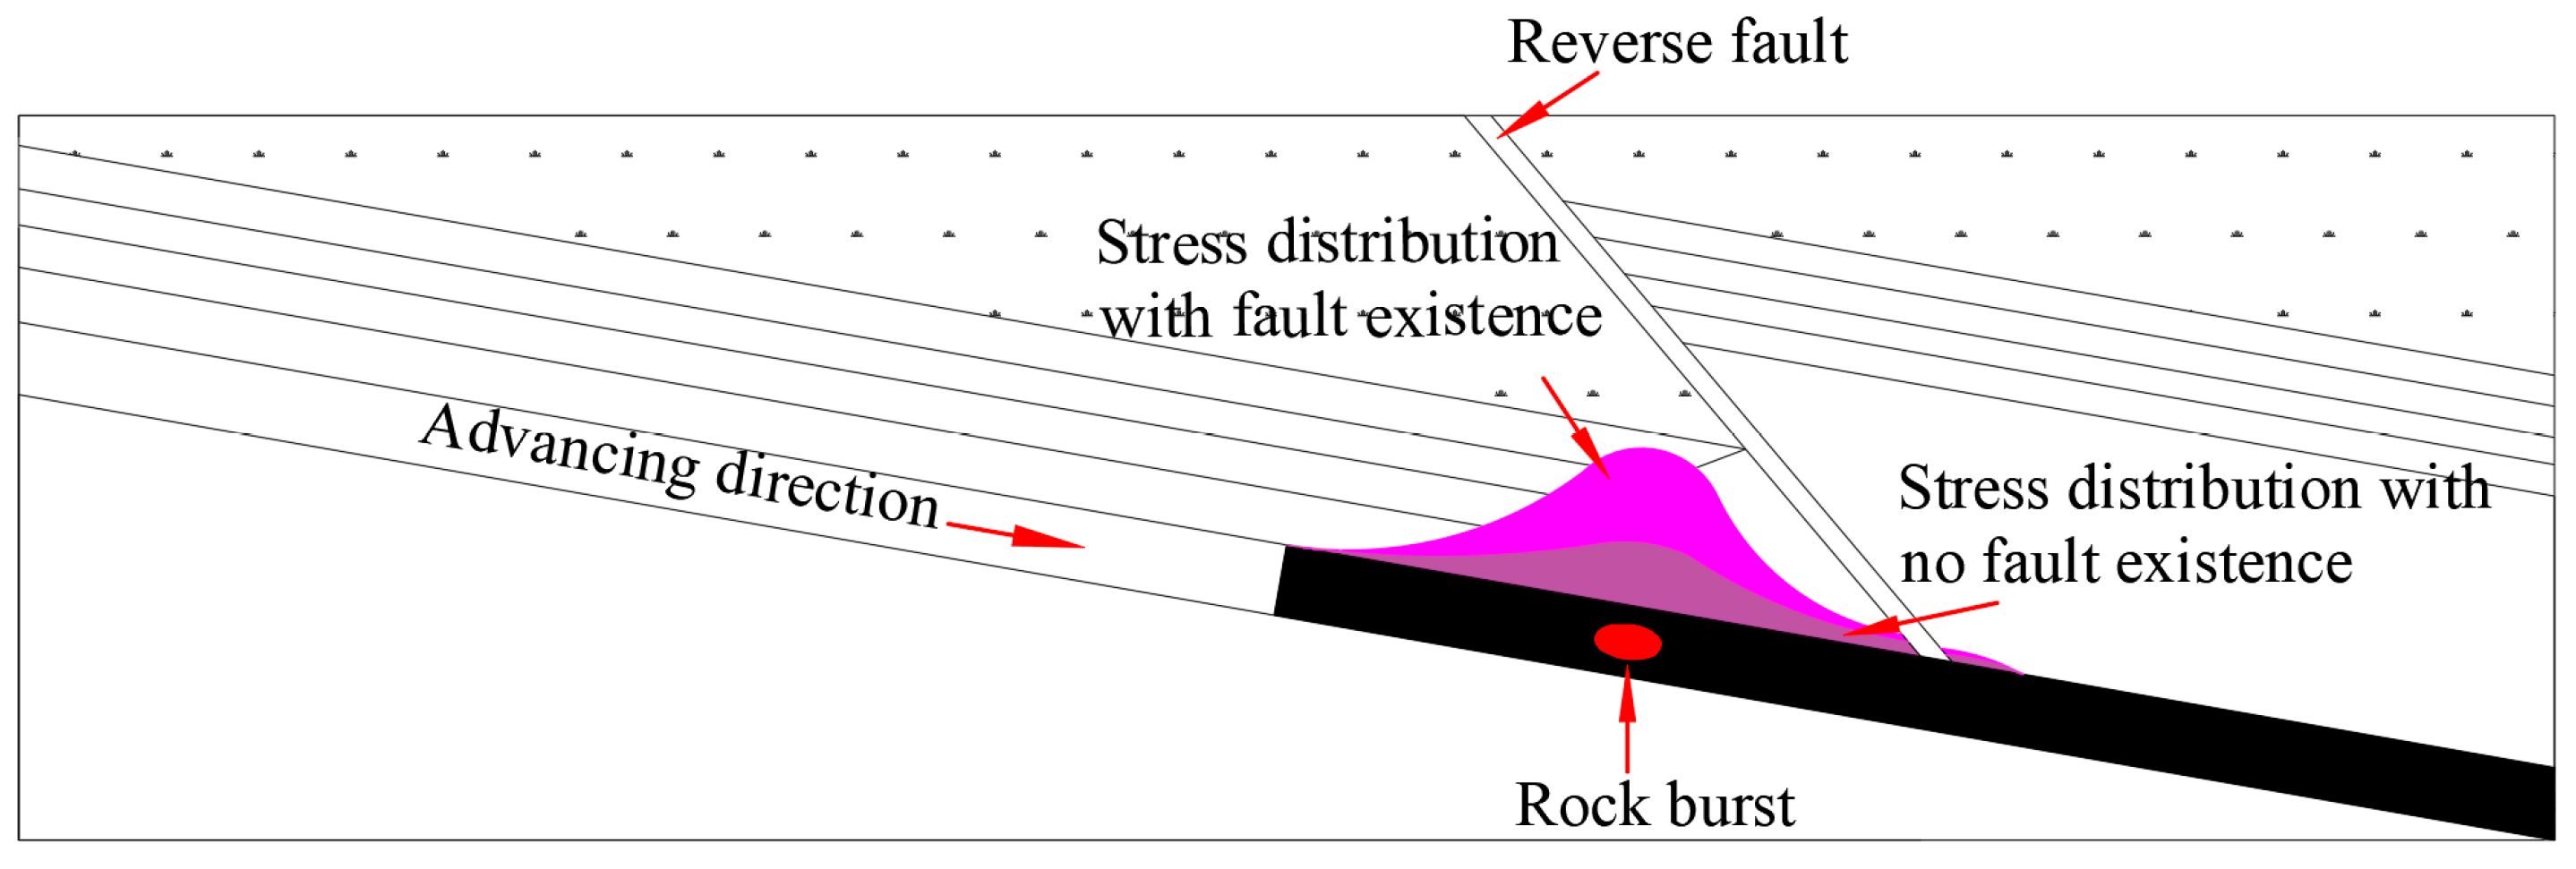
The generation of concentrated stress during mining is a significant factor contributing to rock bursts induced by reverse faults. Figure 1 shows the rock burst distribution of a working face influenced by a reverse fault.

Figure 1.
Rock burst distribution influenced by the reverse fault.
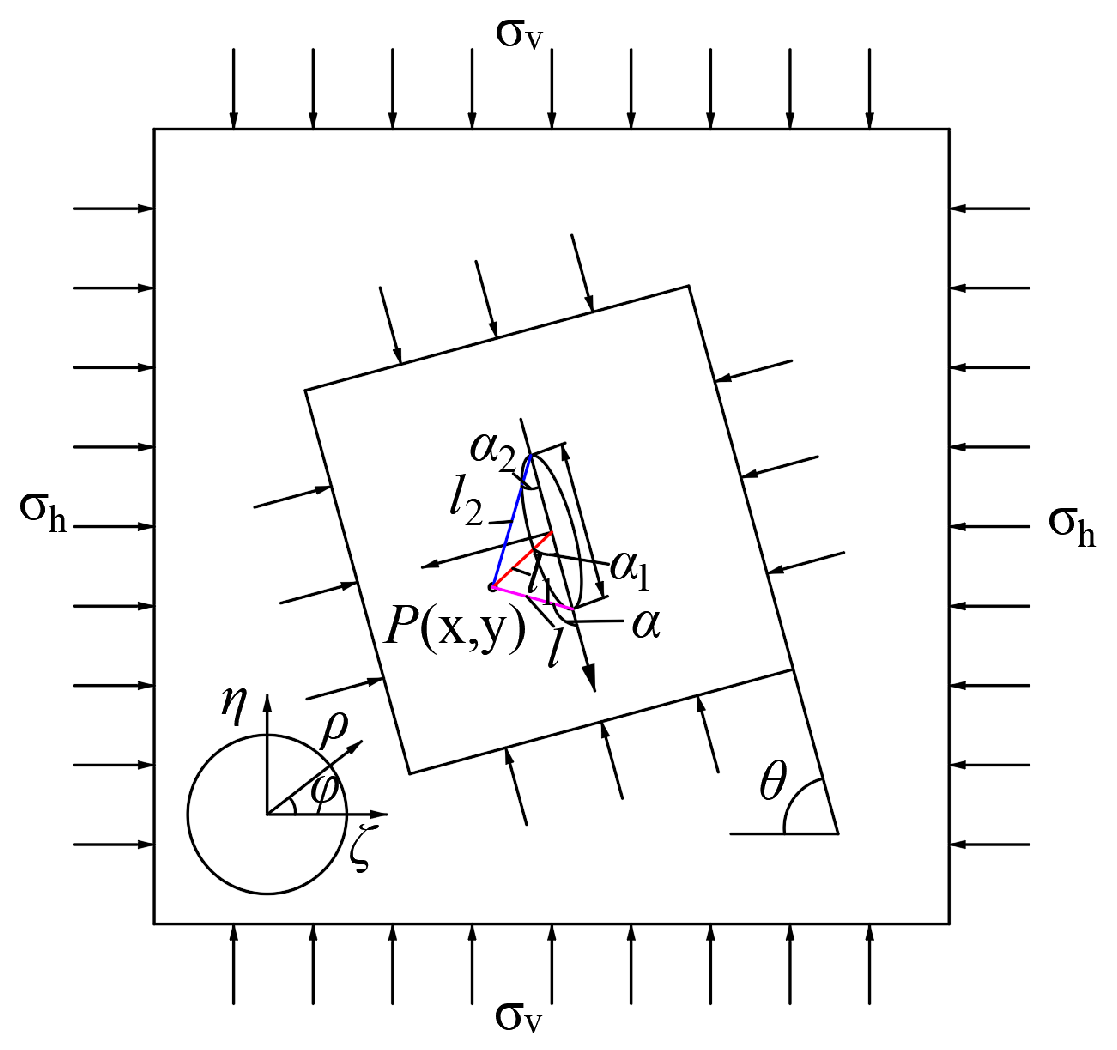
According to a study by Wang et al. [51], it is believed that the tectonic stress of a fault is influenced by the fault length, fault dip angle, mining disturbance, and ground stress. The dip profile of the F16 fault in the Gengcun Mine is regarded as an elliptical formation fracture, and a complex coordinate system z = x + iy is established by combining the fault angle (θ) and the center of the ellipse (see Figure 2). The infinite region outside the crack is transformed into a polar circle of the coordinate system () through the conformal transformation of the complex potential function [51,52]. In Figure 2, is the length of the point at the edge of the ellipse hole and the line at the center of the ellipse, m; is the angle between the line of the edge point of the ellipse hole and the center of the ellipse, and the major axis of the ellipse (°). and form the polar coordinate system.

Figure 2.
Mechanical model of structural stress increment for thrust fault.
Complex functions and polar coordinate functions can be converted as follows:
where, is the variogram function. x and y are the horizontal and vertical coordinates in the cartesian coordinate system with the major and minor axes of the ellipse, respectively. The complex variables and boundary conditions of the stress component are as follows:
where, σx is the tectonic stress in the x direction, Pa; σy is the tectonic stress in the y direction; τxy is the shear stress, Pa; and are reset potential functions; is the complex number of boundary surface forces.
By combining Equations (1)–(4), we can obtain:
where, is the hoop stress in the polar coordinates, Pa; is radial stress in the polar coordinates, Pa; is shear stress in the polar coordinates, Pa; Re(z) is the real part of the complex number z.
Moreover, Equation (8) can be represented as follows:
By using derivation, we can obtain the following:
Furthermore, Equation (8) can be obtained using coordinate transformation:
By using derivation, we can obtain the following:
The complex functions are:
Based on the distribution of the ground stress field and boundary conditions (see Figure 2), we can obtain the following:
Assuming that α, α1, α2, and l, l1, l2 are the angles and distances between A and the left, middle, and right ends of the fault, the increment of structural stress at point A can be obtained by using Equations (19) and (20).
As mentioned above, , are the initial ground stresses, respectively, which can be obtained by ignoring the fault inclination θ,
Here, σh is the horizontal stress of rock mass in the fault zone, Pa. σv is the vertical stress of rock mass in the fault zone, Pa.
The field measurement results showed the horizontal principal stress of the Gengcun coal mine was perpendicular to the fault structure. The horizontal stress (σh) and vertical stress (σv) are 15.8 MPa and 14.60 MPa, respectively. The geometric parameters of the F16 fault were substituted into Equations (15)–(20), and then the conversion formula of stress and the stress increment cloud map were combined. Figure 3 shows the vertical tectonic stress increment distribution of the fault.
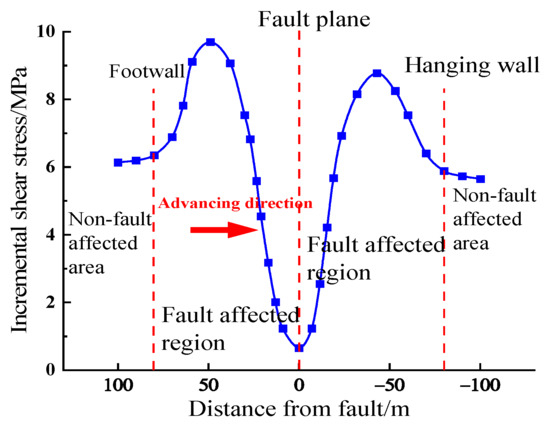
Figure 3.
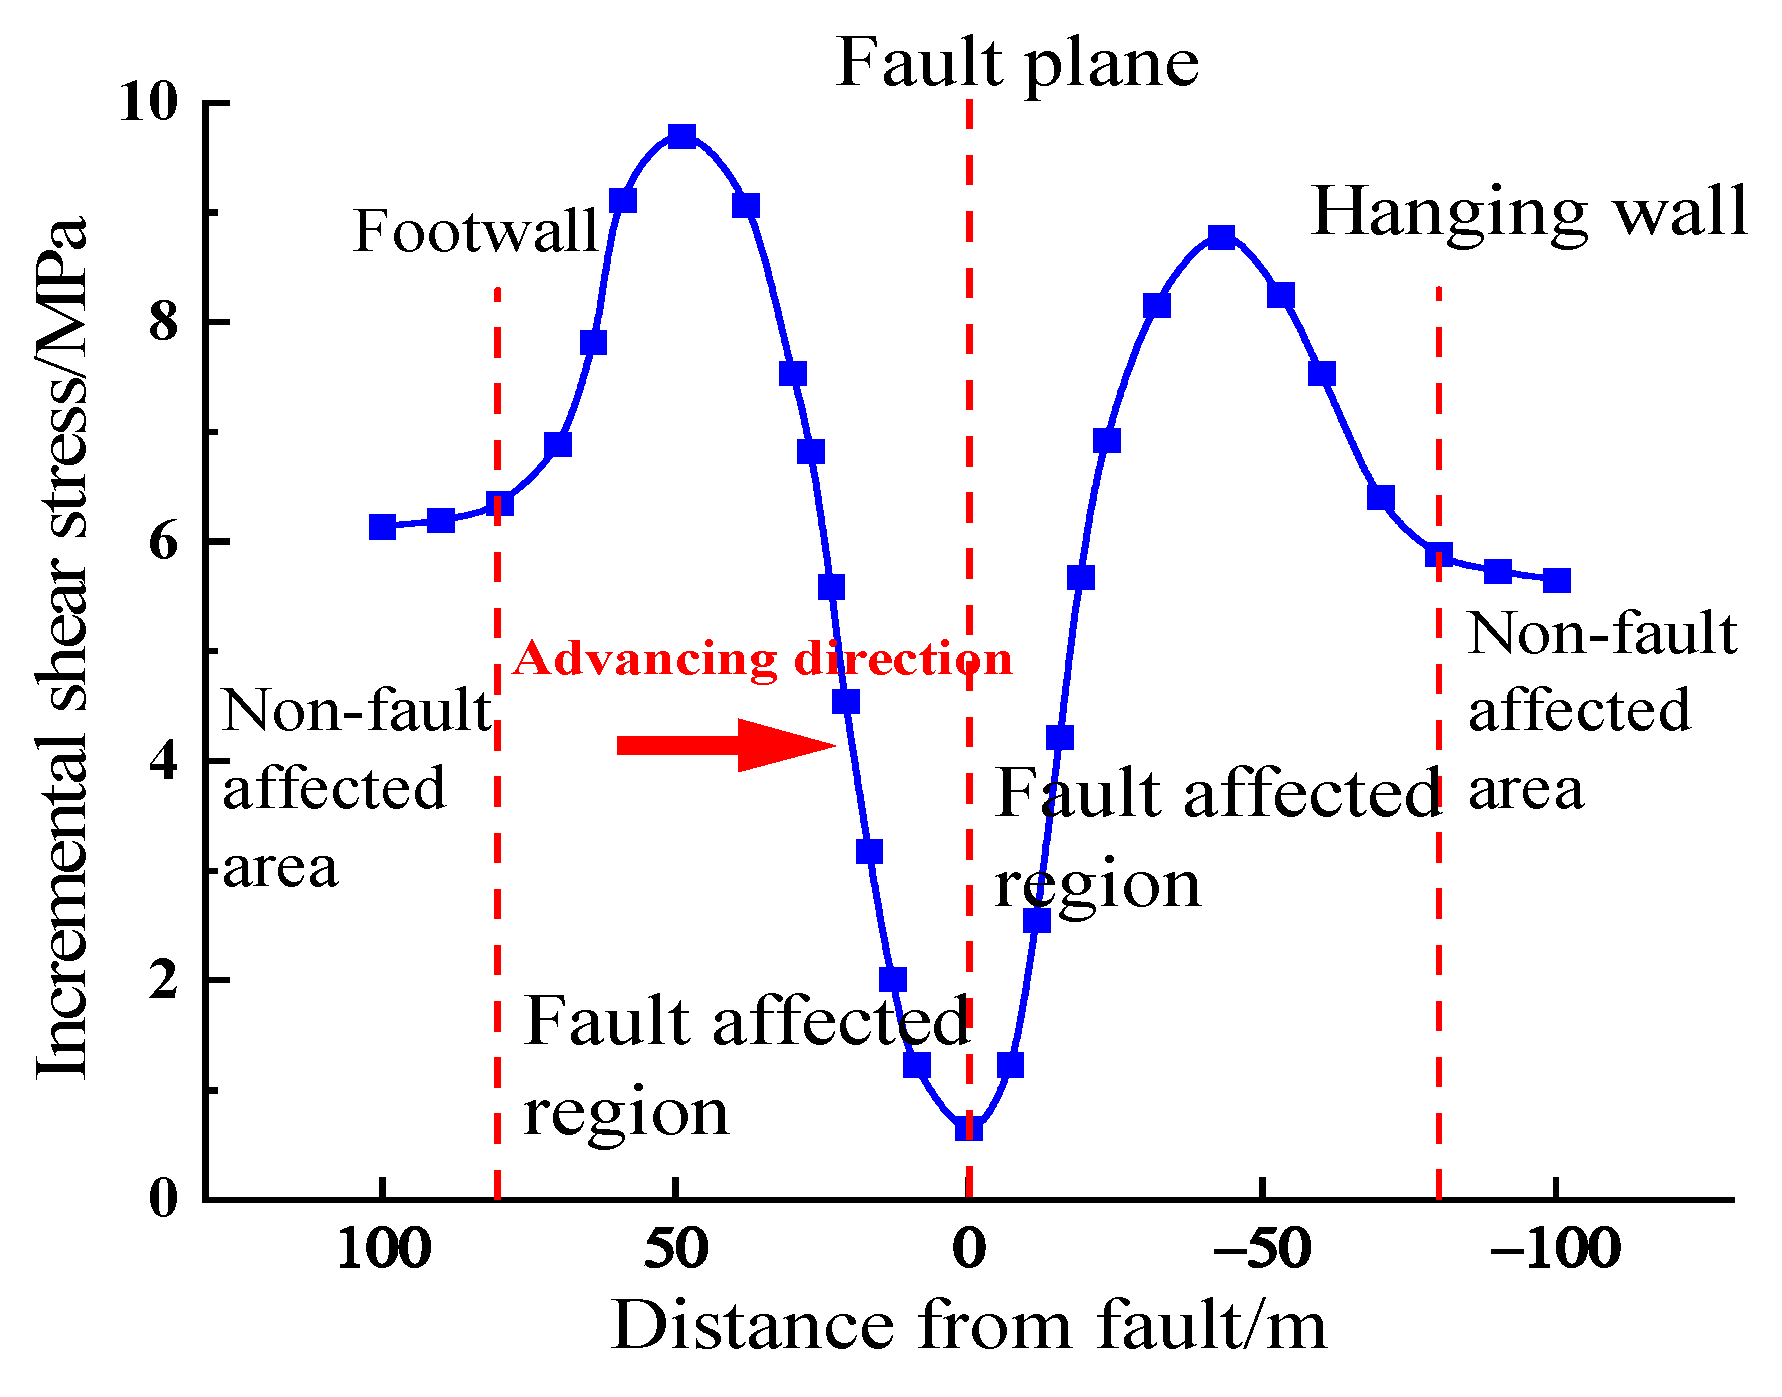
Shear stress increment field of the fault structure.
Figure 3 shows that the distribution range of the shear stress increment in the footwall of the fault is larger than that in the hanging wall, exhibiting an asymmetric distribution. The maximum shear stress increment in the footwall is 9.69 MPa, and the maximum value is located 49 m away from the fault plane. The maximum increment in shear stress in the hanging wall is 8.78 MPa, and the maximum value is located 43 m away from the fault plane. The shear stress increment in the hanging wall is less than that in the footwall, the main reason being that mining disturbance has a greater impact on the footwall of the fault. The shear stress of the lower wall changes when the working face is 80 m away from the fault plane. As the distance from the fault decreases, the shear stress slowly increases at first and then rapidly decreases. Because the working face is significantly farther away from the fault plane, the shear stress of the hanging wall shows an initial rapid increase followed by a slow decrease. When the mining face is 80 m away from the fault plane, the shear stress no longer changes significantly.
3.2. Rock Burst Mechanism
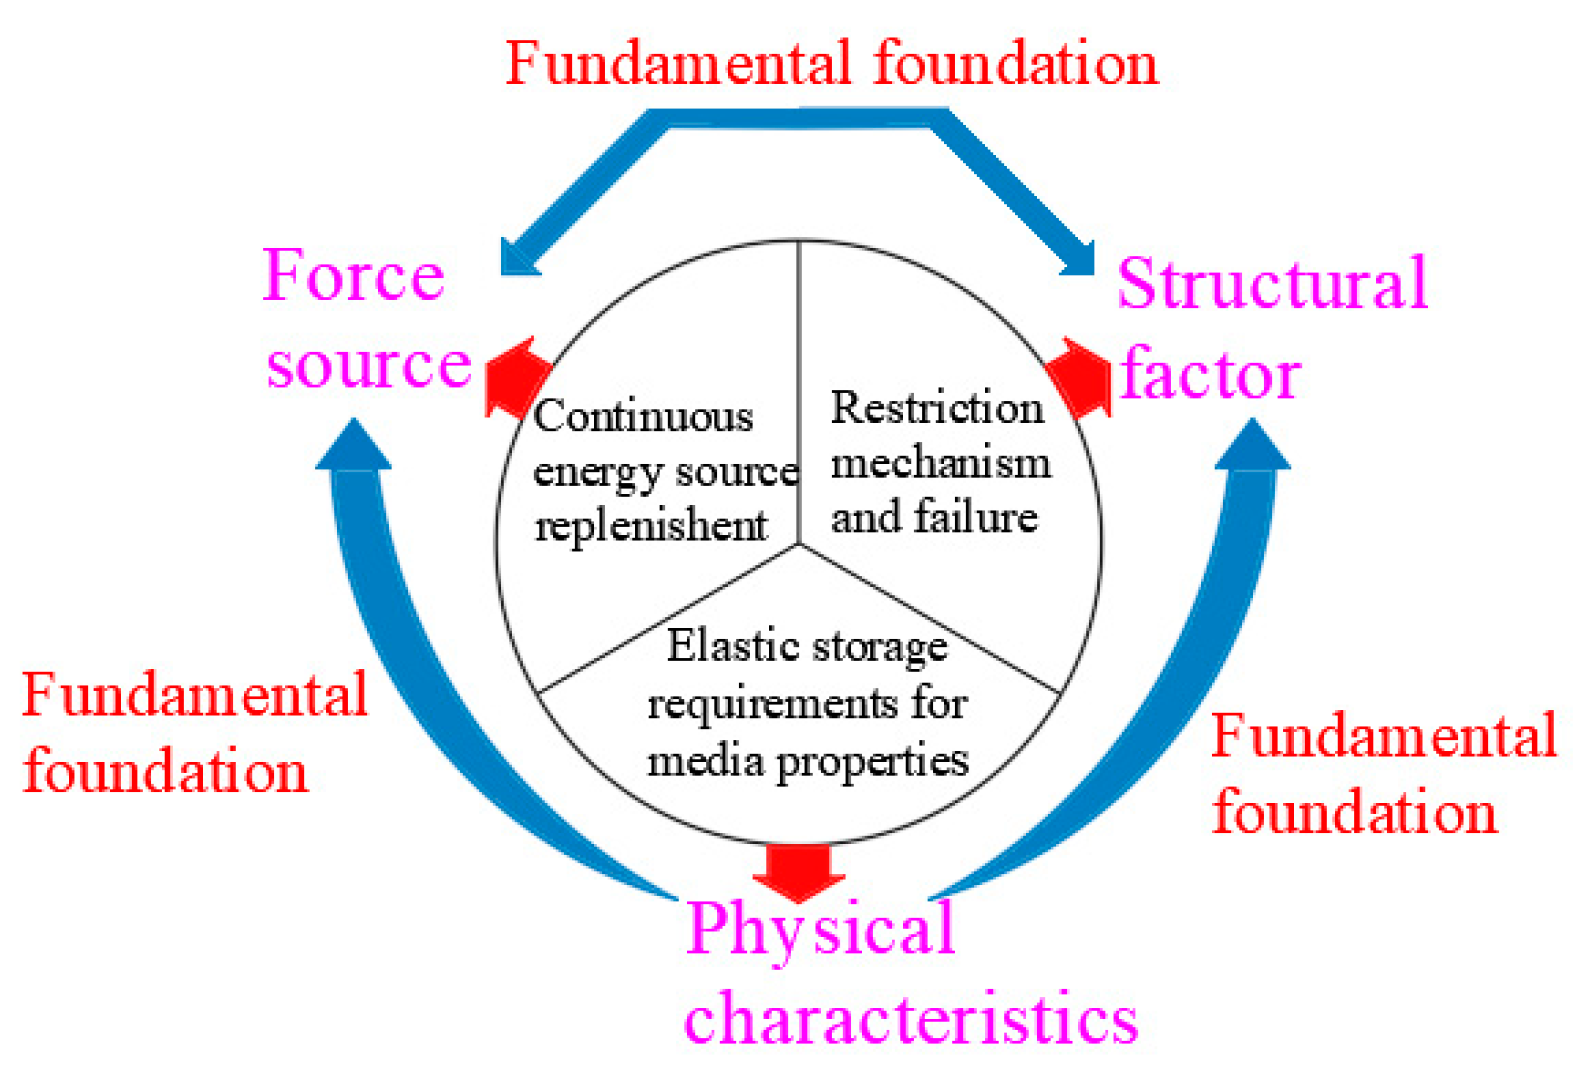
The “three-factor” induction theory for rock bursts was proposed by Qi et al. [53,54], which suggests that the three key factors affecting the evolution and occurrence of rock bursts are divided into force source, physical property, and structural factors (see Figure 4).
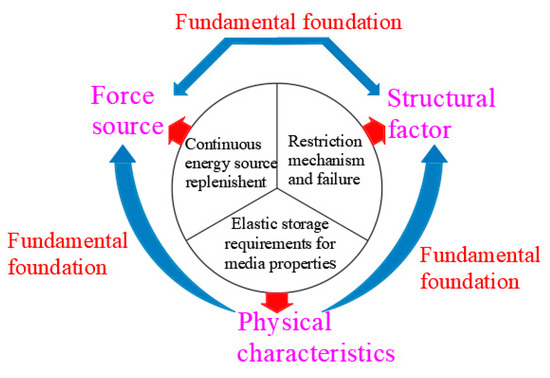
Figure 4.
Theoretical framework of “three factors” [48].
The 13,200 working face of the Gengcun coal mine is utilized as a case study. The redistribution and concentration stresses caused by coal mining disturbances are the main sources of force. The concentration stress is caused by the increment in structural stress in the tectonic-affected area, and the coefficient of structural stress concentration significantly increases. This provides a fundamental driving force for rock burst formation, thus resulting in the deformation and destruction of rock masses in the working face and roadway. This also creates ideal conditions for the accumulation of elastic energy in the surrounding rock, serving as an important basis for measuring the burst risk of the surrounding rock.
From the perspective of physical properties, the spatial structure of the hard roofs in the surrounding goaf and the 13,200 working faces induces a high concentration of stress in the working faces. From a structural perspective, the F16 fault structure disrupts the uniformity and continuity of the surrounding rock mass and forms a new spatial system. When the influence of mining disturbance reaches the limit state of the spatial structure, failure will occur, thus inducing a rock burst.
From the perspective of rock burst types, the 13,200 working face is affected by several primary factors, such as the significant burial depth, hard roofs, fault structures, and mining disturbance. Coal mining and ground stress load cause energy accumulation in the surrounding rock. The dynamic load induced by the fracture of the hard roof induces energy release, resulting in coal pillar failure and, thus, a rock burst.
It can be concluded that the tectonic stress generated by the F16 fault structure has an important influence on the roadway, as shown in Figure 5. In other words, roadway support and tectonic stresses jointly affect static loads in the structural area. The static stress load of coal near the roadway in a single structural area can be represented as σS + σT + σD.
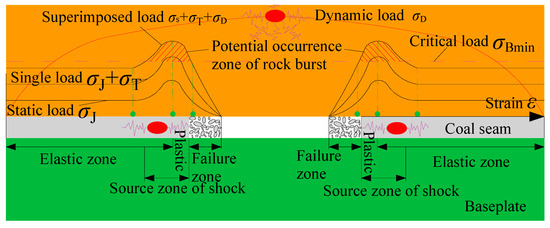
Figure 5.
Rock burst mechanism of a roadway in a tectonic zone.
Here, σS is the roadway support stress, σT is the structural stress, and σD is the dynamic load stress of the coal seam roof. Compared to areas with no structure, the increments in static load stress and the superimposed stress of the coal body caused by the structure exceed the impact source area of the critical stress. Moreover, the dynamic load caused by coal seam mining disturbances leads to a higher peak value for the superimposed load. This increases both shock risk and the range of shock sources.
In general, the static load consists of the original rock stress and abutment stress (Equation (26)).
where γ is the bulk density of overlying strata; H is the overlying strata thickness; λ is the coefficient of structural stress concentration; and k is the abutment pressure concentration coefficient.
The primary source of dynamic load in coal mining is the substantial stress change caused by mining activities, which manifests as rock burst activity. When the superimposed stress, formed by the static load of mining surrounding rock and the dynamic load induced by mine earthquakes, exceeds the critical load of coal and rock, the coal and rock mass is dynamically damaged, resulting in rock bursts.
4. Numerical Simulation
4.1. Model Construction and Rock Mechanics Parameters
In order to further study the mechanism of rock burst induced by an extra-thick conglomerate and a thrust fault, the surrounding rock deformation and fault tectonic stress distribution are simulated for a 13,200 working face using FLAC-3D software(version 6.0, ITASCA, Minneapolis, MN, USA, 2017). Based on the mining and geological conditions of the F16 fault in the Gengcun coal mine, a FLAC-3D numerical model is constructed considering a thrust fault and mining disturbance.
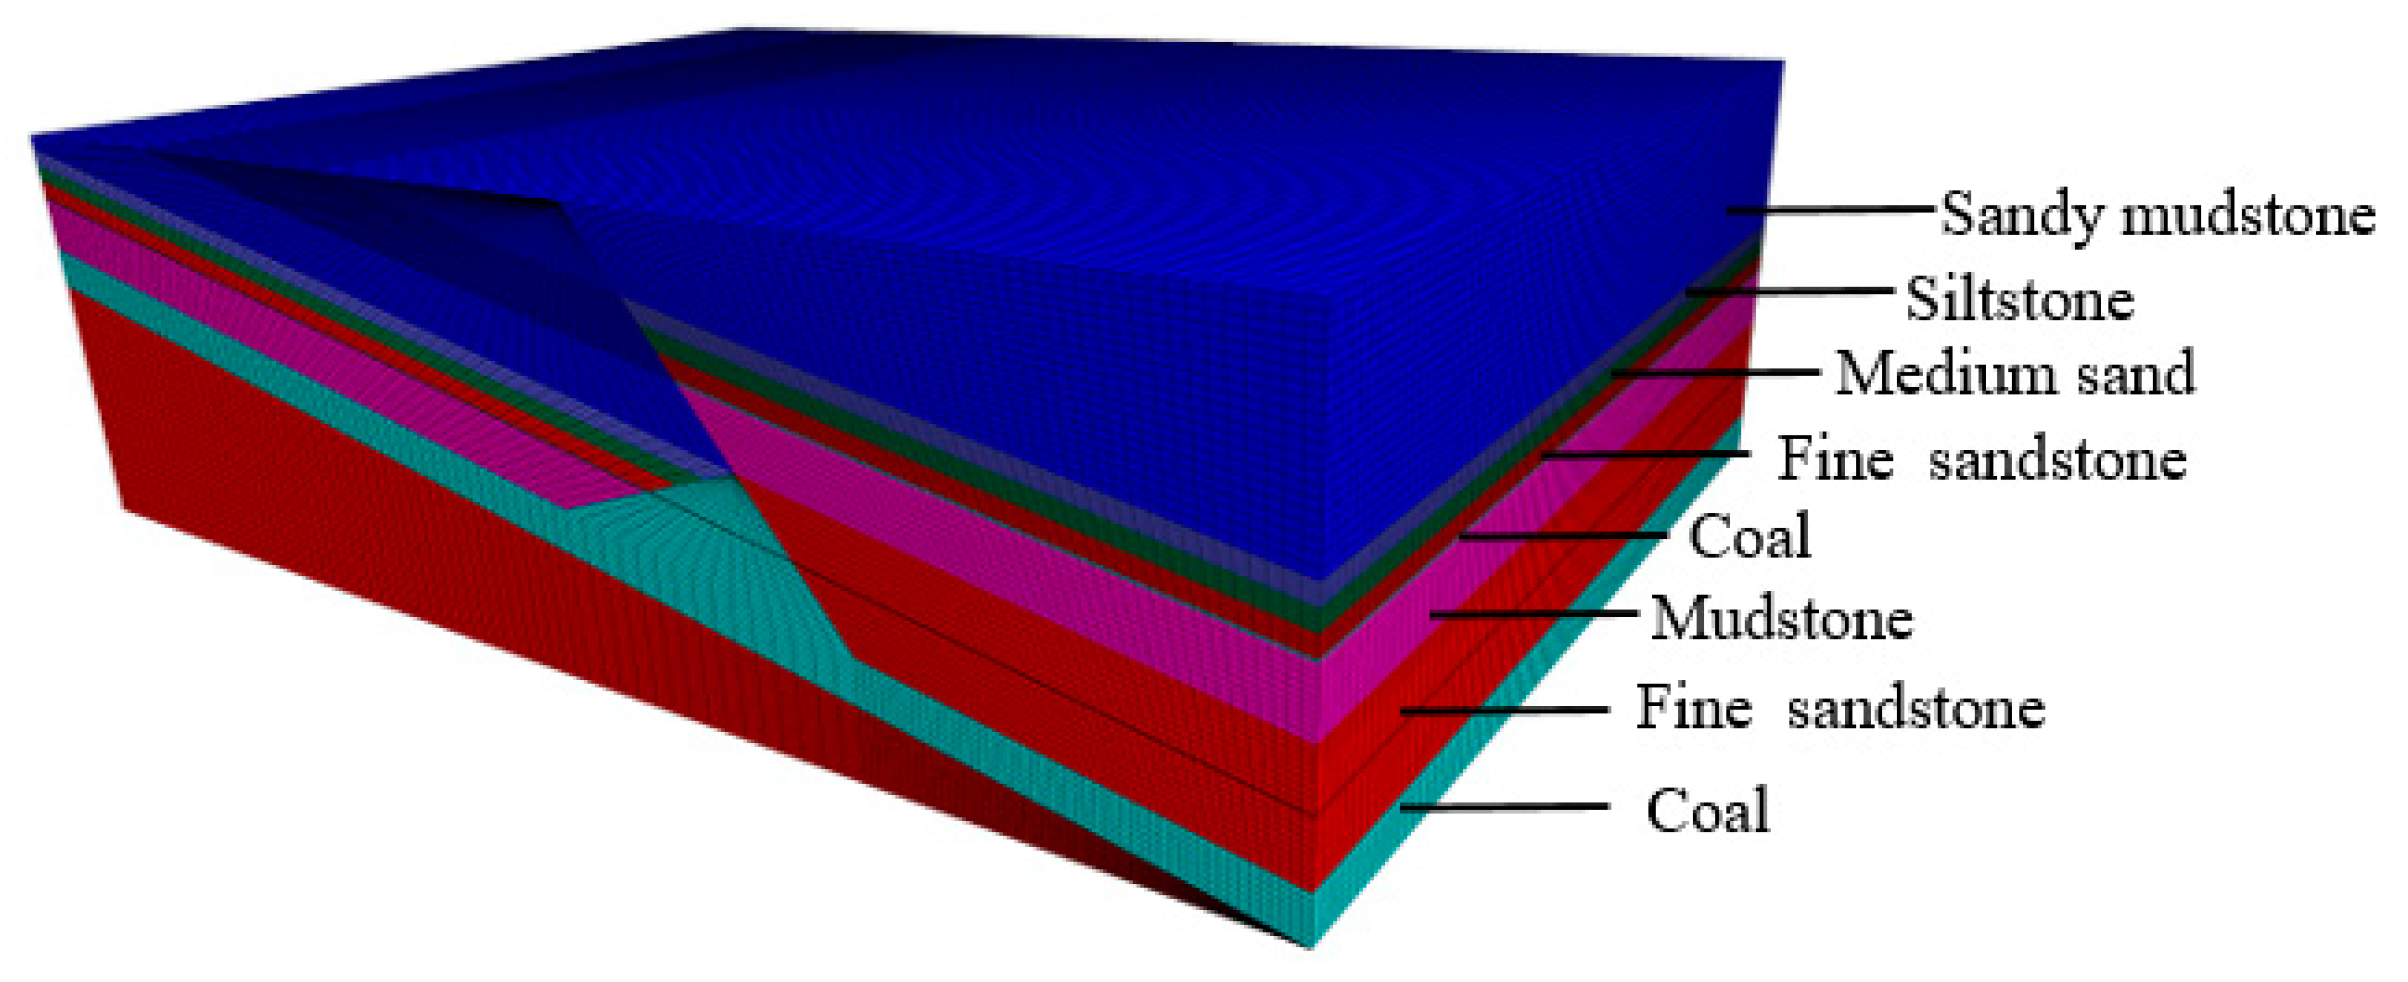
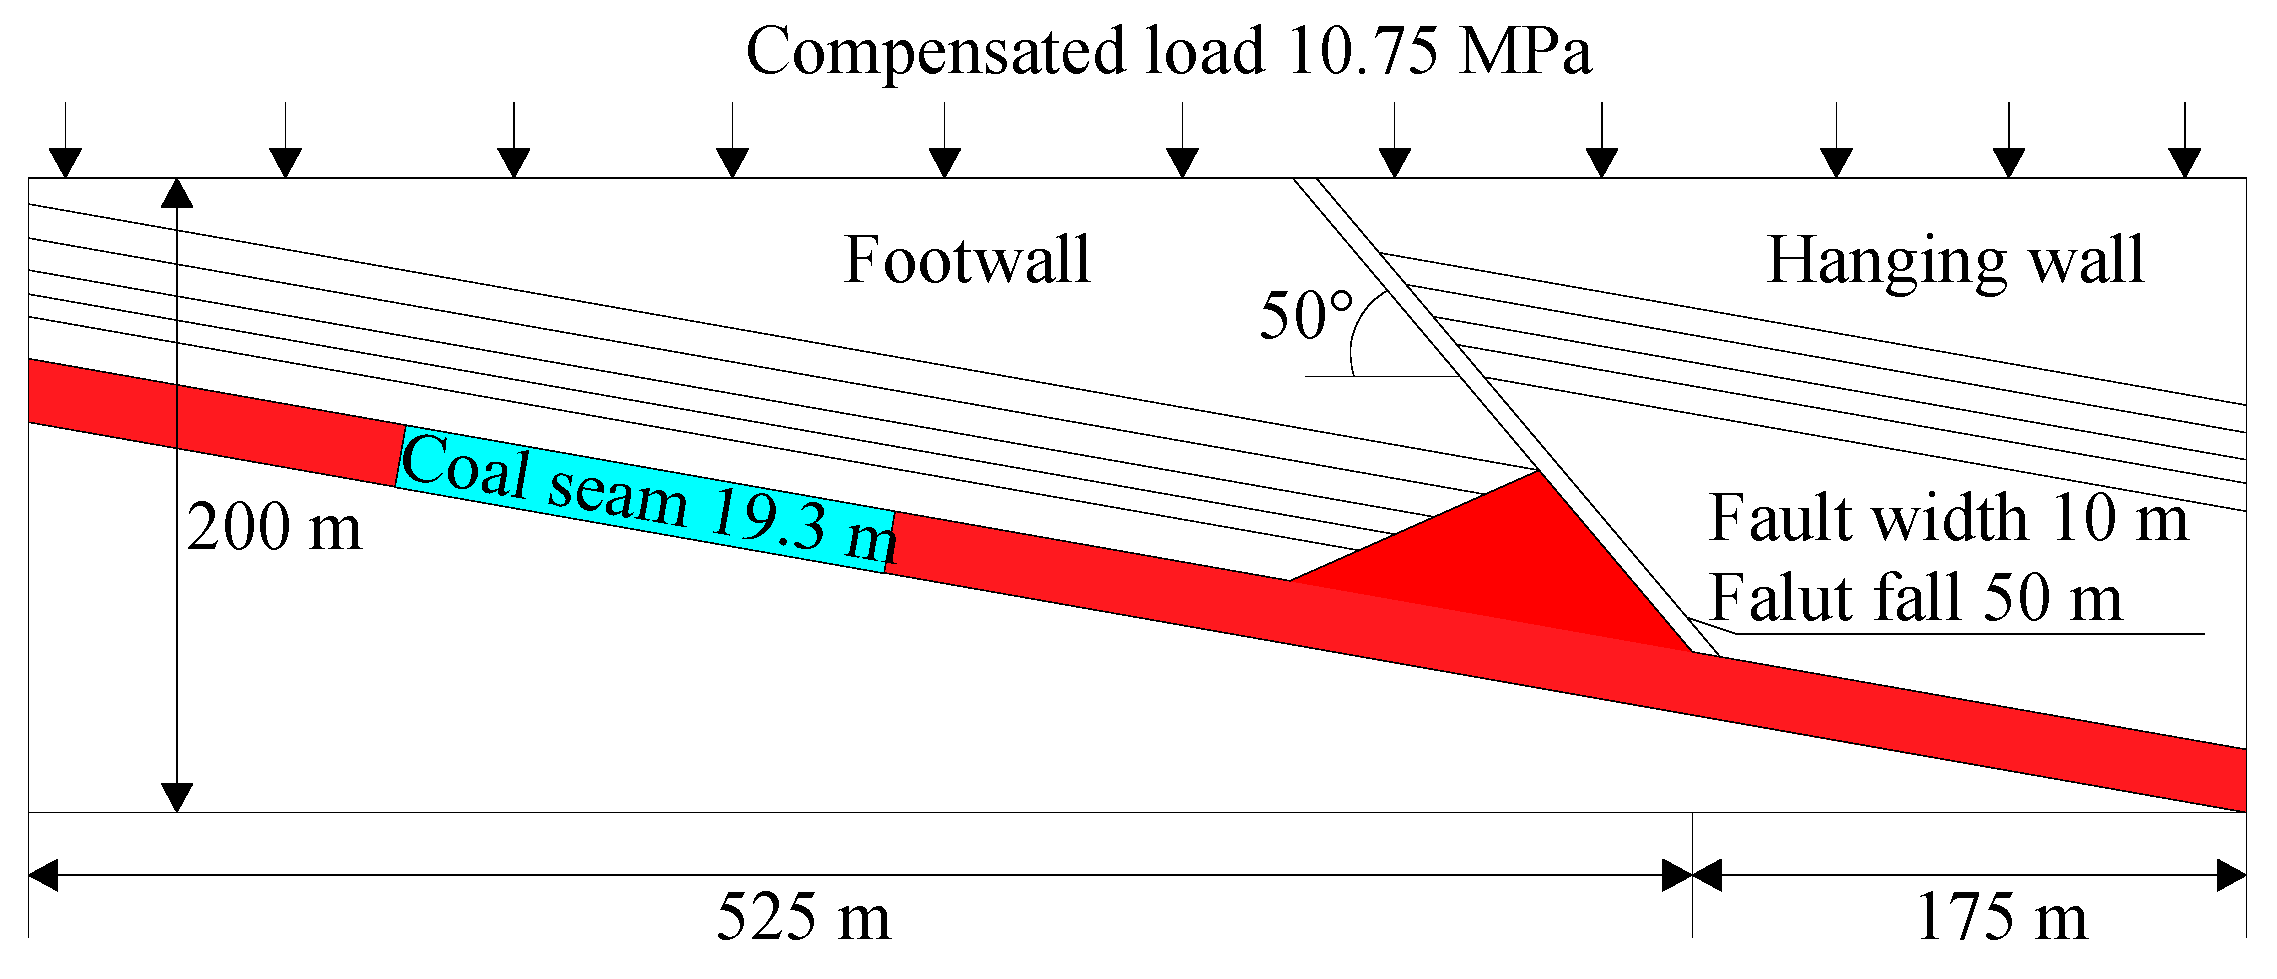
The model contains 449,280 elements and has a size of 700 m × 500 m × 200 m (see Figure 6). In the construction process of the model, the dip angle of the Jurassic roof strata in the footwall of the F16 fault is set to 10°, with the dip angle of the Triassic strata in the upper fault set to 50°. The extremely thick seam zone is simplified into a triangular area with a length of 150 m and a height of 60 m. In the model, a built-in interface module of FLAC 3D is used to simulate the F16 fault structure. The fault inclination is set to 50°, with the starting coordinates of the lower end of the fault plane set to (520, 0, 50). The physical and mechanical parameters were measured using laboratory tests for simulations, as shown in Table 1. The mechanical properties of the fault are shown in Table 2. The boundary conditions of the model are set as follows: normal displacement constraints are applied around the model, the bottom boundary is set to a fixed boundary, the displacement in the X, Y, and Z directions is zero, and the upper boundary is set as a free boundary (see Figure 7). A uniform load of 10.75 MPa is utilized to simulate the overlying rock pressure, with a height of 430 m. In order to simplify the spatial relationship between the 13,200 working face and the F16 fault in the simulation process, the F16 fault in the model is fixed, and the excavation step is 20 m along the coal seam inclination. Moreover, the excavation is stopped near the fault in the lower roadway due to frequent microseismic events. The influence of mining disturbance, seam thickness, fault dip angle, and other factors on the structural stress of the coal seam is studied.
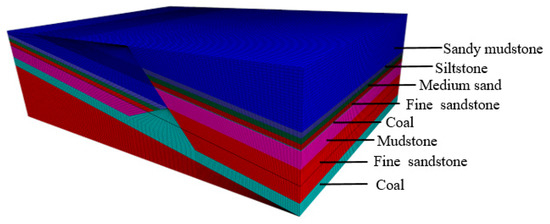
Figure 6.
Numerical calculation model.

Table 1.
Mechanical properties of rock masses.
Table 2.
Mechanical properties of the fault.
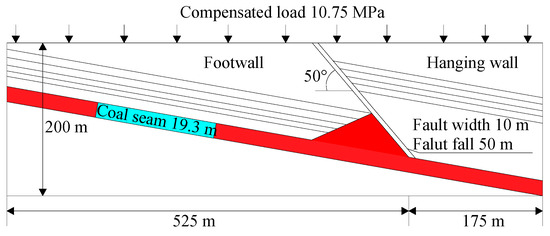
Figure 7.
Boundary condition of the model.
4.2. Simulation Results and Discussion
4.2.1. Evolutionary Law of Supporting Stress and Surrounding Rock Stress of the F16 Fault
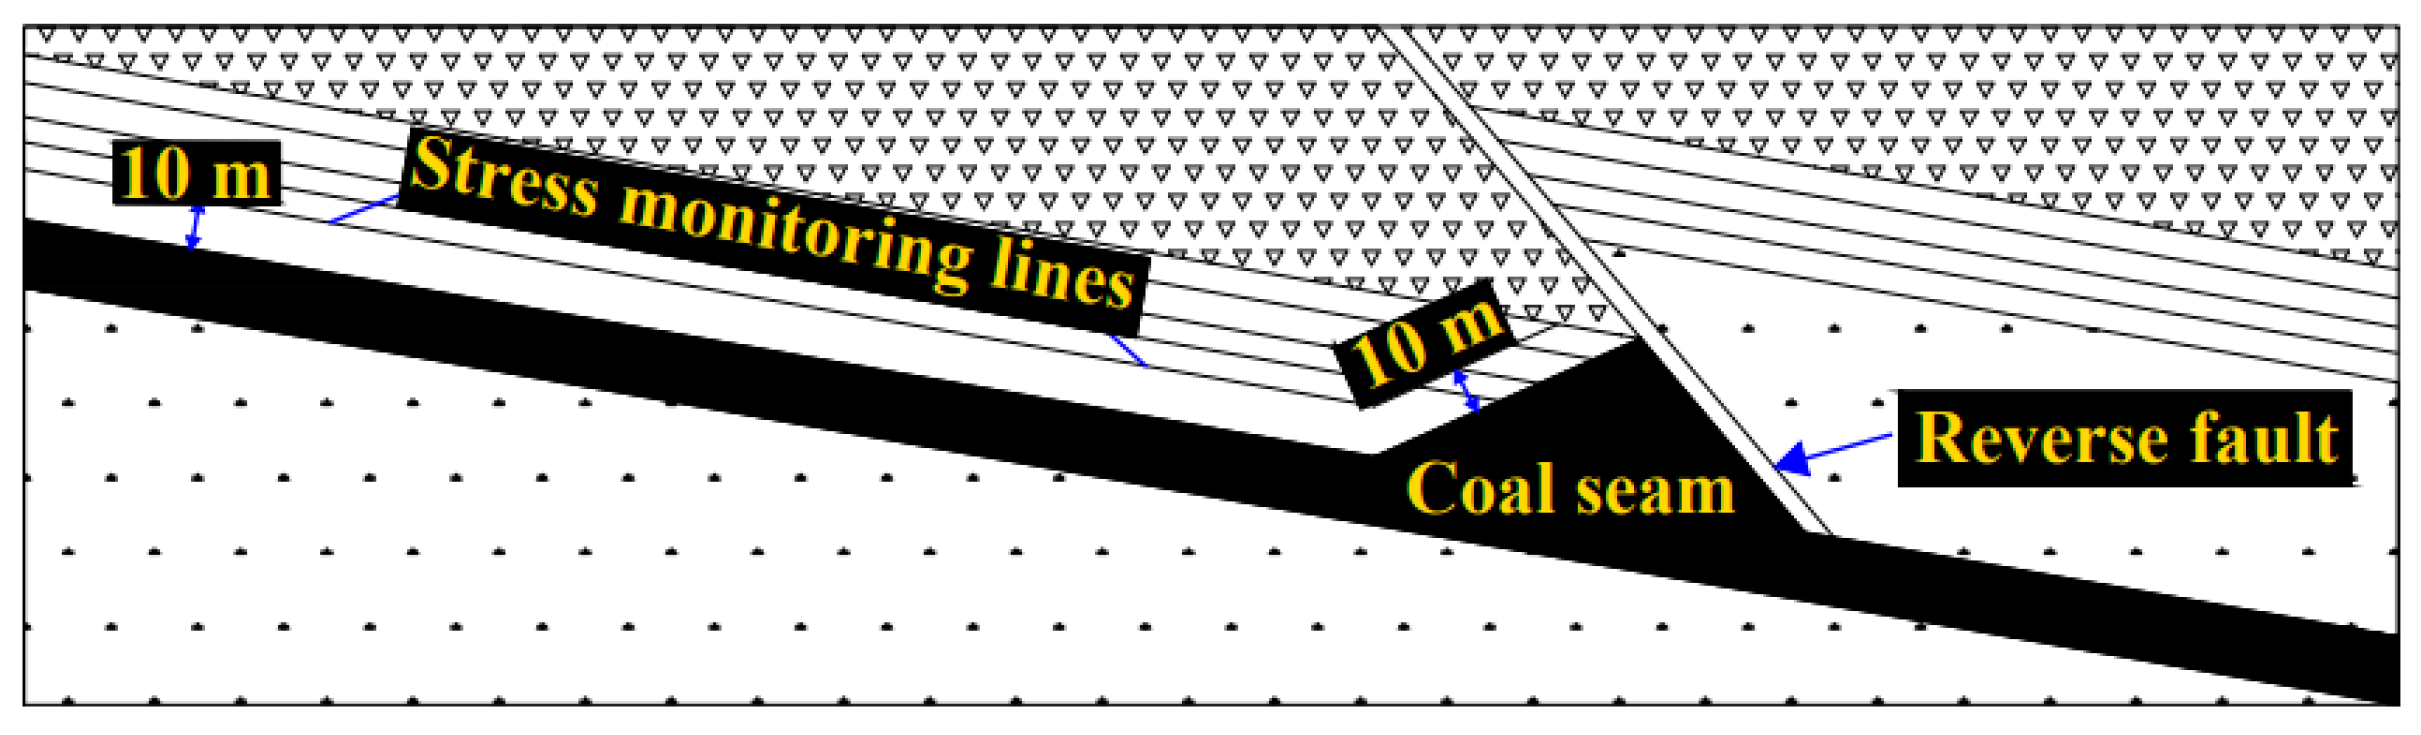
In order to obtain the stress distribution law of surrounding rock at different positions in front of the coal wall during coal mining, the working face is inclined along the coal seam, and the length of each excavation is set to 10 m. The monitoring line is set at the 10 m position of the roof, with monitoring points spaced at 10 m intervals (see Figure 7). The stress distribution curves of the surrounding rock are obtained at different positions in front of the coal wall, as shown in Figure 8. The excavation positions are 100 m, 80 m, 70 m, 60 m, 50 m, 40 m, 30 m, and 10 m away from the fault.
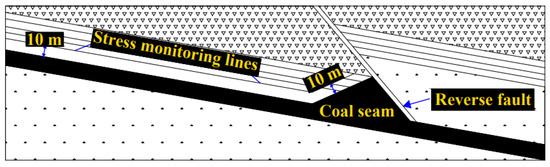
Figure 8.
Monitoring point arrangement.
The following stress distribution law during the advancement of the working face can be obtained from Figure 9, Figure 10 and Figure 11.
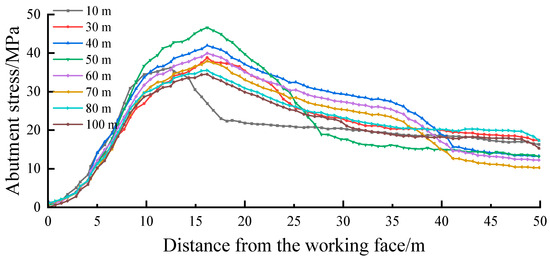
Figure 9.
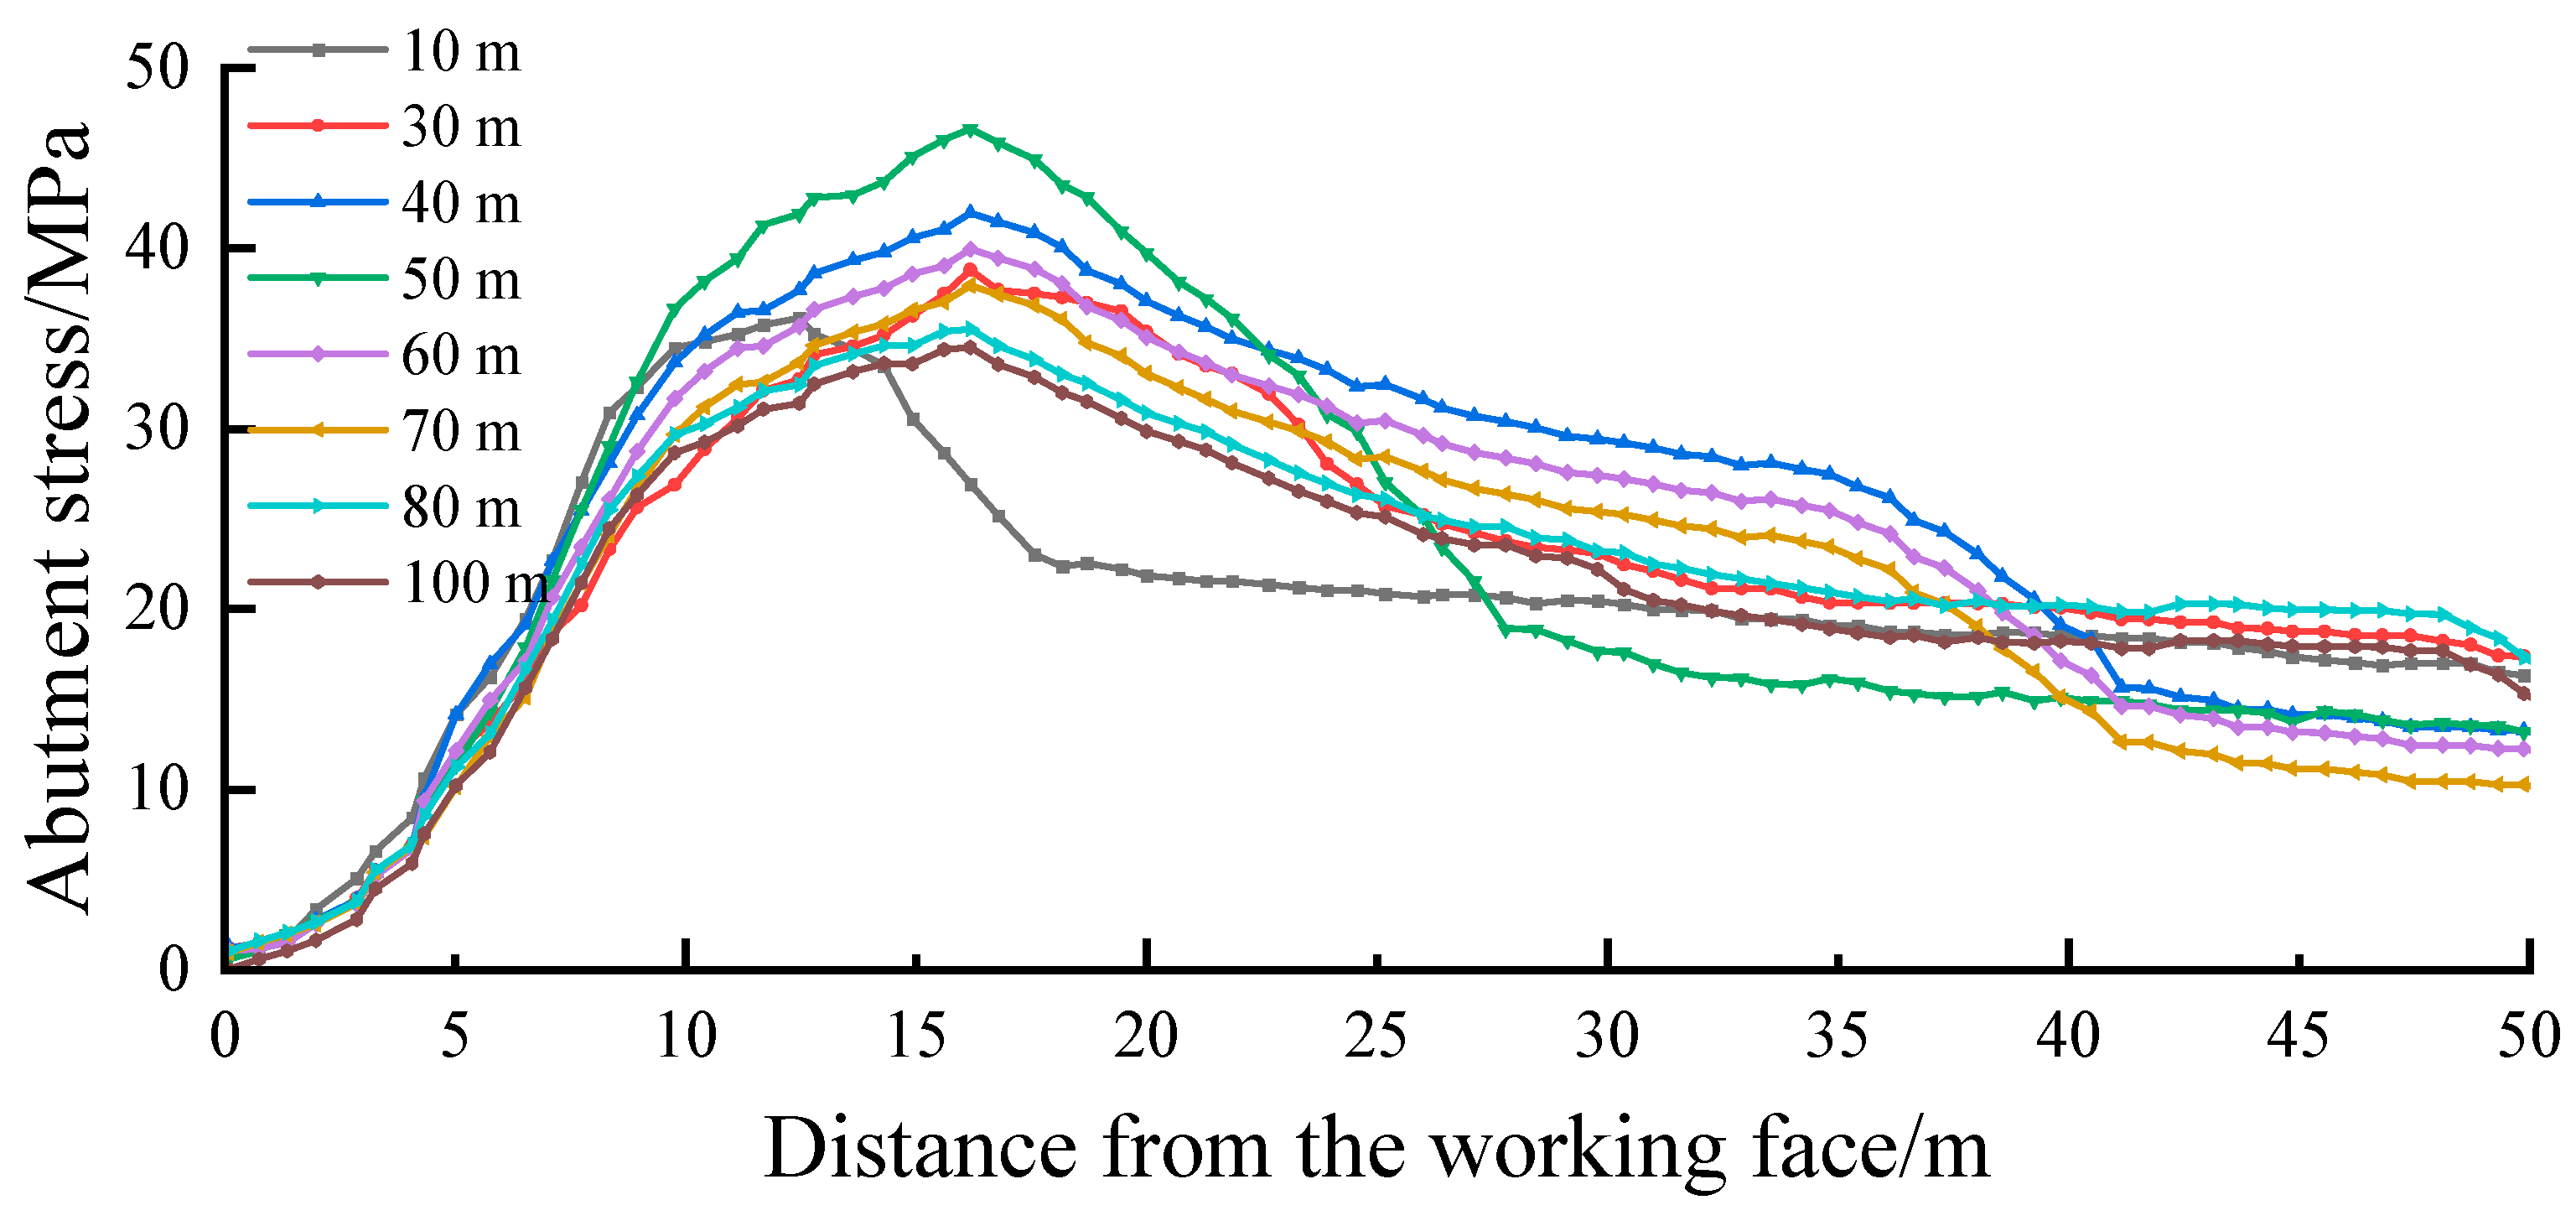
Abutment stress at different distances in front of the working face.

Figure 10.
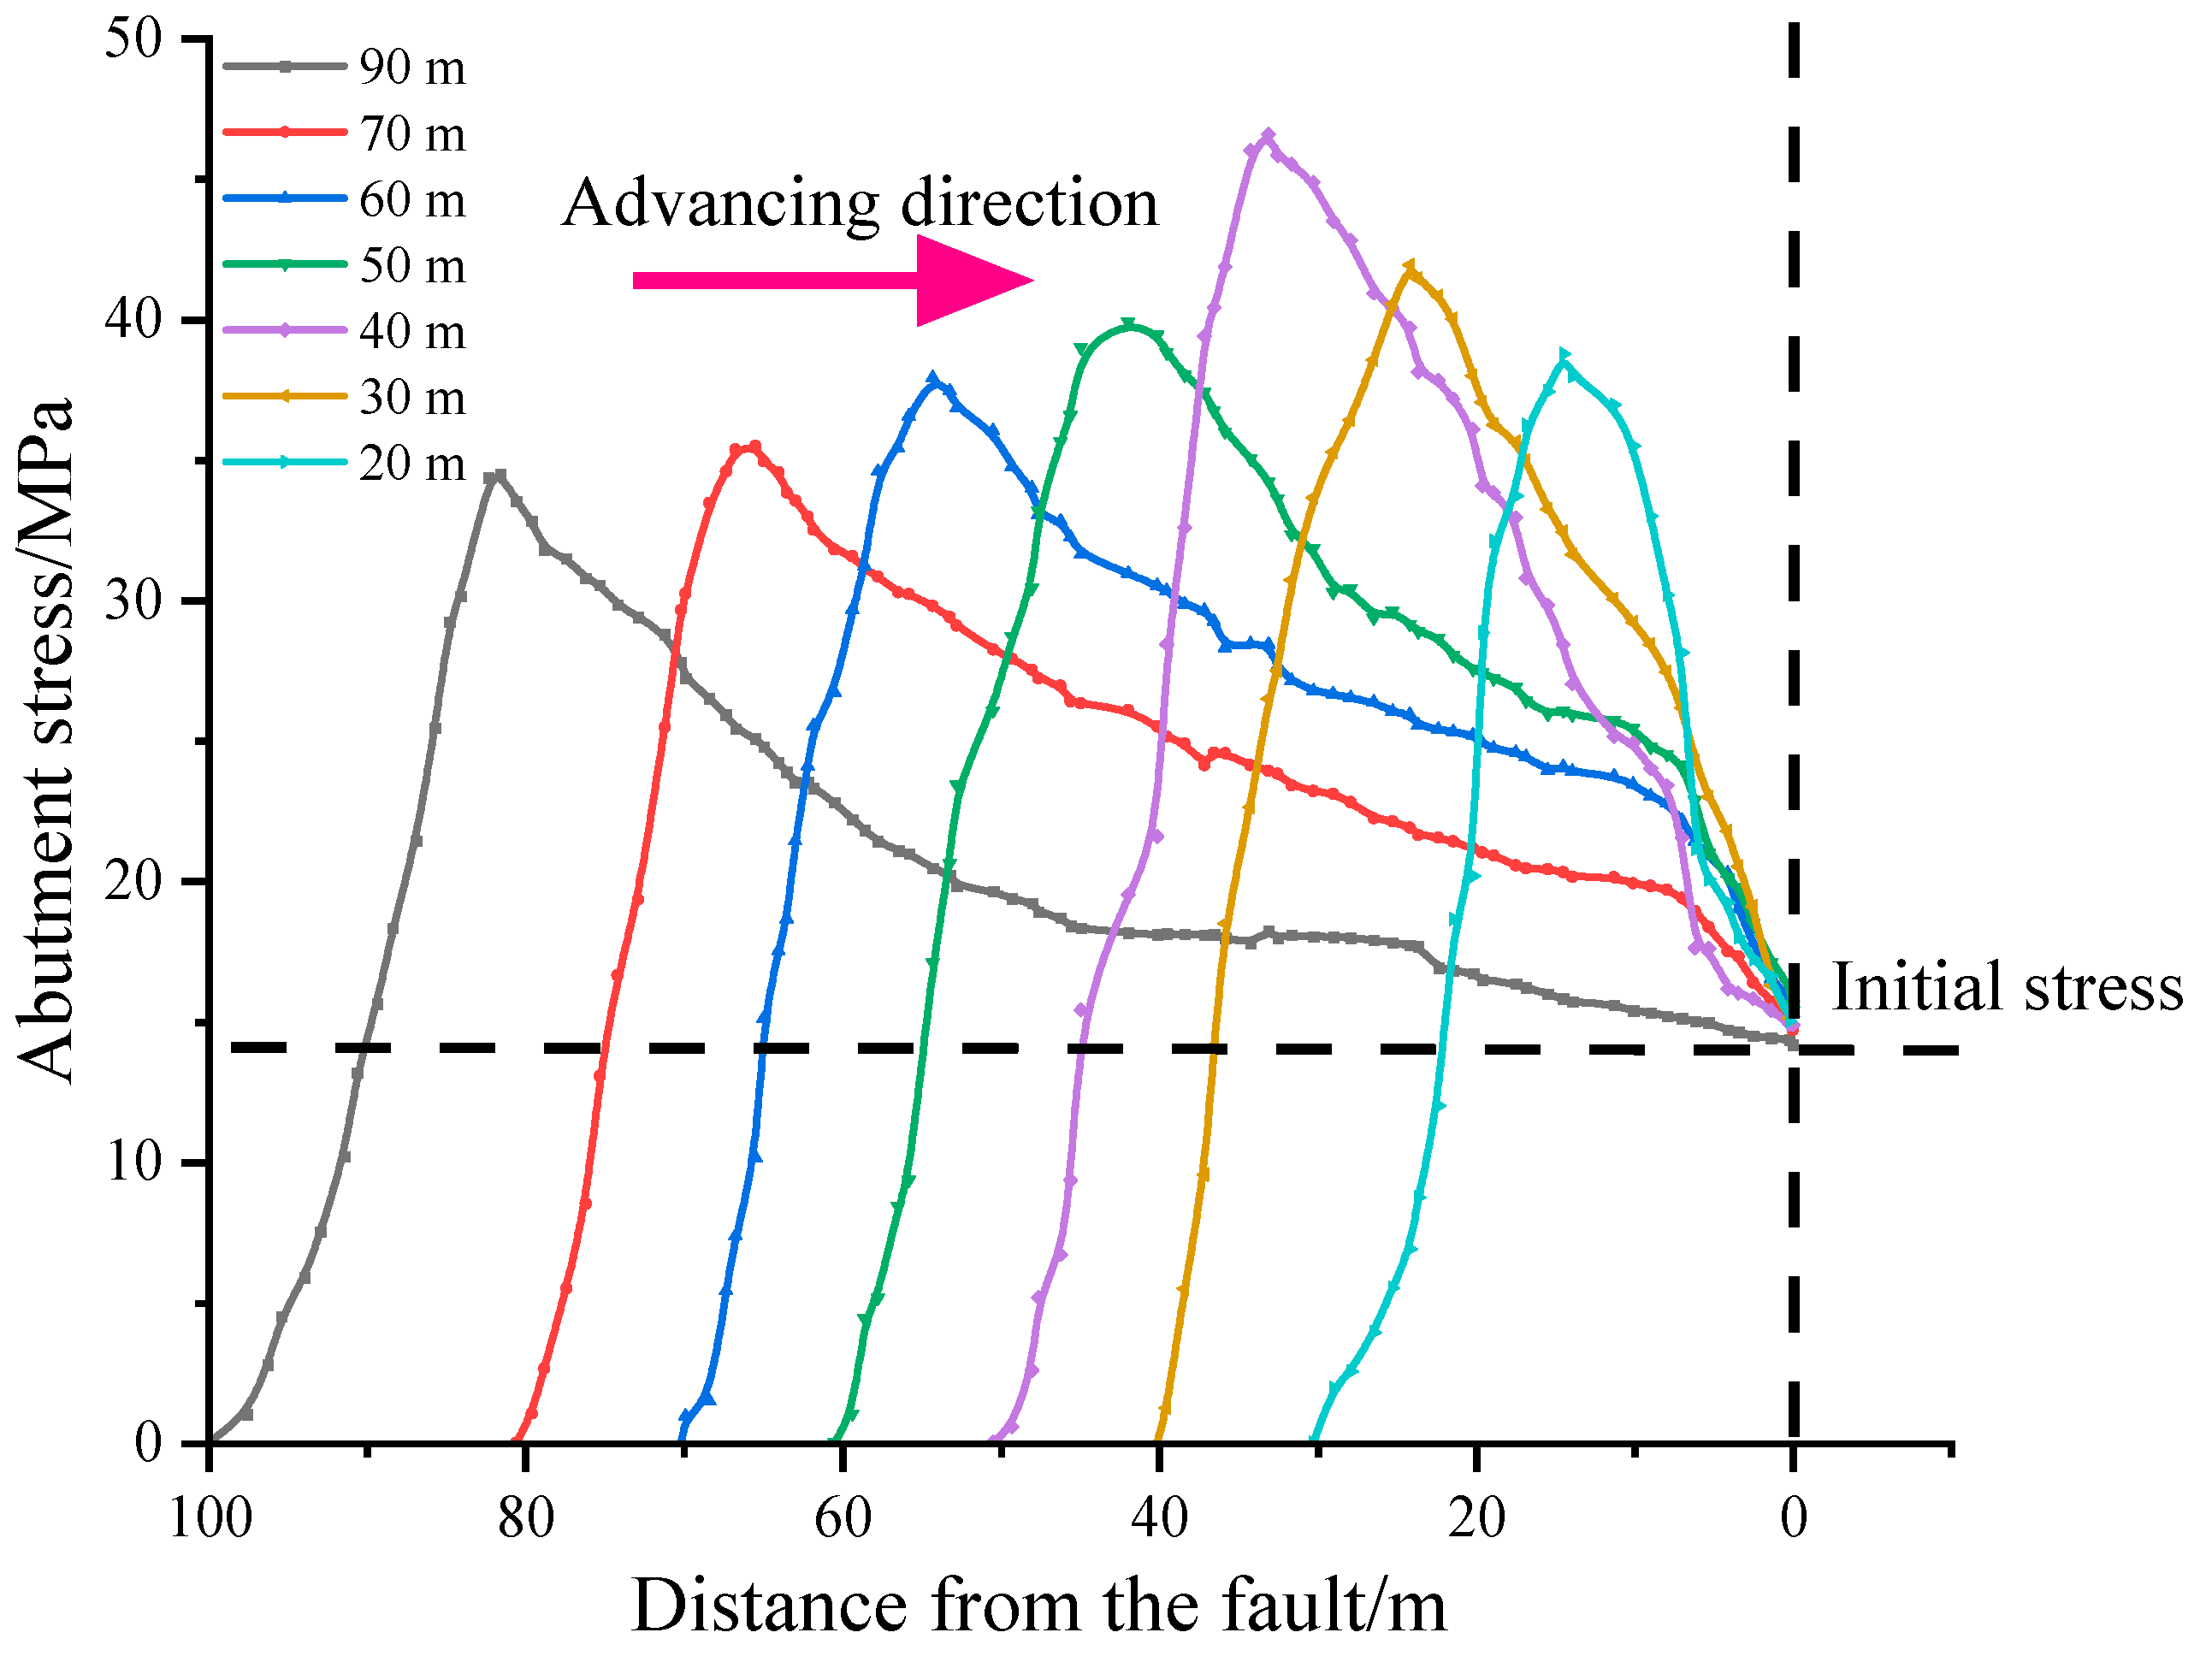
Abutment stress at different distances away from the fault plane.

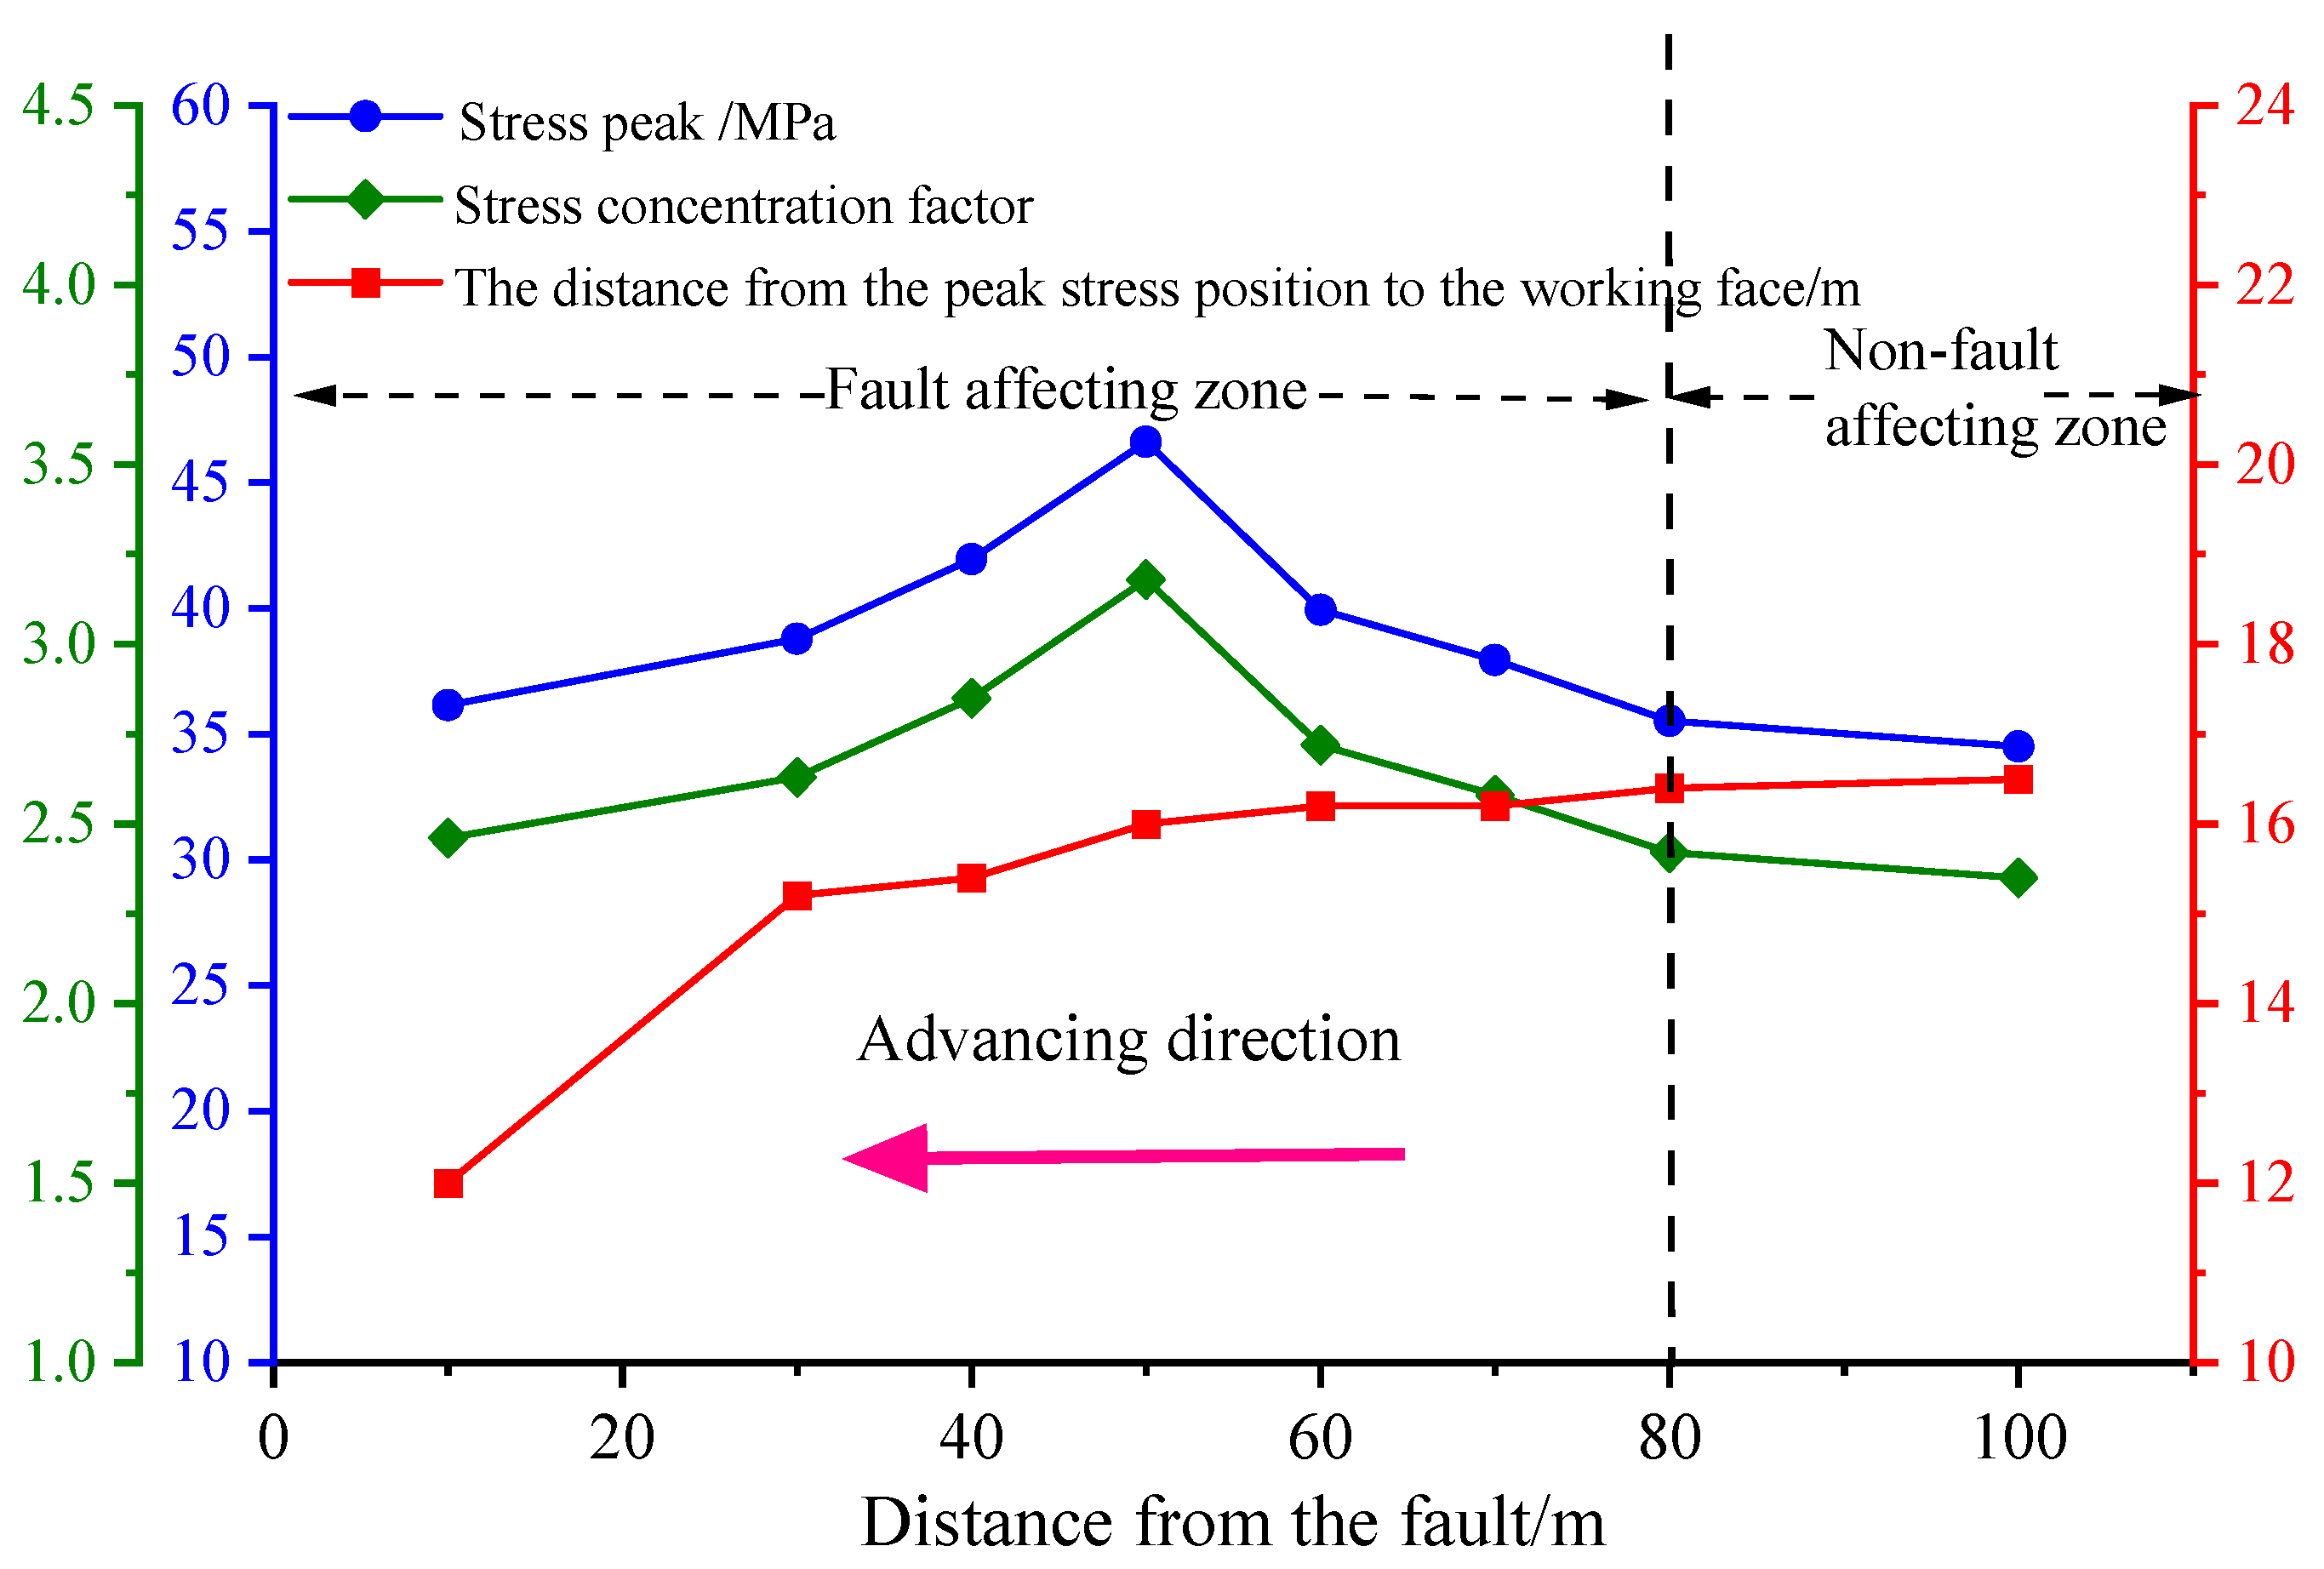
Figure 11.
Stress peak and stress concentration factor at different positions from the fault plane.
- (1)
- Figure 9 shows that stress concentration is likely to occur, with peak stress located 13–17 m in front of the working face. The stress peak value is higher than 35 MPa, and the stress concentration coefficient is larger than 2.42. Due to the thick and hard rock in the upper part of the mining area, a large overhanging roof is formed behind the goaf, and the phenomenon of stress concentration appears.
- (2)
- With the increase in mining distance, both stress peak and stress concentration coefficient values first increase and then decrease (see Figure 10 and Figure 11), with maximum values of 46.62 MPa and 3.17, respectively, located 50 m away from the working face. When the distances from the fault are 100 m and 80 m, the peak stress values are 34.51 MPa and 35.52 MPa, respectively. The distribution law of the advanced supporting pressure of the working face is similar. When the distance is less than 80 m, the stress peak value increases significantly. With the advancement of the working face toward the fault direction, the influence of the fault on the working face becomes increasingly obvious. The stress reaches its maximum value at a distance of 50 m from the fault, and at a distance of 80 m from the fault, it is divided into a fault-affected zone and a fault non-affected zone. When the distance from the fault is less than 50 m, the increasing trend of the stress peak and stress concentration coefficient decreases. When the working face is excavated 10 m away from the fault, the stress on the coal far exceeds the compressive strength because of the small distance between the fault and the working face. Consequently, coal failure occurs, and the peak stress is reduced by 36.14 MPa. The fault reduces the supporting stress range and forms a large stress gradient between the coal wall and the fault, which results in a rock burst.
4.2.2. Supporting Stress and Surrounding Rock Stress of the F16 Fault for Different Fault Dip Angles
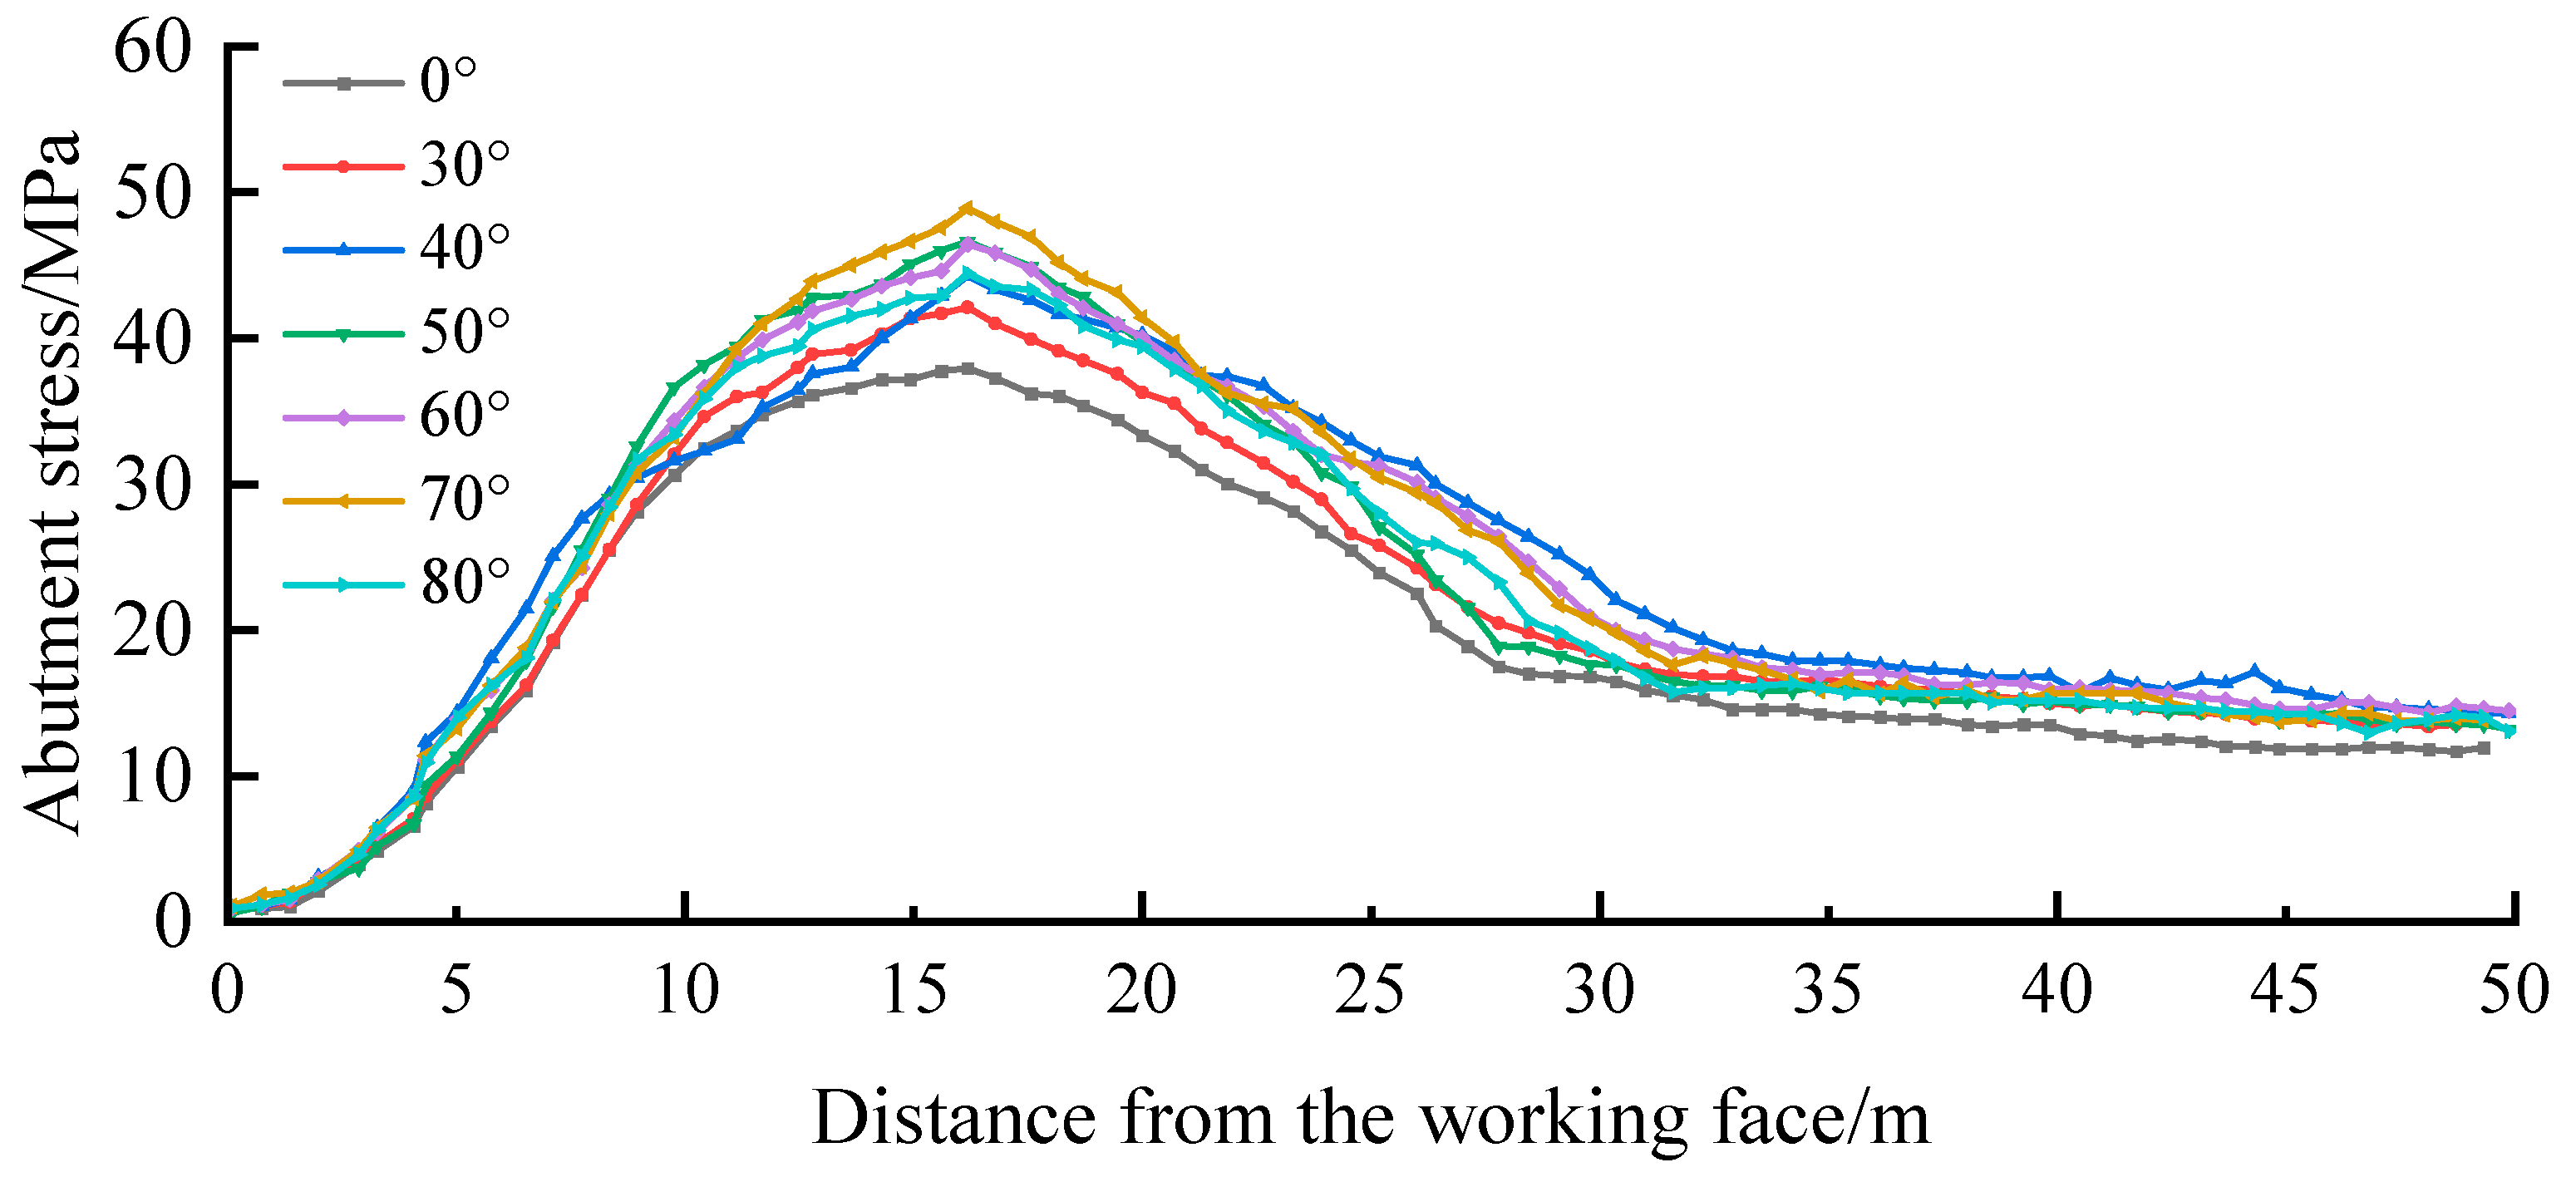
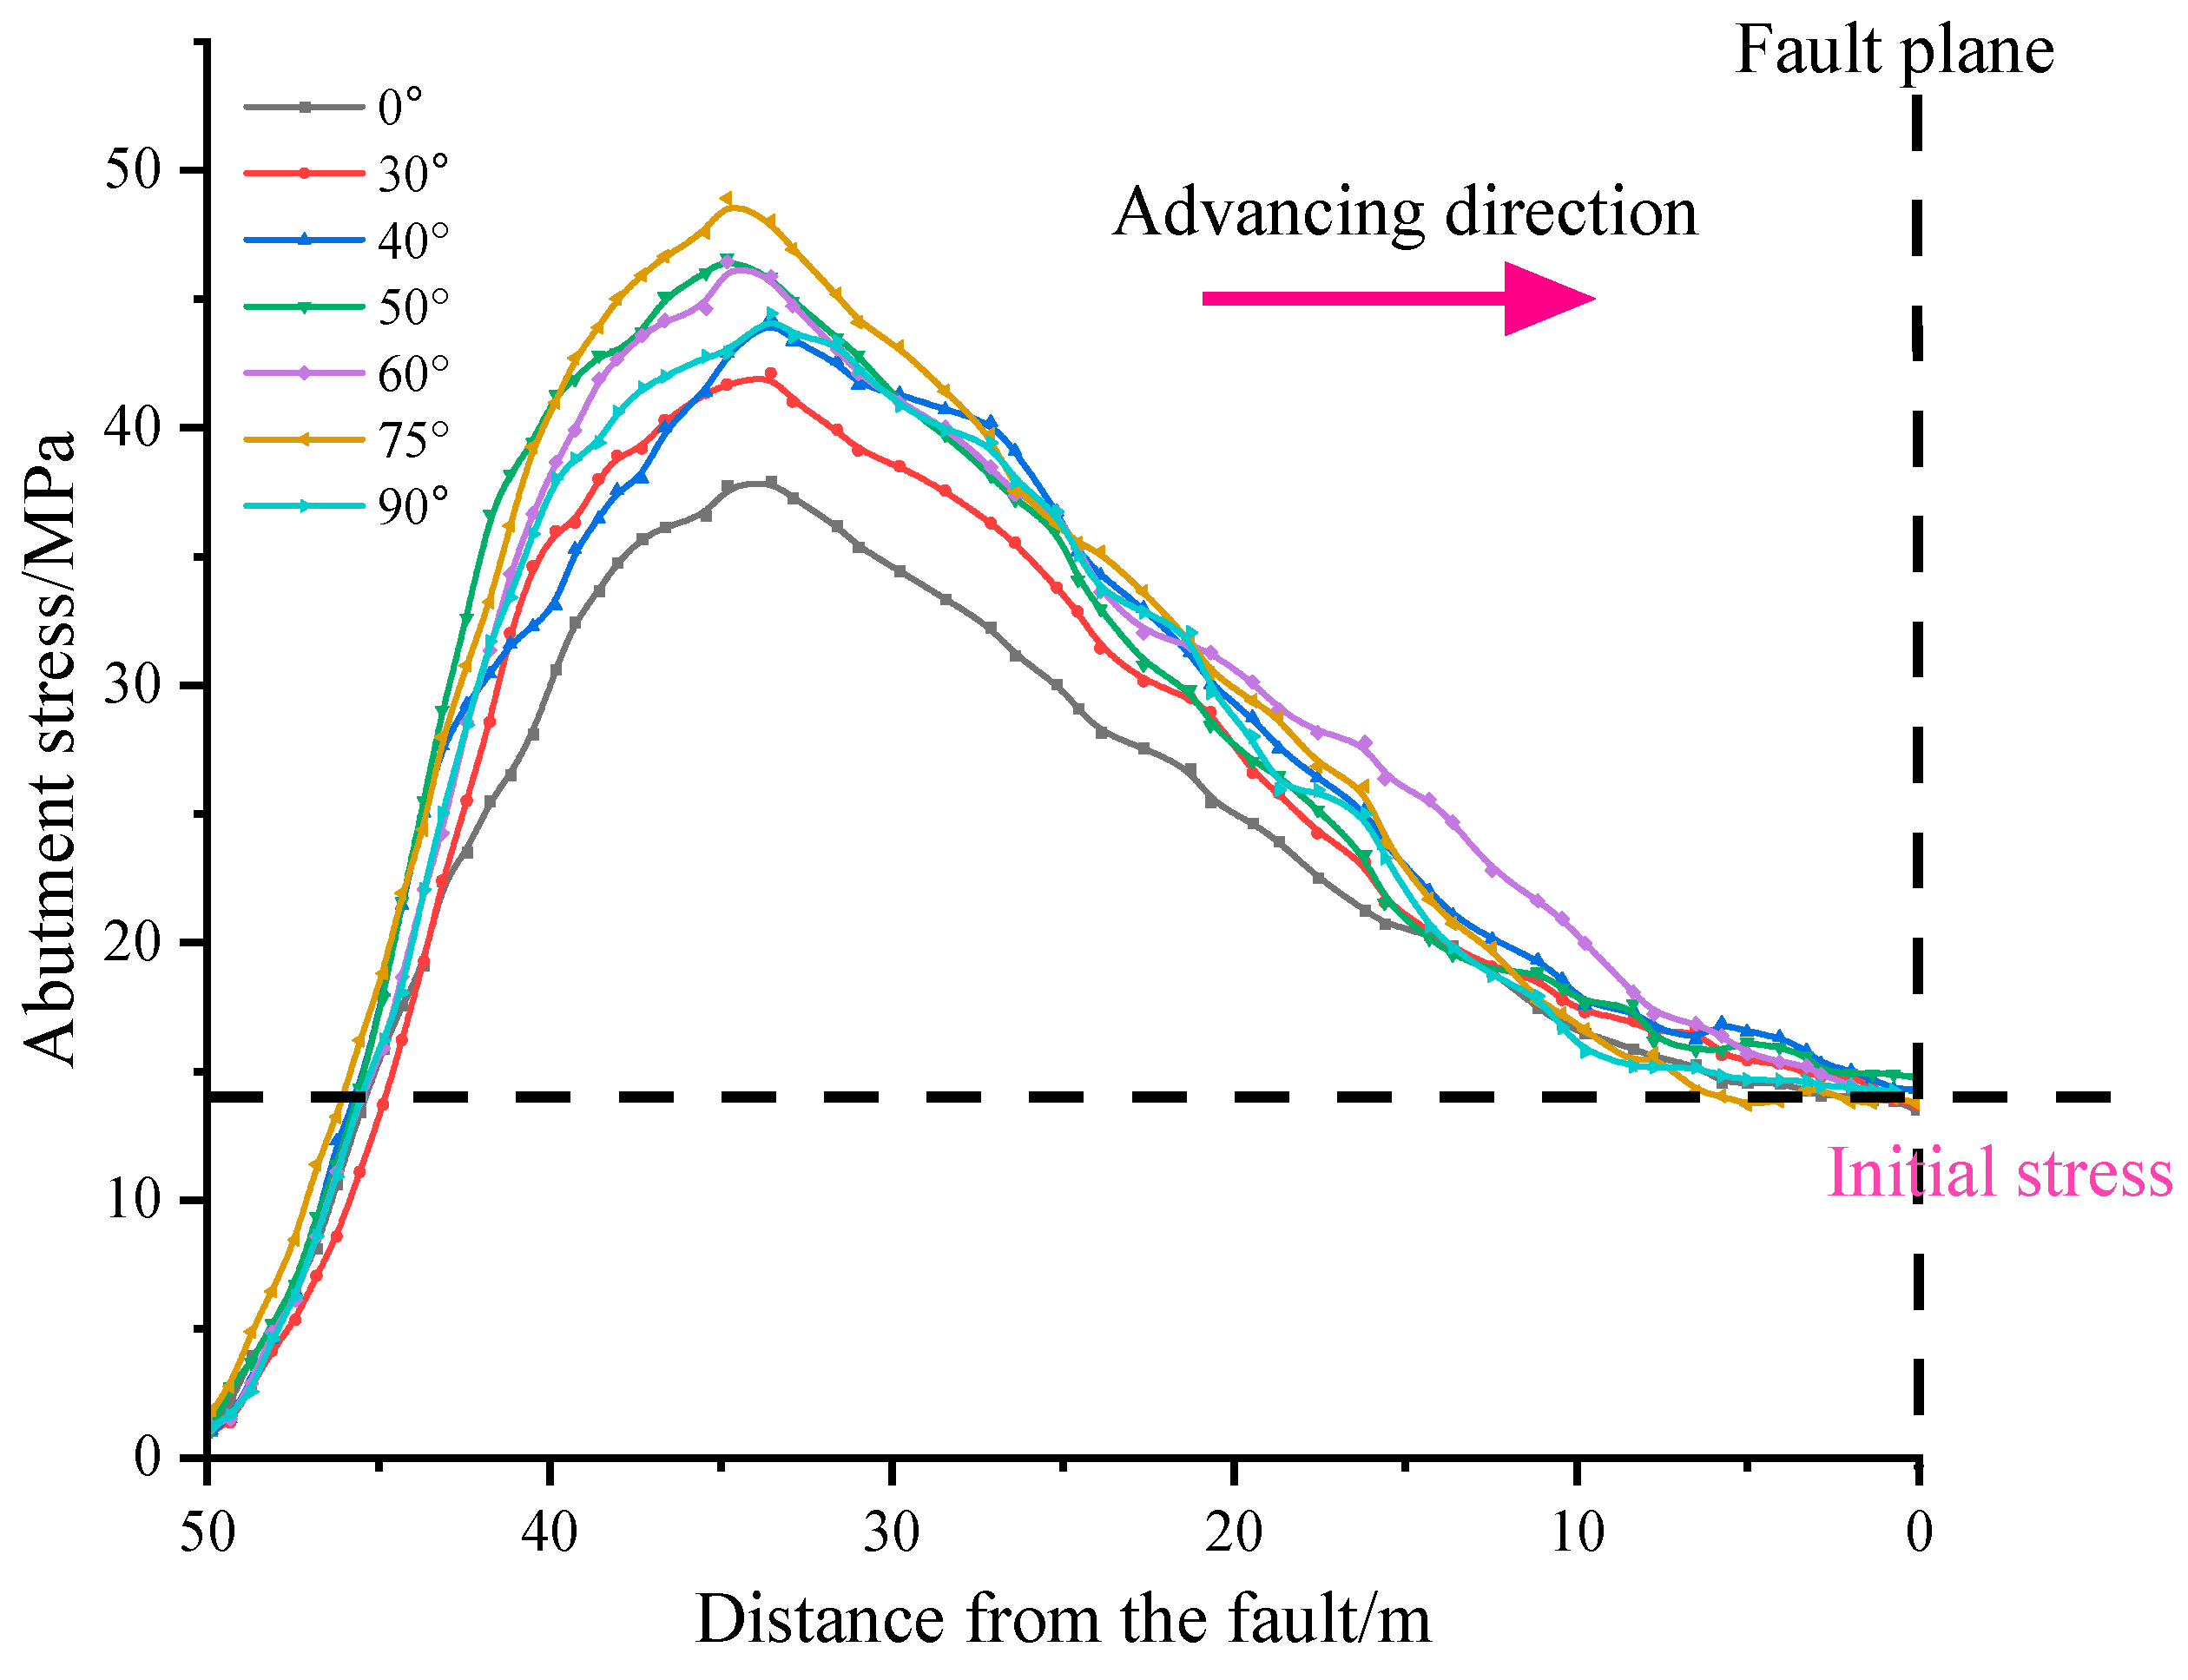
In order to obtain the stress distribution law of the surrounding rock under the coupling effect of mining disturbance and a fault at different dip angles, we conducted simulations for fault inclinations of 0°, 30°, 40°, 50°, 60°, 70°, and 80°. Moreover, the monitoring line was set at the 10 m position of the coal seam roof, with monitoring points spaced at 10 m intervals. The stress distribution of the surrounding rock at different positions in front of the coal wall was obtained when the working face was 50 m away from the fault (see Figure 12). Moreover, the stress variation trend of the surrounding rock for different fault angles was obtained. The variation laws of the stress peak value and stress concentration coefficient for different positions near the fault are shown in Figure 13 and Figure 14.
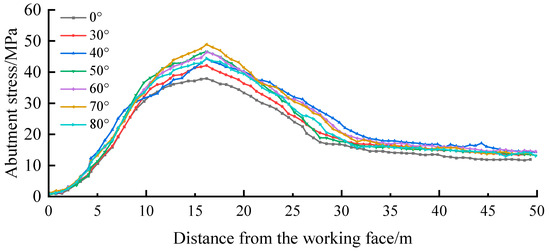
Figure 12.
Abutment stress in front of the working face for different fault dip angles.
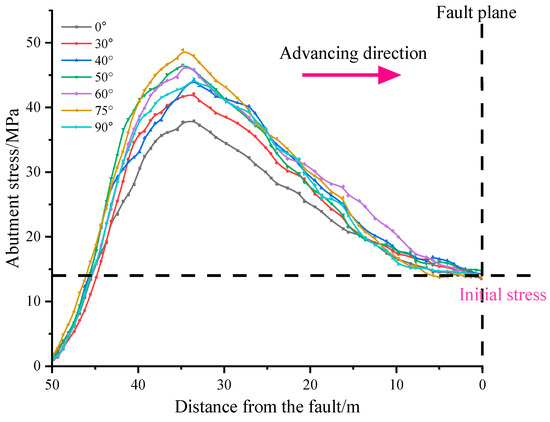
Figure 13.
Abutment stress at different positions from the fault for different fault dip angles.
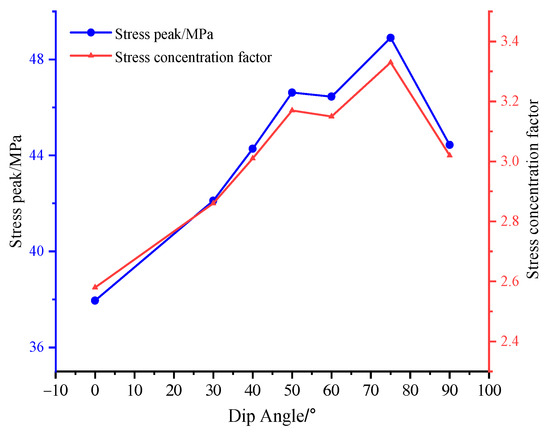
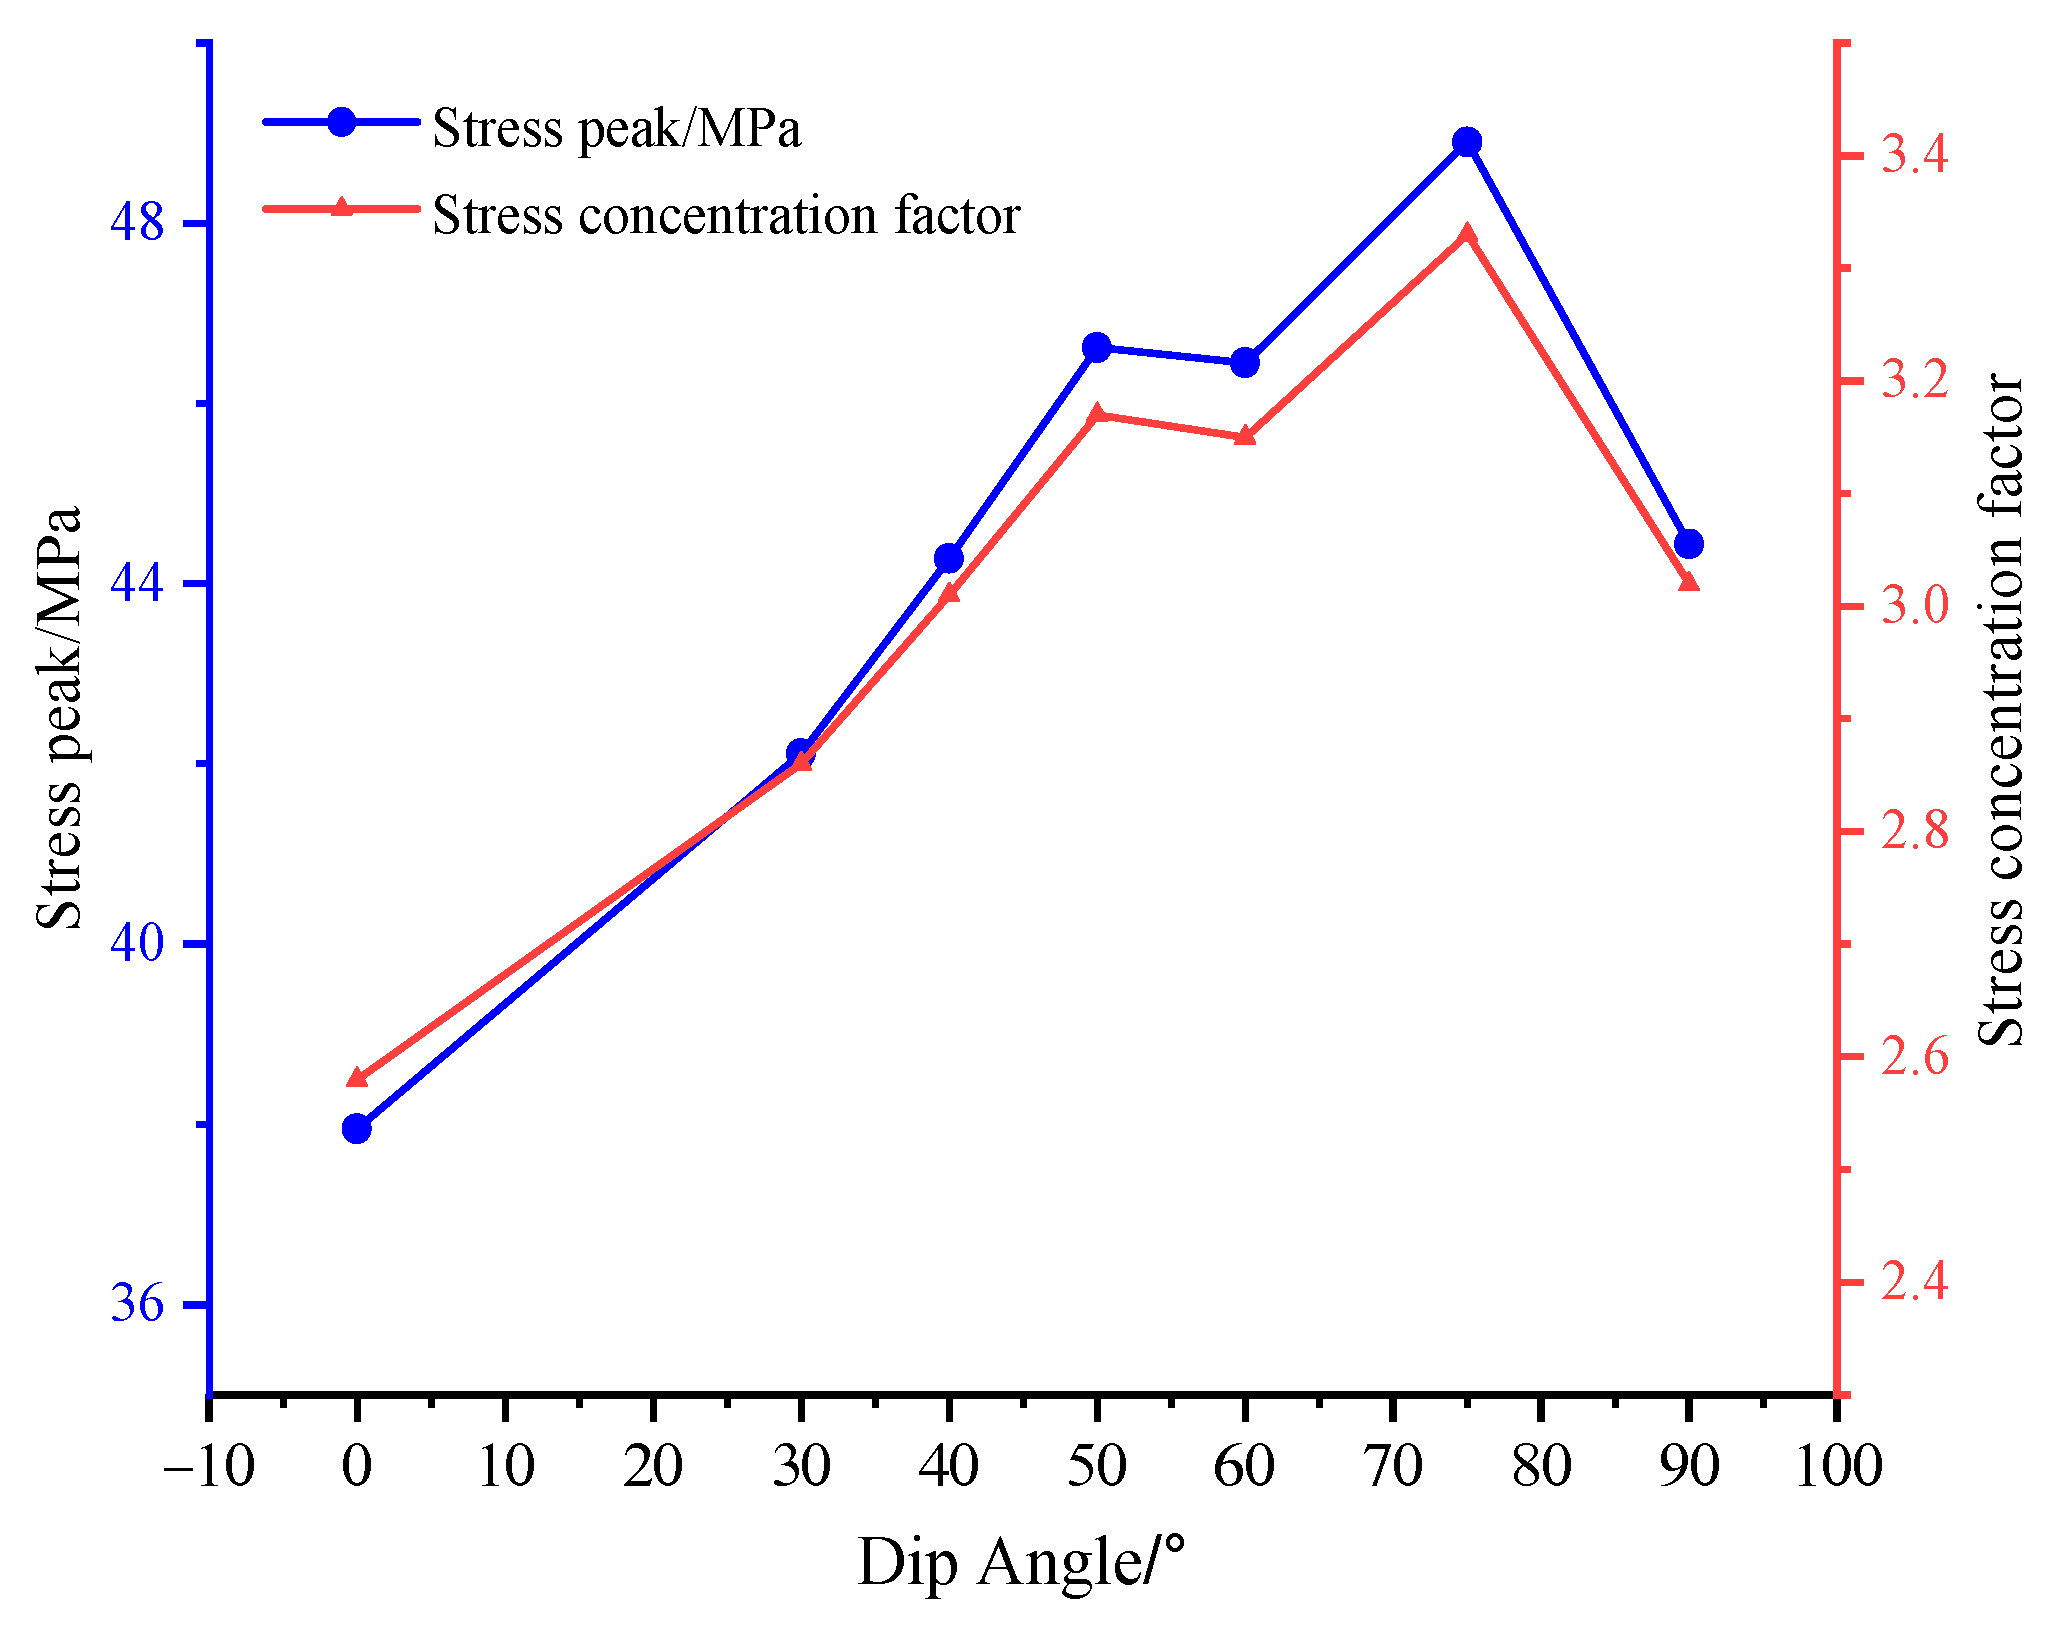
Figure 14.
Stress peak and stress concentration factor from the fault for different dip angles.
The following stress distribution law for different dip angles can be obtained from Figure 12, Figure 13 and Figure 14.
- (1)
- Figure 12 shows that peak stress occurs 12–17 m in front of the working face and is less affected by the fault dip angle. For different fault dip angles, the vertical stress near the fault plane is maintained at about 14.7 MPa, and the difference is small.
- (2)
- Figure 13 and Figure 14 show that the stress concentration coefficient and stress peak at different positions show a similar trend for different fault dip angles. With an increase in the dip angle, the stress concentration coefficient and stress peak first increase and then decrease. When the maximum dip angle is 75°, the stress concentration coefficient and peak stress values are 3.33 and 48.9 MPa, respectively. The simulation results show that the dip angle of the fault has an obvious effect on the tectonic stress of the fault.
4.2.3. Supporting Stress and Surrounding Rock Stress of the F16 Fault for Different Mining Thickness
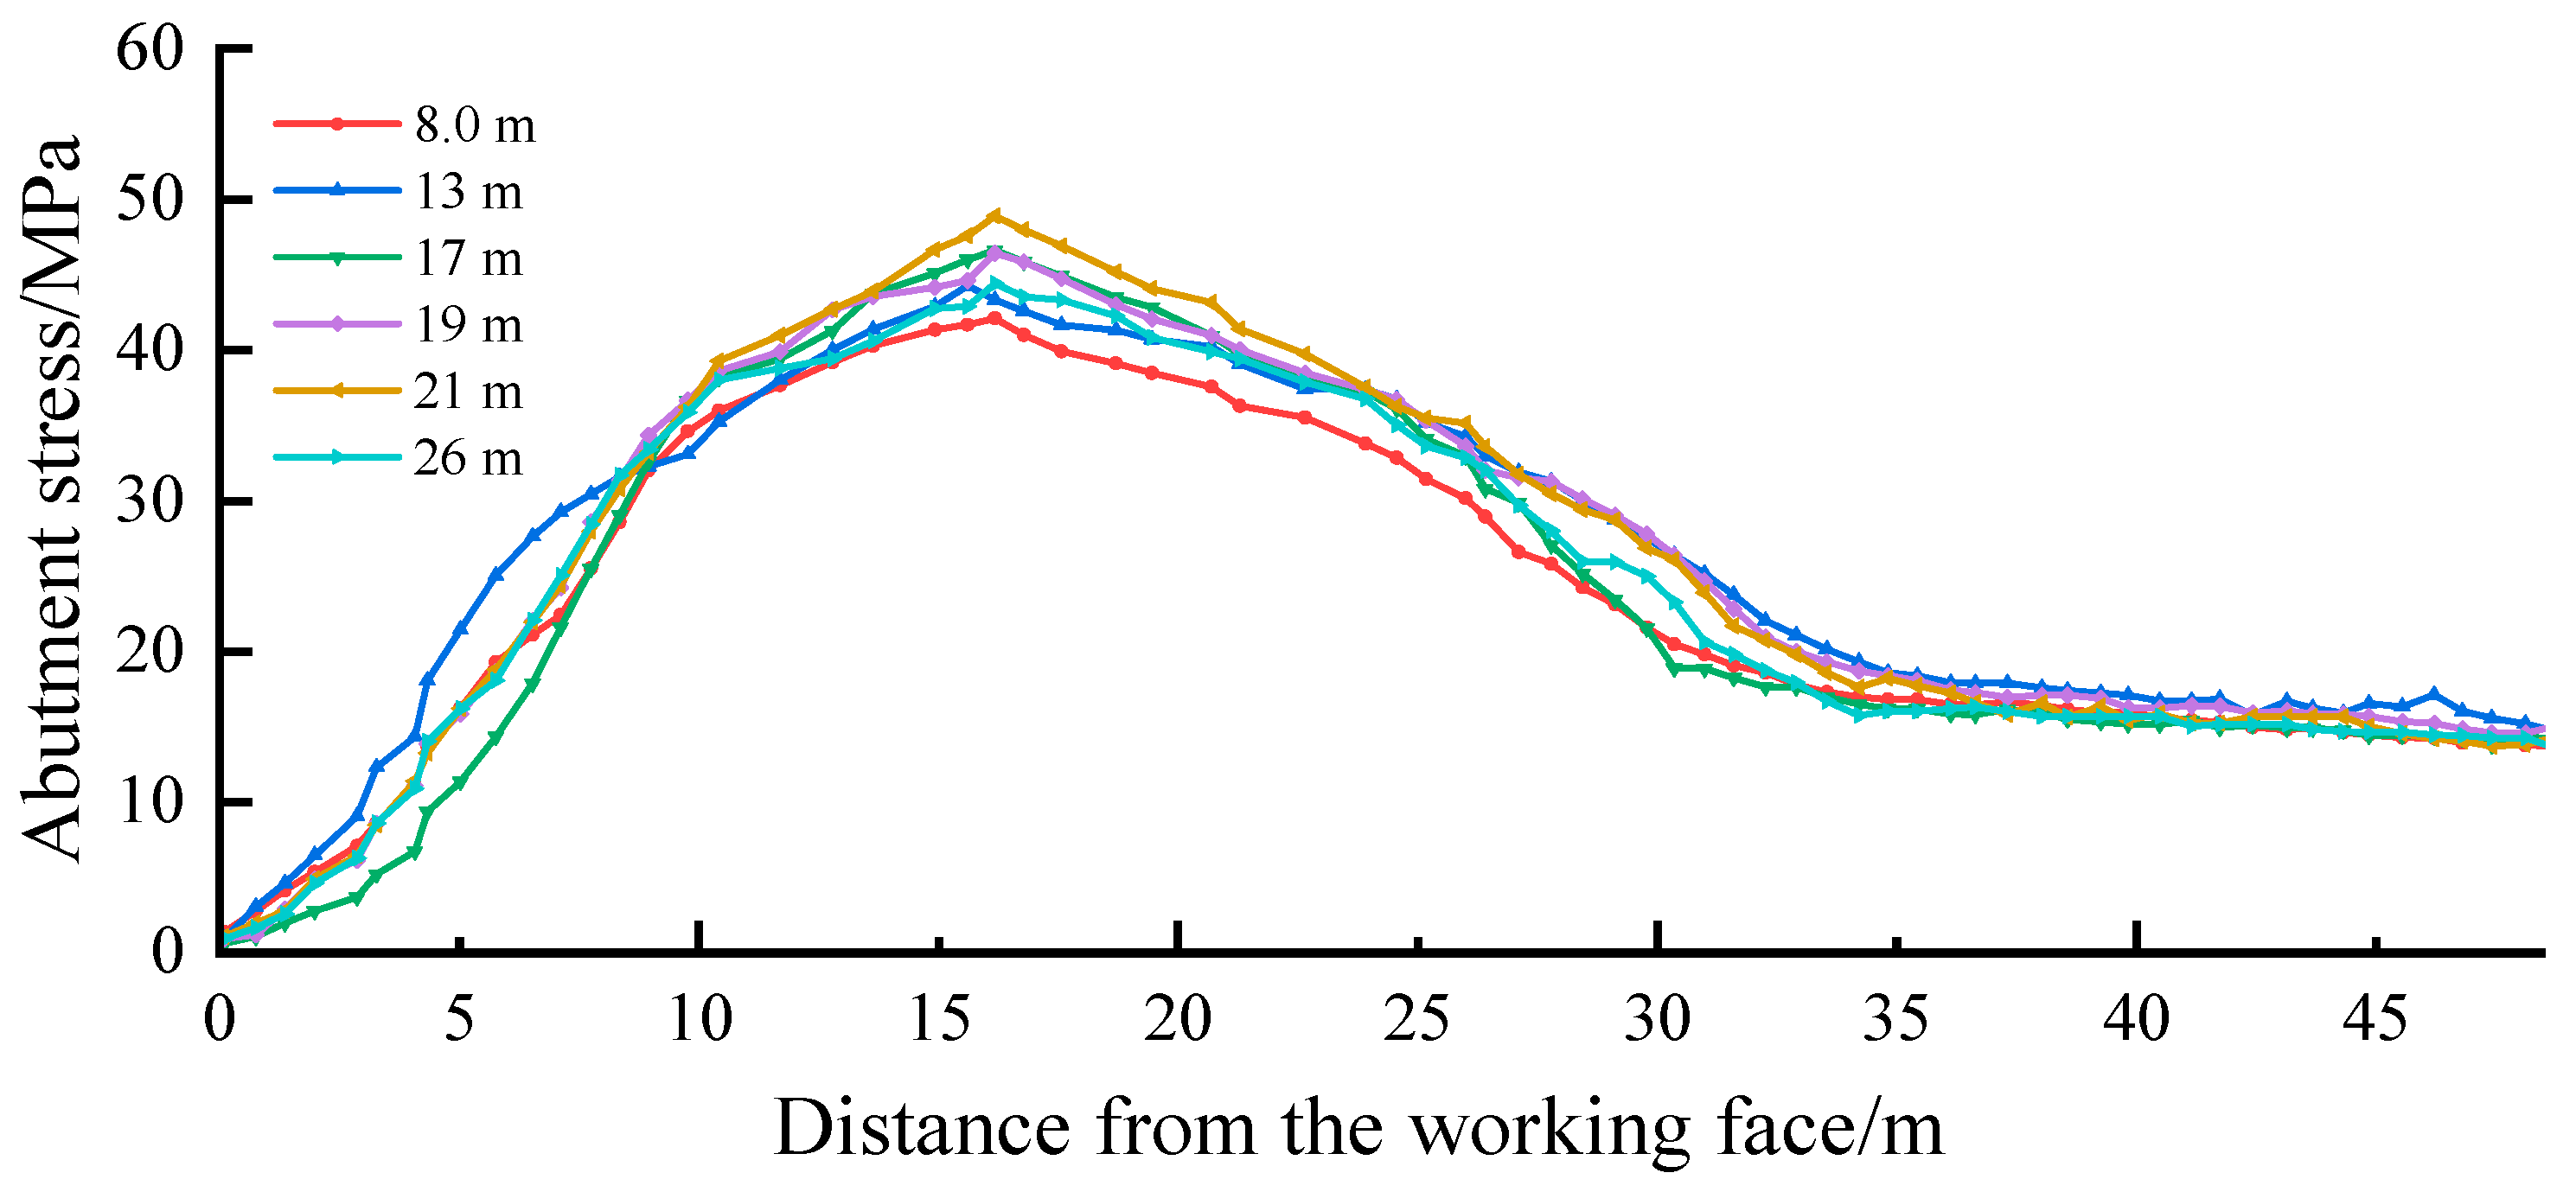
In order to study the influence of the coupled effect of mining disturbance and faults on the stress of the surrounding rock, we simulated stress distribution using mining thicknesses of 8 m, 13 m, 17 m, 19 m, 21 m, and 26 m (see Figure 15). The monitoring line was set at the 10 m position of the roof, with monitoring points spaced at 10 m intervals. The stress variation trend of the surrounding rock for different mining thicknesses was obtained. The variation laws of the stress peak and stress concentration coefficient for different positions near the fault are shown in Figure 16 and Figure 17.
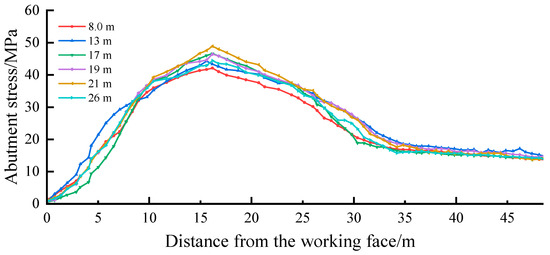
Figure 15.
Abutment stress in front of the working face for different thicknesses.
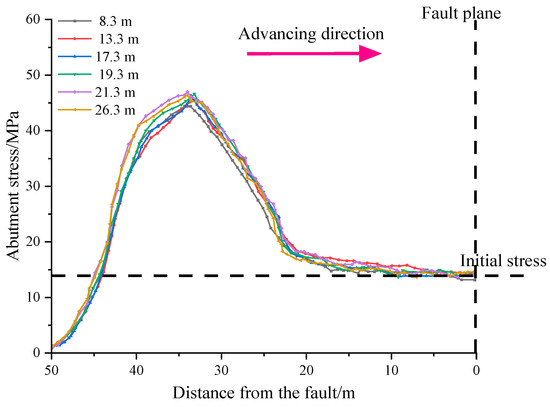
Figure 16.
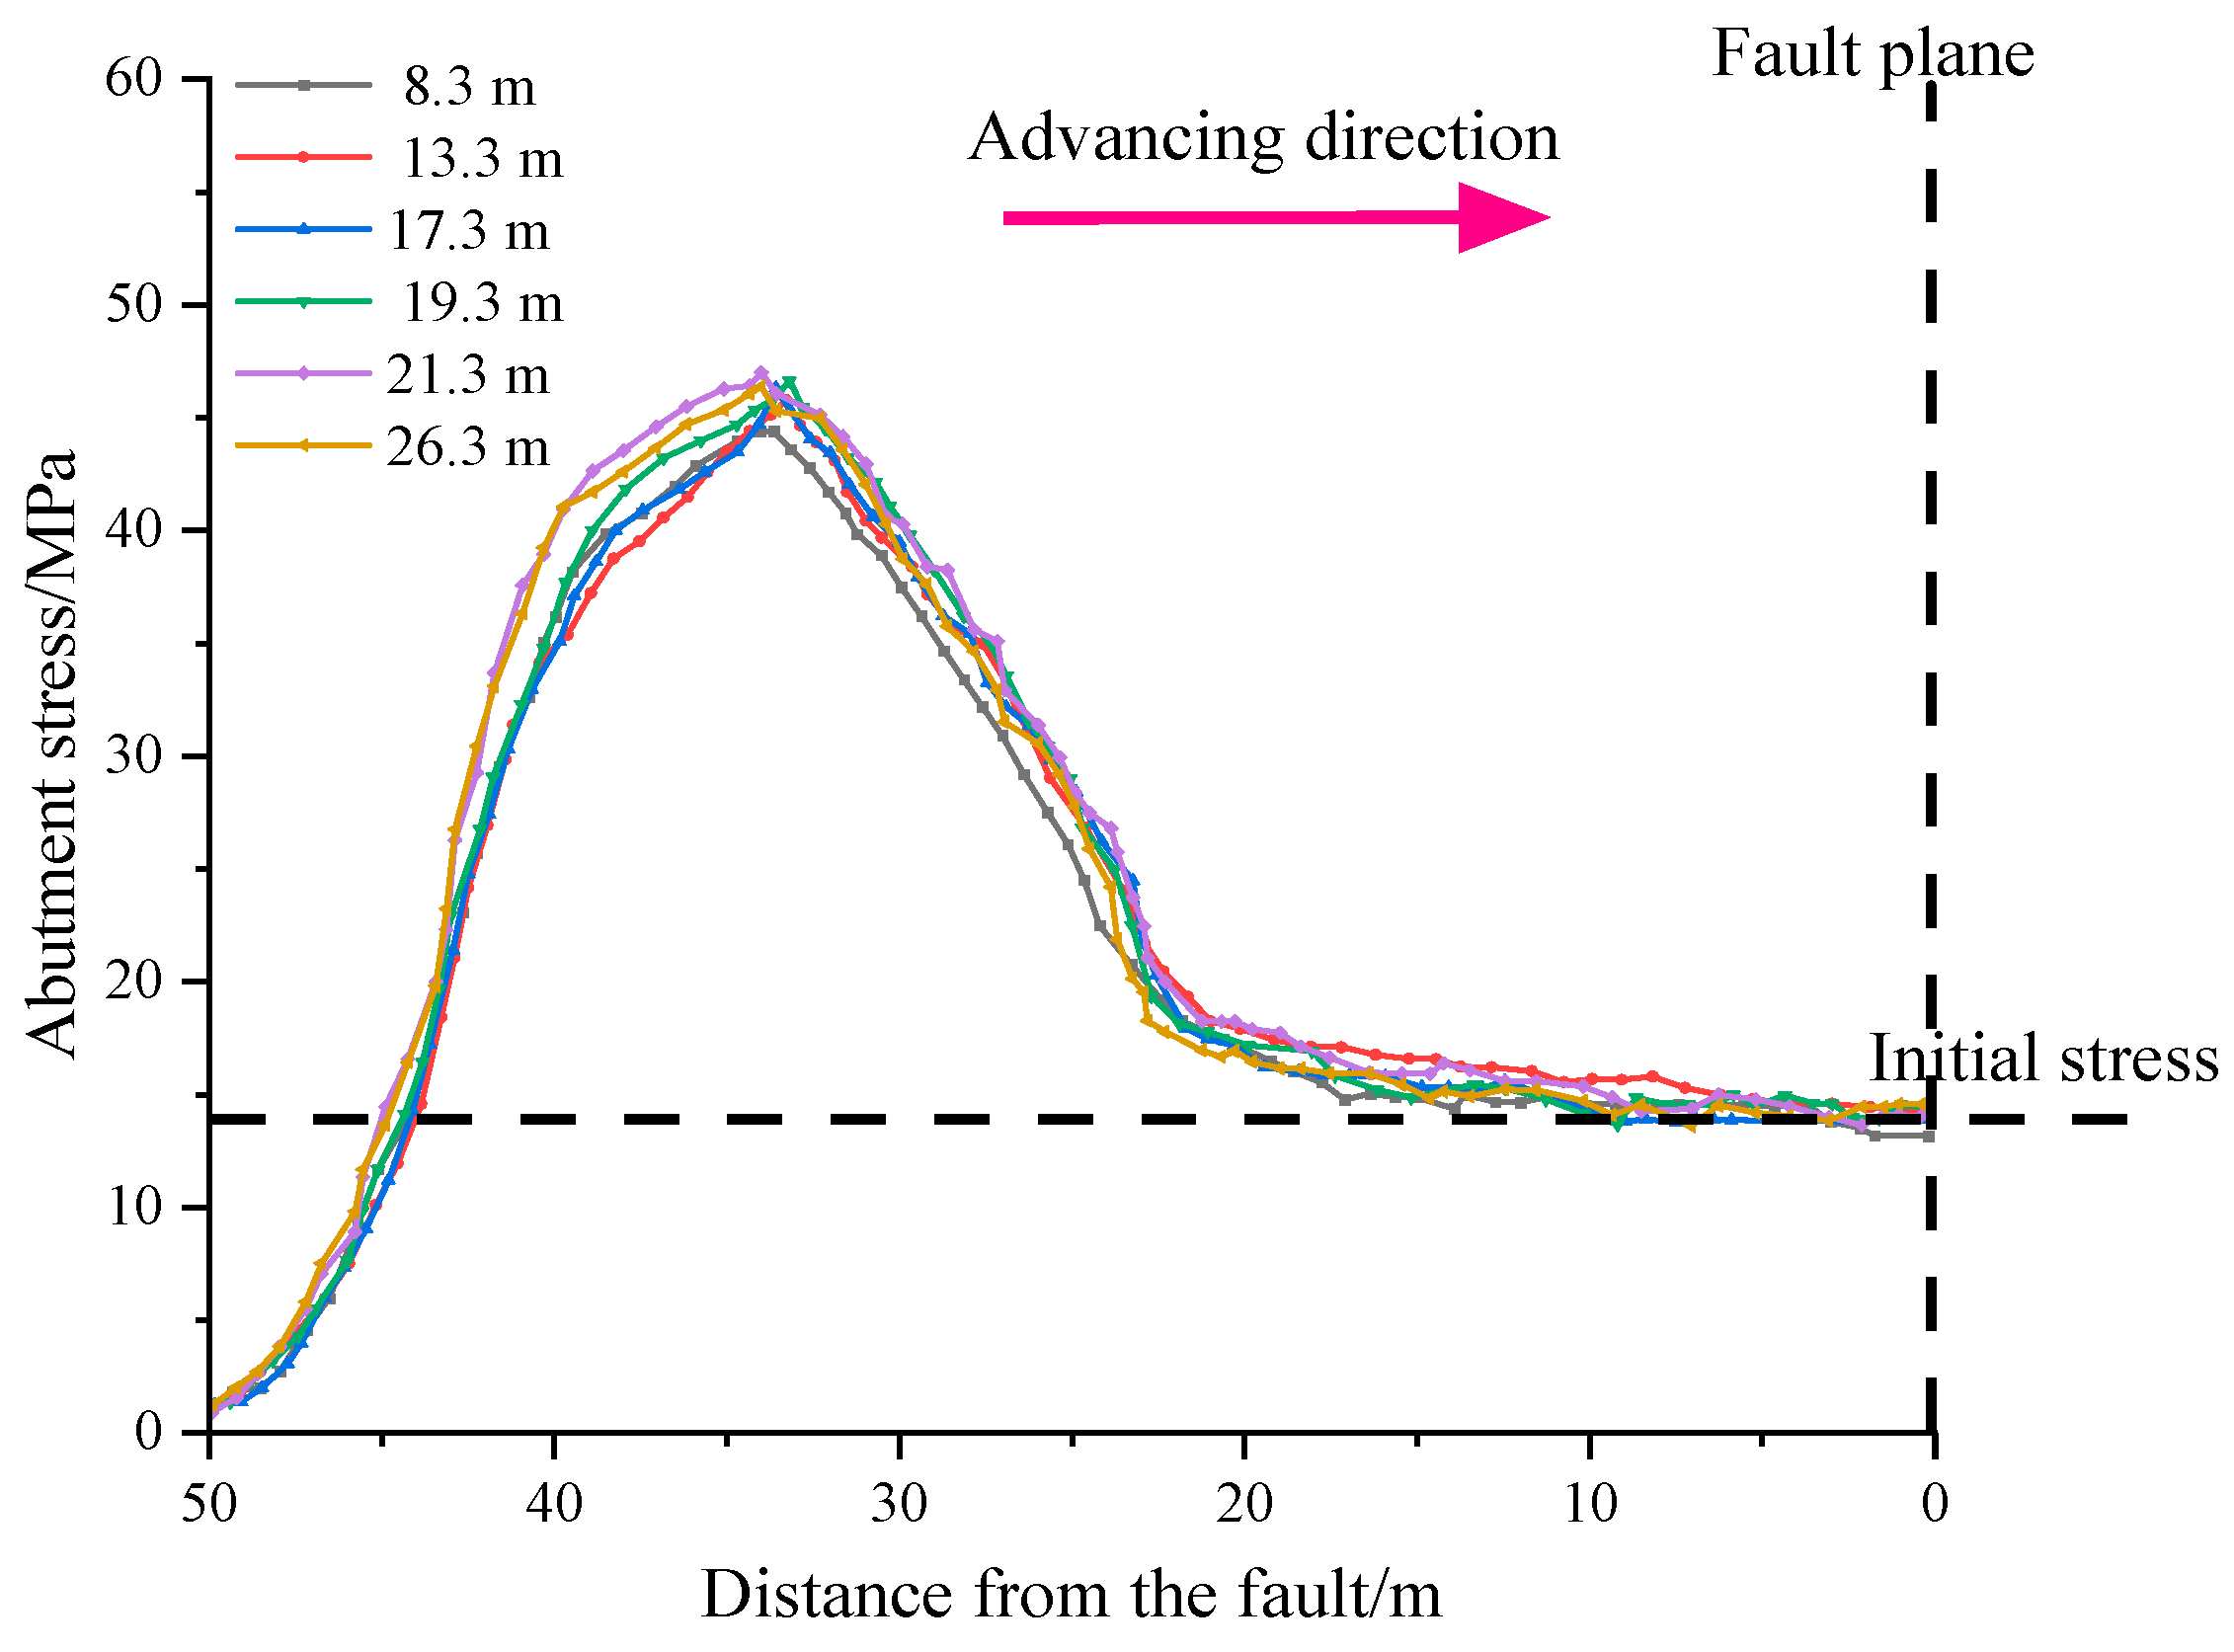
Abutment stress at different positions from the fault for different mining thicknesses.
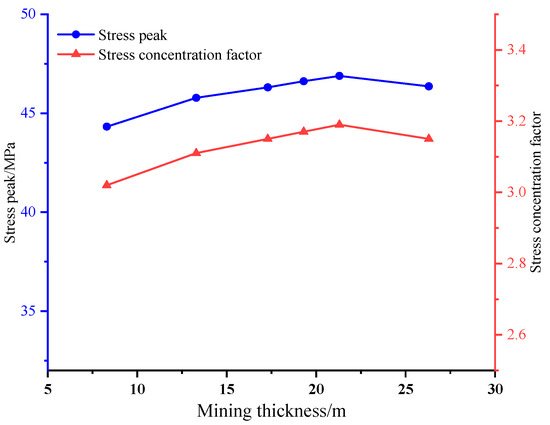
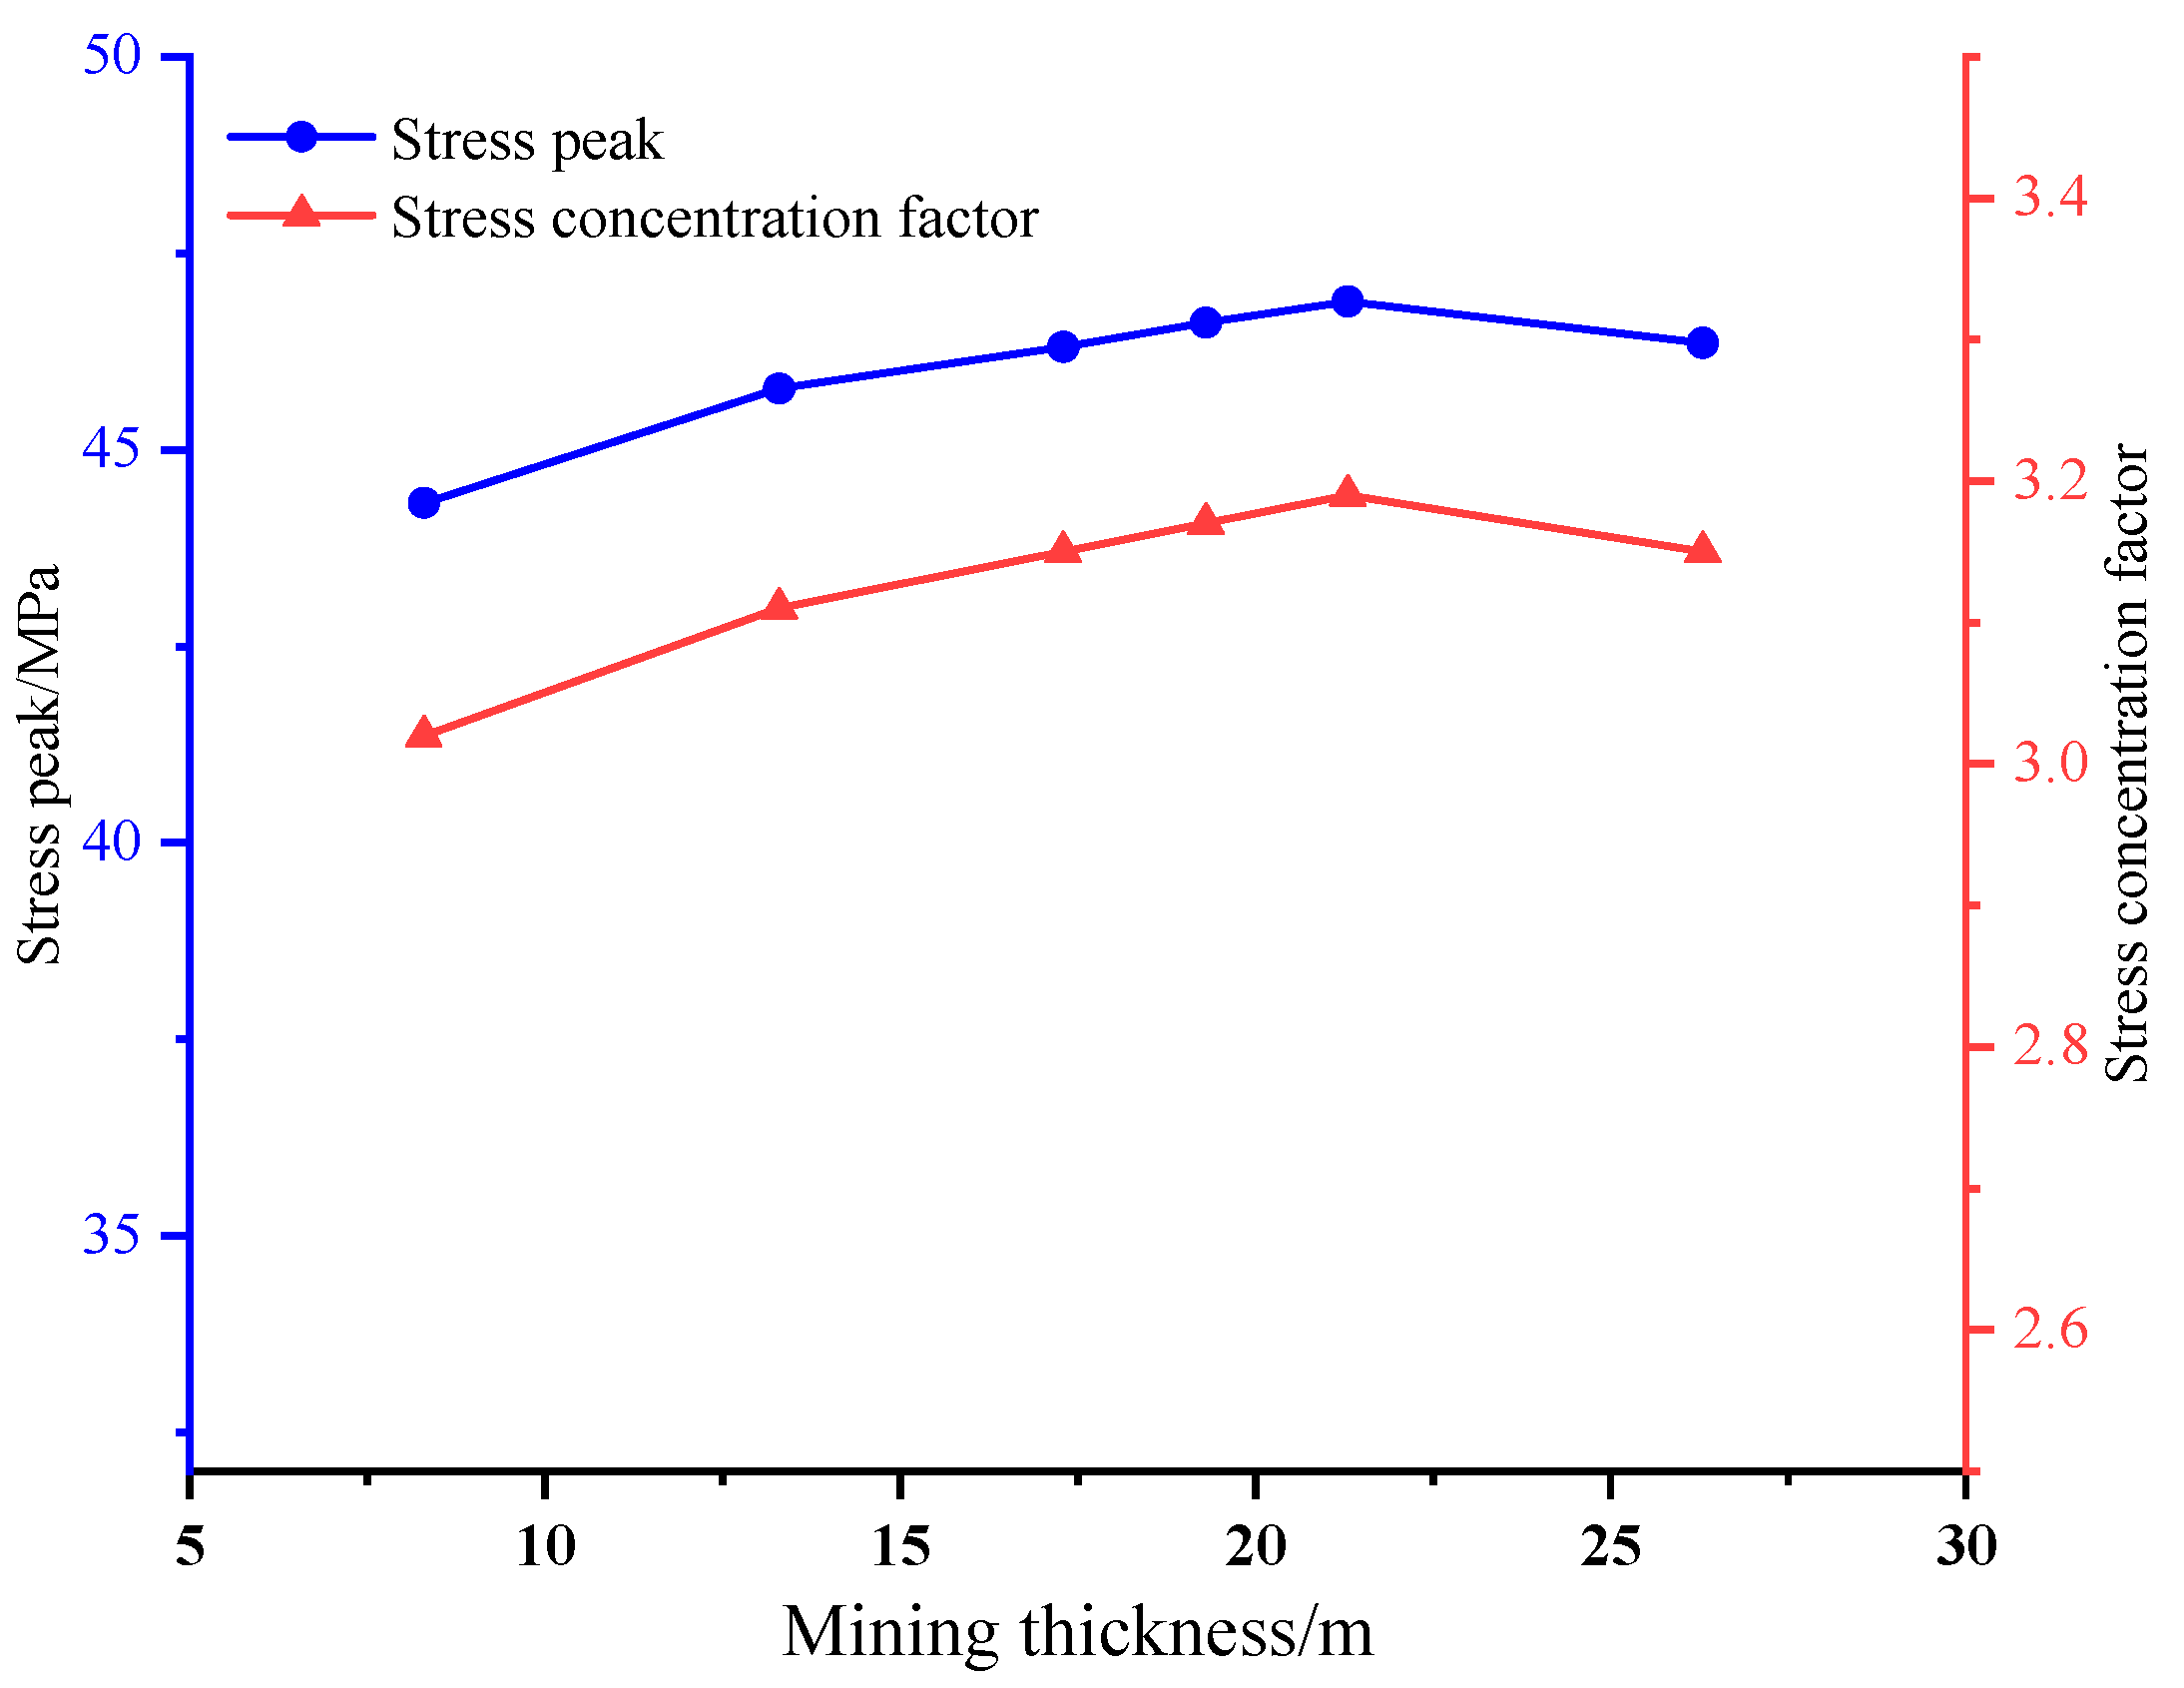
Figure 17.
Stress peak and stress concentration factor from the fault for different mining thicknesses.
The following stress distribution law for different mining thicknesses can be obtained from Figure 15, Figure 16 and Figure 17.
- (1)
- Figure 15 shows that peak stress occurs 12–17 m in front of the working face and is less affected by the mining thickness. For different mining thicknesses, the vertical stress near the fault plane is maintained at about 14 MPa, and the difference is small.
- (2)
- Figure 16 and Figure 17 show that the stress concentration coefficient and stress peak at different positions show a similar trend for different mining thicknesses. With an increase in mining thickness, the stress concentration coefficient and stress peak first increase and then decrease. When the maximum mining thickness is 21.3 m, the stress concentration coefficient and peak stress values are 3.19 and 46.89 MPa, respectively. When the minimum mining thickness is 8.3 m, the stress concentration coefficient and peak stress values are 3.01 and 44.32 MPa, respectively. The difference in the stress peak value is 2.57 MPa. Therefore, the simulation results show that mining thickness significantly affects the tectonic stress of a fault.
5. Case Study
5.1. The Law of Shock Instability in the Working Face under the Influence of “Fault Structure”
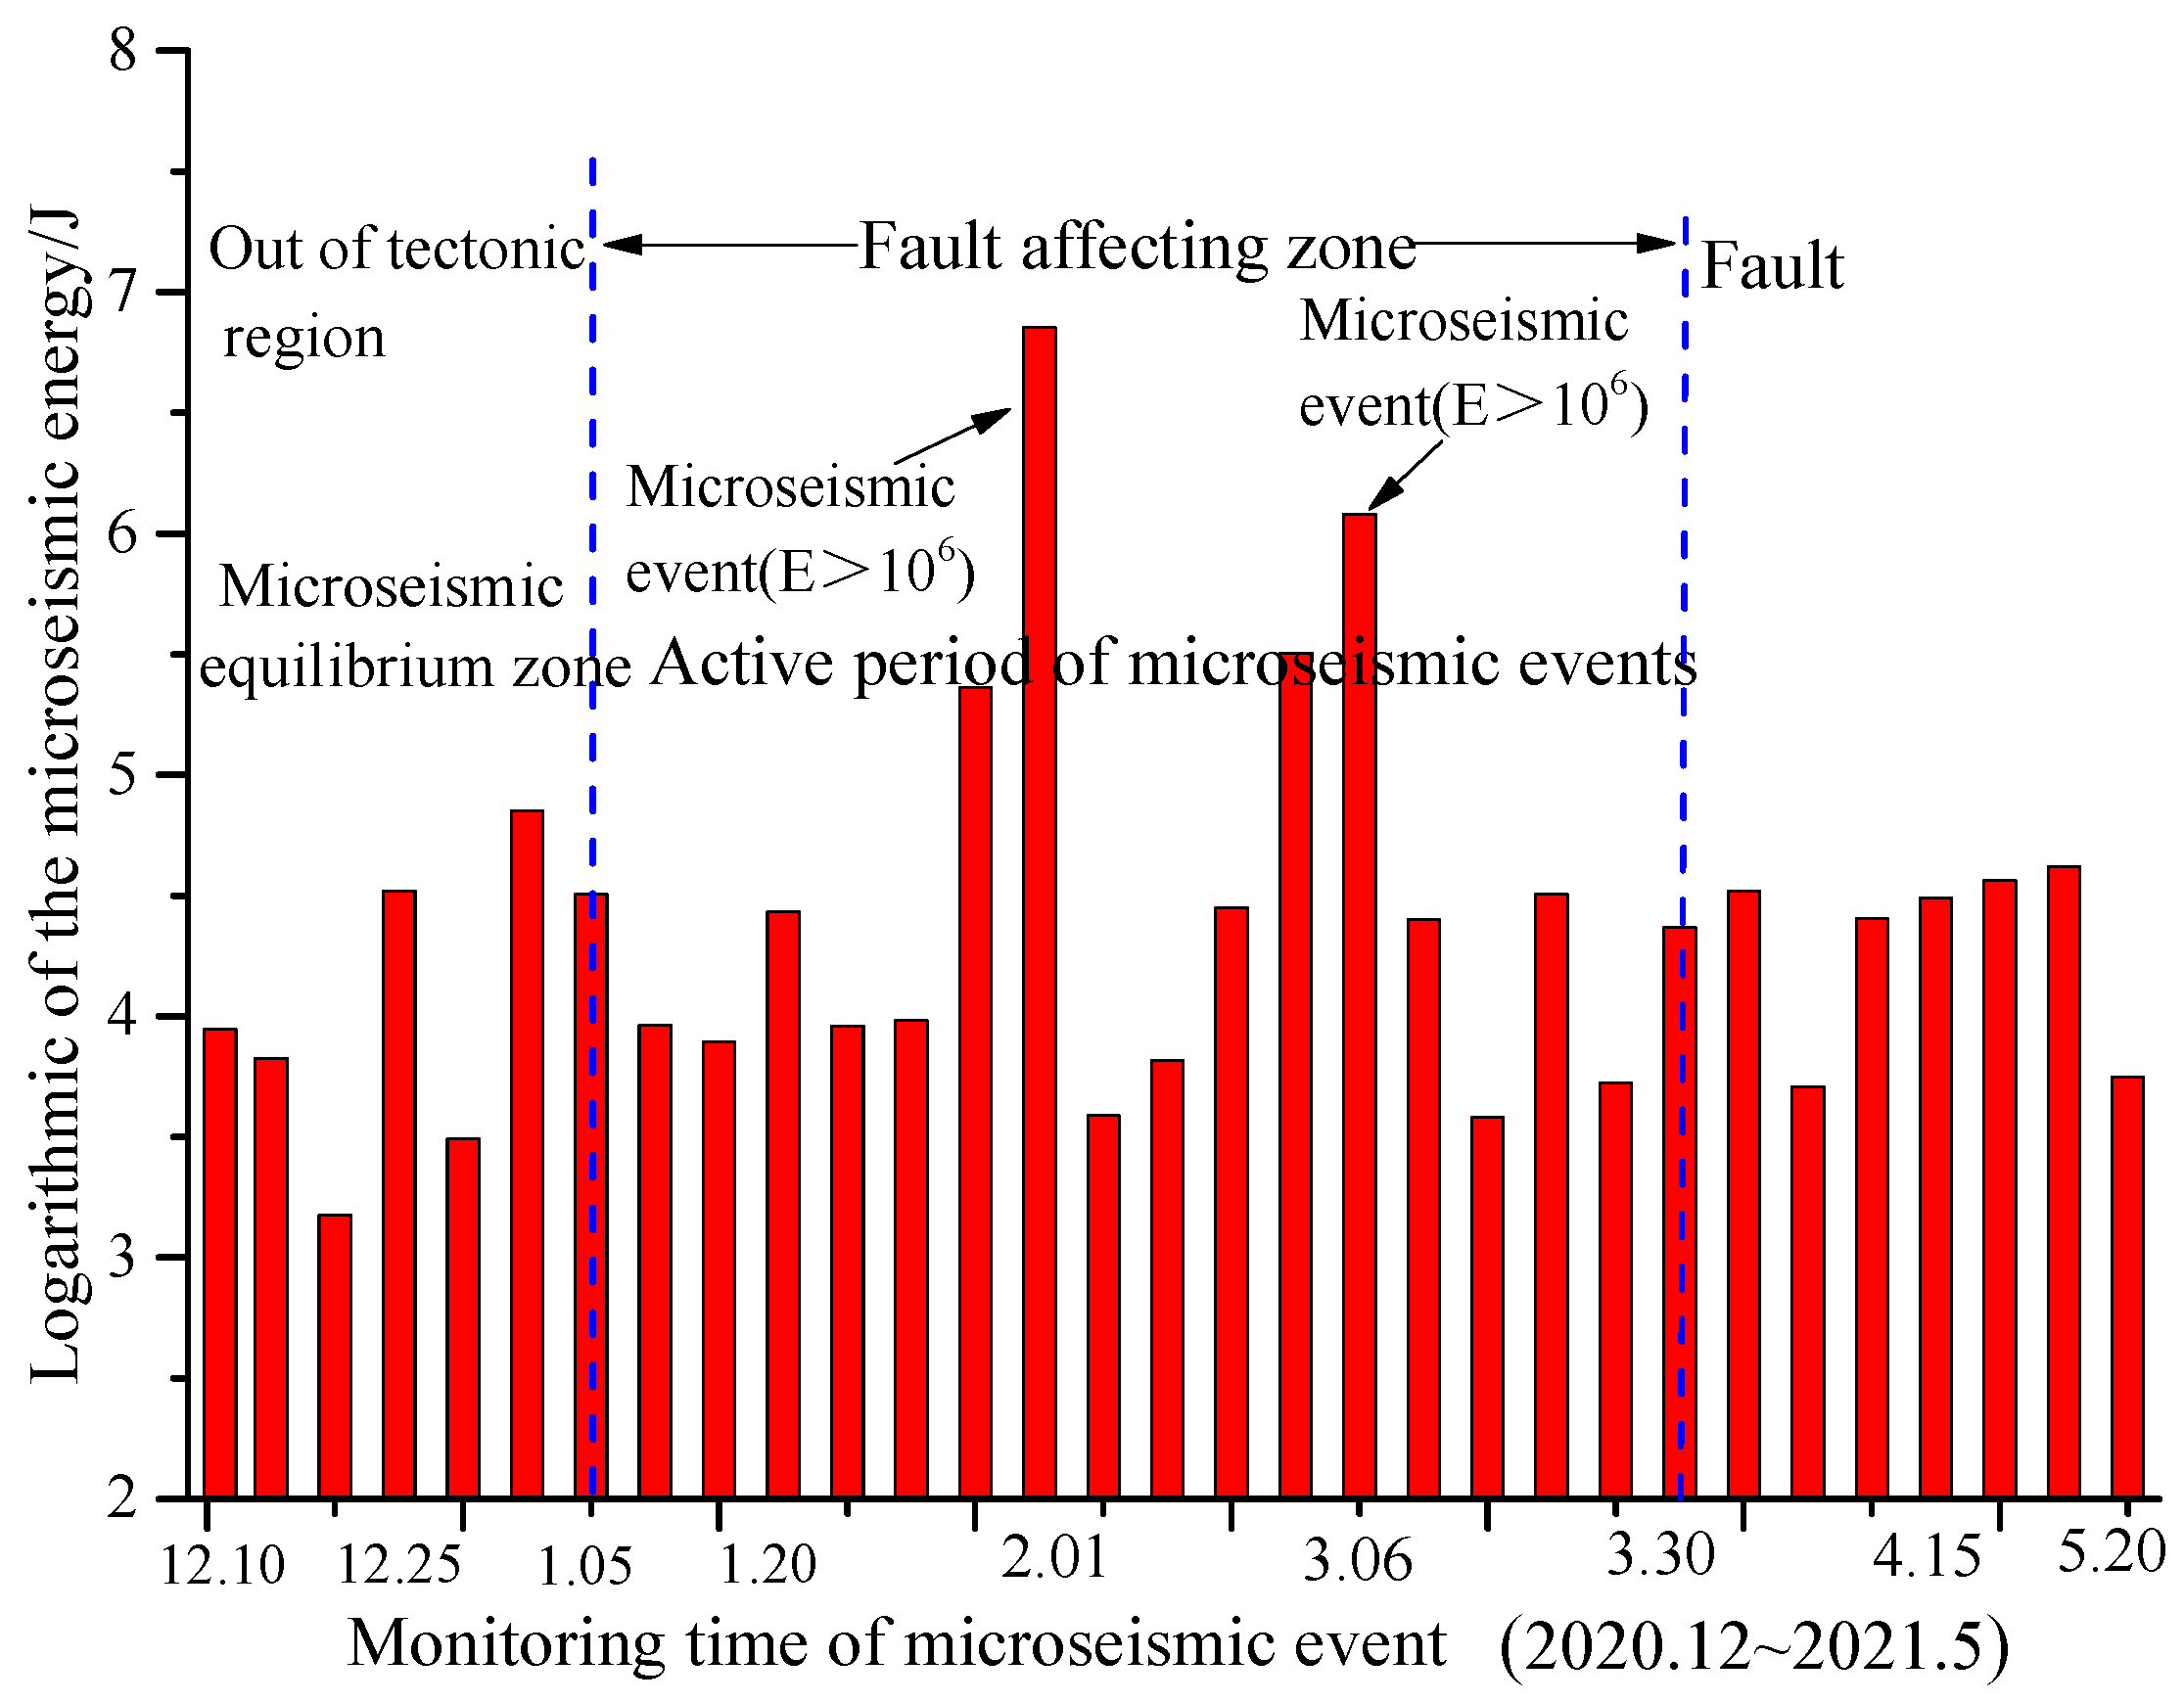
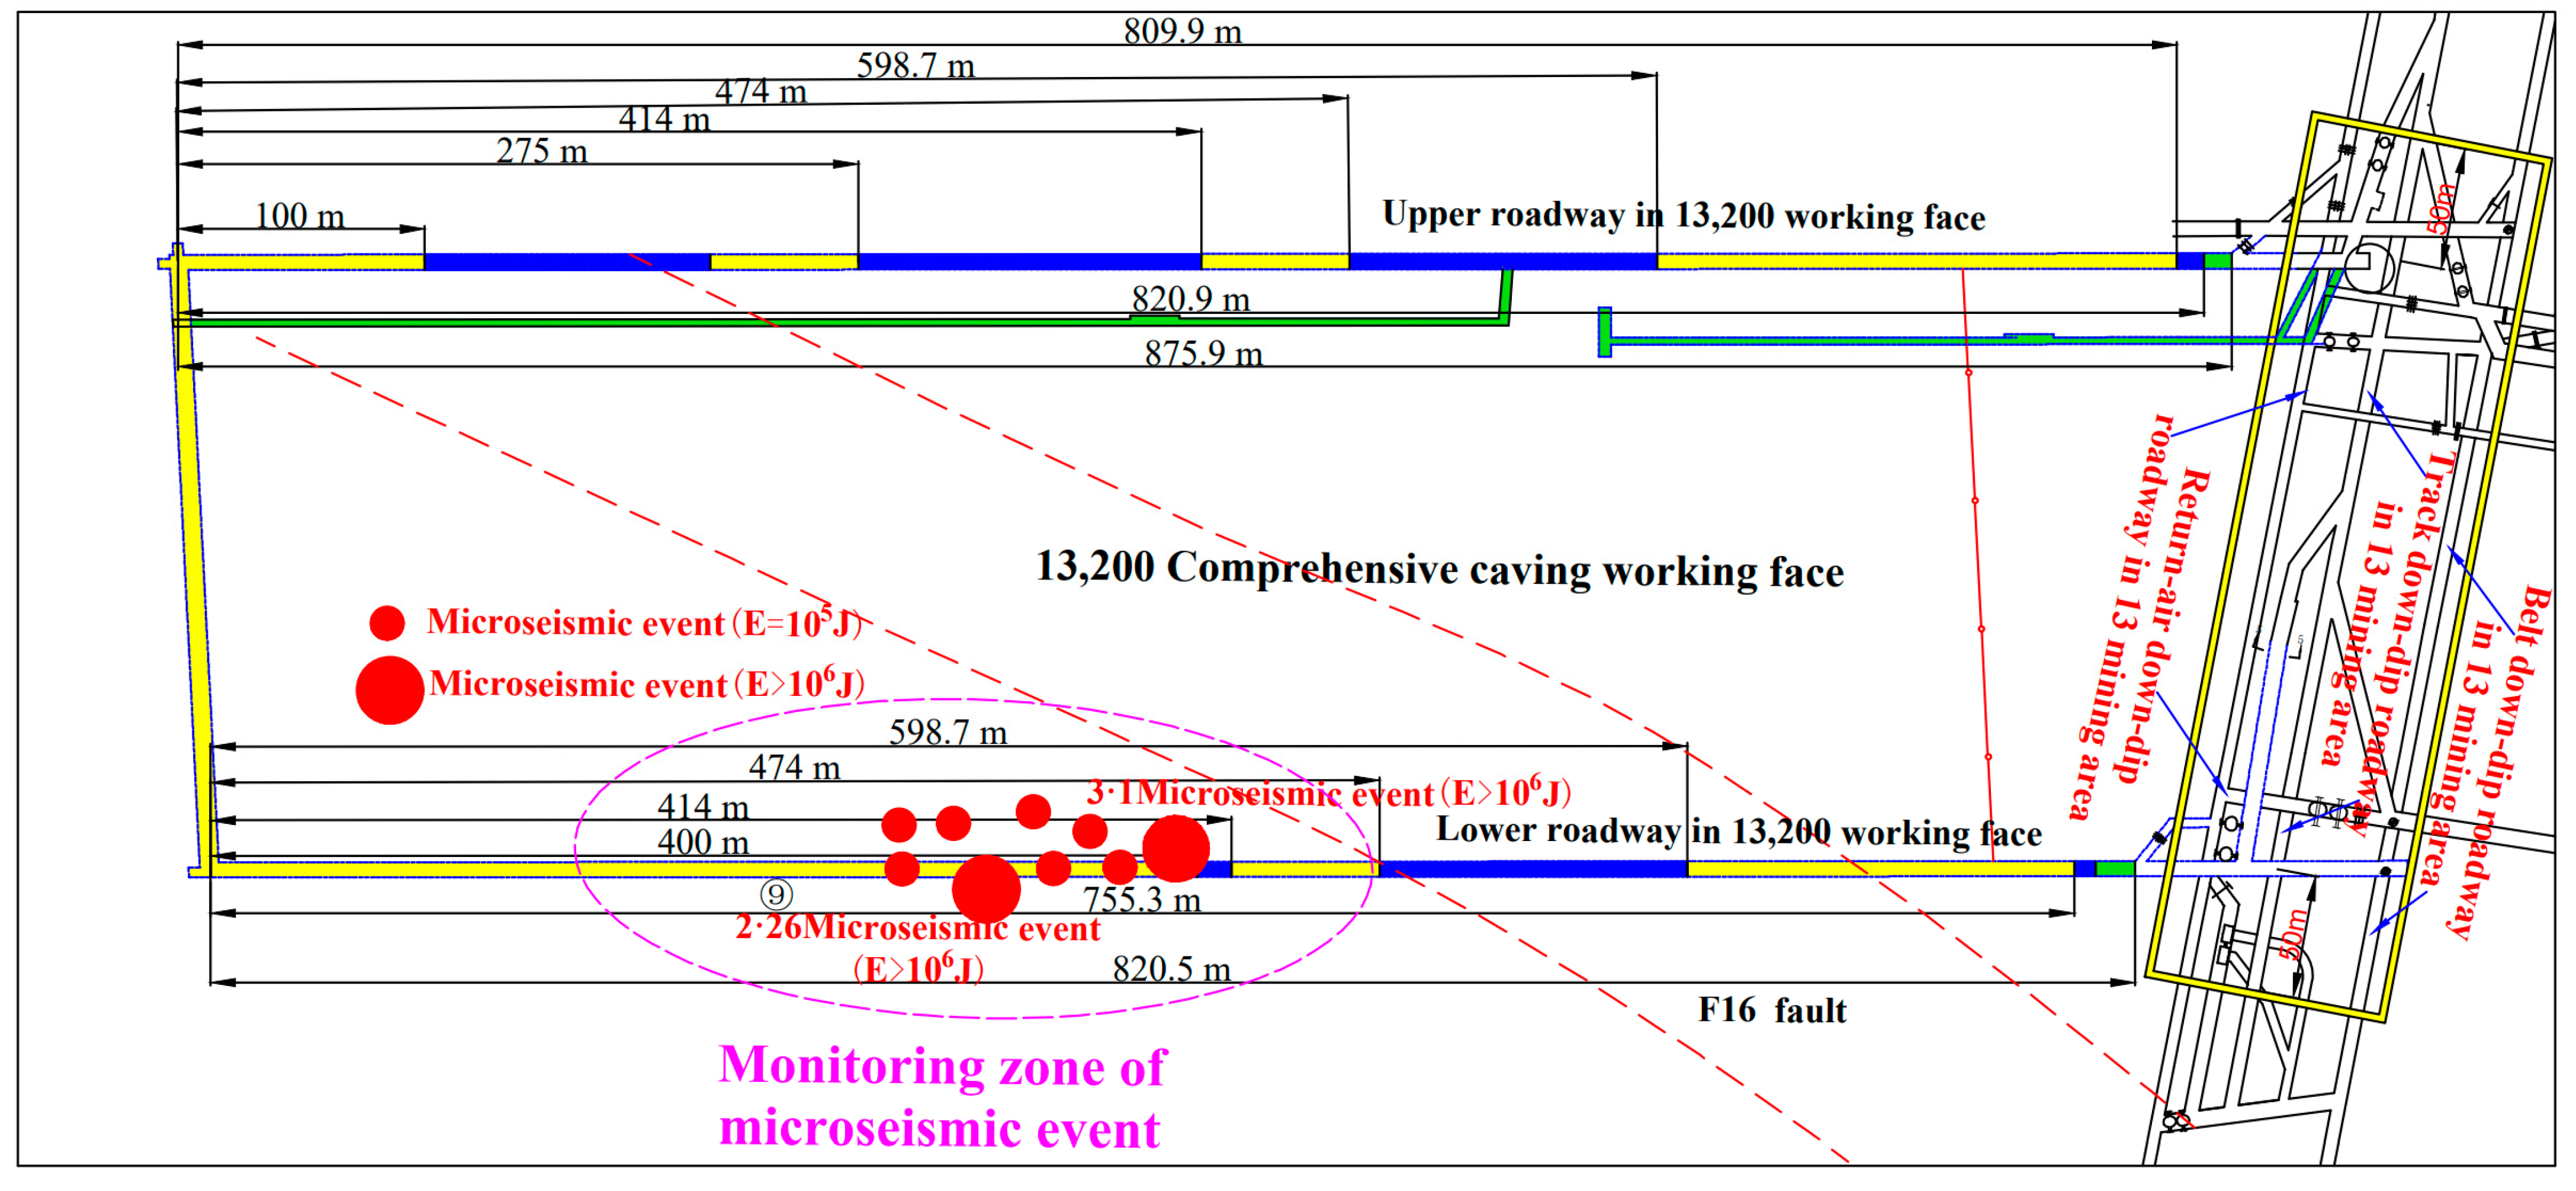
Microseismic events in front of the “fault” tectonic area were counted to further verify the mechanisms of rock burst for extra-thick coal influenced by a large conglomerate and a thrust fault. Microseismic events are defined as high-energy events when E > 106 J; conversely, microseismic events are defined as low-energy events when E ≤ 106 J.
Two high-energy events occurred on 1 February and 6 March 2021, accompanied by a large number of microseismic events (E = 105) in their vicinity, indicating that the highly static coal body in the structural area is significantly influenced by mining disturbance.
The spatio-temporal relationship between the distribution of microseismic events and the advancement of the working face shows that the tectonic influence area is 0–80 m in front of the fault, with microseismic events being more active in this area (Figure 18 and Figure 19). High-energy microseismic events frequently occur 30–60 m in front of the fault. The non-affected area of the fault structure is more than 80 m away from the fault, representing the balance area of microseismic events. The influence range of the fault structure is consistent with the above theoretical calculation and numerical simulation results. There are many factors affecting rock bursts. In this paper, the influences of fault dip, seam thickness, and mining disturbance on rock burst are mainly considered. It is necessary to comprehensively and thoroughly study the correlation between more relevant data on in-situ mine pressure manifestation and rockburst occurrence. In future investigations, deep learning theories will be used to analyze comprehensive field data, such as overburden movement, surface subsidence, support pressure, displacement, and microseismic events, and their correlations will be clarified. The probability of rock bursts will be predicted, thus providing guidance for the prevention and control of rock bursts.
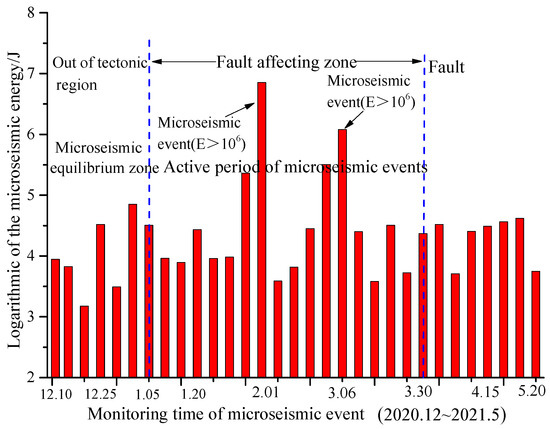
Figure 18.
Field microseismic events near faults at different times.
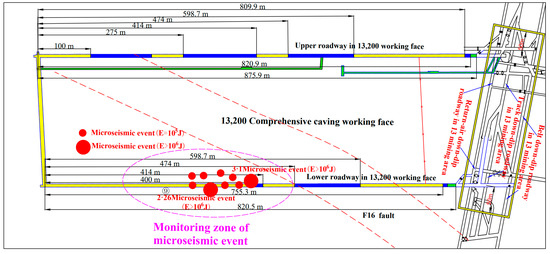
Figure 19.
Impact dangerous area in 13,200 fully mechanized caving face.
5.2. Prevention and Control of Rock Burst under the Influence of “Fault” Structure
The mechanism of rock bursts in a fault tectonic area involves abutment pressure and tectonic stress, resulting in the formation of high static load stress. When high static loads exceed the critical stress, the energy accumulated in the coal body is released in a nonlinear manner. When a roadway with a high static load is disturbed by mining activities, the superimposed load on the coal body far exceeds the critical stress. The rock burst risk source area is larger, and the microseismical activity is more intense. Moreover, the impact and microseismic events of the roadway are concentrated in areas with high structural stress. Therefore, the prevention and control of roadway rock bursts in “fault” structural areas can be carried out considering two aspects. On the one hand, the static load stress of coal should be decreased. Pressure relief measures, such as large-diameter drilling and blasting, should be adopted to reduce the concentration of structural stress. On the other hand, efforts should be made to reduce or avoid dynamic load disturbances in structural areas of roadways. In the process of coal mining, increasing the width of coal pillars can isolate mining faces from the structural areas of roadways. This can extend the propagation path of dynamic load stress waves. Thus, the influence of disturbed dynamic loads on the surrounding rock of roadways can be decreased or avoided.
6. Conclusions
The following conclusions can be drawn:
- (1)
- In this paper, a mechanical model of structural stress increment for a thrust fault is established and solved. The results show that the stress distribution around the fault is significantly influenced by the depth of coal, the stress concentration coefficient of the stope, the lateral pressure coefficient, and the fault dip angle. The fault tectonic stress field in the Gengcun coal mine is asymmetrically distributed under the ground stress and dip angle of the fault. The shear stress increment range in the footwall of the fault is larger than that in the hanging wall. The shear stress in the hanging wall is greater than that in the footwall, and the impact risk is higher.
- (2)
- A 3D numerical simulation method is used to reveal the distribution law of the bearing stress in front of the working face during mining. The results show that stress concentration is likely to occur in front of the working face under mining disturbance. The stress distribution is relatively regular, and the peak stress is generally located 13–17 m in front of the working face. The stress peak value is greater than 35 MPa, and the stress concentration coefficient is greater than 2.42. Due to the thick and hard rock layer in the upper part of the mining area, a large overhanging roof and stress concentration occur at the back of the goaf.
- (3)
- The stress peak value and stress concentration coefficient vary for different distances from the fault. As the working face is excavated and approaches the fault-affected area, the stress first increases and then decreases. The peak stress and maximum stress concentration coefficient values are 46.62 MPa and 3.17, respectively, at a 50 m distance from the working face. Under the influence of mining disturbance, an 80 m distance from the fault is the dividing line between the fault non-affected area and the fault-affected area.
- (4)
- The fault dip angle and mining thickness have significant influences on the structure around the fault. With an increase in the dip angle, the maximum vertical stress and peak stress first increase and then decrease. For a maximum angle of 75°, the stress concentration coefficient and peak stress values are 3.33 and 48.9 MPa, respectively. For a minimum value of 0°, the stress concentration coefficient and peak stress values are 2.58 and 37.95 MPa, respectively. Moreover, with an increase in mining thickness, the peak stress and stress concentration coefficients show a trend of first increasing and then decreasing. For mining thicknesses of 8 m and 21 m, the corresponding stress concentration coefficient and peak stress values are 3.01 and 44.32 MPa and 3.19 and 46.89 MPa, respectively.
- (5)
- The 13,200 working face of the Gengcun coal mine is used as a case study, and field microseismic events are analyzed. The field microseismic events mainly occur at a distance of 0–80 m from the footwall of the fault, with the energy and frequency of microseismic events reaching their maximums at a distance of 30–50 m from the footwall. This is in good agreement with the simulated results of the stress concentration area. When the working face is located in the influence zone of the tectonic area, microseismic events occur more frequently and with greater energy.
Author Contributions
Conceptualization, S.Y; supervision, S.Y; writing-original draf, S.Y., X.W.and Z.W.; investigation, X.W.; software, X.W., L.C. and W.W.; resources, L.C.; data curation, L.C. and W.W.; formal analysis, Z.W.; funding acquisition, Z.W.; writing-review & editing, Z.W.; All authors have read and agreed to the published version of the manuscript.
Funding
This research was funded by the Scientific and Technological Project of Henan Province (222102320060), the strength improvement plan of the advantageous disciplines of Zhongyuan University of Technology (SD202232), and the Young backbone teacher project of Zhongyuan University of Technology (2023XQG14).
Data Availability Statement
Data are contained within the article.
Conflicts of Interest
Author Suihan Yang, Xiangzhi Wei and Linlin Chen were employed by the company Henan Dayou Energy Co Ltd., Gencun Coal Mine. The remaining authors declare that the research was conducted in the absence of any commercial or financial relationships that could be construed as a potential conflict of interest.
List of Symbols
| Symbol | Explanation | Unit | Symbol | Explanation | Unit |
| x | Horizontal coordinates in the cartesian coordinate system with the major axes of the ellipse | m | y | Vertical coordinates in the cartesian coordinate system with the minor axes of the ellipse | m |
| Angle between the line of the ellipse edge point, the ellipse center, and the major axis of the ellipse | ° | Length of the point at the edge of the ellipse hole and the line at the center of the ellipse | m | ||
| The variogram function | 1 | Re(z) | The real part of the complex number z | 1 | |
| σx | Tectonic stress in the x direction | Pa | Hoop stress in the polar coordinates | Pa | |
| σy | tectonic stress in the y direction | Pa | Radial stress in the polar coordinates | Pa | |
| Complex number of boundary surface forces | Pa | Shear stress in the polar coordinates | Pa | ||
| Initial ground stresses | Pa | Initial ground stresses | Pa | ||
| σh | Horizontal stress of rock mass in the fault zone | Pa | σv | Vertical stress of rock mass in the fault zone | Pa |
References
- Vu, T.T. Solutions to prevent face spall and roof falling in fully mechanized longwall at underground mines, Vietnam. Min. Miner. Deposits. 2022, 16, 127–134. [Google Scholar] [CrossRef]
- Babets, D.; Sdvyzhkova, O.; Hapieiev, S.; Shashenko, O.; Prykhodchenko, V. Multifactorial analysis of a gateroad stability at goaf interface during longwall coal mining—A case study. Min. Miner. Deposits. 2023, 17, 9–19. [Google Scholar] [CrossRef]
- Barański, A.; Drzewiecki, J.; Dubiński, J.; Kabiesz, J.; Konopko, W.; Kornowski, J.; Kurzeja, J.; Lurka, A.; Makówka, J.; Mutke, G.; et al. Principles of Using the Complex Method and Detailed Methods for Assessing the State of Rockburst Hazard in Hard Coal Mines, Instruction No. 22; Central Mining Institute: Katowice, Poland, 2012. [Google Scholar]
- Wojtecki, L.; Iwaszenko, S.; Apel, D.B.; Bukowska, M.; Makówka, J. Use of machine learning algorithms to assess the state of rockburst hazard in underground coal mine openings. J Rock Mech. Geotech. 2022, 14, 703–713. [Google Scholar] [CrossRef]
- Konicek, P.; Ptacek, J.; Waclawik, P.; Kajzar, V. Long-Term Czech Experiences with Rockbursts with Applicability to Today’s Underground Coal Mines. Rock Mech. Rock Eng. 2019, 52, 1447–1458. [Google Scholar] [CrossRef]
- Pu, Y.; Apel, D.B.; Lingga, B. Rockburst prediction in kimberlite using decision tree with incomplete data. J. Sustain. Min. 2018, 17, 158–165. [Google Scholar] [CrossRef]
- Chen, J.; Shi, K.W.; Pu, Y.Y.; Apel, D.B.; Zhang, C.; Zuo, Y.; Chen, J.; Xu, L.; Gui, Z.; Song, L. Study on instability fracture and simulation of surrounding rock induced by fault activation under mining influence. Rock Mech. Bull. 2023, 2, 10003. [Google Scholar] [CrossRef]
- Dou, L.M.; Tian, X.Y.; Cao, A.Y.; Gong, S.Y.; He, H.; He, J.; Cai, W.; Li, X.W. Present situation and problems of coal mine rock burst prevention and control in China. J. China Coal Soc. 2022, 47, 152–171. [Google Scholar]
- Zhang, J.W.; Dong, X.K.; Chai, H.T.; Song, Z.X.; Fan, W.B.; Wang, Q.; Lv, Y.L.; Zheng, B.; Bai, J.J.; Liu, Z.G.; et al. The mechanism and prevention of rock burst caused by the collapse of low-level thick hard rock seam at full mining height in thick coal seam. J. China Coal Soc. 2022, 47, 734–744. [Google Scholar]
- Li, C.C.; Zhao, T.; Zhang, Y.; Wan, W. A study on the energy sources and the role of the surrounding rock mass in strain burst. Int. J. Rock Mech. Min. Sci. 2022, 154, 105–114. [Google Scholar] [CrossRef]
- Kong, P.; Liu, R.; Xing, L.Y.; Wan, W.K. Study on the dynamic response and the hazard of rock burst under the influence of fault slip. Front. Earth Sci. 2023, 10, 1034332. [Google Scholar] [CrossRef]
- He, J.; Dou, L.; Gong, S.; Li, J.; Ma, Z. Rock burst assessment and prediction by dynamic and static stress analysis based on micro-seismic monitoring. Int. J. Rock Mech. Min. Sci. 2017, 93, 46–53. [Google Scholar] [CrossRef]
- Wang, C.; Cao, A.; Zhu, G.; Jing, G.; Li, J.; Chen, T. Mechanism of rock burst induced by fault slip in an island coal panel and hazard assessment using seismic tomography: A case study from Xuzhuang colliery, Xuzhou, China. Geosci. J. 2017, 21, 469–481. [Google Scholar] [CrossRef]
- Li, K.; Chen, J.; Zhao, Z.; Yan, R.; Du, T.T. Study on disaster-causing factors and evolution process of rock burst in roadway near gob. Coal Sci. Technol. 2019, 47, 76–82. [Google Scholar]
- Yang, W.L.; Lin, Q.; Wei, Q.D.; Qu, X.C.; Wang, J.C.; Liu, X. Mechanism of rockburst induced by fault coal pillars with different widths indeep shaft. Coal Eng. 2020, 52, 112–116. [Google Scholar]
- Jagger, L.J.; McClay, K.R. Analogue modelling of inverted domino-style basement fault systems. Basin Res. 2018, 30, 363–381. [Google Scholar] [CrossRef]
- Bonini, L.; Basili, R.; Toscani, G.; Burrato, P.; Seno, S.; Valensise, G. The role of pre-existing discontinuities in the development of extensional faults: An analog modeling perspective. J. Struct. Geol. 2015, 74, 145–158. [Google Scholar] [CrossRef]
- Sainoki, A.; Mitri, H.S. Dynamic behaviour of mining-induced fault slip. Int. J. Rock Mech. Min. Sci. 2014, 66, 19–29. [Google Scholar] [CrossRef]
- Wang, P.; Jiang, L.S.; Jiang, J.Q.; Zheng, P.Q.; Li, W. Strata behaviors and rock Burst-Inducing Mechanism under the coupling effect of a hard, thick stratum and a normal fault. Int. J. Geomech. 2018, 18, 04017135. [Google Scholar] [CrossRef]
- Yu, Q.G.; Zhang, H.X.; Zhang, Y.J.; Deng, W.N.; Zhang, G.Y. Analysis of fault activation mechanism and influencing factors caused by mining. J. China Coal Soc. 2019, 44, 18–30. [Google Scholar]
- Lv, J.G.; Nan, C.Q.; Zhang, Y.; Qiao, Y.G.; Tang, Z. Coal bump mechanism in Yima coalfield mining near thrustfault. J. Min. Saf. Eng. 2018, 35, 567–574. [Google Scholar]
- Wu, Z.H.; Pan, P.Z.; Pan, J.F.; Wang, Z.F.; Gao, J.M. Analysis of mechanism of rock burst and law of mining induced events in graben structural area. Rock Soil Mech. 2021, 42, 2225–2238. [Google Scholar]
- Kong, P.; Jiang, L.; Shu, J.; Wang, L. Mining stress distribution and fault-slip behavior: A case study of fault-influenced longwall coal mining. Energies 2019, 12, 2494. [Google Scholar] [CrossRef]
- Ji, H.G.; Ma, H.S.; Wang, J.A. Mining disturbance effect and mining arrangements analysis of near-fault mining in high tectonic stress region. Saf. Sci. 2012, 50, 649–654. [Google Scholar] [CrossRef]
- Zhao, T.B.; Guo, W.Y.; Tan, Y.L.; Lu, C.P.; Wang, C.W. Casehistories of rock bursts under complicated geological conditions. Bull. Eng. Geol. Environ. 2018, 77, 1529–1545. [Google Scholar] [CrossRef]
- Zhao, S.K.; Deng, Z.G.; Ji, W.B.; Li, Z.; Zhang, G.; Li, Y. Effects of multi-stage tectonic movement on regional tectonic stress characteristics and rockburst. J. Min. Saf. Eng. 2019, 36, 306–314. [Google Scholar]
- Cao, M.H.; Liu, F.; Wang, T.X. Numerical simulation study of fault activation process and coal pillar instability mechanism. J. Shandong Univ. Sci. Technol. Nat. Sci. 2020, 39, 61–68. [Google Scholar]
- Jiao, Z.; Yuan, Q.; Zou, P.; Shi, B.J. Case Study of the Characteristics and Mechanism of Rock Burst near Fault in Yima Coalfield, China. Shock. Vib. 2021, 2021, 9950273. [Google Scholar] [CrossRef]
- Tong, H.M.; Cai, D.S.; Yongping, W.U.; Li, X.G. Activity criterion of pre-existing fabrics in non-homogeneous deformation domain. Sci. China Earth Sci. 2010, 53, 1115–1125. [Google Scholar] [CrossRef]
- Zhao, Y.X.; Lu, Z.G.; Zhu, G.P.; Jiao, Z.H.; Wang, H.; Gao, N. Fault reactive induced by the principal stress rotation for the underground coal mining. J. China Univ. Min. Technol. 2018, 47, 73–80. [Google Scholar]
- Sainoki, A. Dynamic modelling of fault-slip with Barton’s shear strength model. Int. J. Rock Mech. Min. Sci. 2014, 67, 155–163. [Google Scholar] [CrossRef]
- Sainoki, A.; Mitri, H.S. Effect of slip-weakening distance on selected seismic source parameters of mining induced fault-slip. Int. J. Rock Mech. Min. Sci. 2015, 73, 115–122. [Google Scholar] [CrossRef]
- Orlecka-Sikora, B.; Lasocki, S.; Lizurek, G.; Rudziński, L. Response of seismic activity in mines to the stress changes due to mining induced strong seismic events. Int. J. Rock Mech. Min. Sci. 2012, 53, 151–158. [Google Scholar] [CrossRef]
- Zhao, Y.X.; Wang, H.; Jiao, Z.H.; Lu, Z.G.; Zhang, X. Experimental study of the activities of reverse fault induced by footwall coal mining. J. China Coal Soc. 2018, 43, 914–922. [Google Scholar]
- Zhao, S.K. Experiments on the characteristics of thrust fault activation influenced by mining operation. J. Min. Saf. Eng. 2016, 33, 354–360. [Google Scholar]
- Wang, T.; You, S. The influence of different mining modes on the evolution law of stress in fault surrounding rock. J. Min. Saf. Eng. 2017, 34, 276–281. [Google Scholar]
- Wang, H.W.; Wang, Q.; Shi, R.M.; Jiang, Y.D.; Tian, Z. A review on the interaction mechanism between coal burstsand fault structure instability from the perspective of multi-physical field. J. China Coal Soc. 2022, 47, 762–790. [Google Scholar]
- Wang, H.; Jiang, Y.; Xue, S.; Mao, L.T.; Lin, Z.N.; Deng, D.X.; Zhang, D.Q. Influence of fault slip on mining-induced pressure and optimization of roadway support design in fault-influenced zone. J. Rock Mech. Geotech. Eng. 2016, 8, 660–671. [Google Scholar] [CrossRef]
- Wang, H.W.; Shao, M.M.; Wang, G.; Deng, D.X. Characteristics of stress evolution on the thrust fault plane during the coal mining. J. China Coal Soc. 2019, 44, 2318–2327. [Google Scholar]
- Kidybiński, A. Bursting liability indices of coal. Int. J. Rock Mech. Min. Sci. Geomech. Abstr. 1981, 18, 295–304. [Google Scholar] [CrossRef]
- Smoliński, A.; Malashkevych, D.; Petlovanyi, M.; Rysbekov, K.; Lozynskyi, V.; Sai, K. Research into Impact of Leaving Waste Rocks in the Mined-Out Space on the Geomechanical State of the Rock Mass Surrounding the Longwall Face. Energies 2022, 15, 9522. [Google Scholar] [CrossRef]
- Malashkevych, D.; Petlovanyi, M.; Sai, K.; Zubko, S. Research into the coal quality with a new selective mining technology of the waste rock accumulation in the mined-out area. Min. Miner. Depos. 2022, 16, 103–114. [Google Scholar] [CrossRef]
- Sepehri, M.; Apel, D.B.; Adeeb, S.; Leveille, P.; Hall, R.A. Evaluation of mining-induced energy and rockburst prediction at a diamond mine in Canada using a full 3D elastoplastic finite element model-ScienceDirect. Eng. Geol. 2020, 266, 105457. [Google Scholar] [CrossRef]
- Wojtecki, L.; Konicek, P. Estimation of active rockburst prevention effectiveness during longwall mining under disadvantageous geological and mining conditions. J. Sustain. Min. 2016, 15, 1–7. [Google Scholar] [CrossRef]
- Konicek, P.; Schreiber, J. Heavy rockbursts due to longwall mining near protective pillars: A case study. Int. J. Min. Sci. Technol. 2018, 28, 799–805. [Google Scholar] [CrossRef]
- Filippov, V.N.; Eremenko, A.A.; Khristolyubov, E.A. Extraction of ore reserves from safety pillars in rockburst-hazardous conditions of tashtagol and sheregesh deposits. J. Min. Sci. 2021, 57, 57–65. [Google Scholar] [CrossRef]
- Kopytov, A.I.; Eremenko, A.A.; Shaposhnik, Y.N. Design of support systems forrockburst-hazardous underground mines in Gornaya Shorial. J. Min. Sci. 2020, 56, 567–574. [Google Scholar] [CrossRef]
- Zhou, J.; Li, X.B.; Mitri, H.S. Evaluation method of rockburst: State-of-the-art literature review. Tunn. Undergr. Space Technol. 2018, 81, 632–659. [Google Scholar] [CrossRef]
- Wu, C.; Dou, L.M.; Si, G.Y.; Cao, A.Y.; Gong, S.Y.; Wang, G.F.; Yuan, S.S. A new seismic-based strain energy methodology for coal burst forecasting in underground coal mines. Int. J. Rock Mech. Min. Sci. 2019, 123, 104086. [Google Scholar]
- Pan, Y.S.; Wang, A. Disturbance response instability theory of rock bursts in coal mines and its application. Geohazard Mech. 2022, 1, 1–17. [Google Scholar] [CrossRef]
- Wang, L.H.; Cao, A.Y.; Guo, W.H.; Dou, L.M.; Wen, Y.Y.; Xue, C.C.; Hu, Y.; Lv, D.Z. Rock burst mechanism and characteristics of and characteristics of roadway in “faulu-fold” struture area. J. Min. Saf. Eng. 2023, 40, 69–81. [Google Scholar]
- Liu, Z.C.; Liu, X.R.; Li, Y.K.; Zhang, H. Mechanism of faults acting on in-situ stress field direction. Oil Gas Geol. 2016, 37, 387–393. [Google Scholar]
- Qi, Q.X.; Ma, S.Z.; Sun, X.K.; Zhao, S.K.; Li, Y.P.; Li, H.T.; Yu, B.; Pan, Z.P.; Wang, S.G.; Li, H.; et al. Theory and technical framework of coal mine rock burst origin prevention. J. China Coal Soc. 2018, 43, 1801–1810. [Google Scholar]
- Cai, W.; Dou, L.M.; Wang, G.F. Mechanism of fault reactivation and its induced coal burst caused by coal mining activities. J. Min. Saf. Eng. 2019, 36, 1193–1202. [Google Scholar]

Disclaimer/Publisher’s Note: The statements, opinions and data contained in all publications are solely those of the individual author(s) and contributor(s) and not of MDPI and/or the editor(s). MDPI and/or the editor(s) disclaim responsibility for any injury to people or property resulting from any ideas, methods, instructions or products referred to in the content. |
© 2024 by the authors. Licensee MDPI, Basel, Switzerland. This article is an open access article distributed under the terms and conditions of the Creative Commons Attribution (CC BY) license (https://creativecommons.org/licenses/by/4.0/).