Abstract
Since the discovery of the vast Jimusaer shale oilfield in the southeastern Junggar Basin in 2012, there has been considerable interest in neighboring areas around Bogeda Mountain that have shale oil potential. The primary productive interval in the basin, the Middle Permian Lucaogou Formation (P2l), is well-developed in the areas of Qitai, Mulei, Shiqiantan, Chaiwopu, and Miquan. In this study, we conducted an assessment of the hydrocarbon generation potential of the P2l in these five areas and compared it with that of the P2l in the Jimusaer oilfield, which were determined by GC-MS, total organic carbon (TOC) and vitrinite reflectance (Ro) measurements, Rock-Eval pyrolysis, and organic petrology to investigate the type, origin, thermal maturity, hydrocarbon potential, and oil/gas proneness of organic matter in the P2l. Additionally, we applied open-system pyrolysis of hydrocarbon generation kinetics to explore differences in hydrocarbon generation and expulsion across various P2l mudstone/shale in the southeastern Junggar Basin. The findings of this study revealed that the P2l shale in Qitai and Miquan areas contains more abundant and lower thermally mature organic matter (early mature–mature stage), characterized by primarily Type II1–I kerogen, similar to that found in the P2l shale of the Jimusaer oilfield. Conversely, the P2l shale in Mulei, Shiqiantan, and Chaiwopu contains less abundant and more thermally mature organic matter (mainly mature–highly mature stage), dominated by Type II2–III kerogen. Consequently, shale in these areas is considerably less desirable for oil exploration compared to the Jimusaer shale. The semi-deep to deep lake facies in Miquan and Qitai exhibit the most promising exploration potential. This study can serve as a guide for shale oil exploration in the southeastern Junggar Basin.
1. Introduction
The southeastern Junggar Basin is an important field of oil and gas exploration [1,2,3,4,5]. Within this basin, the Upper Permian Lucaogou Formation (P2l), with organic-rich source rocks (a TOC content of up to 20 wt.%), is a primary target for shale oil exploration in the Bogeda Piedmont Depression. Significant commercial tight oil reservoirs were discovered in the P2l shale in the Jimusaer and Qitai areas of the Junggar Basin [4,6,7]. In the Jimusaer area, the estimated shale oil resources amount to approximately 370 million tons, while wells Qi 1 and Bocan 1 confirm the presence of the P2l source rock [3,8,9]. It is worth noting that although the P2l mainly comprises laterally extensive lake facies, its source rock qualities vary across different areas of the basin. The development characteristics and lateral facies variation of the P2l source rocks remain unclear. Furthermore, the southeastern Junggar Basin presents the potential for late secondary hydrocarbon generation; however, due to the absence of relevant reports, target evaluation and exploration optimization are hindered.
Due to the influence of the Hercynian Movement, the Yanshan Movement, the Himalayan Movement, and other strong orogenic movements, the degree of thermal evolution is quite different. Differences in tectonic evolution have led to the different hydrocarbon generation and thermal evolution patterns of P2l source rocks in different regions [10]. However, few reports concerning the organic geochemistry and petrology of the P2l shale have been published to date [1,3,8,9]. Therefore, this study aims to investigate the types, origin, maturity, hydrocarbon potential, and oil/gas proneness of the organic matter within P2l source rocks using bulk and organic geochemistry, TOC and vitrinite reflectance measurements, Rock-Eval pyrolysis, and organic petrology. By integrating these analyses with data on source rock development and depositional environment, we can predict the distribution of favorable source rocks in the southeastern Junggar Basin.
The P2l source rocks in the southeastern Junggar Basin are primarily at the low-maturity to maturity stage (Ro < 1.0%) [11]. In order to assess the potential and conditions for secondary hydrocarbon generation in the basin, an open-system pyrolysis approach was employed to analyze the kinetics of hydrocarbon generation. This study has important practical implications for the exploration of the P2l oil shale reservoirs in the vicinity of Bogeda Mountain and the identification of promising hydrocarbon targets.
2. Geological Setting
2.1. Tectono-Sedimentary Characteristics
The Bogeda orogenic belt is located in the southeastern Junggar Basin. It is bordered by the fault belt that forms the northern margin of the Turpan Basin to the south, the Urumqi-Jimusaer Sag to the north, and the Yilinheibiergen tectonic belt to the southwest and connects with the Harrick tectonic belt to the east. Several residual sedimentary basins, namely, the Shiqiantan and Mulei sags in the east, the Qitai Uplift in the center, the Miquan Structure in the west, and the Chaiwopu Sag in the south, are present in the periphery of the Bogeda orogenic belt (Figure 1a).
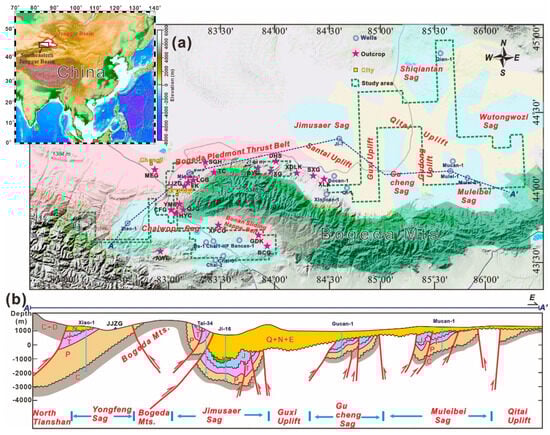
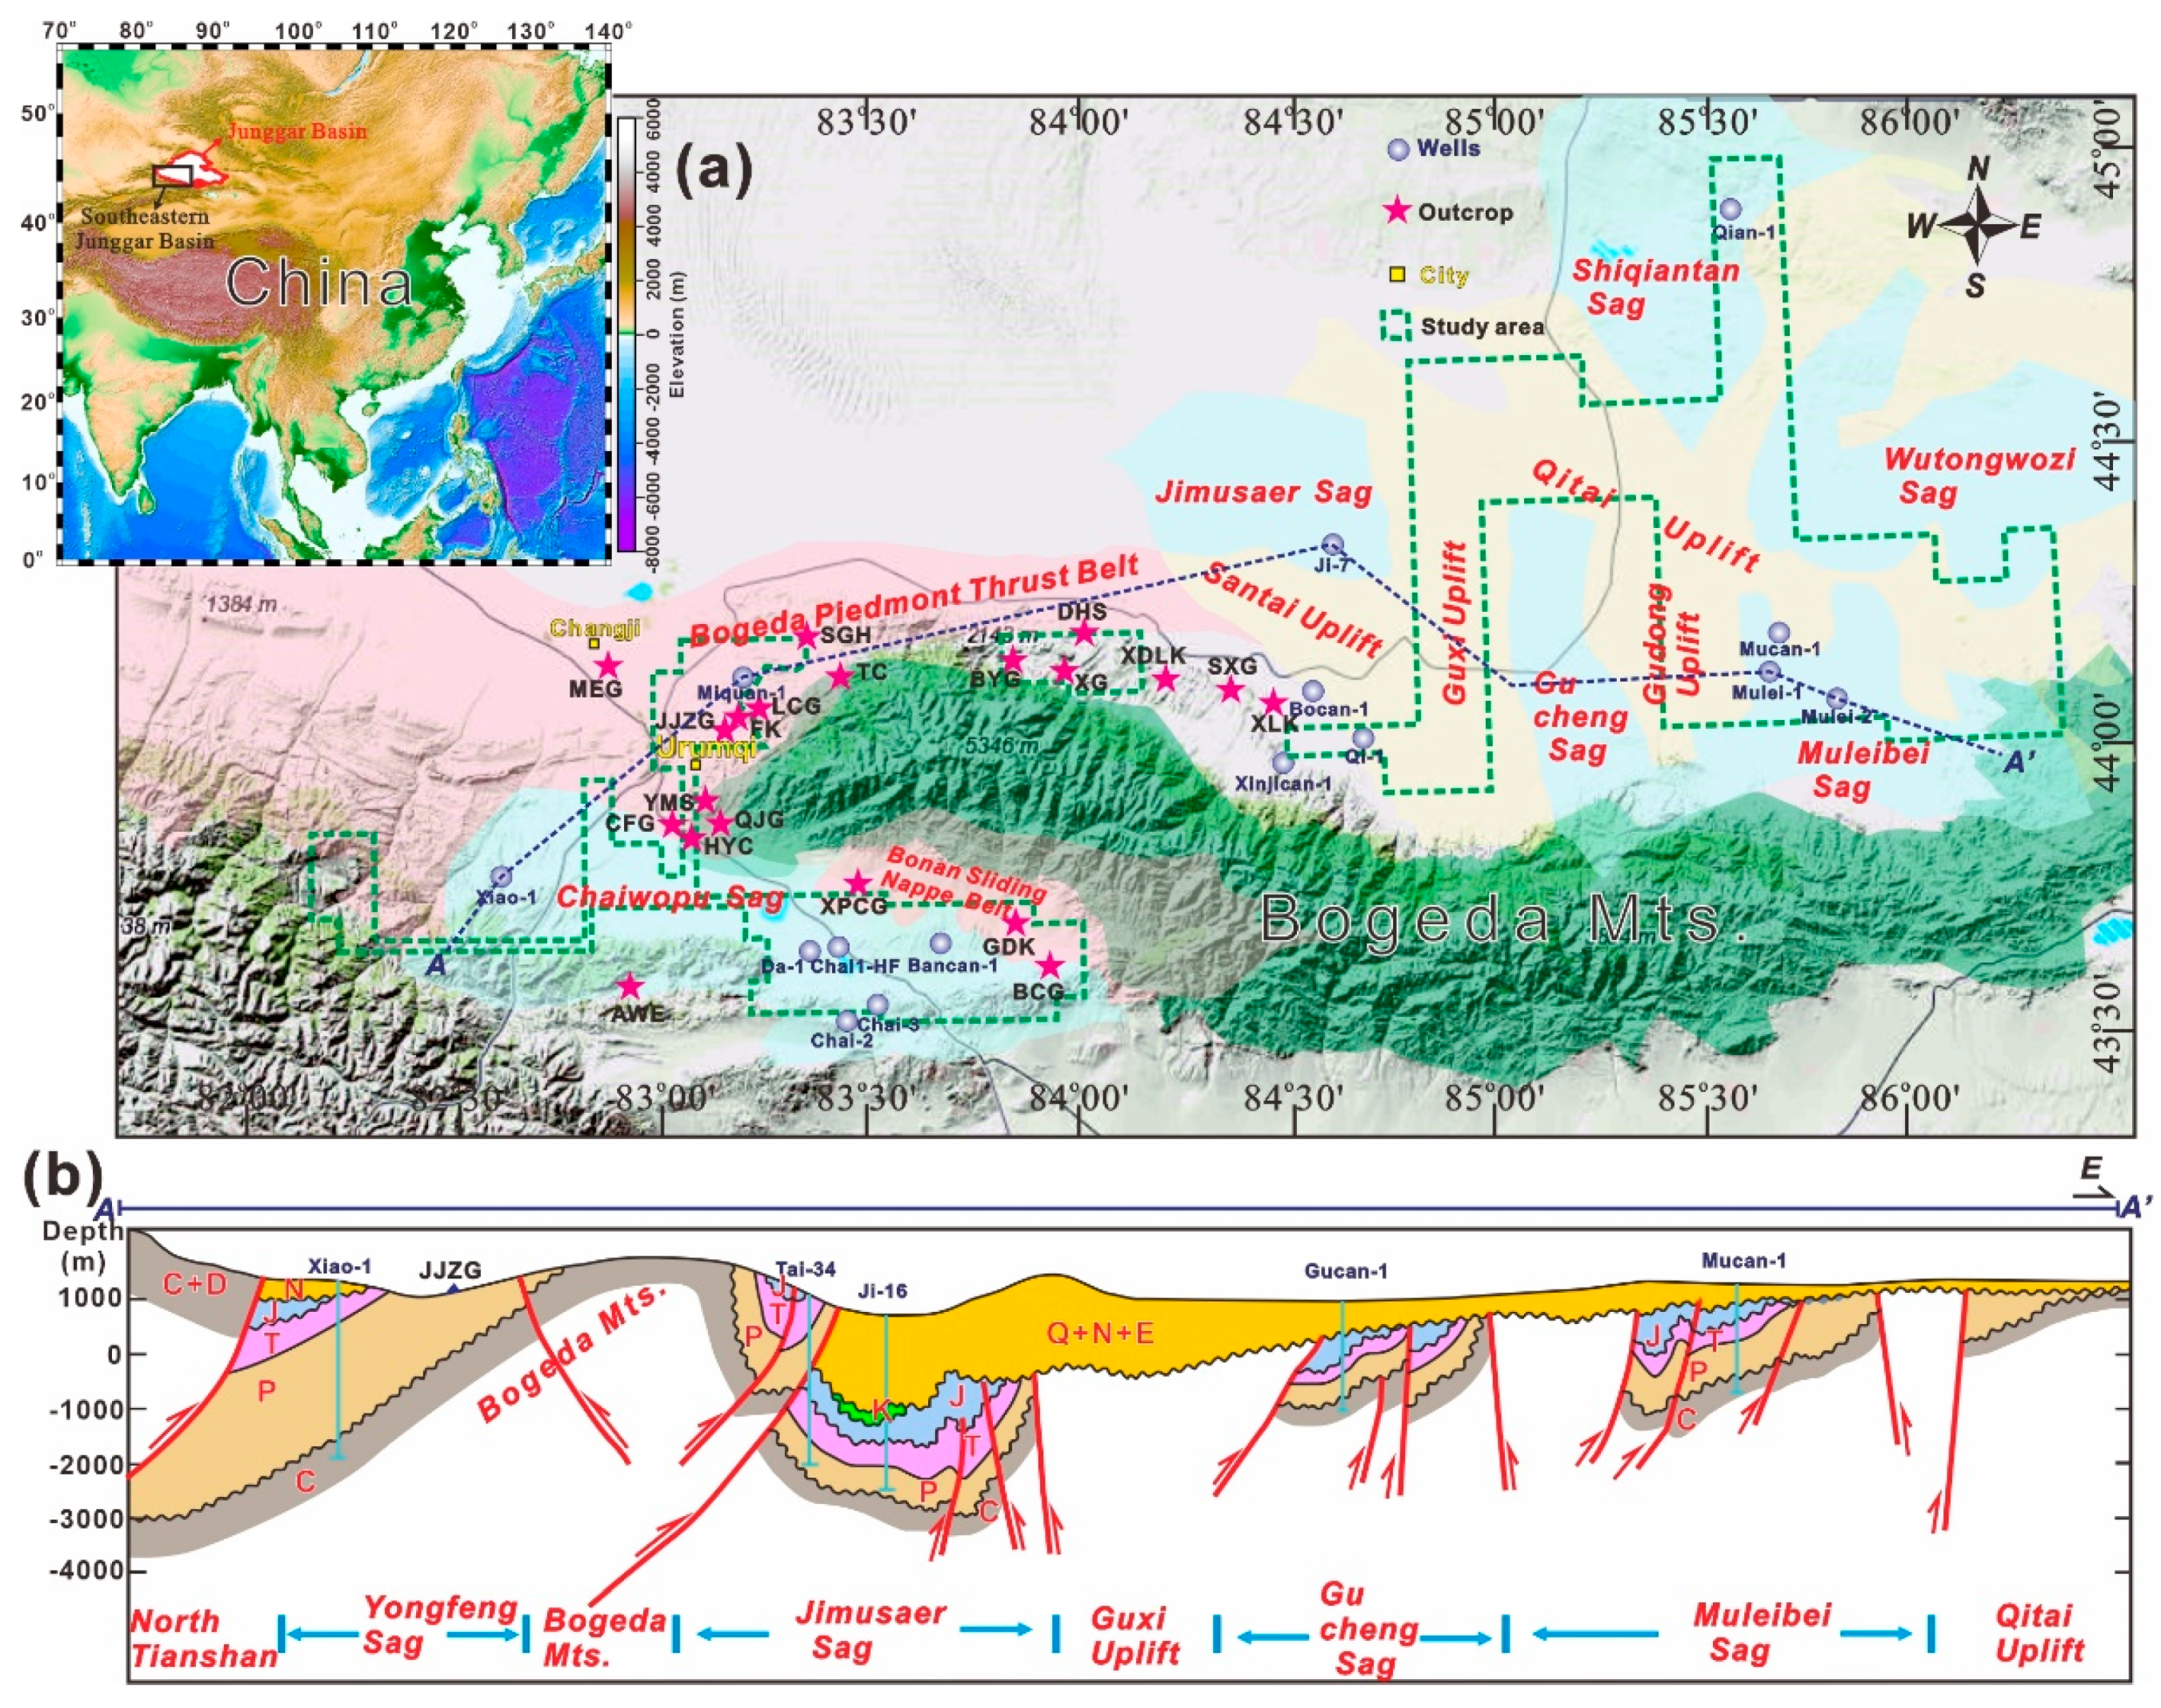
Figure 1.
(a) Geological map outlining the regional tectonic elements of the southeastern Junggar Basin and the (b) EW−trending profile through Bogeda Mountain showing the stratigraphic framework of Junggar Basin (Mulei area: Wells Mulei−1, Mulei−2, and Mucan−1; Shiqiantan area: Well Qian−1; Qitai area: Wells Xinjican−1, Qi-1, Bocan−1, XLK, SXG, XDLK, DHS, XG, and BYG outcrops; Miquan area: SGH, MEG, YMS, JJZG, HYC, QJG, and CFG outcrops, Well Miquan−1; Chaiwopu area: Wells Chai1−HF, Chai−2, Chai−3, Bancan−1, Da−1, GDK, BCG, XPCG, and AWE outcrops).
The Bogeda orogenic belt evolved from a volcanic rift in the Junggar–Turpan microplate. Since the Late Paleozoic, the Bogeda region has experienced rifting, depression, and foreland basin evolution. In the southeastern Junggar Basin, the Upper, Middle, and Lower Permian systems are well-developed but greatly variable. The Lower Permian mainly occurred in the Chaiwopu and Miquan areas. The Middle Permian is very widespread across the entire southeastern Junggar Basin; the Upper Permian is also widespread (Figure 1b).
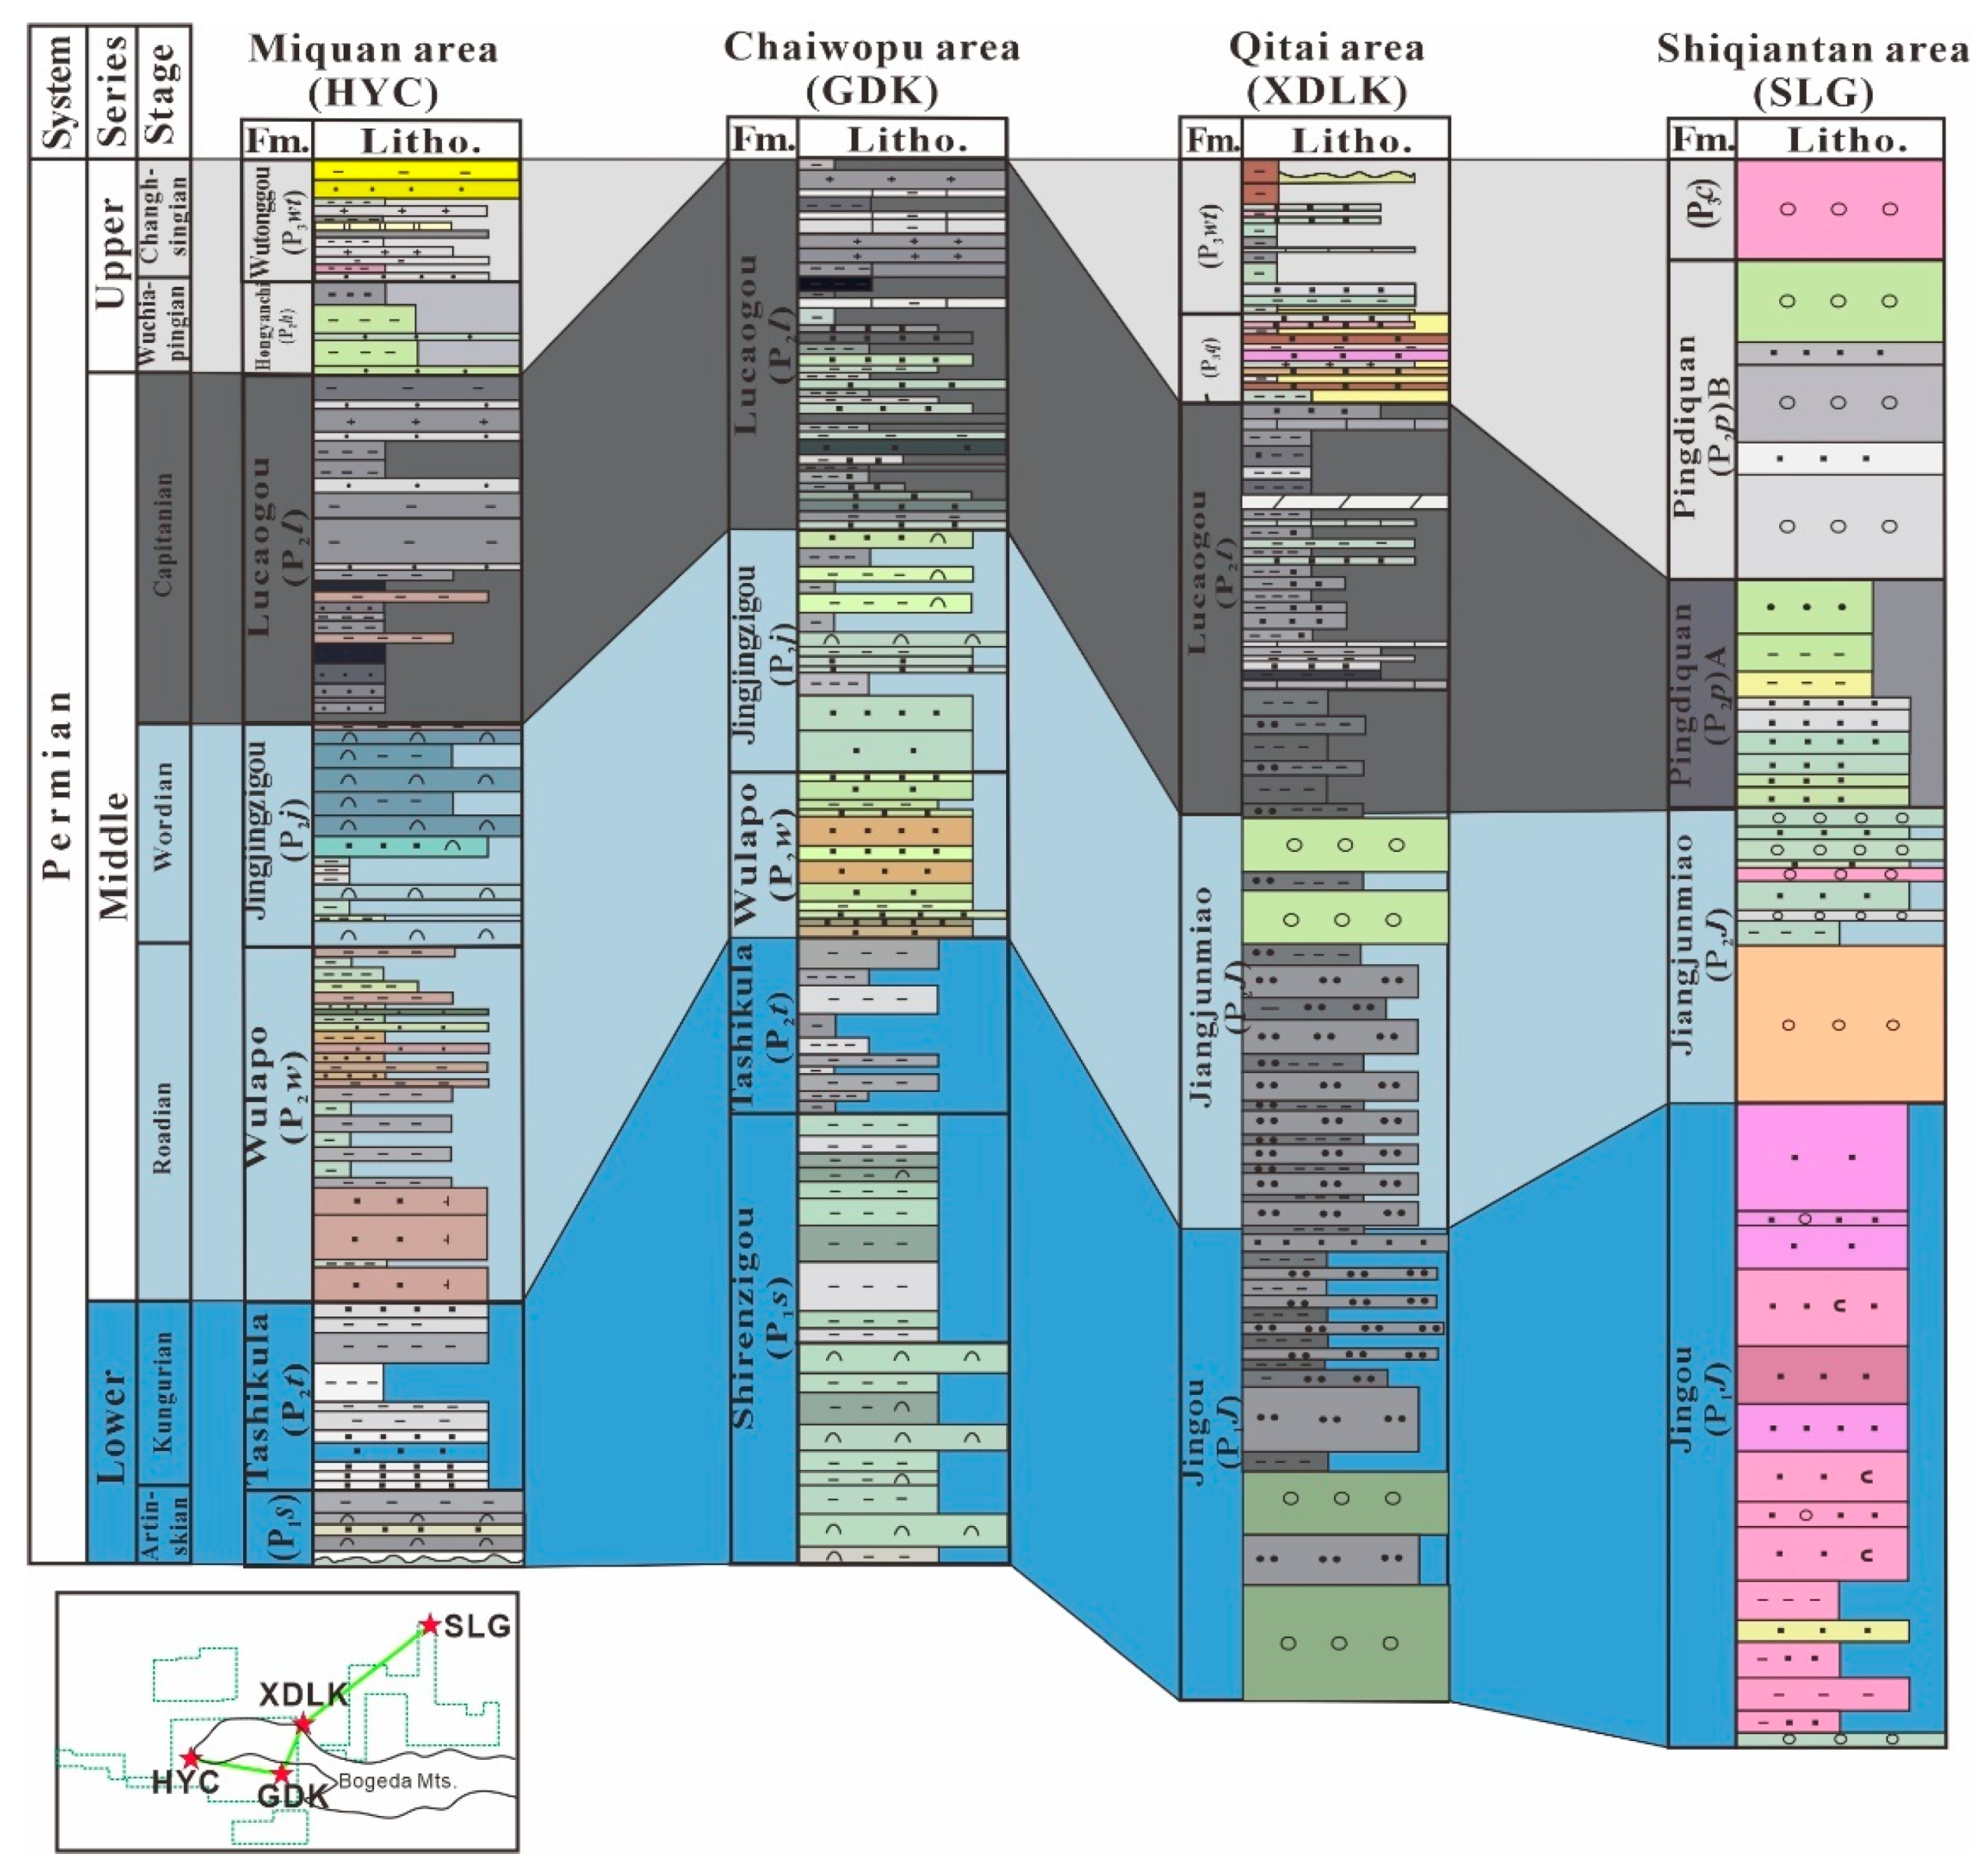
The Middle Permian deposits include three stratigraphic units of organic-rich mudstones: the Jingjingzigou, Lucaogou (P2l), and Hongyanchi Formations [1]. The P2l has a much higher TOC and hydrogen index (HI) content than the other two Middle Permian formations and hosts good petroleum reservoirs. Based on outcrop evidence from Hongyanchi (HYC), Jingjingzigou (JJZG), Yaomoushan (YMS), Dahuangshan (DHS), Xiaolongkou (XLK), and Guodikeng (GDK), and drilling cores from the Qi-1 and Xinjican-1 wells, the P2l is divided into four members, namely, P2l1, P2l2, P2l3, and P2l4, from bottom to top. In the eastern Junggar Basin, the stratigraphic unit correlative to the P2l is the Pingdiquan Formation (P2p) (Figure 2) [5,11].
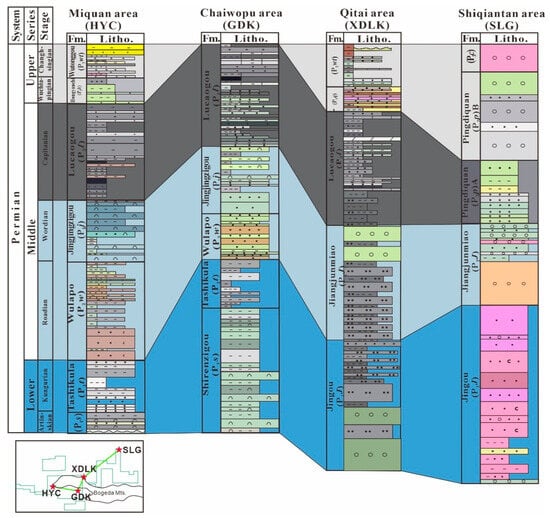
Figure 2.
Chronostratigraphic chart showing the stratigraphic correlation between the areas of Miquan, Chaiwopu, Qitai, and Mulei in the southeastern Junggar Basin.
2.2. Tectonic Evolution
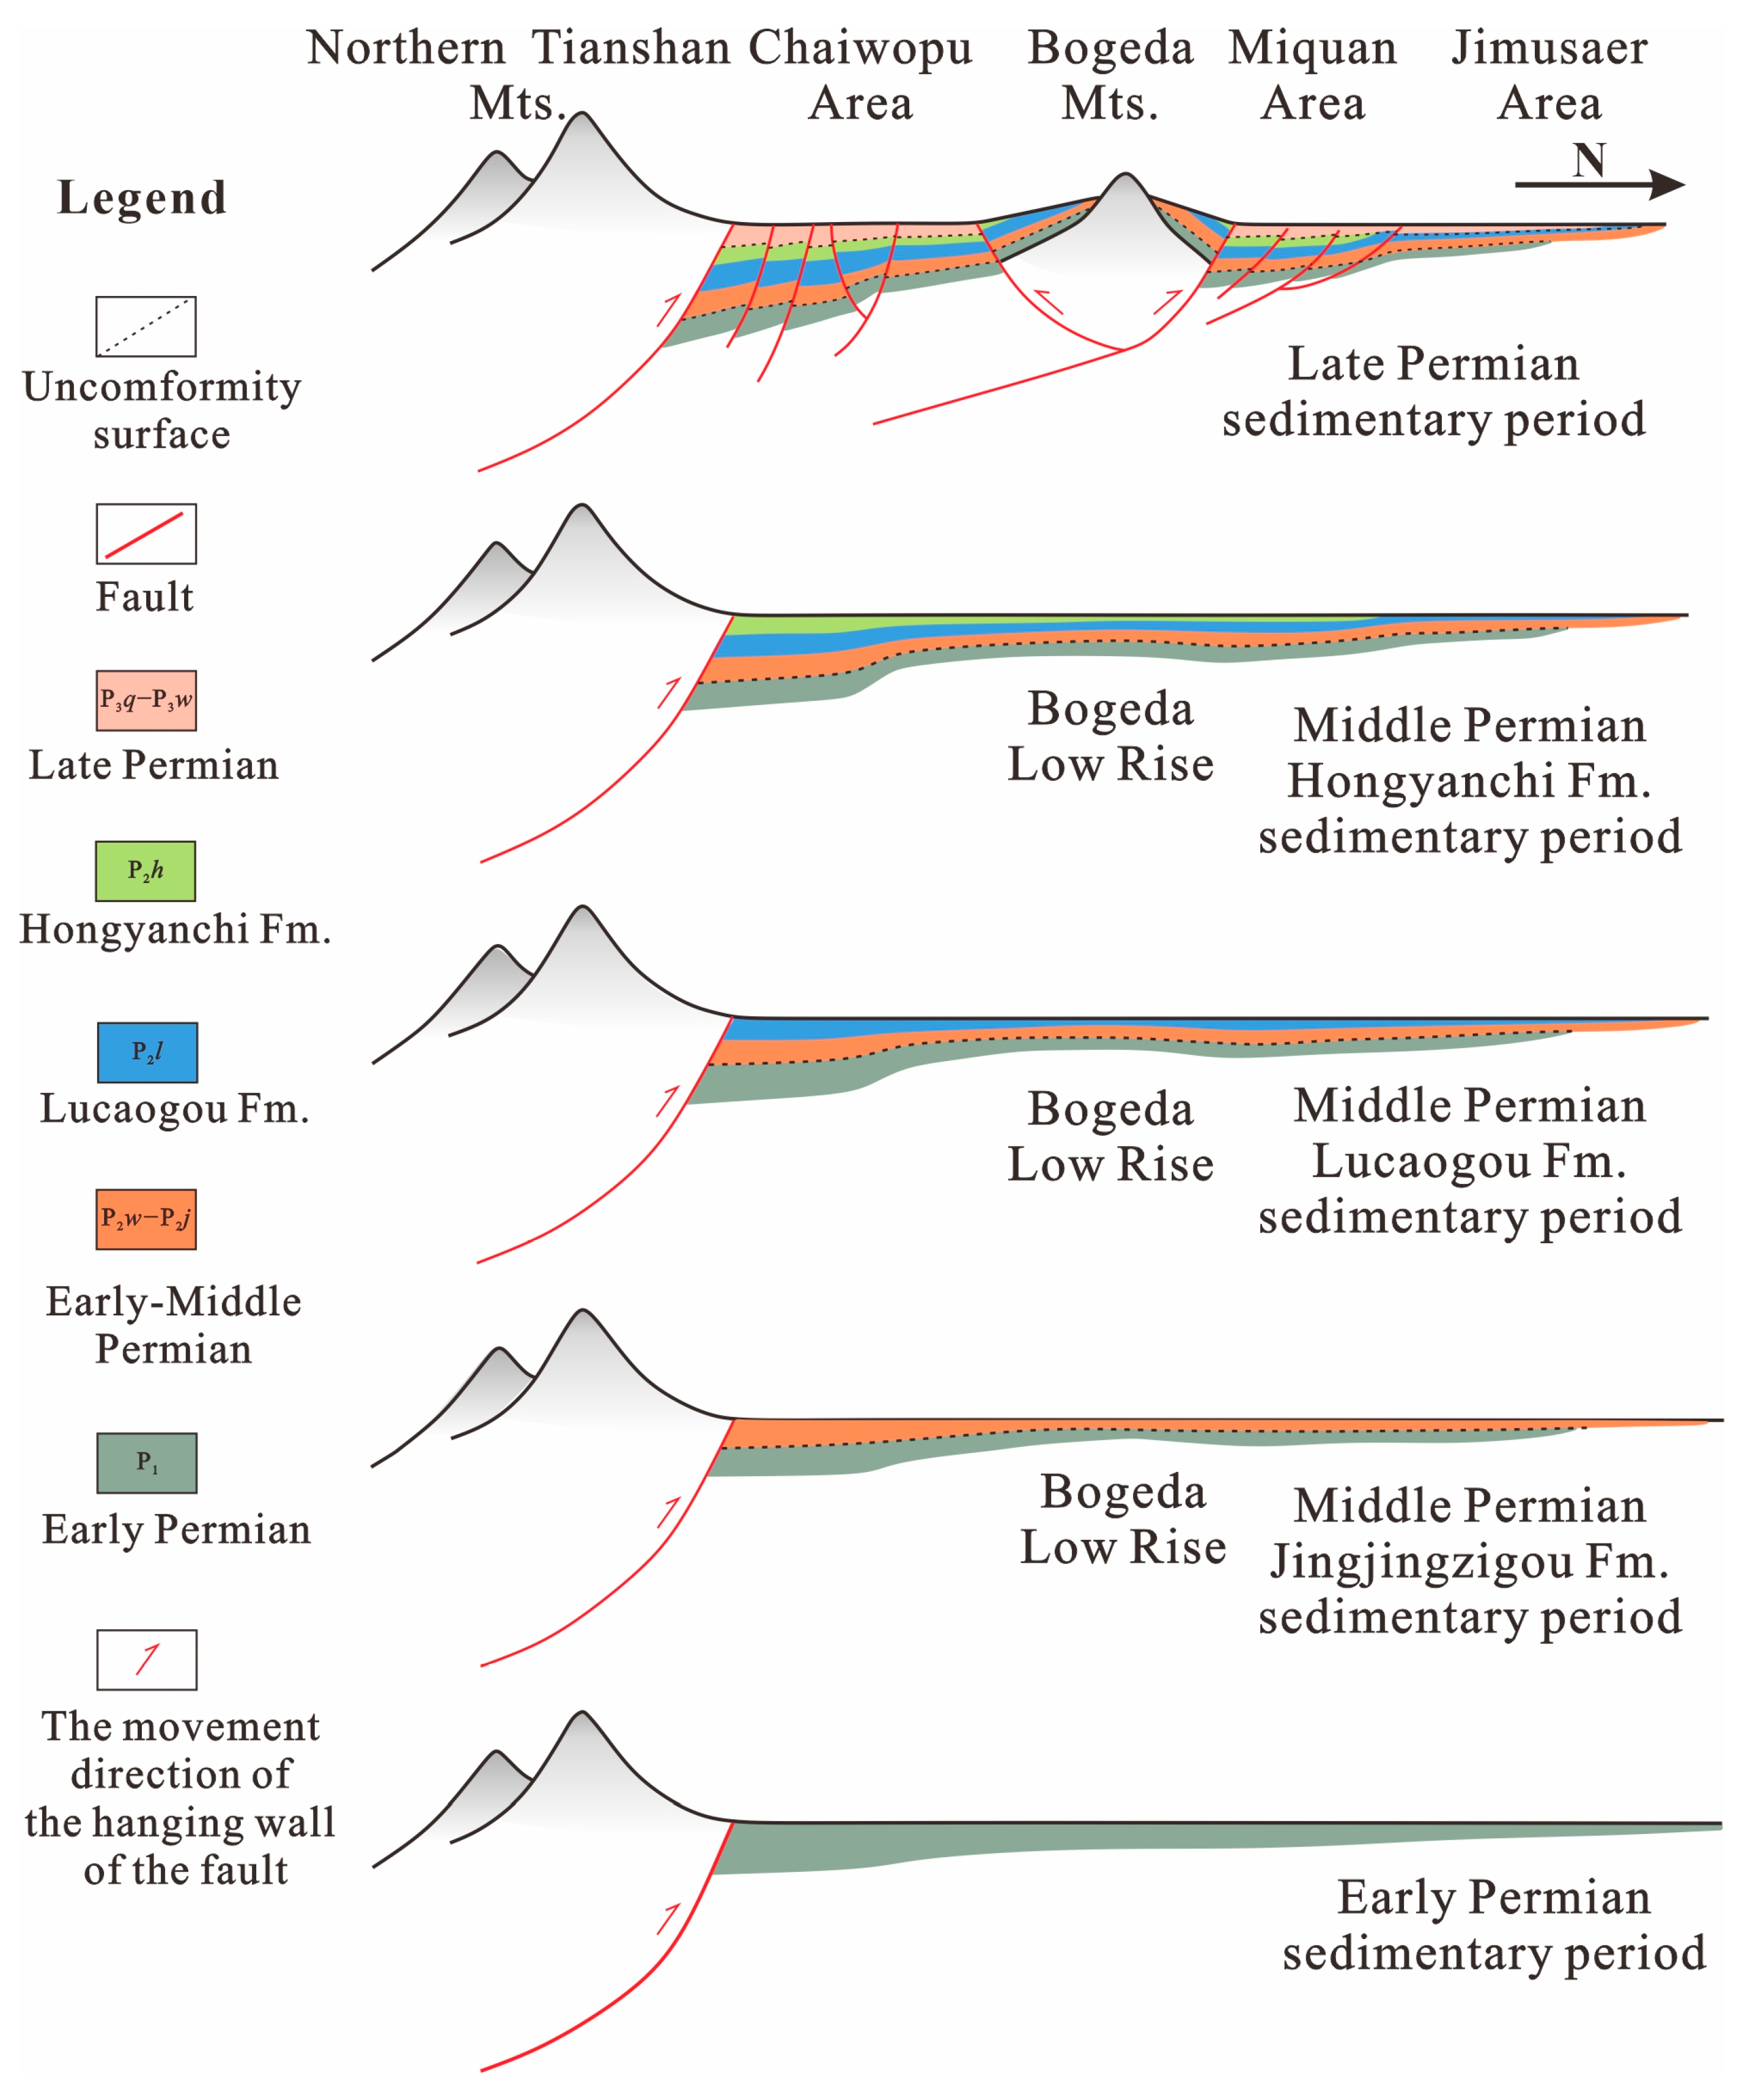
Due to the influence of the Hercynian Movement, the Yanshan Movement, the Himalayan Movement, and other strong orogenic movements, the degree of thermal evolution is quite different [10]. Differences in tectonic evolution have led to the different hydrocarbon generation and thermal evolution patterns of P2l source rocks in different regions (Figure 3).

Figure 3.
The NS-trending cross-sections of the Chaiwopu, Miquan, and Jimusaer areas show stratigraphic development of the studied area.
According to the regional unconformity surface, the tectonic sedimentary evolution of the SE Junggar Basin during Permian is divided into two periods and three stages: (1) Early Permian–Middle Permian marine–continental transitional compressional basin stage (including Early Permian marine compressional stage and Middle Permian continental compressional basin stage); (2) Late Permian–Paleogene intracontinental compression basin period (Late Permian–Early Triassic intracontinental compression depression stage) (Figure 3).
3. Sampling and Methods
3.1. Sample Selection and Preparation
To investigate the organic geochemistry, hydrocarbon potential, and hydrocarbon generation and expulsion characteristics of the P2l source rocks, 80 rock cores were sampled from six wells across the area of study (Mucan-1, Mulei-1, Qi-1, Xinjican-1, Bocan-1, and Chaican-1), and 176 rock samples were collected from four outcrops in the northeastern Junggar Basin, namely, JJZG and HYC (Miquan area), DHS (Qitai area), and GDK (Chaiwopu area) (Figure 1a). Those samples underwent the following analyses: TOC content, Rock-Eval pyrolysis, vitrinite reflectance, organic petrography, column chromatography, Gas chromatography–mass spectrometry, organic elements, and open-system hydrocarbon generation kinetics pyrolysis (18 samples), and some of the data were collected from published works [3,4,6,7,9,12,13,14,15,16] and new data from Shengli Oil Company, Sinopec, Dongying, China.
3.2. Gas Chromatography–Mass Spectrometry (GC-MS) Analysis
GC-MS was used to study the geochemical characteristics of the source rock samples of the Lucaogou Formation from the southeastern Junggar Basin and to compare the parameters of various biomarkers and analyze the characteristics of the mass chromatogram, so as to provide useful information for the evaluation of the source rock in this area. The GC-MS analysis was performed on 18 source rock samples and two crude oil samples, using an Agilent 7890A GC/5977MSD instrument. Other analytical conditions are the same as in Ref. [17].
3.3. Organic Petrographic Analysis
To measure the vitrinite reflectance (Ro) and analyze the maceral composition, we conducted the organic petrographic examination on 39 samples from five wells, using a Zeiss Axioplan II microscope (Jena, Germany) and following the laboratory methods described by Ref. [18]. Maceral analysis was performed with an LABORLUX 12 POL fluorescence microscope. More than 300 points were counted for each sample [19,20,21].
3.4. Open-System Hydrocarbon Kinetic Pyrolysis
To study the hydrocarbon production efficiency of the source rock, the 18 samples from the JJZG (Miquan), DHS (Qitai), HYC (Miquan), and GDK (Chaiwopu) profiles and Well Qi-1 were treated to generate kerogen. The kinetic pyrolysis of hydrocarbon generation was conducted using the Rock-Eval 6 analyzer. The heating procedure was as follows: The temperature in the analyzer was raised quickly to 300 °C and kept constant for 3 min to remove free hydrocarbons. Then, the temperature was raised to 600 °C at the rate of 10 °C/min, 30 °C/min, 40 °C/min, and 50 °C/min, to acquire the samples’ hydrocarbon production efficiency curves at different heating rates. These curves are necessary for the calculation of the hydrocarbon generation kinetics.
The kinetic parameters of hydrocarbon generation were determined using Kinetics 2000 software. This software was also used to derive the distribution of activation energy from the input data (time, temperature, and transformation rate for the generation of gaseous hydrocarbons) measured in the course of pyrolysis at the four experimental heating rates. The thermal decomposition of kerogen in a source rock sample was approximated by a series of independent and parallel first-order chemical reactions. The temperature dependency of the reaction rate was quantified by applying Arrhenius’ law with a discrete activation energy distribution, as described by many other authors [22,23,24].
4. Results
4.1. Organic Matter Abundance
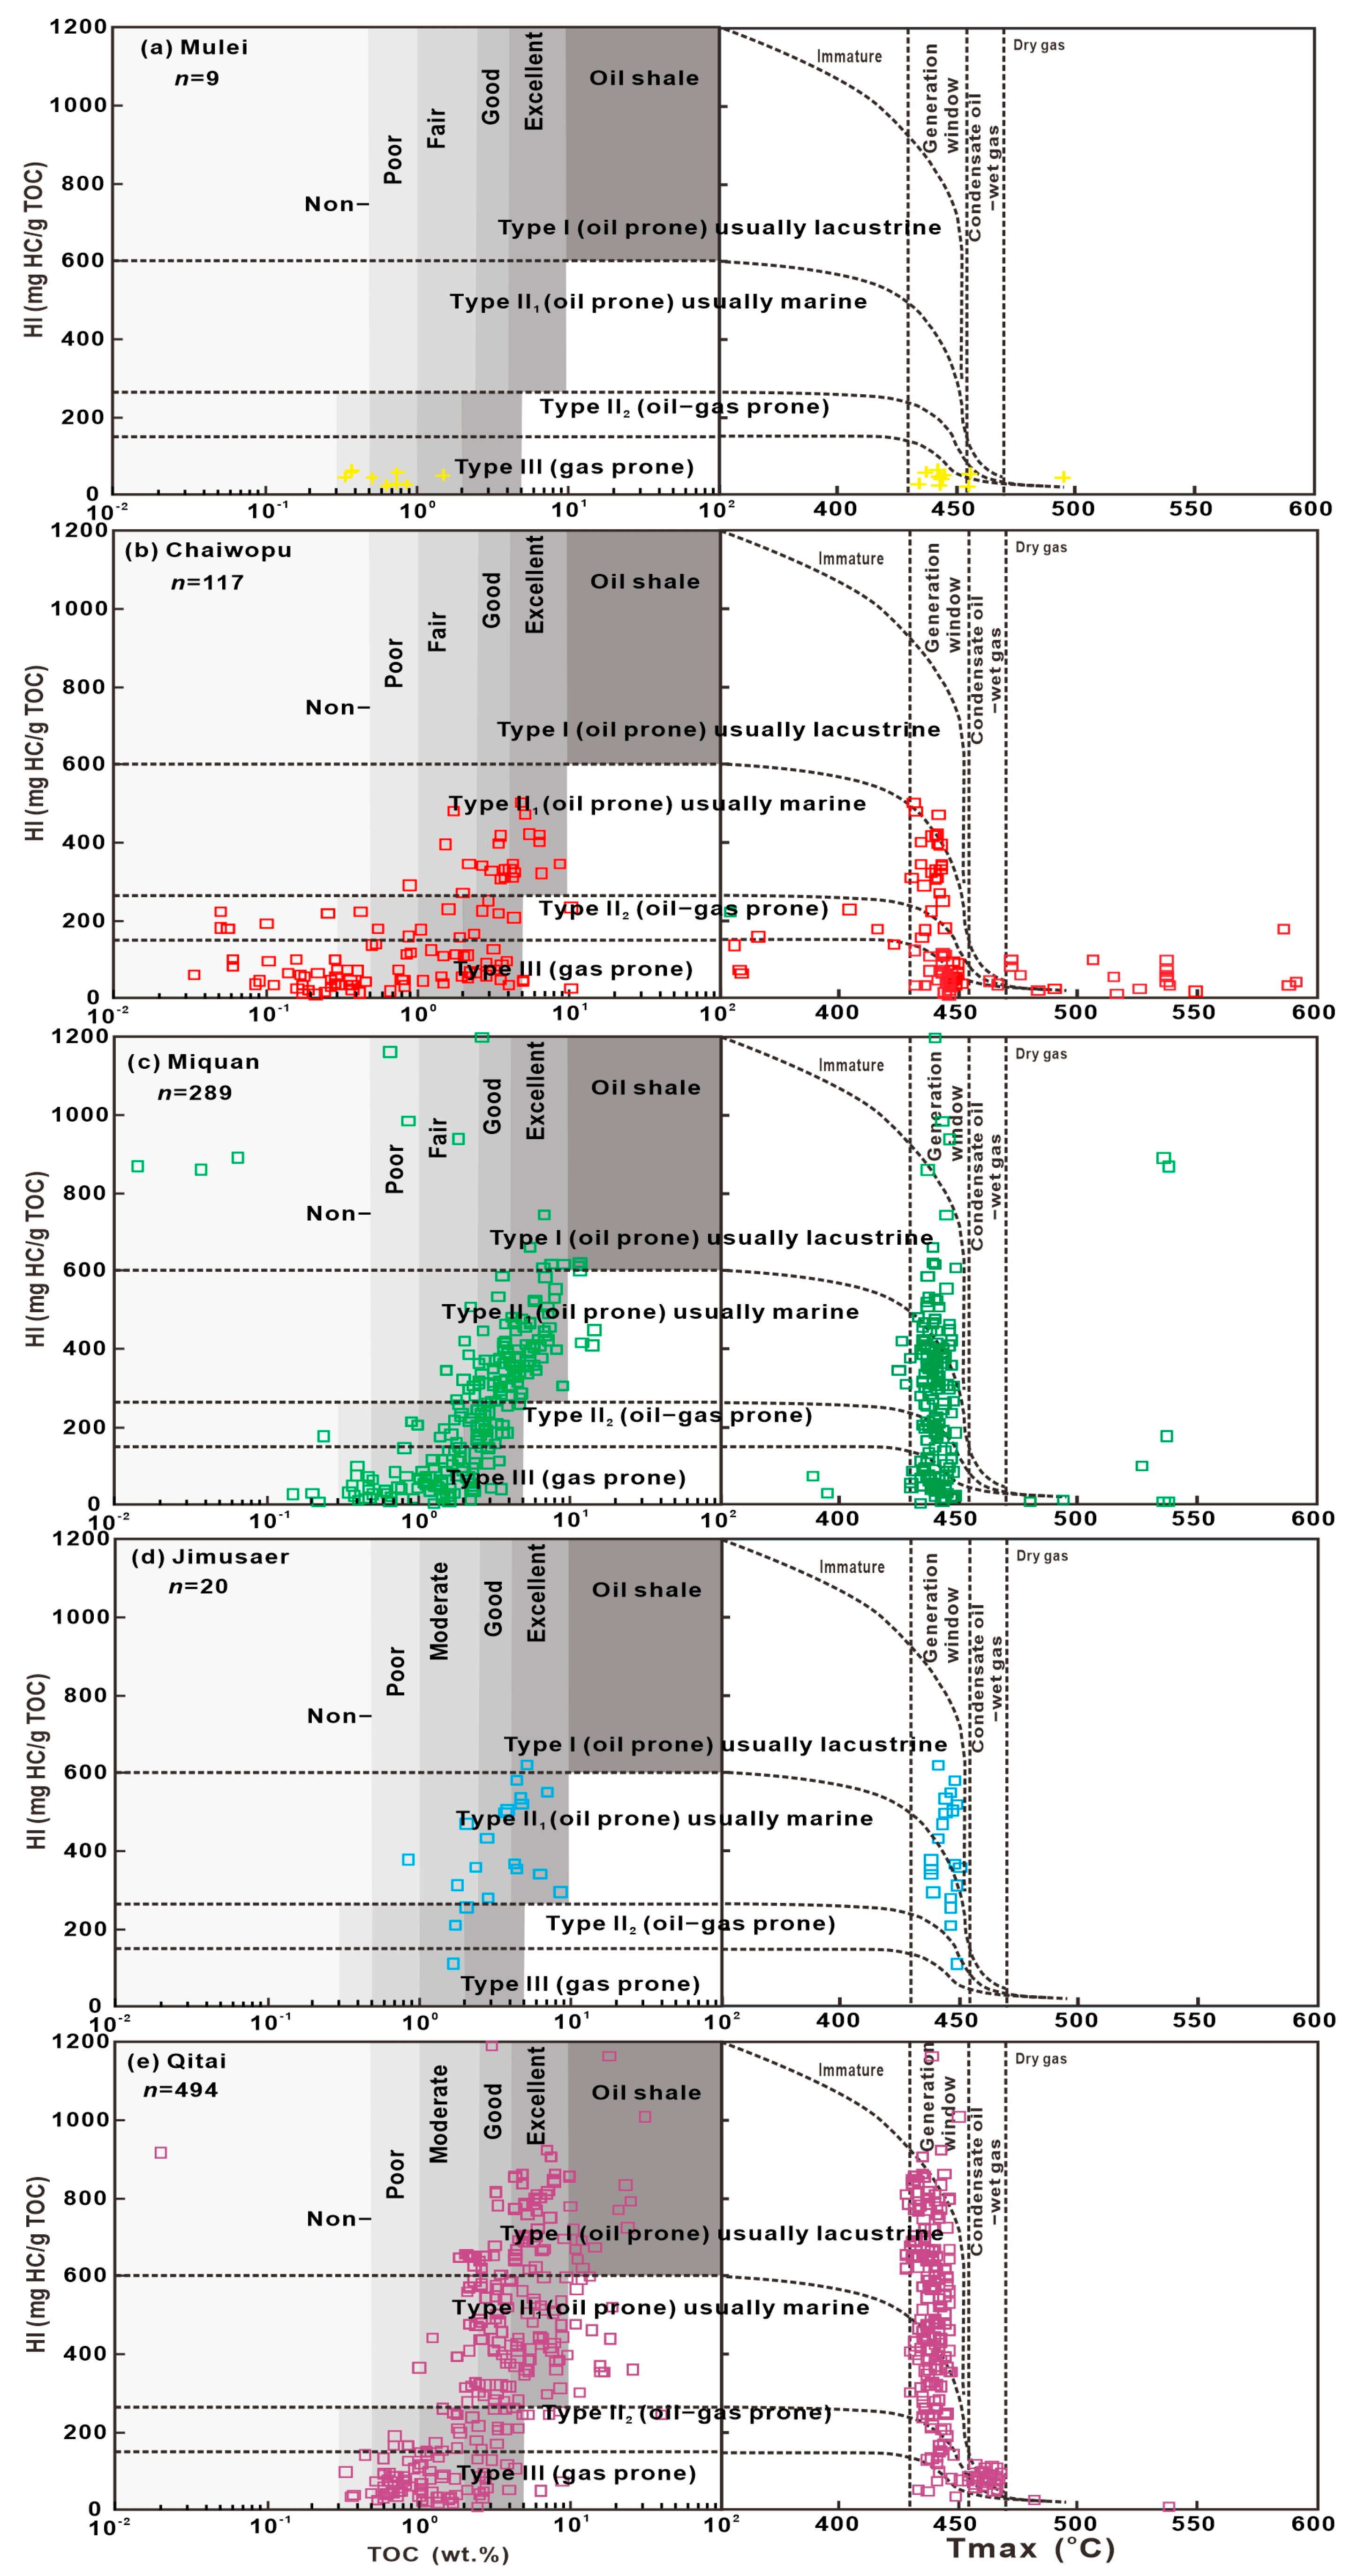
In this study, the organic matter abundance was determined by the plot of TOC versus the HI (mg HC/g rock) (Figure 4) and the boxplots of TOC, hydrocarbon potential (S1 + S2), chloroform bitumen “A”, and the hydrocarbon generation potential index (GPI = (S1 + S2)/TOC) (Figure 5). The geochemical evaluation criteria for terrestrial source rocks are given in Table 1.
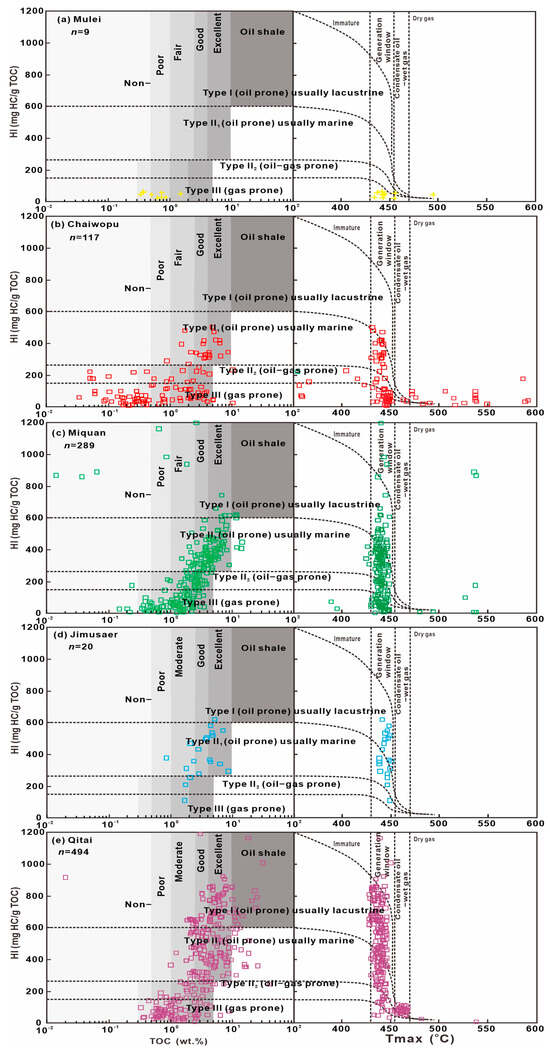
Figure 4.
The cross-plots of TOC versus HI and Tmax versus HI show the differences in kerogen type between different regions of (a) Mulei, (b) Chaiwopu, (c) Miquan, (d) Jimusae, and (e) Qitai.
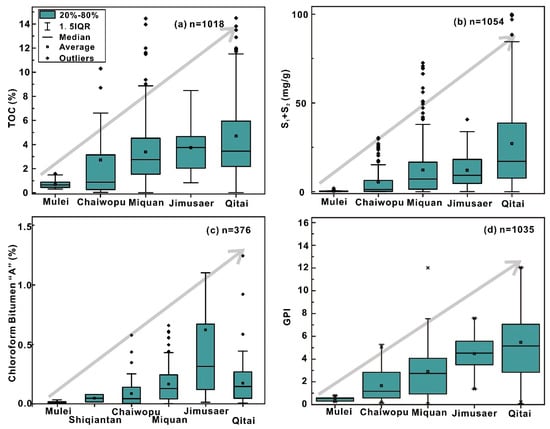
Figure 5.
Boxplots of (a) TOC, (b) S1 + S2, (c) chloroform bitumen “A”, and (d) GPI values show the differences in hydrocarbon generation potential between different regions.

Table 1.
Geochemical evaluation criteria for terrestrial source rocks (SY/T 5735-2019).
The boxplots of TOC, S1 + S2, chloroform bitumen “A”, and GPI indicate a gradual increase in the abundance of organic matter from Mulei to Shiqiantan, Chaiwopu, Miquan, and Qitai. The P2l shale in Qitai, Miquan, and the adjacent area of Jimusaer exhibits higher organic matter abundance compared to the corresponding shale in Mulei, Shiqiantan, and Chaiwopu. In each of the last three areas, the average value of chloroform bitumen “A” is 0.0095, 0.0469, and 0.0868%, respectively. These results suggest that the P2l shale in Mulei, Shiqiantan, and Chaiwopu is a poor to fair source rock with low hydrocarbon generation capacity. On the other hand, the average chloroform bitumen “A” value of the P2l shale in Miquan and Qitai is 0.1679 and 0.1751%, respectively, indicating that most of the P2l shale in these two areas is a good to excellent source rock (Figure 5c). The P2l shale in adjacent Jimusaer has the highest organic matter abundance among the studied sites and a chloroform bitumen “A” content from 0.0150 to 4.6550% (average: 0.6225%). Overall, the values of TOC, S1 + S2, chloroform bitumen “A”, and GPI demonstrate that the P2l shale in Miquan and Qitai has an organic matter abundance equivalent to that in Jimusaer, whereas the P2l shales in Chaiwopu, Shiqiantan, and Mulei have an organic matter abundance much lower than that in Jimusaer.
4.2. Kerogen Type
4.2.1. Organic Elemental Analysis
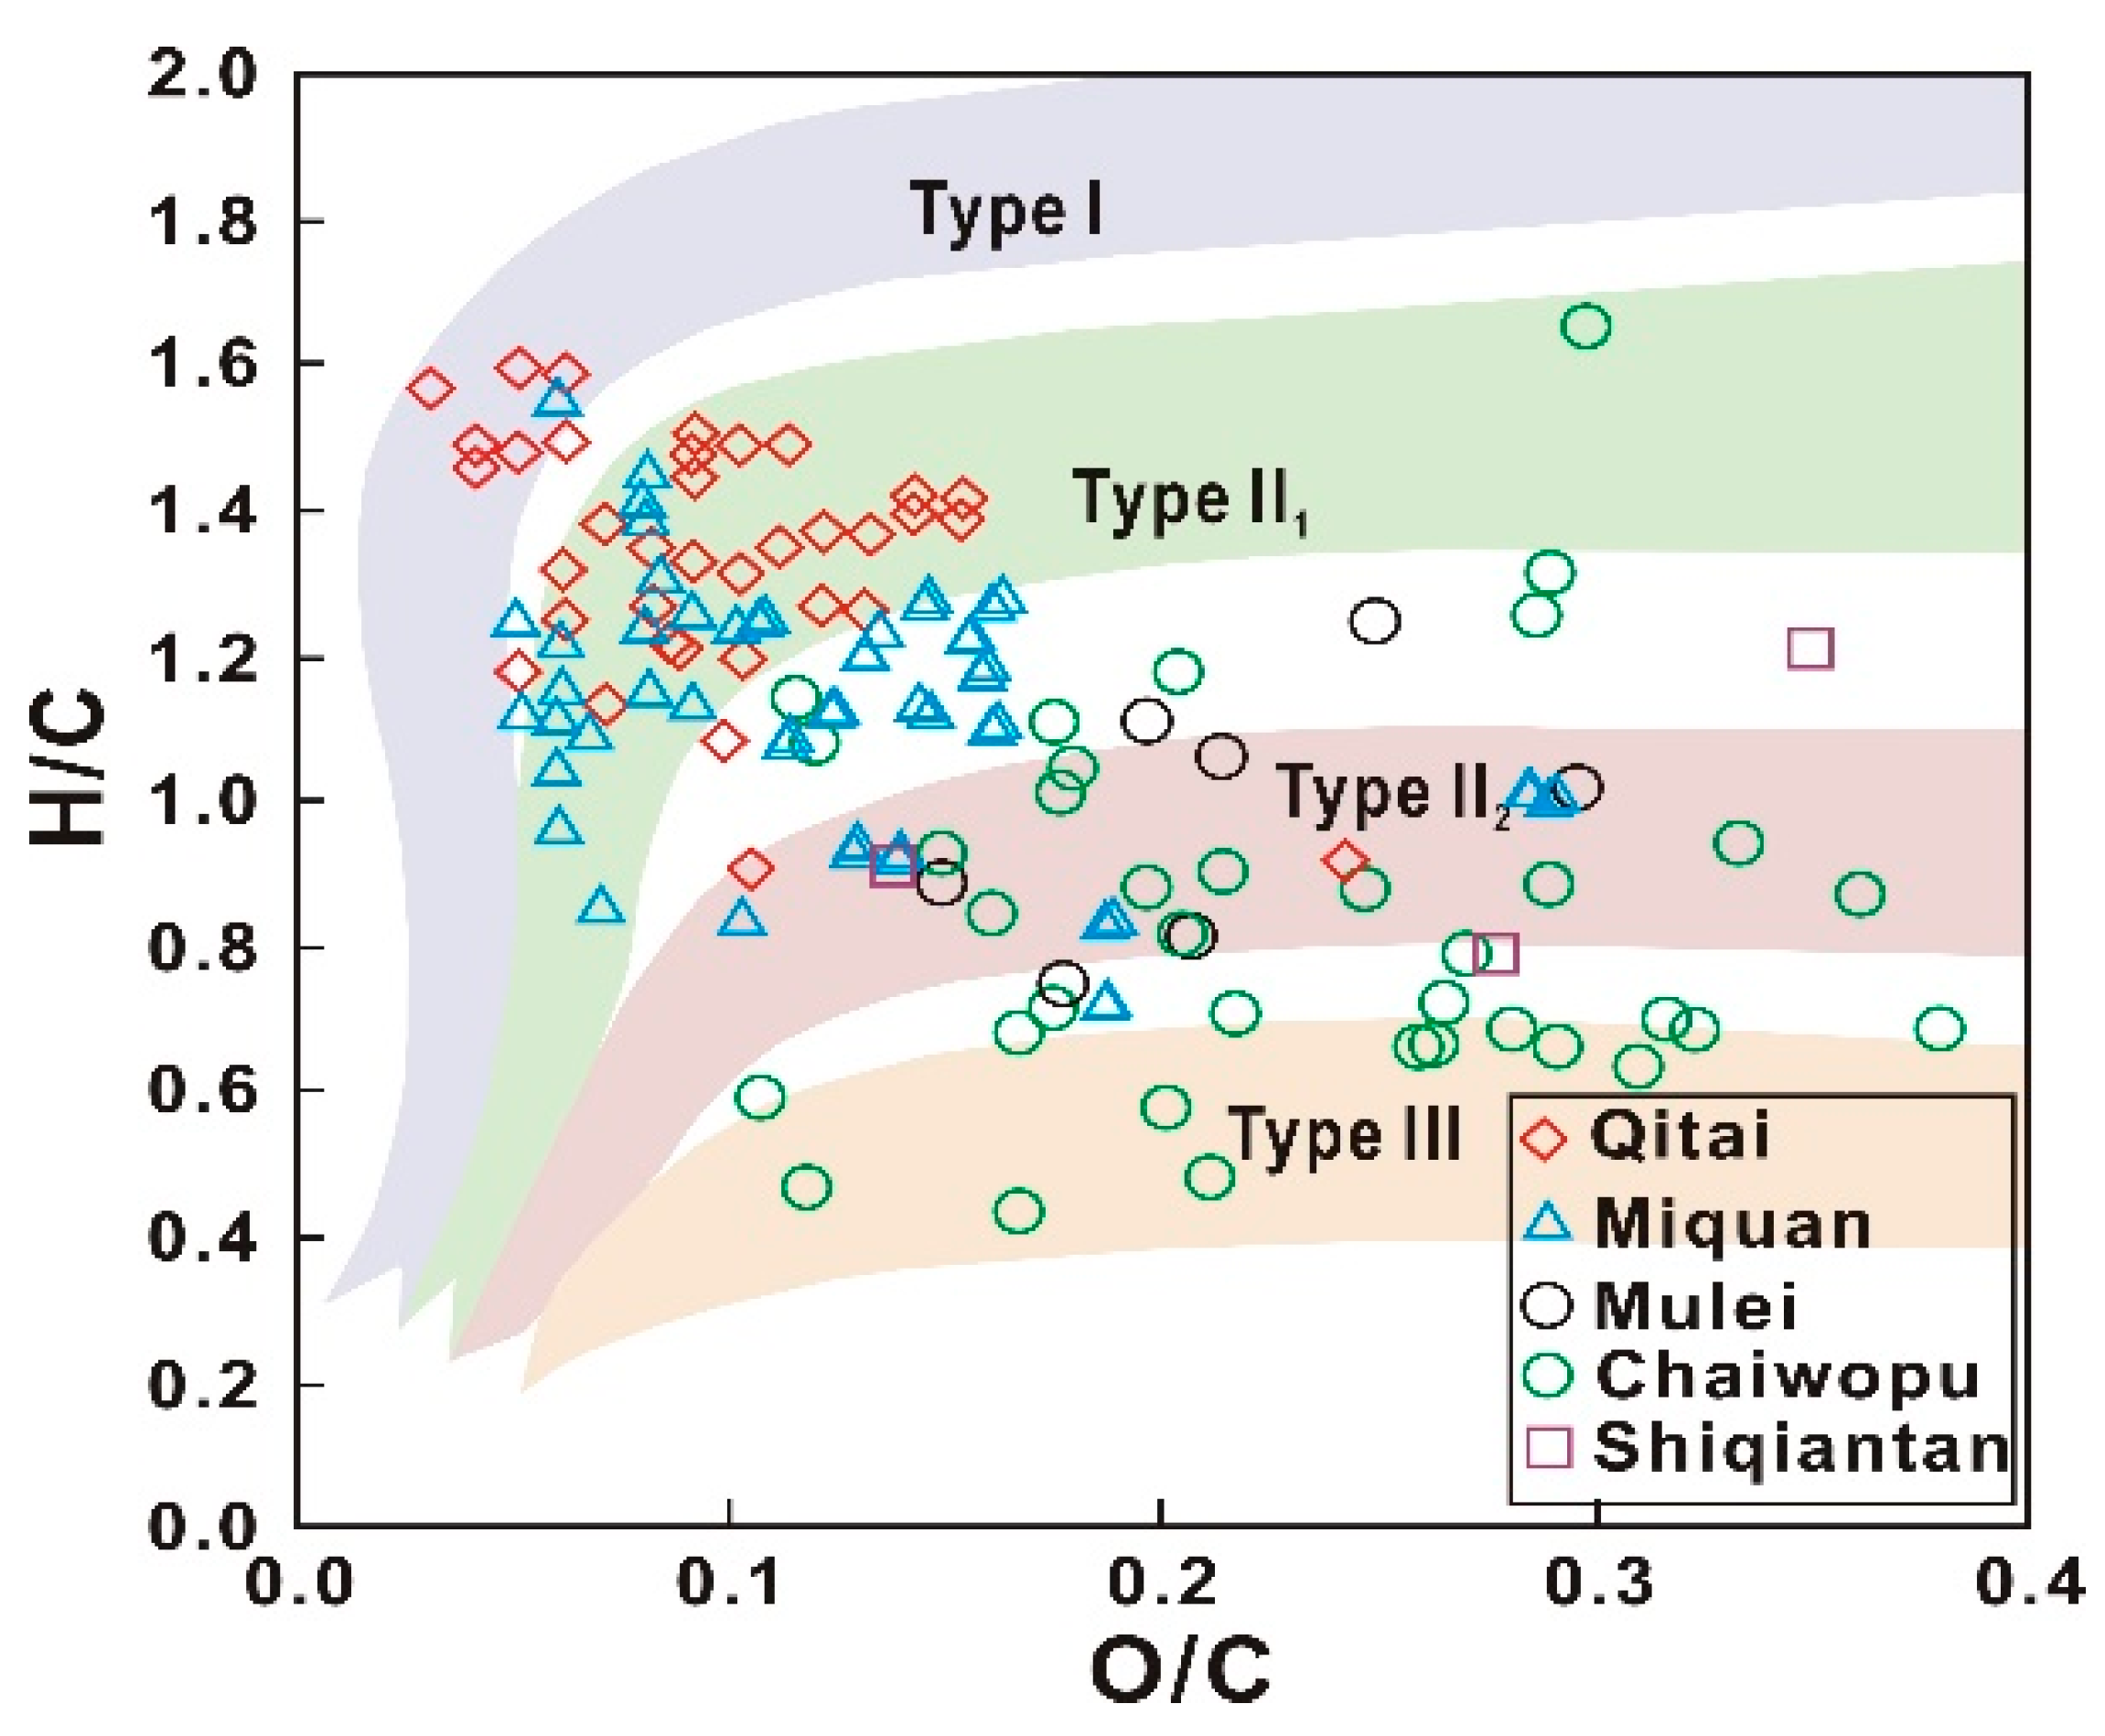
A van Krevelen diagram was employed to analyze the kerogen type in the P2l source rock [25]. As demonstrated by Figure 6 and Table 2, the kerogen in the P2l shale ranges from gas-prone (Type III) to oil-prone (Type I), with Type III–II2 in Chaiwopu, Type II2 in Mulei and Shiqiantan, Type II1–II2 in Miquan, and Type II1–I in Qitai.
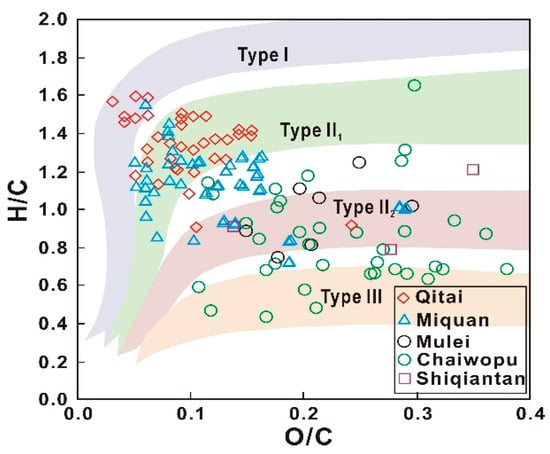
Figure 6.
The cross-plot of O/C versus H/C by elemental analysis shows the differences in kerogen types in different regions.
Table 2.
Comprehensively statistical table of organic element analysis, maceral compositions, vitrinite reflectance, and selected biomarkers of Lucaogou Formation (P2l) in southeastern Junggar Basin to determine the thermal maturity, organic matter (organic matter) abundance, and kerogen type of source rocks. (min~max/avg.(no.)); PI = S1/(S1 + S2); TI (%) = (Sapropelic (%) × 100 + Exinite (%) × 50 − Vitrinite (%) × 75 − Inertinite (%) × 100)/100); GPI = (S1 + S2)/TOC.
4.2.2. Rock Pyrolysis Analysis
The cross-plots of TOC and Tmax versus HI (Figure 4) provide further evidence that in different areas of the southeastern Junggar Basin, the P2l contains different kerogen types. The main types of organic matter in Mulei and Chaiwopu are III and II2–III, which are mainly gas-prone sources. The organic matter in Miquan and Jimusaer is mainly Type II1–III and II1–II2, which are mainly gas- to oil-prone sources, whereas, in Qitai, the organic matter type ranges from I to III (with part of it even being oil shale)—a mixture of gas- and oil-prone sources.
4.2.3. Molecular Biomarker Characteristics
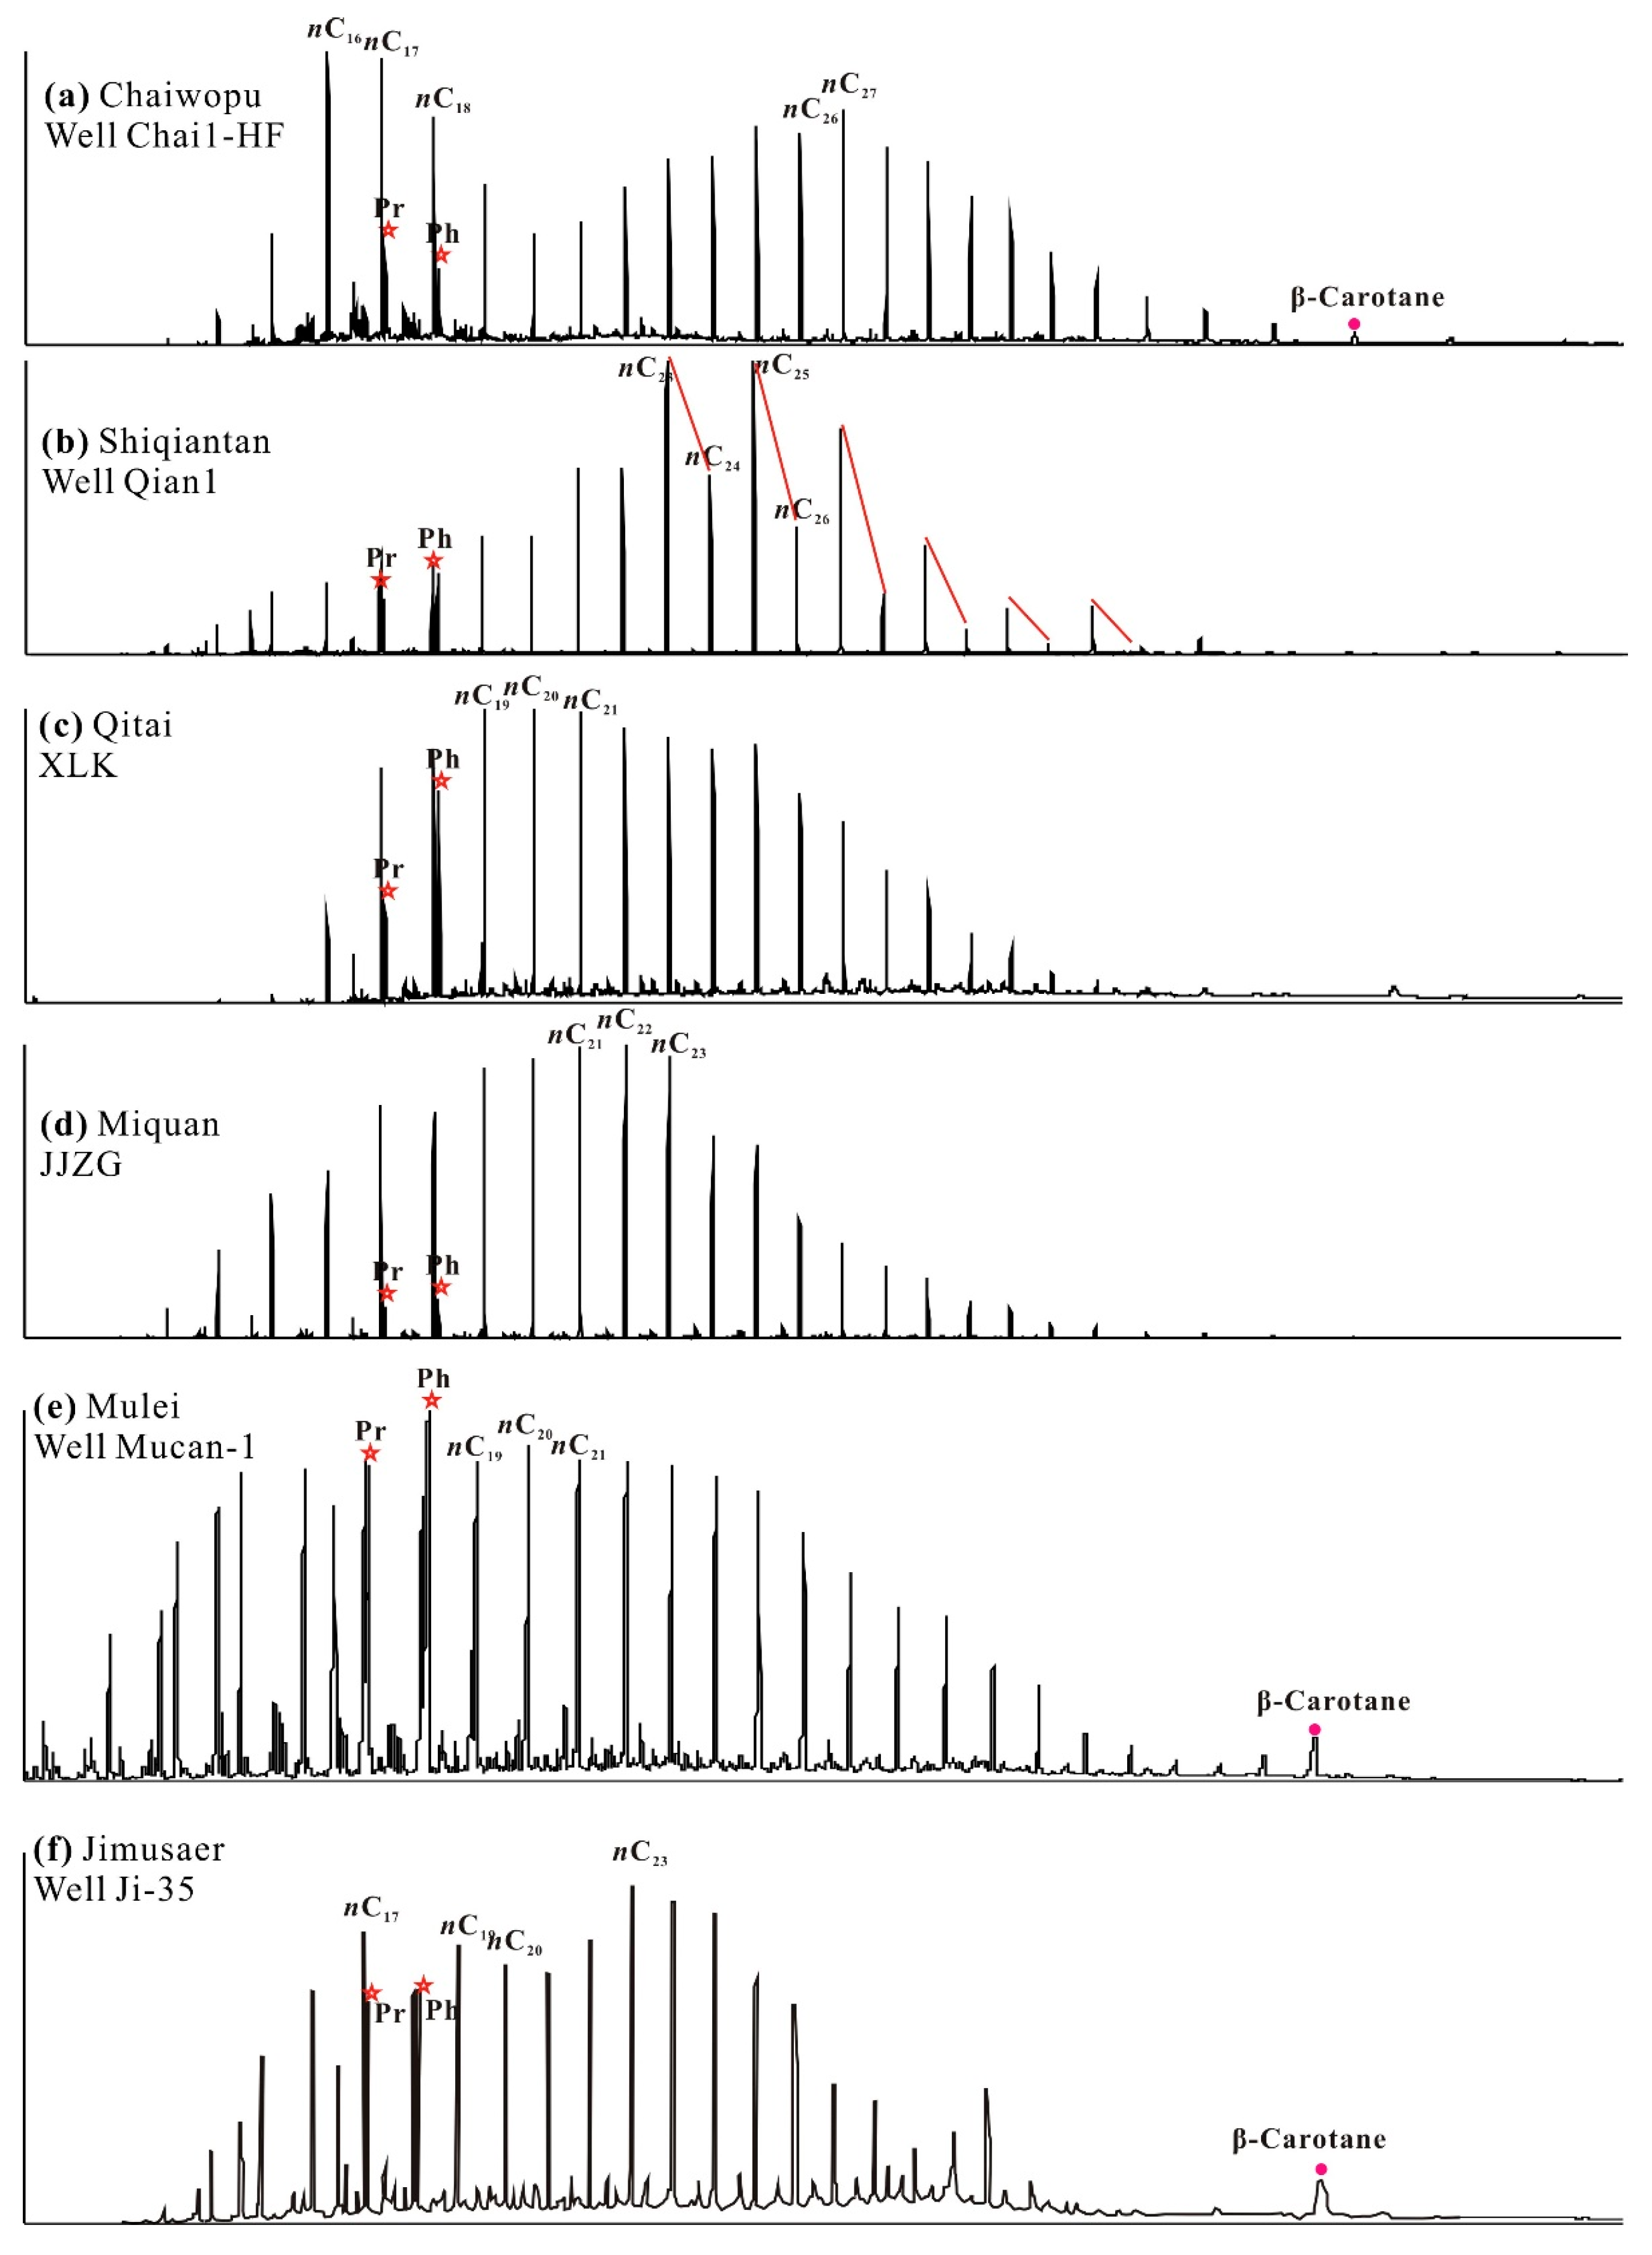
Representative mass chromatograms of n-alkane from core extracts of the studied sites are presented in Figure 7 and Table 2. The n-alkane series observed in Chaiwopu and Mulei exhibit a bimodal distribution, indicating that in these areas, organic compounds in the P2l shale are likely derived from a mixed source of bacteria, algae, and higher plants. The n-alkane series of Qitai and Miquan exhibit an unimodal distribution with a predominance of lower carbon numbers (<C22), suggesting bacterial and algal–detrital sources. β-Carotene is a completely saturated, C40 dicyclic alkane whose presence is commonly associated with algae in anoxic saline lake environments [26,27,28,29]. The P2l shales in Mulei, Chaiwopu, and Jimusaer are rich in β-carotene, suggesting a greater contribution of algae to the generation of oil in these areas (Figure 7a,e,f). In addition, the strong odd–even predominance implies that the source rocks in the Shiqiantan area are still in the low-maturity stage (Figure 7b).
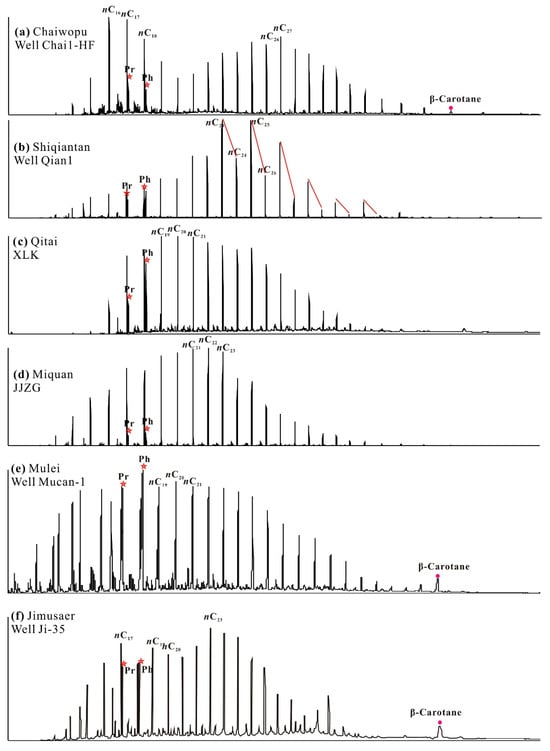
Figure 7.
Mass chromatograms (m/z 85) show the distributions of n-alkanes of different regions of (a) Chaiwopu, (b) Shiqiantan, (c) Qitai, (d) Miquan (e) Mulei and (f) Jimusaer.
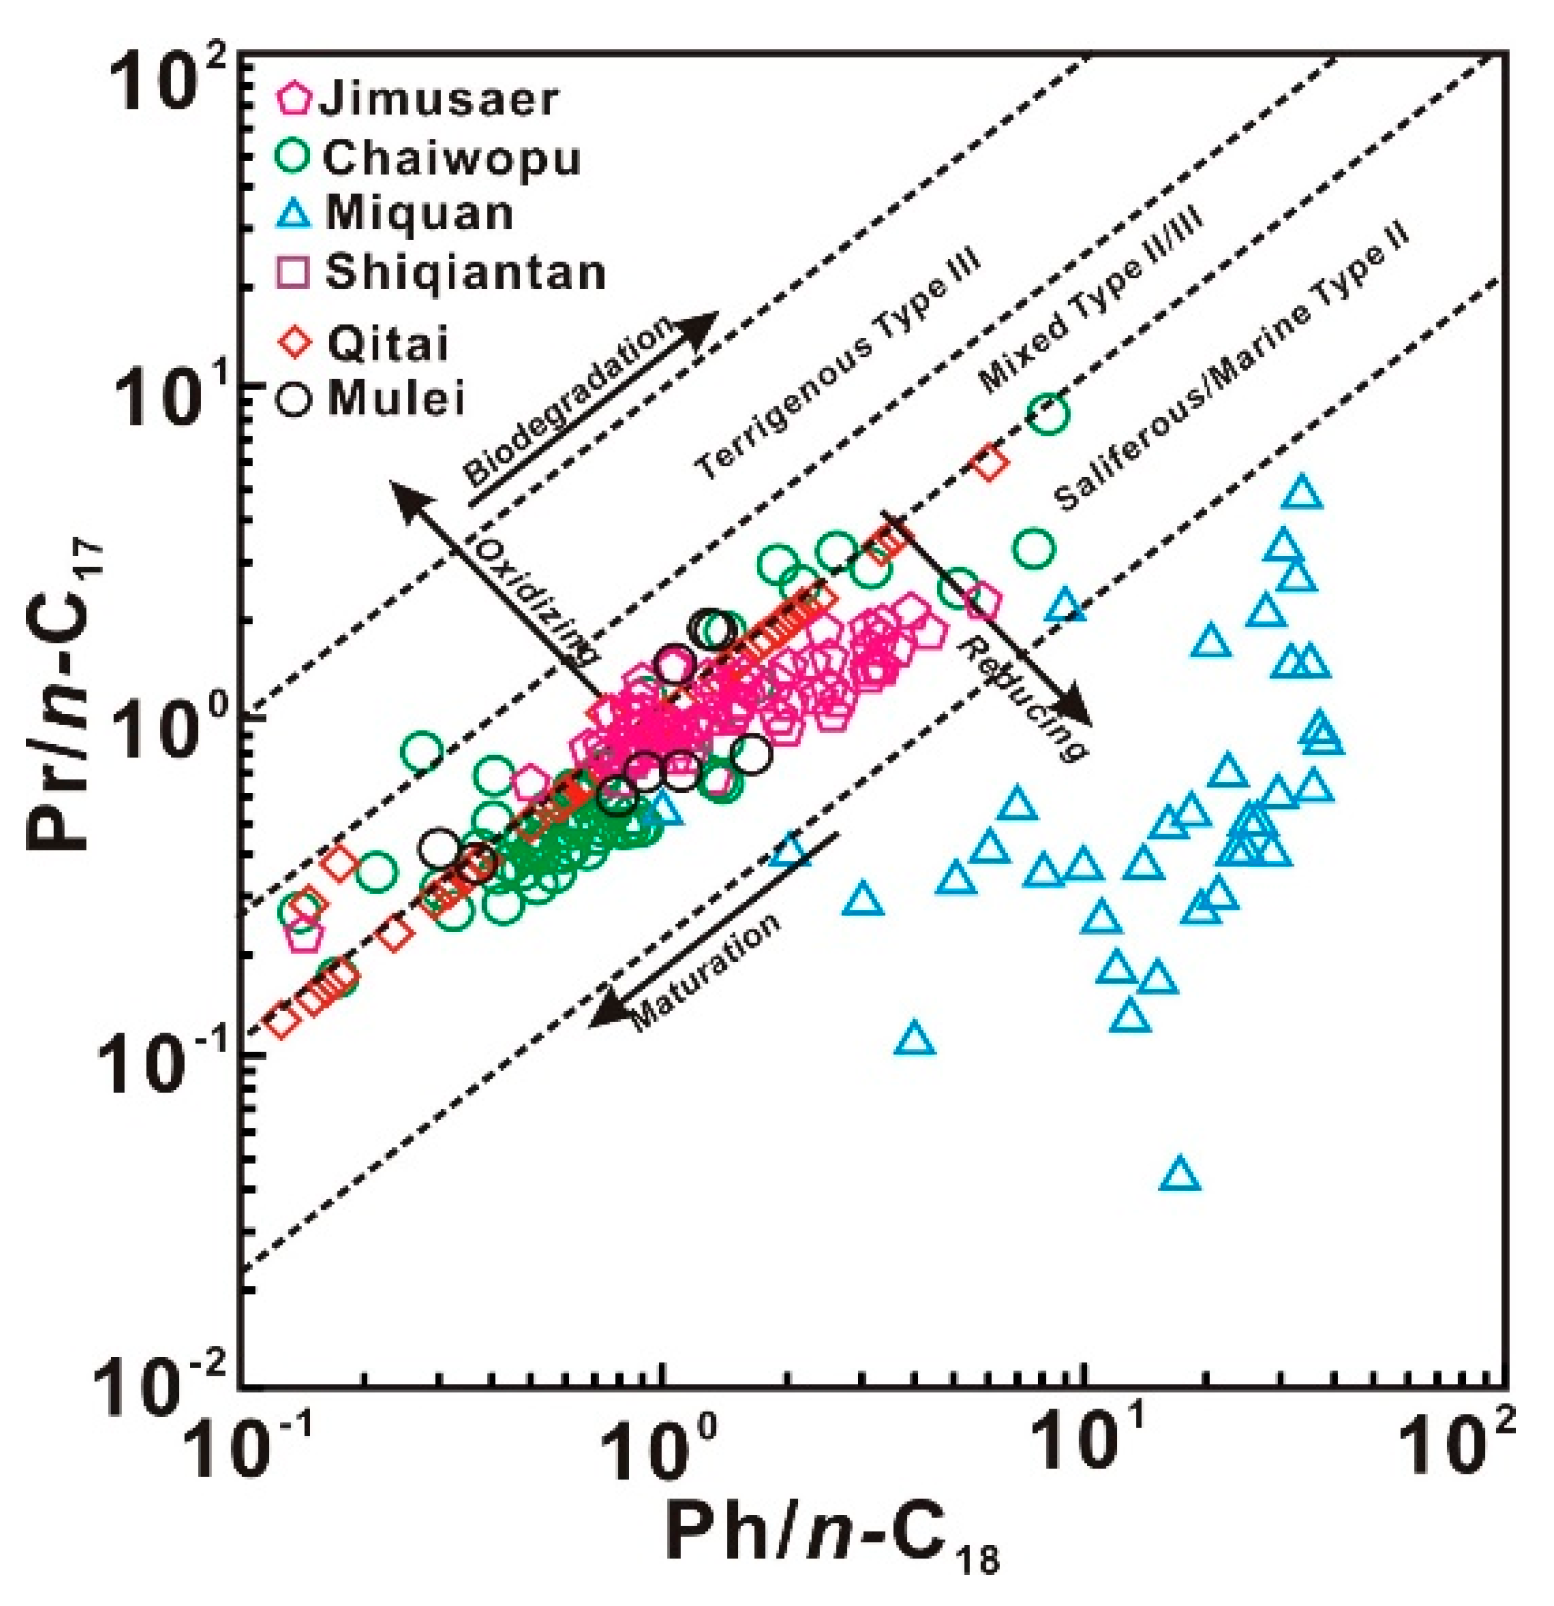
The Pr/n-C17 versus Ph/n-C18 cross-plot provides valuable insights into the organic matter sources and paleoenvironmental conditions [30,31,32]. This relationship indicates that in Qitai, Chaiwopu, Jimusaer, and Mulei, the P2l received a predominantly mixed input of organic matter (Type II–III). Most samples from Miquan fell within the saliferous (Type II) organic matter zone (Figure 8), indicating that in the southeastern Junggar Basin, the P2l source rocks originated from a saliferous terrigenous environment [33]. Reference [11] found that the δ13C values of the P2p in the eastern Junggar Basin and P2l in the southern Junggar Basin were mainly lower than −26.0‰. This indicates the organic matter in the P2l shale had a predominately aquatic origin, with only minor input from terrestrial organisms.
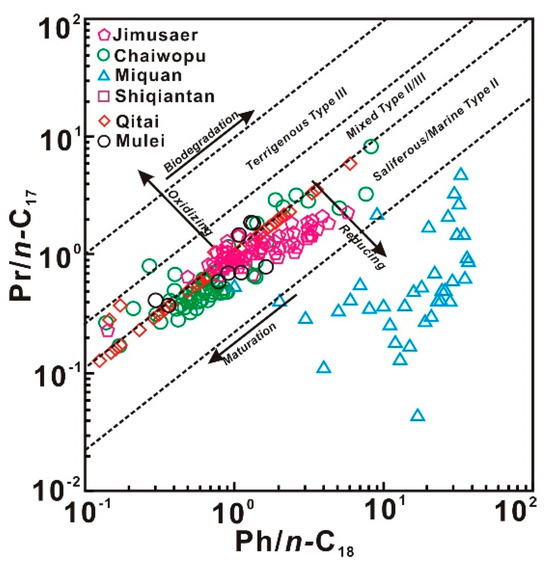
Figure 8.
The cross−plot of Ph/n-C18 versus Pr/n-C17 shows the differences in paleo−environmental and source interpretation between different regions.
4.2.4. Organic Petrology
Based on analysis of optical properties and genetic characteristics conducted through organic petrological analysis, the maceral composition is distinguished into several types (liptinite, vitrinite, inertinite, matrix-bituminite), each corresponding to a distinct kerogen typology [34,35].
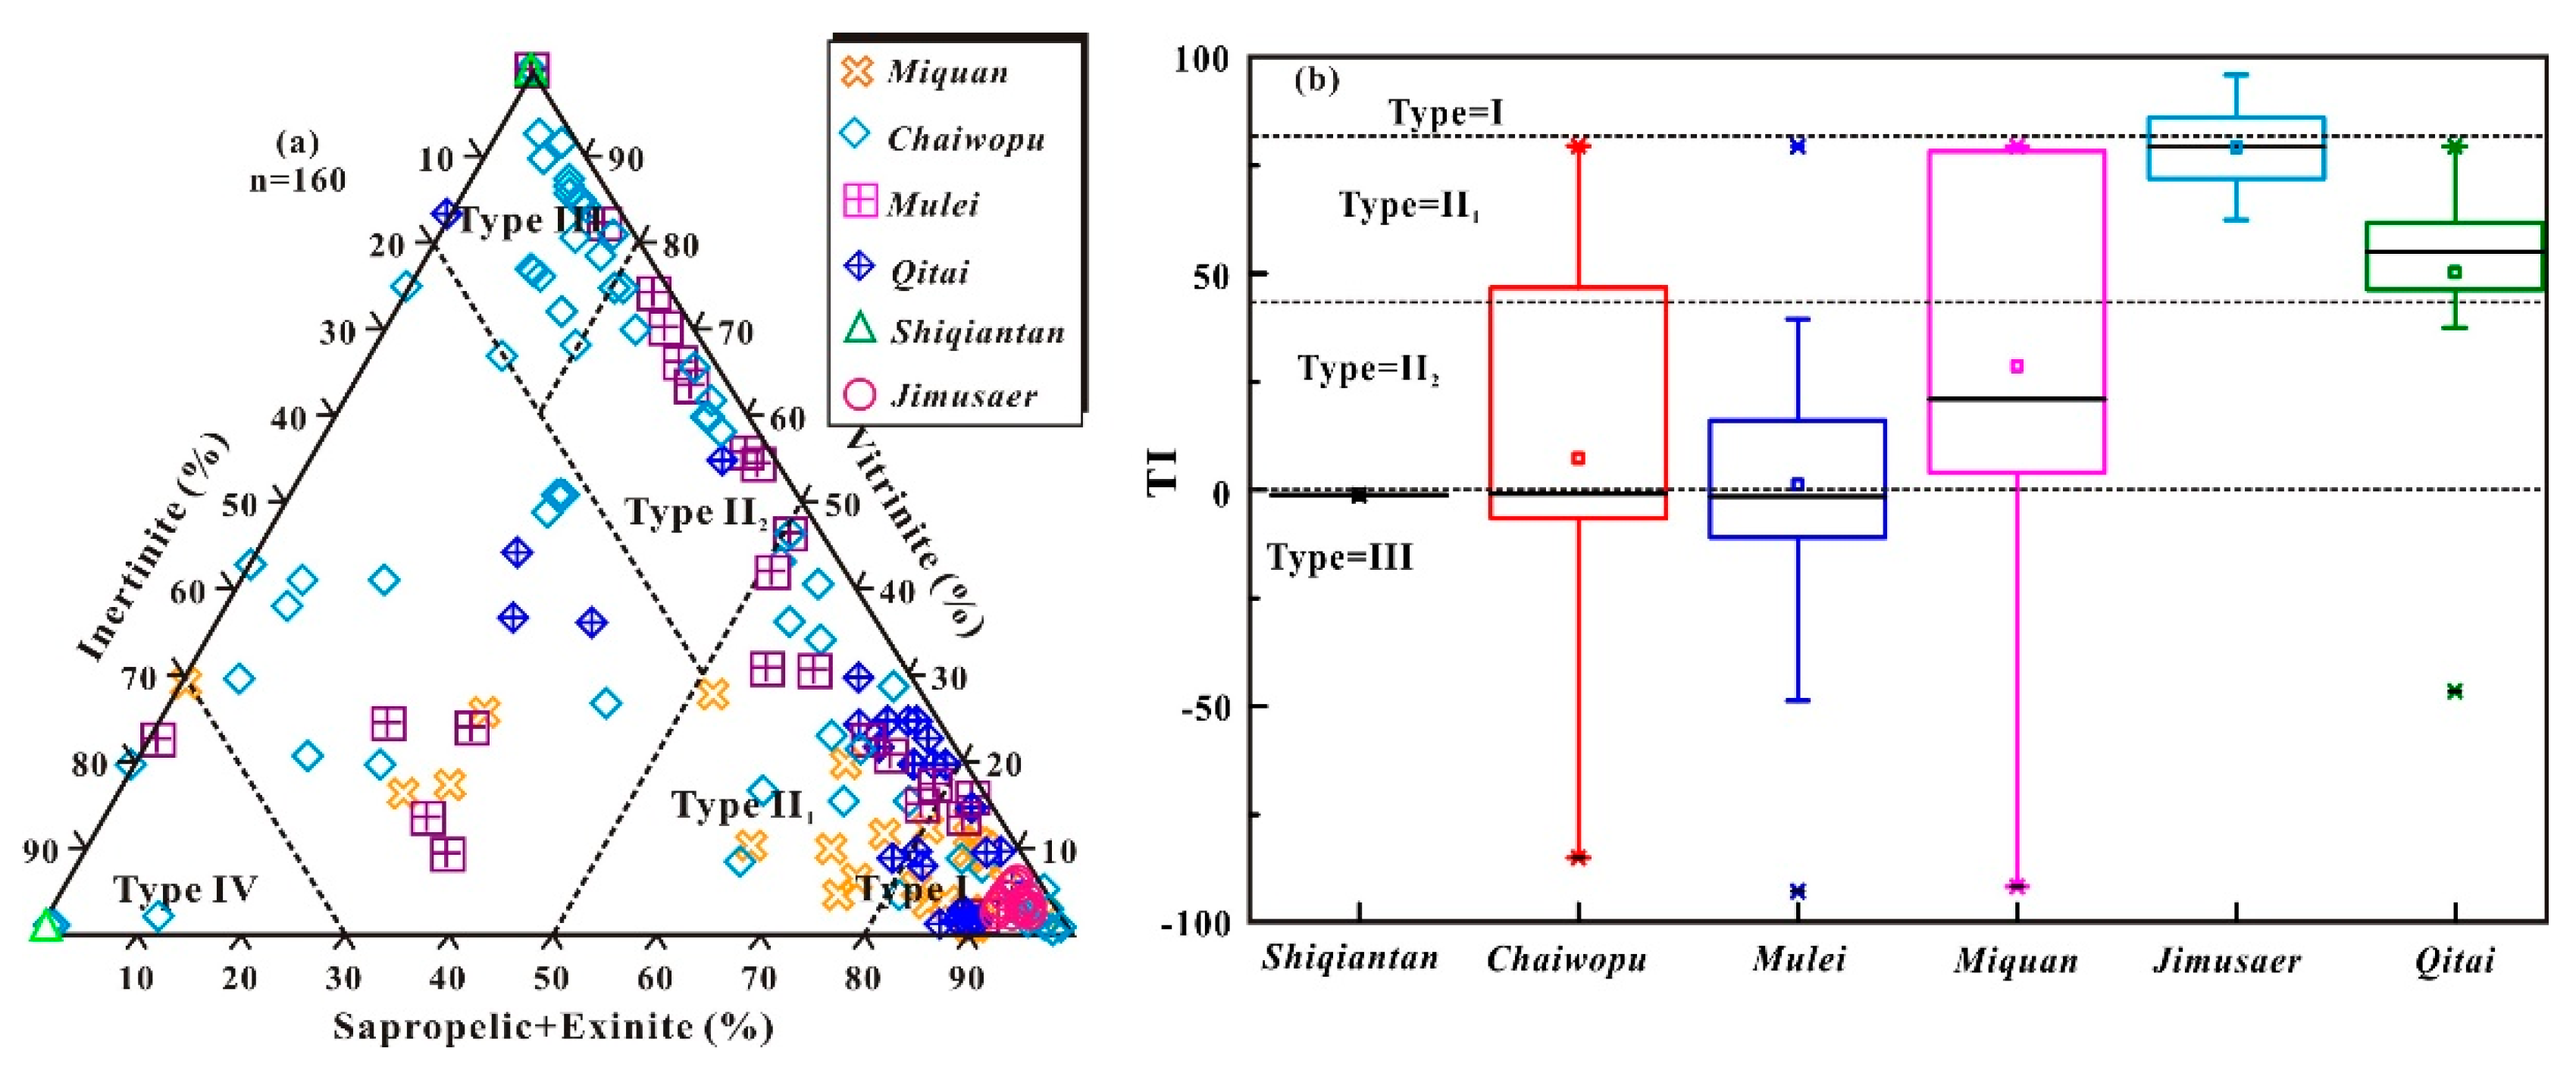
The ternary maceral plot and the boxplot of the kerogen type index (TI) demonstrate that the kerogen type in the P2l shale varies across the southern Junggar Basin, from gas-prone Type III to oil-prone Type I; the P2l shale is characterized by Type III–II2 kerogen in Chaiwopu, Type II2 kerogen in Mulei and Shiqiantan, Type II1–II2 kerogen in Miquan, and Type II1–I kerogen in Qitai (Figure 9 and Table 2).
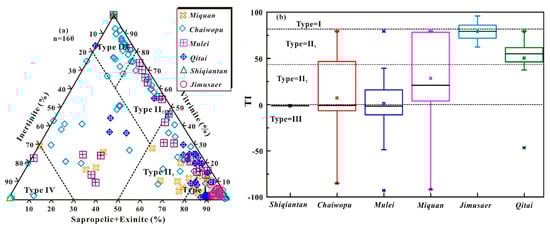
Figure 9.
(a) The ternary plot of the organic maceral and (b) the boxplot of kerogen type index (TI) show the differences in kerogen type between different regions (some data cited from Reference [3]; TI (%) = (Sapropelic (%) × 100 + Exinite (%) ×50 − Vitrinite (%) × 75 − Inertinite (%) × 100)/100). The * in the box-plot represents outlier.
As illustrated in Table 2 and Figure 9a,b, vitrinite and inertinite are the dominant maceral compositions in the P2l shale of Shiqiantan, Mulei, and Chaiwopu. The average kerogen TI values for these areas are −1.13, 1.13, and 7.28, respectively, indicating mainly Type III (TI < 0.0) and Type II2 kerogen (TI < 40.0). In Miquan and Qitai, the dominant maceral composition of the P2l shale is liptinite, with average kerogen TI values of 28.58 and 50.23, respectively, belonging to Type II1 (40.0 < TI < 80.0) and a small amount of Type I kerogen (TI > 80.0), which are equivalent to the that of Jimusaer Sag (average on 77.25).
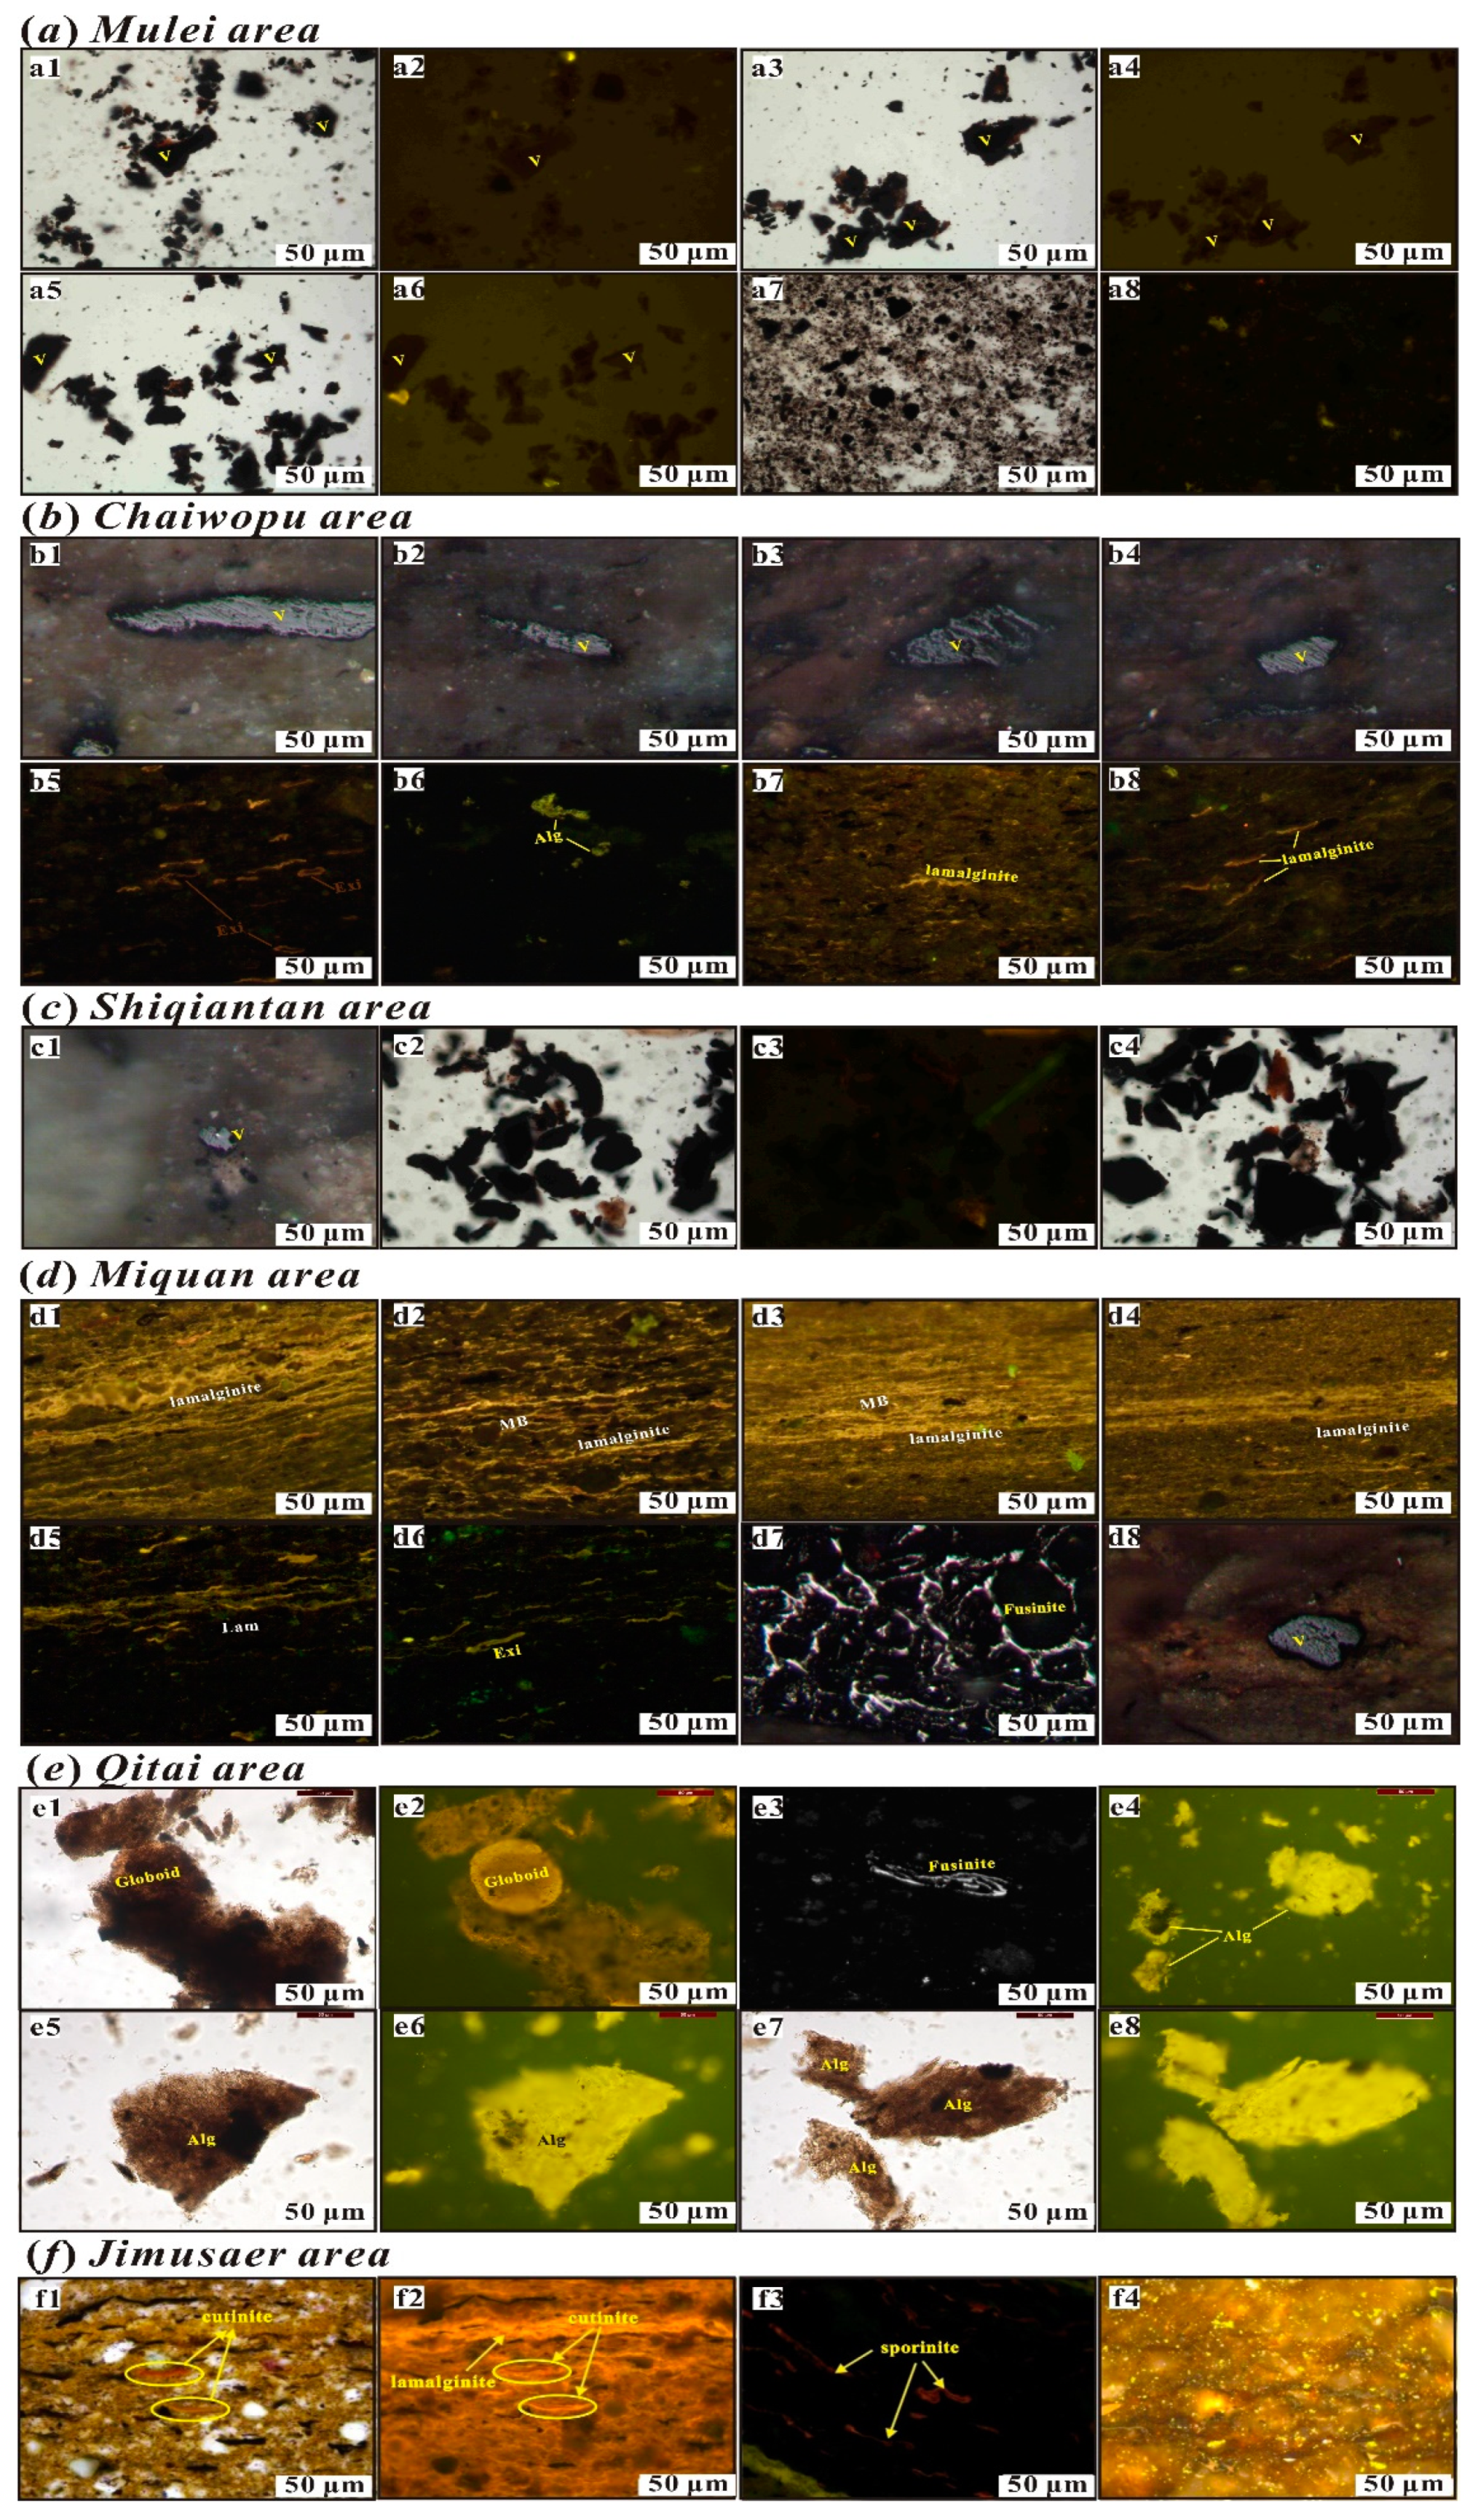
Representative photomicrographs show that in Mulei, Shiqiantan, and Chaiwopu, the maceral composition of the P2l shale is characterized by massive-detrital, grey, homogeneous vitrinite with no fluorescence (Figure 10a–c). Some alginite and lamalginite with yellow fluorescence can be observed in Chaiwopu. In Qitai and Miquan, the maceral composition is primarily comprised of liptinite, including filamentous algae, sporophyte, and lamalginite with yellow fluorescence, fusinite with white fluorescence, and matrix-bituminite with orange fluorescence (Figure 10d,e). These observations demonstrate that the P2l in the Qitai and Miquan areas contains kerogen of a type more advantageous than that of the P2l in Mulei, Shiqiantan, and Chaiwopu.
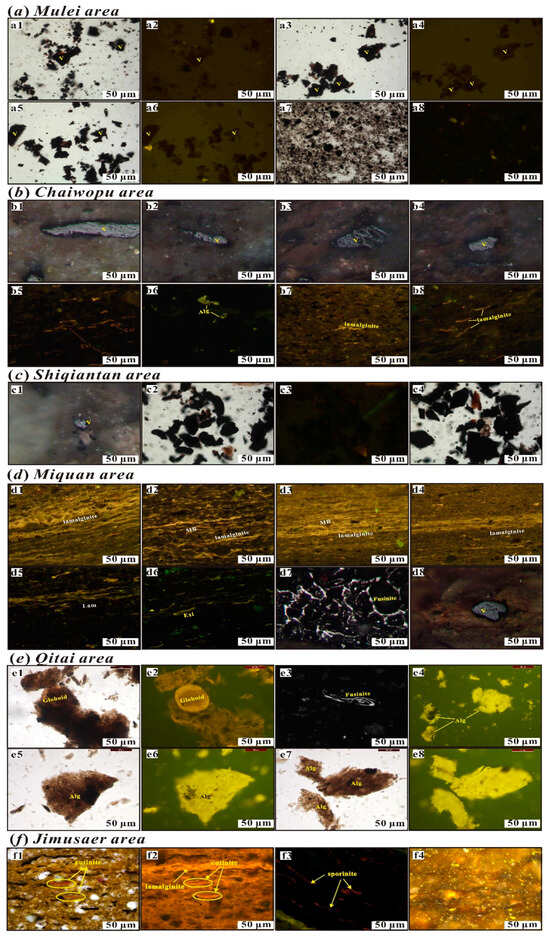
Figure 10.
Representative photomicrographs show the maceral composition of the P2l Formation in different regions using transmitted light, reflected white light, and fluorescence blue light. Conditions: polished thin section, immersion oil objective, 500× (Notes: V: vitrinite; Alg: alginite; Exi: exinite). (a) Mulei, (b) Chaiwopu, (c) Shiqiantan, (d) Miquan, (e) Qitai, and (f) Jimusae.
Previous studies found that the maceral composition of the P2l shale in Jimusaer comprises mainly amorphous saprolite, fungus sporophyte, sporopollen, and suberinite, with a lower content of vitrinite and inertinite. The main kerogen types are I and II1 (Figure 10f; [6,7]). Our analysis further confirms that the kerogen type of the Miquan and Qitai P2l shale is equivalent to that of the Jimusaer P2l shale, whereas the kerogen type of the Chaiwopu and Mulei P2l shale is of much lower quality.
4.3. Thermal Maturity
The boxplots of vitrinite reflectance (Ro, %) and maximum pyrolysis peak temperature (Tmax) reveal that in the sampled areas, the thermal maturity of the organic matter is distributed as follows (in ascending order): Qitai (Ro = 0.46–1.24%; average: 0.78%), Miquan (Ro = 0.40–1.38%; average: 0.68%), Shiqiantan (Ro = 0.55–1.19%; average: 0.96%), Mulei (Ro = 0.60–1.06%; average: 0.86%), and Chaiwopu (Ro = 0.60–1.71%; average: 1.082%) (Figure 11a, Table 2). Additionally, Tmax values indicate that in Chaiwopu and Mulei, the P2l shale has reached the mature–highly mature stage, whereas in Shiqiantan, Miquan, and Qitai (Figure 11b, Table 2), it is in the early mature–mature stage (very low Tmax values). The Ro and Tmax boxplots demonstrate that the thermal maturity of the P2l shale is equivalent to that in Jimusaer (Ro = 0.52–1.24%; average: 0.74%) in Miquan and Qitai; whereas that in Chaiwopu and Mulei, it is much higher.
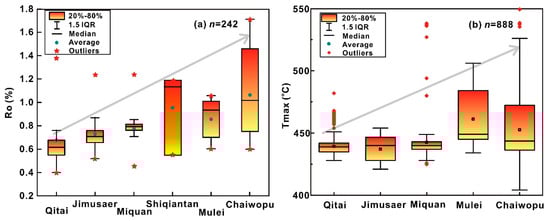
Figure 11.
Boxplots of (a) vitrinite reflectance (Ro) and (b) maximum pyrolysis peak temperature (Tmax) show the differences in thermal maturity between different regions.
It is widely accepted that the ratio of isomers effectively reflects the thermal maturity of the organic matter [36,37,38]. In this study, the cross-plots of C29 RS ββ/(αα + ββ) versus C29 RS 20S/(20S + 20R) were used to characterize the thermal maturity (Figure 12). The analysis reveals that the majority of P2l samples from Miquan, Shiqiantan, Jimusaer, and Qitai fall within the early mature–mature zone, whereas those from Mulei and Chaiwopu show abnormal post-maturity, potentially due to weathering and oxidation.
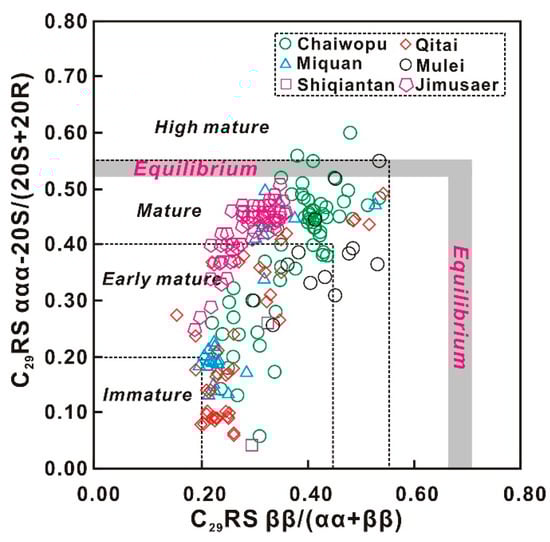
Figure 12.
Selected biomarkers for determining the thermal maturity of different regions in the southeastern Junggar Basin.
4.4. Kinetics of Petroleum Generation
As mentioned above, the vitrinite reflectance and Tmax (430–445 °C) indicate that the majority of the samples were in a range from thermally immature to mature. Therefore, these samples were deemed suitable for investigating petroleum generation kinetics [7,39]. The bulk kinetic parameters (activation energy, Ea, and frequency factor, A) for the kerogen-to-hydrocarbon conversion were calculated from a mathematical routine [7,24,39,40,41,42]. Assuming parallel first-order reactions with the same frequency factor and activation energy, different heating rates were employed to achieve optimal conversion. The optimal results were the ones that presented the best fit between the calculated and experimental curves. Eighteen samples of P2l mudstone and shale of different maturity and from different southeastern Junggar Basin sites were chosen for this analysis (Table 3).
Table 3.
Eighteen mudstone and shale samples with different maturities and regions were chosen for kinetics of petroleum generation analysis of P2l in the southeastern Junggar Basin.
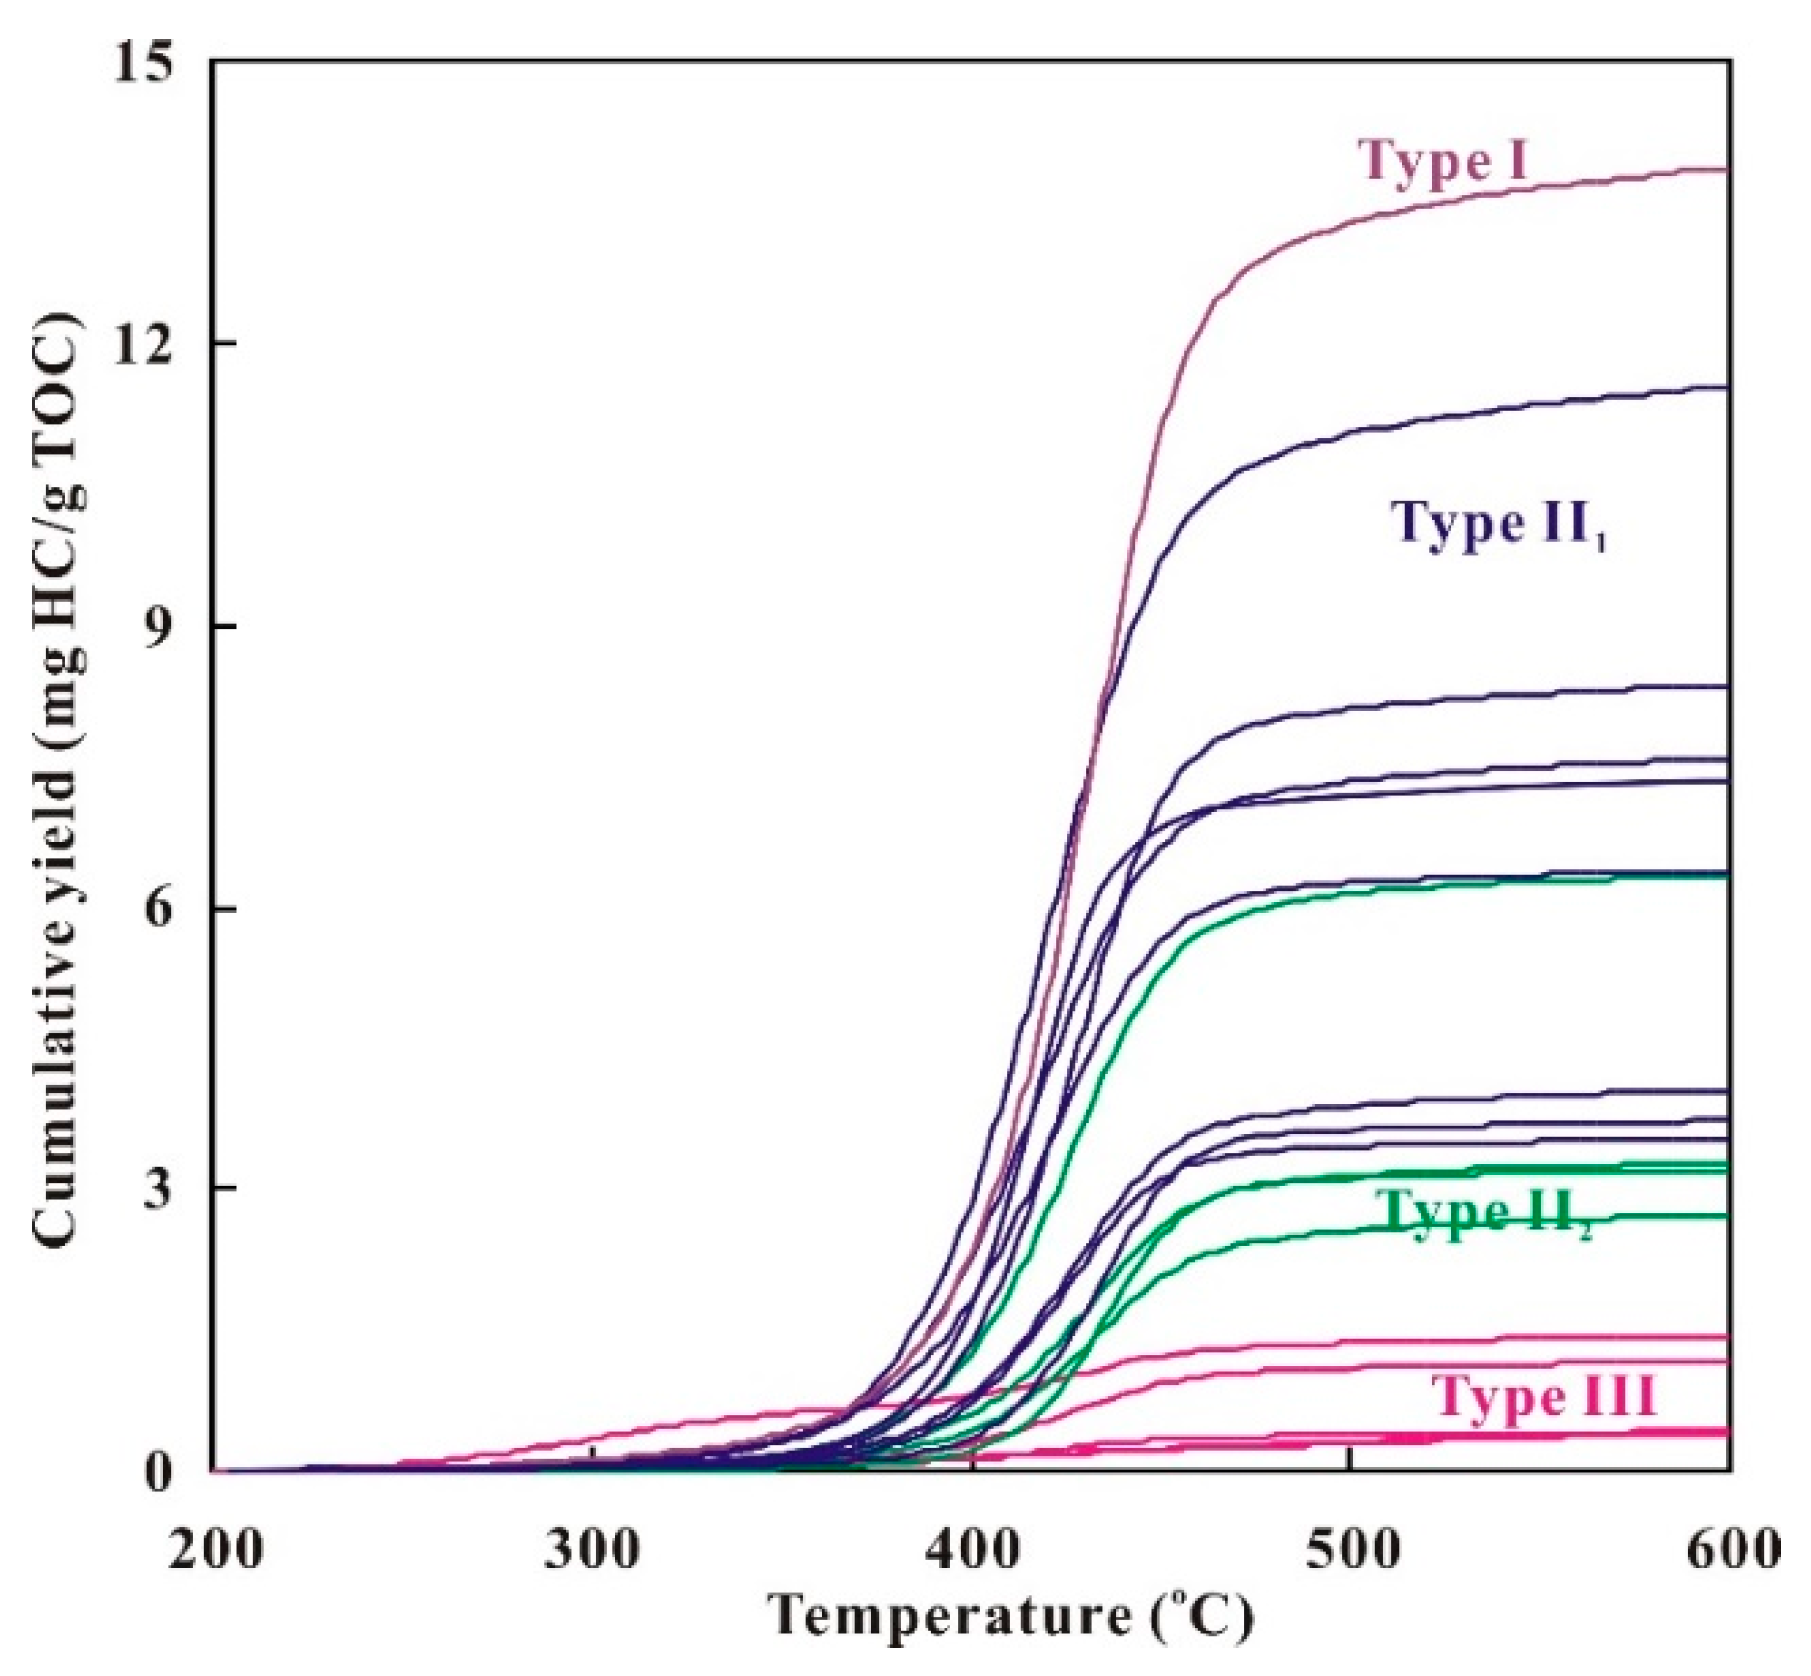
Figure 13 shows the values obtained from the parallel first-order reaction model, with a heating rate of 30 °C. The model fit curves for all the data are given in Table 3. The maximum yield of hydrocarbon generation ranged from 10 to 40 mg/g and varied between different types of organic source rock and across the sampled sites. As seen in Figure 13, the order of maximum hydrocarbon generation yield was as follows: Type I > Type II1 > Type II2 > Type III (Table 3).

Figure 13.
Experimental data of the calculated best-fit curve based on kinetic parameters for the hydrocarbon generation at the heating rate of 30 °C from this study.
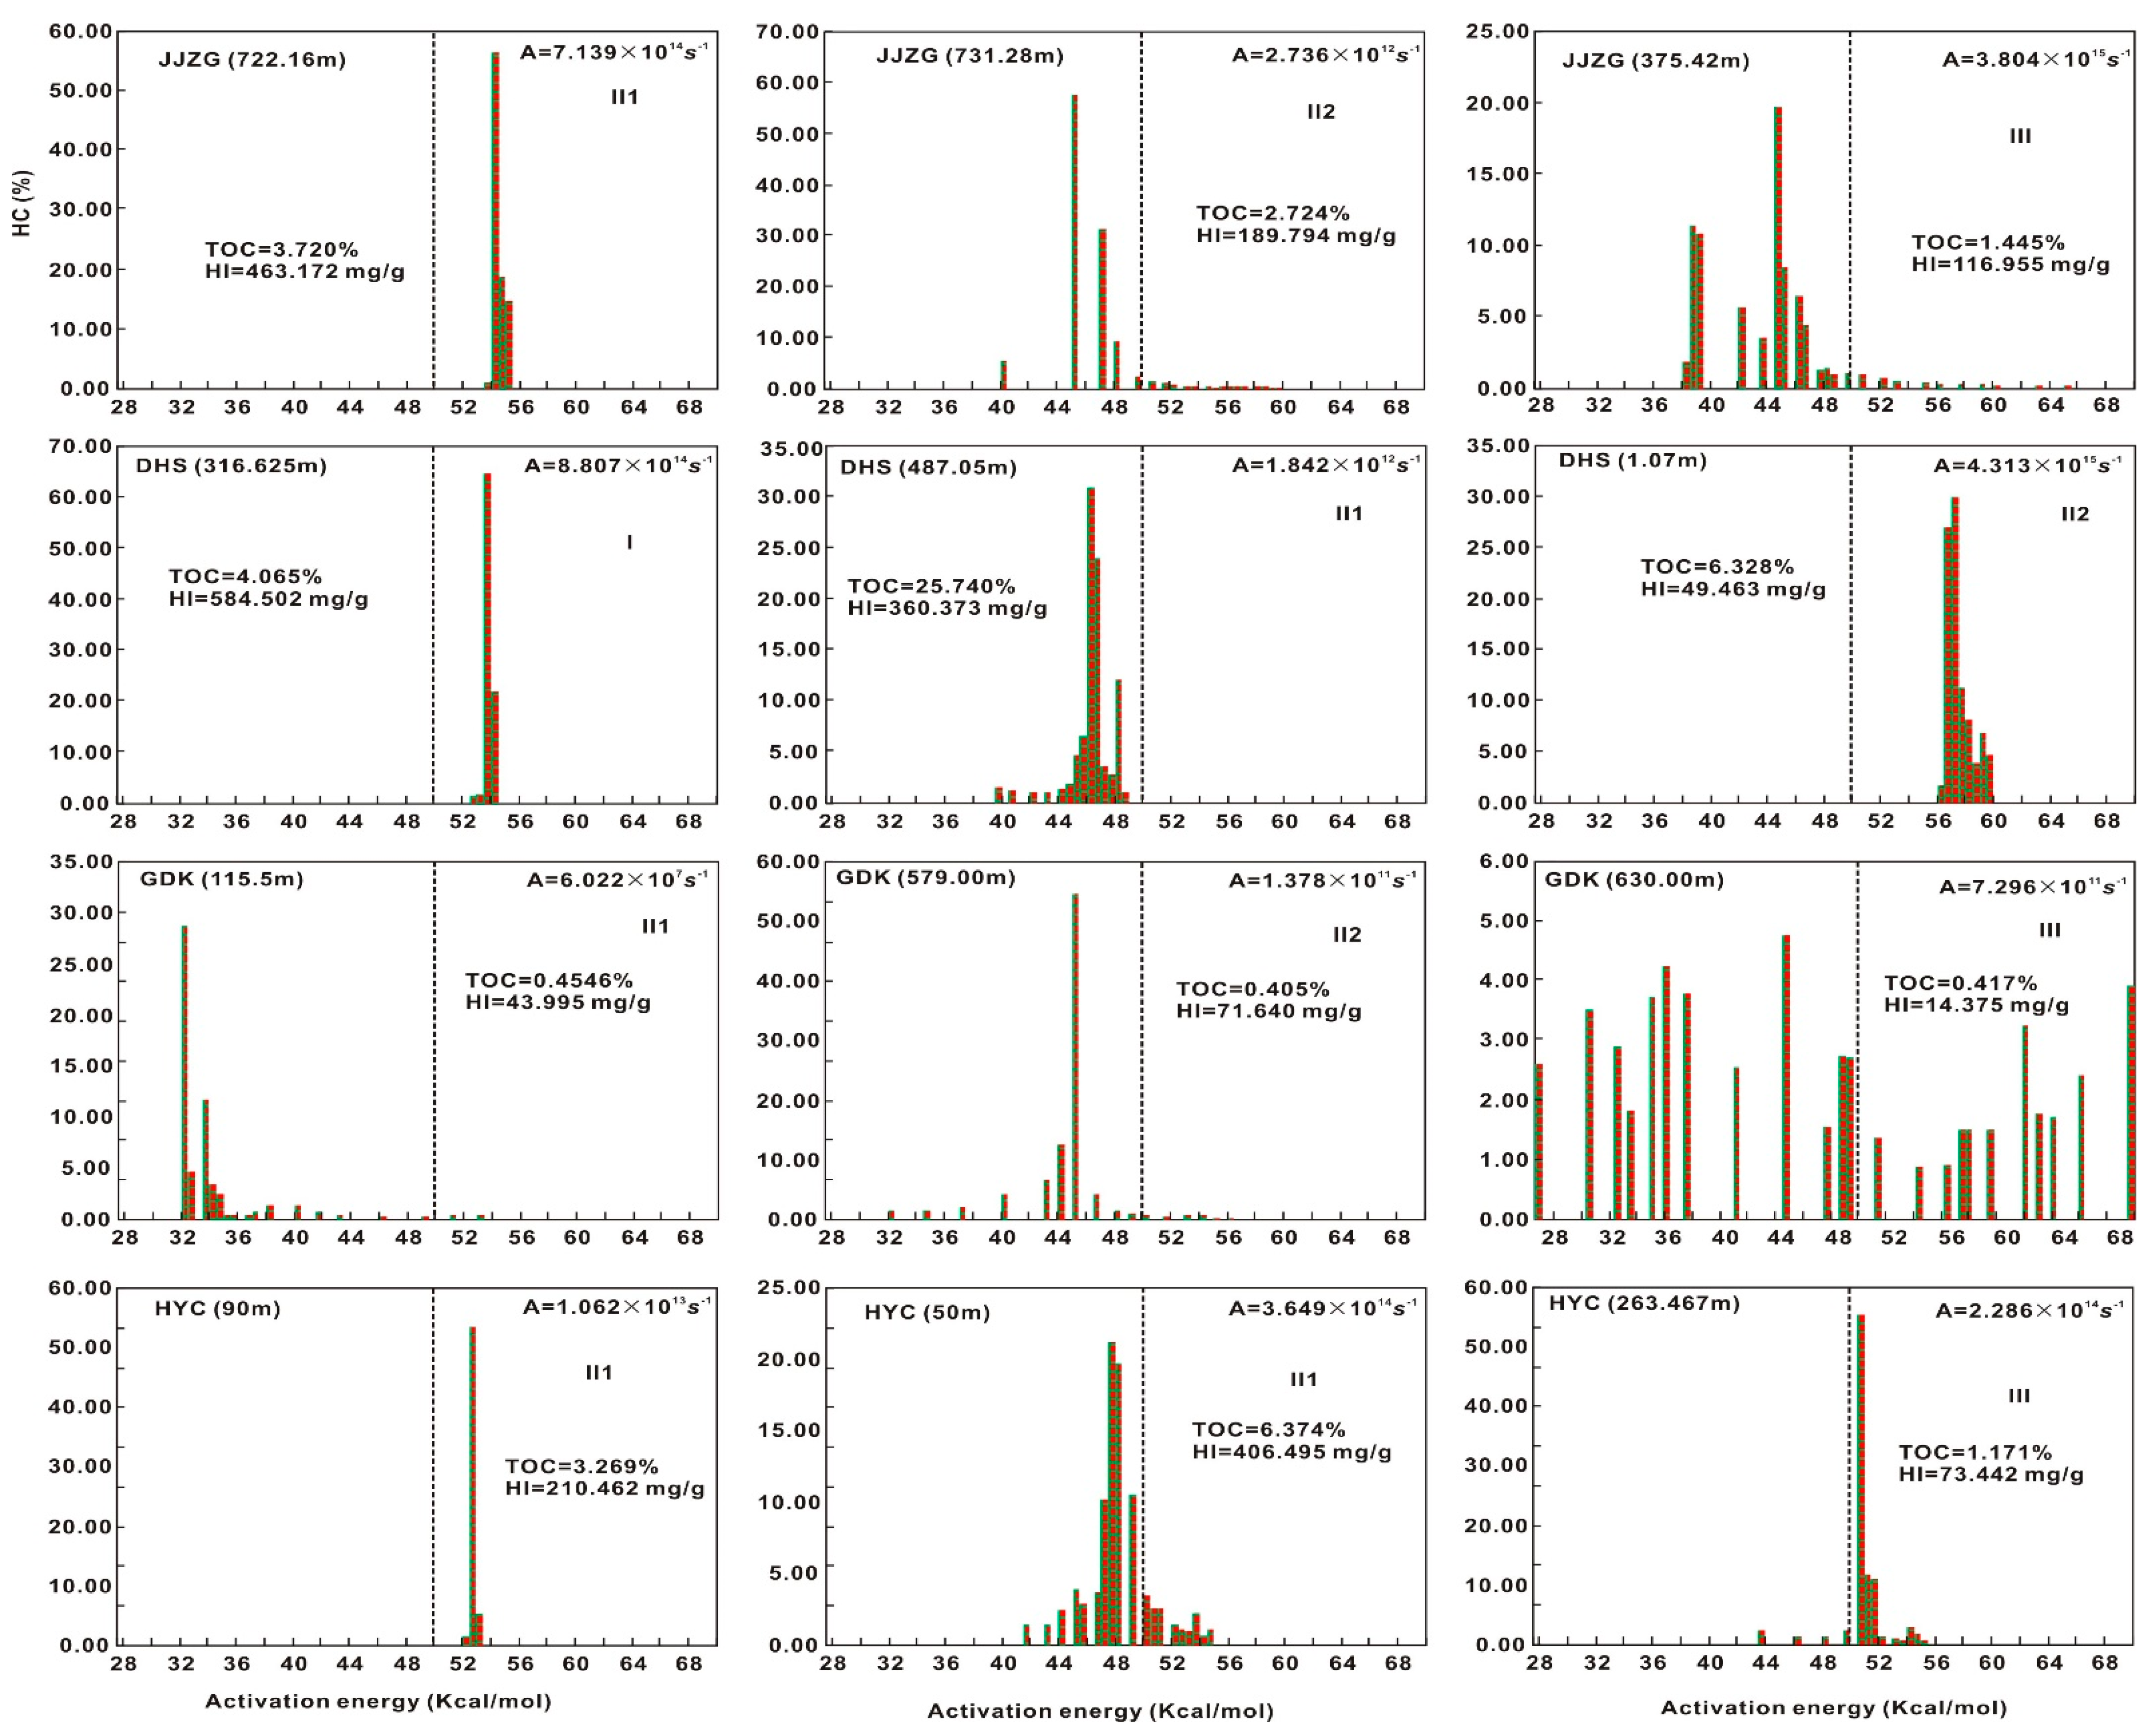
The activation energy of different types of P2l source rock also differed across the different sampled sites. Type I and II1 organic matter exhibited a lower activation energy with a more concentrated distribution, suggesting that in Type I and II1 organic matter, the hydrocarbon-generating components are relatively single, and hydrocarbon generation occurs earlier. The kinetic parameters of the parallel first-order reaction model show that the activation energy distribution in each sample was characterized by dominant activation energies (Figure 14): from 32 to 50 kJ/cal and from 50 to 68 kJ/cal in the upper and lower part of the P2l stratigraphy, respectively. This observation implies that the chemical bonds in lacustrine Type I kerogen remain unchanged during the hydrocarbon generation process.
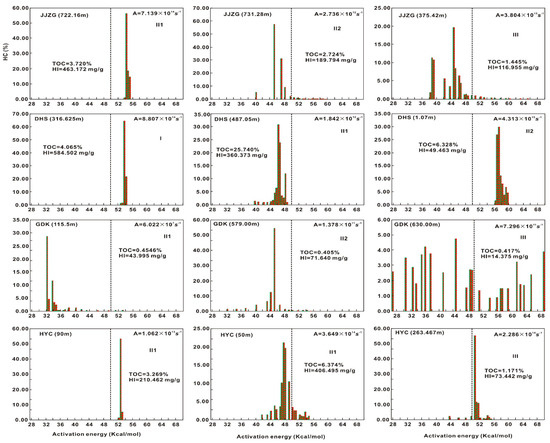
Figure 14.
Activation energy distributions of bulk petroleum generation for selected samples. A = frequency factor (s−1).
5. Discussion
Mechanism of Organic Matter Enrichment in the P2l Mudstone/Shale: Implications for Shale Oil Exploration
The method of quantifying hydrocarbon generation and expulsion, known as the hydrocarbon generation potential method based on the material balance principle, has proven to be an effective approach [43,44,45,46].
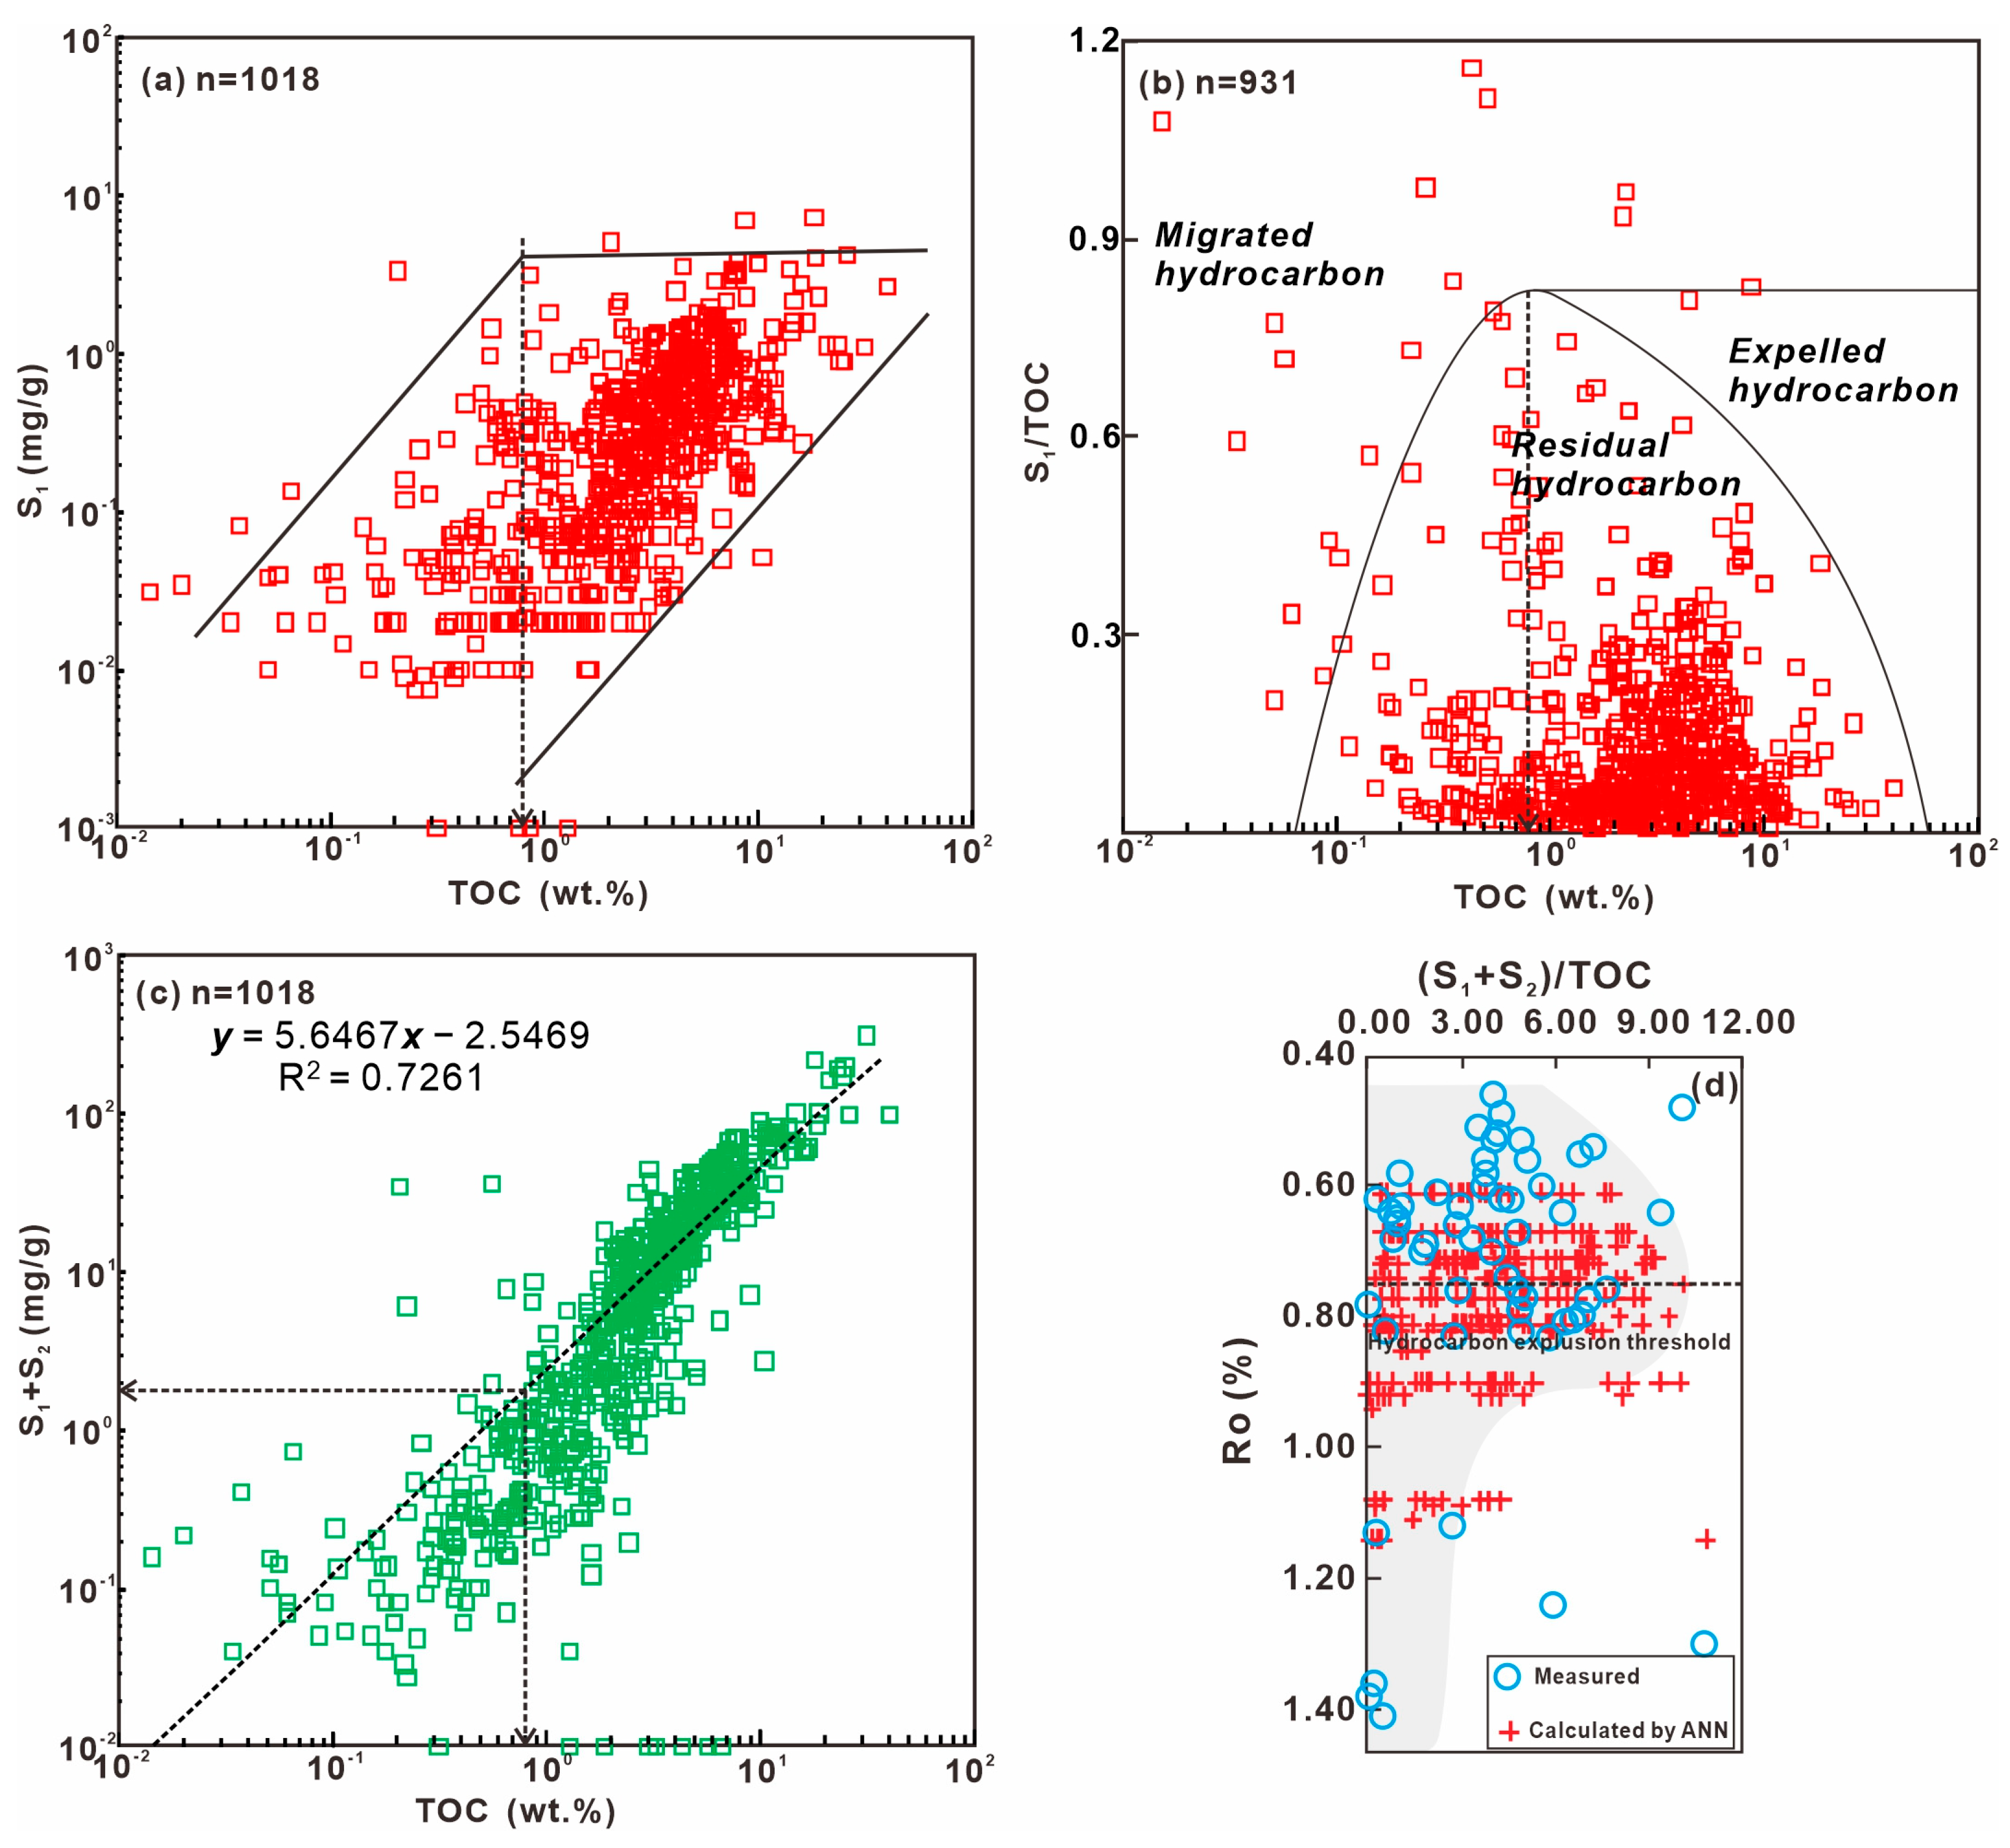
Typically, the TOC value that corresponds to the turning point of the S1/TOC trendline (the onset of S1/TOC value reduction) is considered as the base limit for high-quality hydrocarbon source rocks [43,47]. In Figure 15a,b, it can be observed that the TOC base limit in the P2l is about 0.80 wt.%. The cross-plot of TOC versus S1 + S2 reveals that in the P2l, the S1 + S2 base limit is about 1.97 mg/g (Figure 15c). Due to the lack of vitrinite in the P2l mudstone/shale intervals, we combined the measured and calculated Ro (based on the Tmax, and derived from artificial neural networks) to determine the hydrocarbon expulsion threshold. Based on the pyrolysis and basin modeling results (Figure 15d), we established a hydrocarbon generation and expulsion model for the P2l shale in the southeastern Junggar Basin (Figure 15d). According to this model, the hydrocarbon expulsion threshold in the P2l shale is reached at Ro~0.75%.

Figure 15.
Determination of hydrocarbon expulsion threshold for (a–c) abundance and (d) thermal maturity of source rocks by hydrocarbon generation potential method (ANN: artificial neural networks).
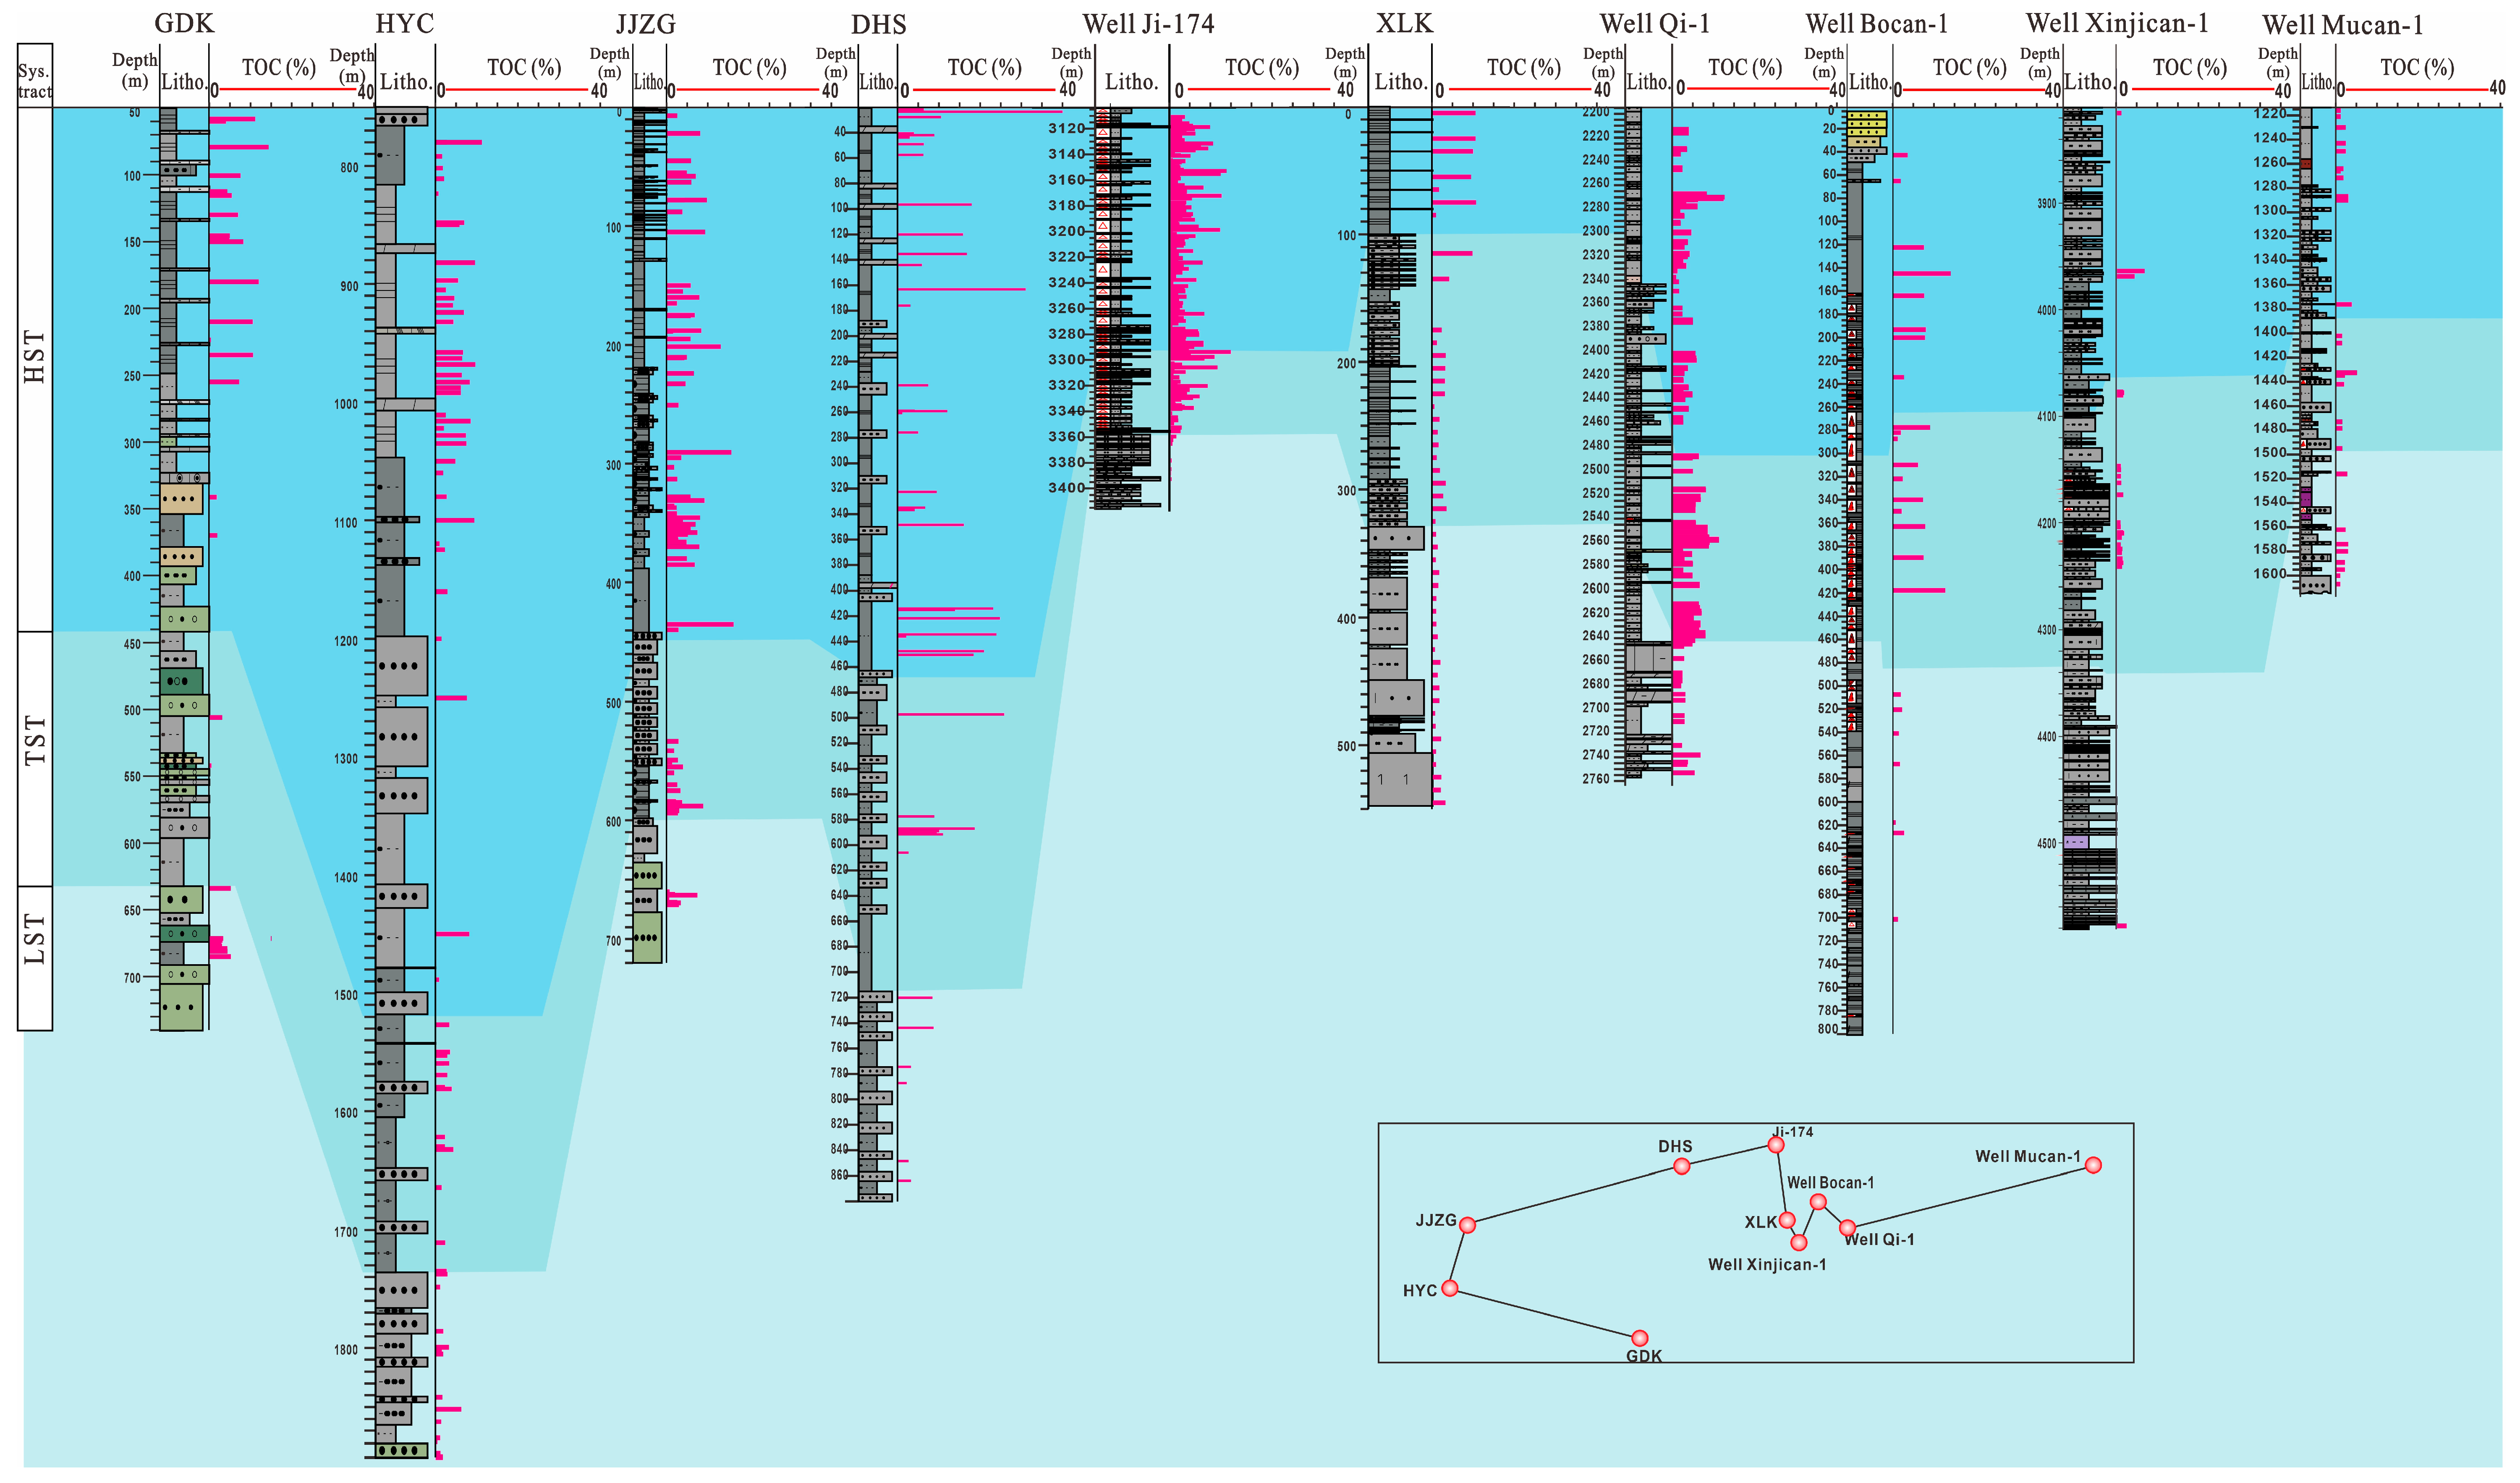
The cross-section of P2l TOC distribution around Bogeda Mountain is shown in Figure 16. In Miquan and Qitai, the primary maceral components of the Member P2l1–2 source rock consisted mainly of terrigenous organic clastics with more vitrinite and inertite and a weaker fluorescence than the other P2l members. In member P2l2, the sapropelic components had a higher alginite content and a stronger fluorescence than those in P2l1. In members P2l3–4, the relative abundance of sapropelic and exinite groups increased further, and fluorescence was the strongest among the sampled members. Moreover, based on the geochemical profiles of the 10 wells and outcrops analyzed in this study (Figure 16), it is suggested that the hydrocarbon generation potential of the lower P2l members (P2l1–2: light gray silty mudstone) is lower than that of the upper P2l members (P2l3–4: dark mudstone and shale). A large set of shale with abundant organic matter in these P2l3–4 members makes them a promising target interval.
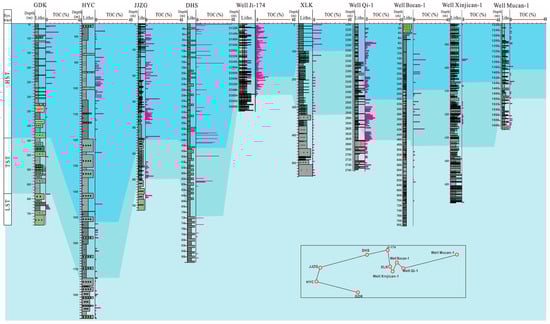
Figure 16.
The geochemical profiles of well-tie show the differences in the hydrocarbon generation potential between the lower and upper sections of P2l Formation.
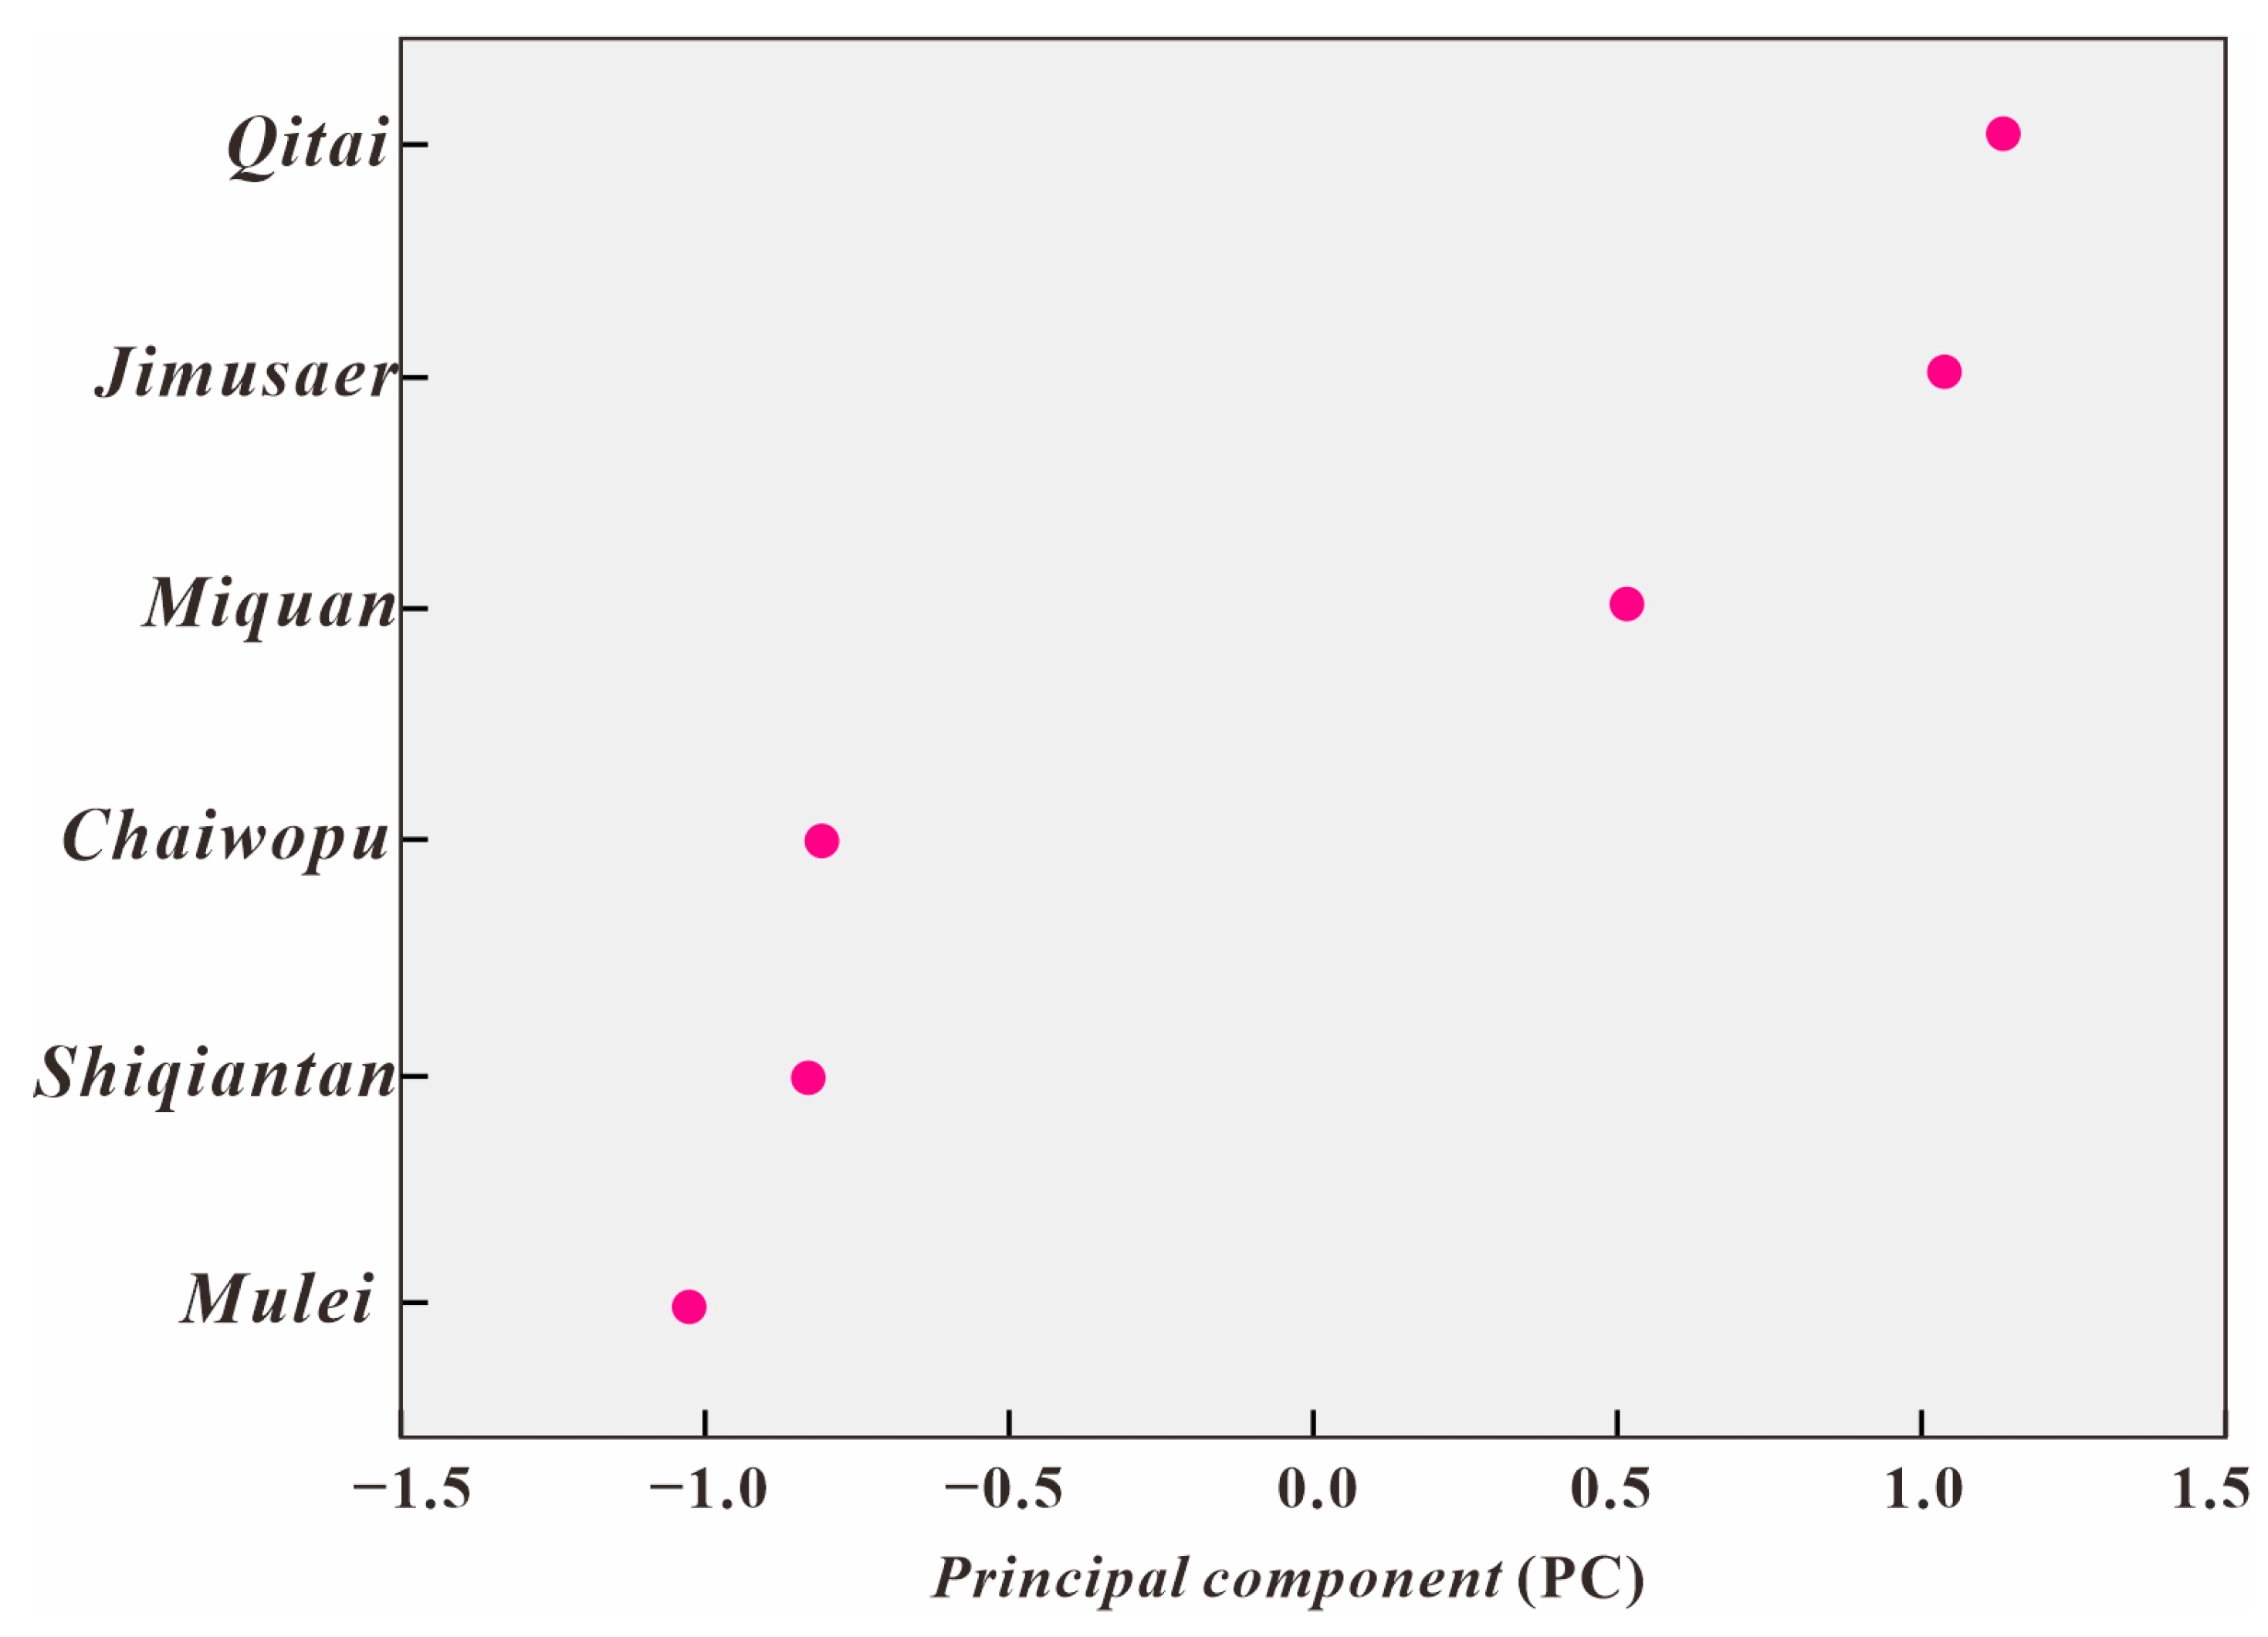
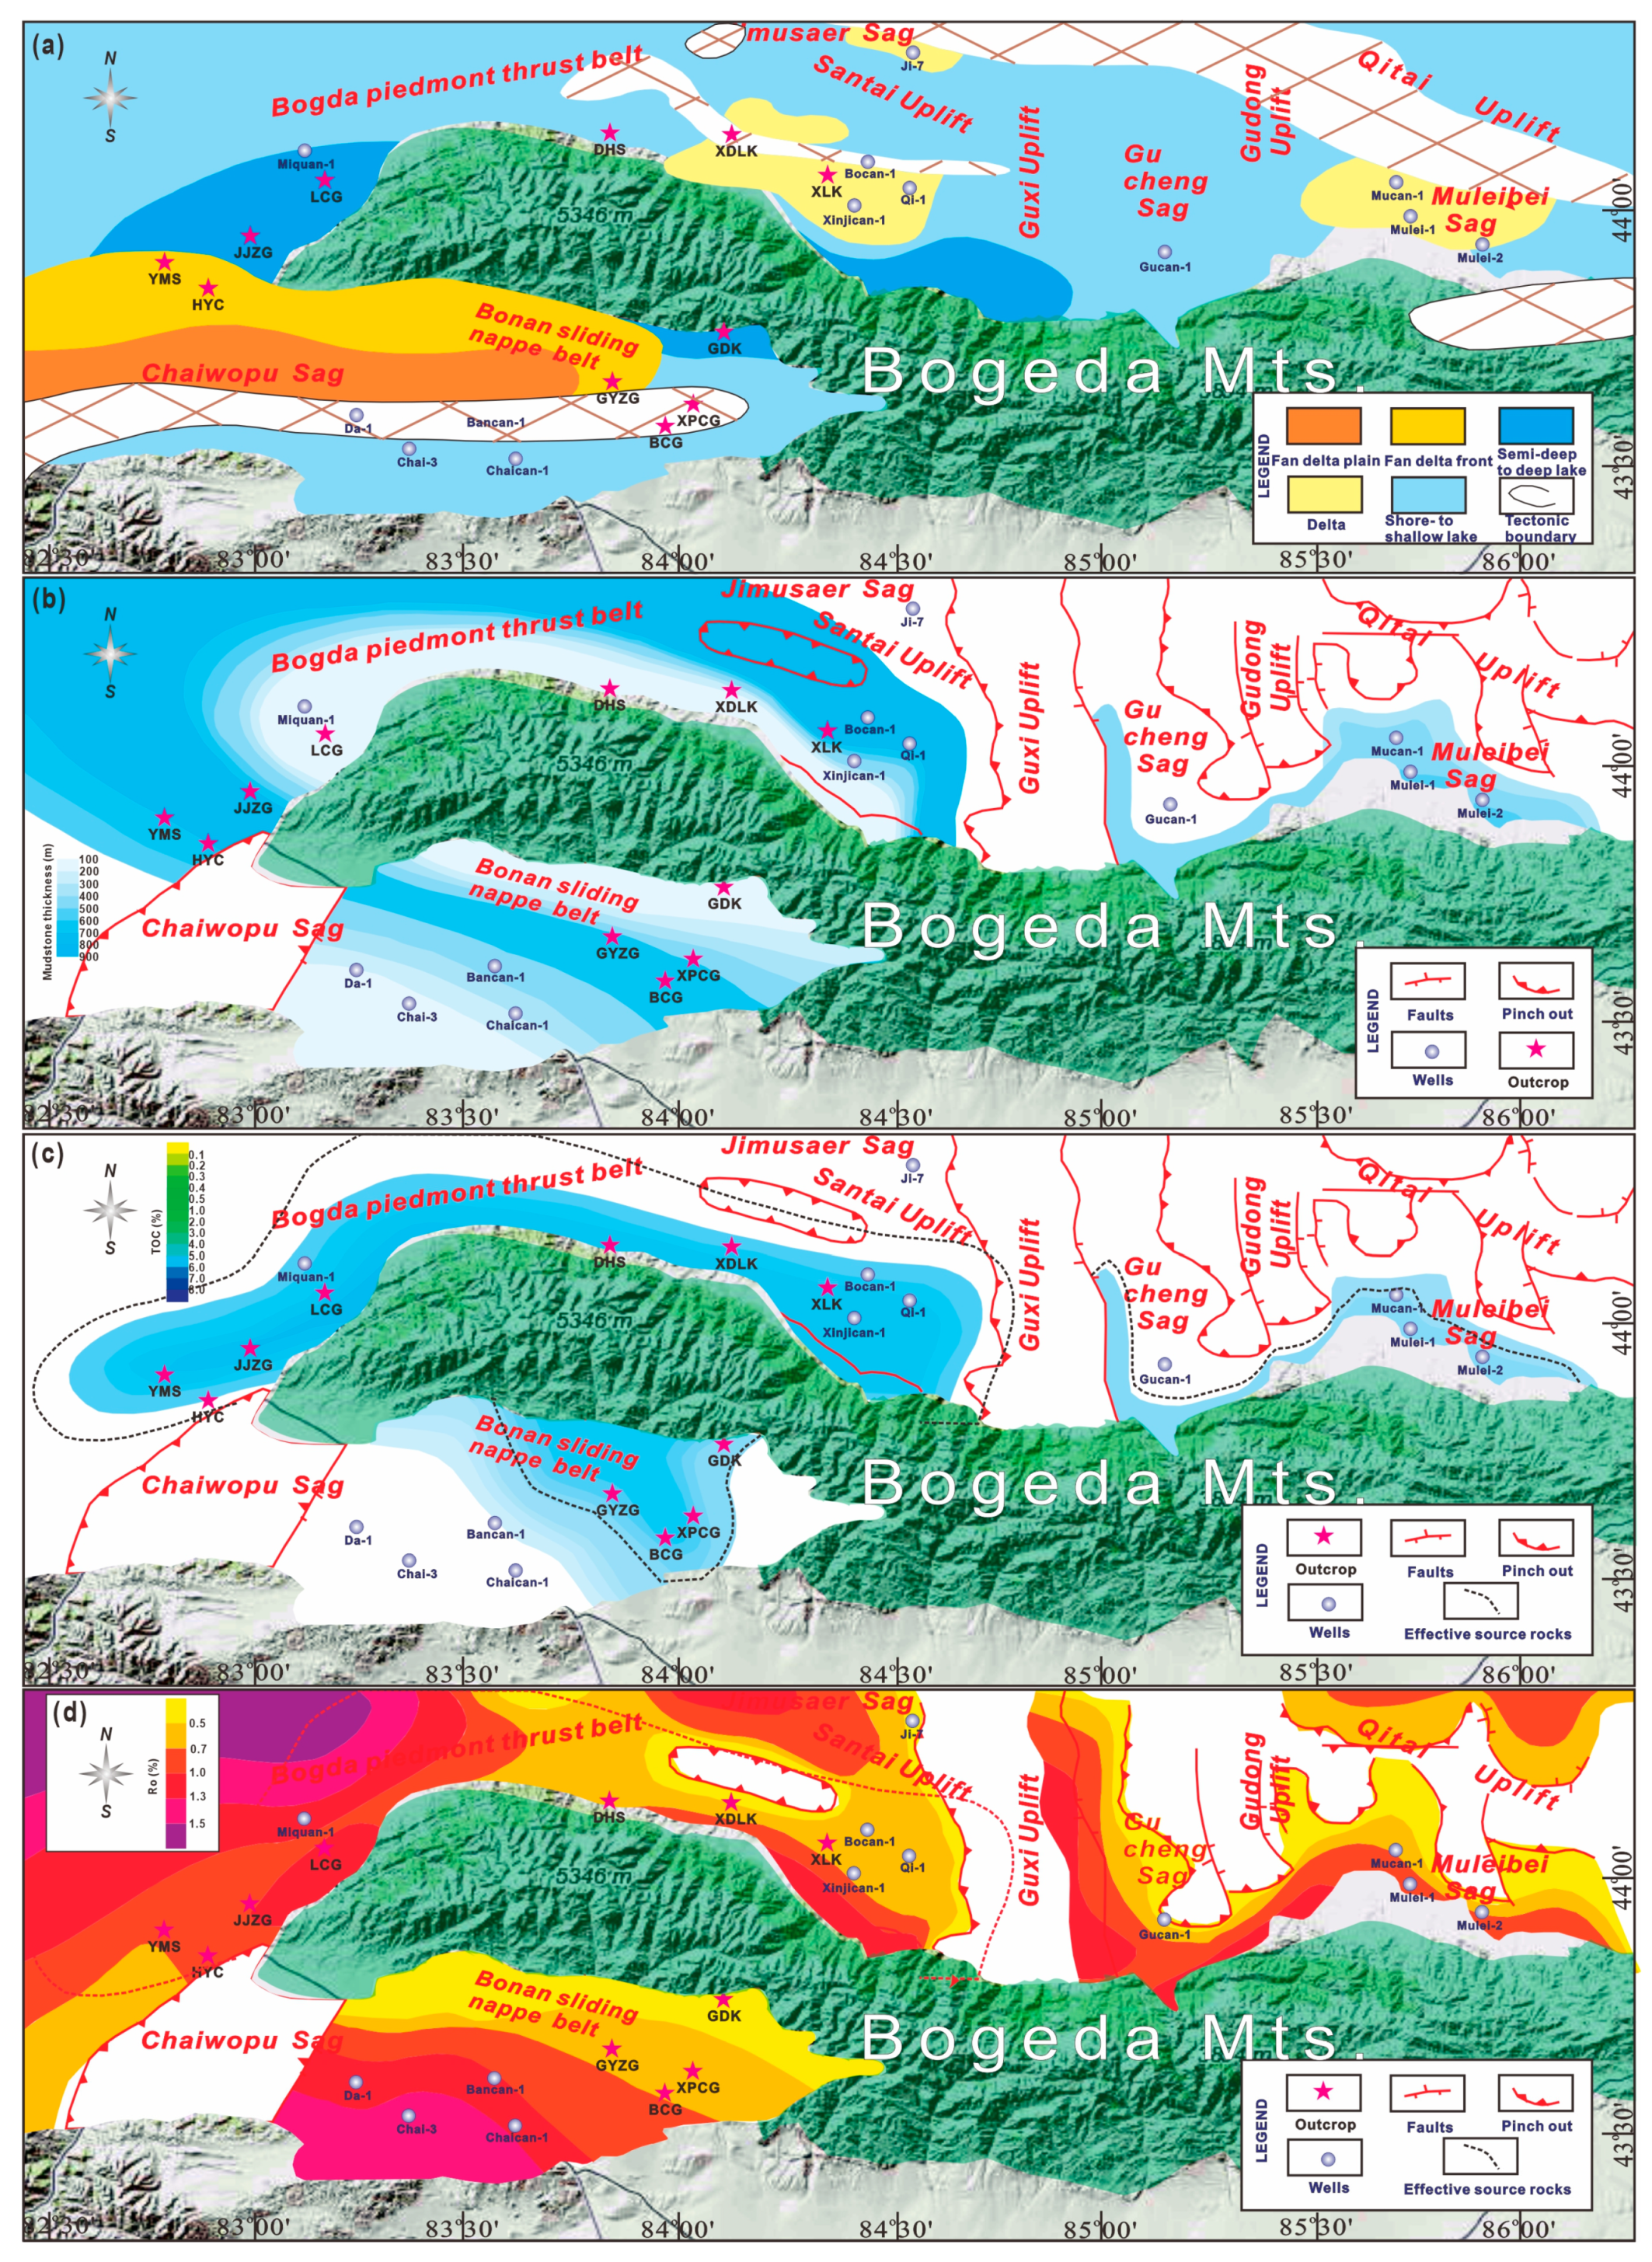
In this study, a principal component (PC) was extracted based on the evaluation parameters of thermal maturity, organic matter abundance, and kerogen type as follows: PC = −0.172 × C29ββ/(ββ + αα) − 0.030 × C2920S/(20S + 20R) − 0.146 × Roave + 0.179 × Sapropelic + 0.026 × Exinite + 0.170 × TI + 0.186 × TOC + 0.180 × (S1 + S2) + 0.124 × Bitumen “A”. The extracted PC value was positively proportional to the organic matter abundance and kerogen-type indicators and negatively correlated to the maturity parameters, indicating that the higher the PC value, the better the hydrocarbon generation potential of the source rock. As shown in Figure 17, from Mulei, Shiqiantan, Chaiwopu, to Miquan, Jimusaer, and then to the Qitai area, the hydrocarbon generation potential of the source rocks gradually improved. In addition, the contour distribution of (Figure 18a) P2l3–4 sedimentary facies, (Figure 18b) mudstone thickness, and (Figure 18c) TOC around Bogeda Mountain reveals that the semi-deep to deep lake facies of the Miquan area, with a maximum mudstone thickness of 900 m and a maximum TOC content of 8.0%, have the highest exploration potential. Moreover, the contour map of Ro values (Figure 18d) demonstrates that the P2l source rock in the Miquan area has entered the mature stage (Ro > 0.7%). Notably, both the Miquan and Qitai areas, characterized by semi-deep to deep lake facies, have the most promising exploration potential. The results of this study provide valuable guidance for shale oil exploration in the southeastern Junggar Basin.
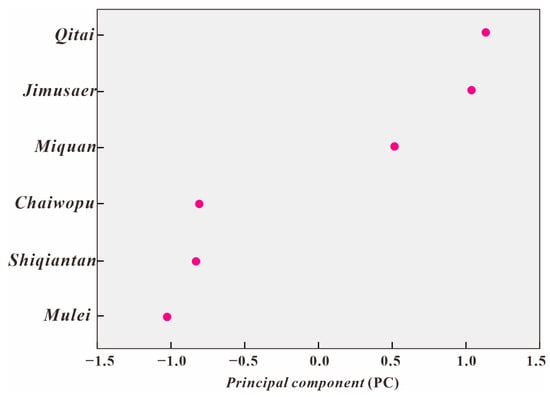
Figure 17.
The extracted principal component shows the differential hydrocarbon generation potential of the source rocks of P2l in different areas.
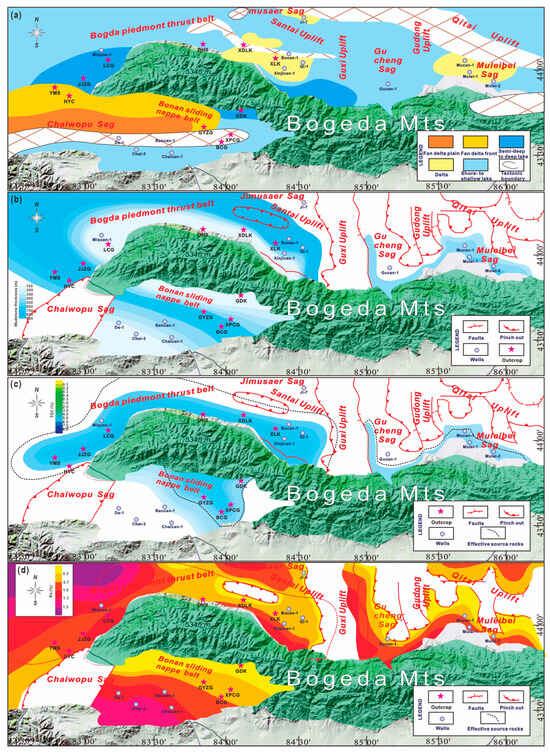
Figure 18.
Contour map of (a) the sedimentary facies of HST of P2l Formation, (b) thickness of mudstone, (c) TOC distribution characteristics, and (d) Ro values of source rocks around Bogeda Mountain in southeastern Junggar Basin.
6. Conclusions
In the six areas of study, the organic matter abundance increases in the following order: Mulei, Shiqiantan, Chaiwopu, Miquan, Jimusaer, and Qitai. The distribution of organic matter kerogen type, in order of decreasing quality, is as follows: Chaiwopu, Mulei, Shiqiantan, Miquan, Jimusaer, and Qitai. In order of increasing thermal maturity of the organic matter, the sites are ranked as follows: Qitai, Jimusaer, Miquan, Shiqiantan, Mulei, and Chaiwopu.
In Miquan and Qitai, the P2l shale exhibits an organic matter abundance and kerogen type equivalent to those in the P2l shale in the Jimusaer oilfield; however, in Chaiwopu, Shiqiantan, and Mulei, the organic matter abundance is much lower and the kerogen type much less advantageous than those of the Jimusaer shale.
From a vertical perspective, the P2l3–4 members of the P2l shale formation present a promising target interval due to their abundant organic matter. Horizontally, the semi-deep to deep lake facies of the Miquan and Qitai areas show the highest shale oil exploration potential in the southeastern Junggar Basin.
The comprehensive analysis indicates that, in the six areas of the southeastern Junggar Basin, the Qitai area holds the highest potential for shale oil exploration, even surpassing that of the Jimusaer area, followed by the Miquan and Chaiwopu areas, and the resource potential of shale oil in the Shiqiantan and Mulei areas is the worst.
Author Contributions
Conceptualization, T.L. and G.Z.; methodology, Y.Y.; software, X.C.; validation, Y.X.; formal analysis, Y.Q.; investigation, B.S.; resources, B.Y.; data curation, T.S.; writing—original draft preparation, B.S.; writing—review and editing, T.L.; visualization, B.S.; supervision, G.Z.; funding acquisition, X.C. All authors have read and agreed to the published version of the manuscript.
Funding
This study was co-funded by the National Natural Science Foundation of China (No. 42072172, 41772120, 42372160), the Shandong Natural Science Foundation Youth Program (ZR2023QD043), and the Research Fund of Shandong Coalfield Geological Bureau (2022-003). We thank the Shengli Oil Company of Sinopec for approving the publication.
Data Availability Statement
All data, models, and code generated or used during the study appear in the submitted article.
Conflicts of Interest
We declare that we do not have any commercial or associative interest that represents a conflict of interest in connection with the work submitted.
References
- Carroll, A.R.; Brassell, S.C.; Graham, S.A. Upper Permian Lacustrine Oil Shales, Southern Junggar Basin, Northwest China. AAPG Bull. 1992, 76, 1874–1902. [Google Scholar] [CrossRef]
- Wang, C.; Kuang, L.; Gao, G.; Cui, W.; Kong, Y.; Xiang, B.; Liu, G. Difference in hydrocarbon generation potential of the shaly source rocks in Jimusar Sag, Permian Lucaogou Formation. Acta Sedimentol. Sin. 2014, 32, 385–390, (In Chinese with English Abstract). [Google Scholar] [CrossRef]
- Cao, Z.; Liu, G.; Kong, Y.; Wang, C.; Niu, Z.; Zhang, J.; Geng, C.; Shan, X.; Wei, Z. Lacustrine tight oil accumulation characteristics: Permian Lucaogou Formation in Jimusaer Sag, Junggar Basin. Int. J. Coal Geol. 2016, 153, 37–51. [Google Scholar] [CrossRef]
- Meng, Z.Y.; Liu, Y.Q.; Jiao, X.; Ma, L.T.; Zhou, D.W.; Li, H.; Cao, Q.; Zhao, M.R.; Yang, Y.Y. Petrological and organic geochemical characteristics of the Permian Lucaogou Formation in the Jimsar Sag, Junggar Basin, NW China: Implications on the relationship between hydrocarbon accumulation and volcanic-hydrothermal activities. J. Pet. Sci. Eng. 2022, 210, 110078. [Google Scholar] [CrossRef]
- Chang, X.C.; Liu, T.J.; Shi, B.B.; Zhang, G.L.; Yu, H.Z.; Chen, G.; Zhang, P.F. The shale oil potential of Permian Lucaogou shales (Southeastern Junggar Basin) evaluated by a new quantitative index based on geochemometric methods. Mar. Pet. Geol. 2023, 156, 106434. [Google Scholar] [CrossRef]
- Wang, J.; Li, E.T.; Chen, J.; Mi, J.L.; Ma, C.; Lei, H.Y.; Xie, L.K. Characteristics and hydrocarbon generation mechanism of high-quality source rocks in Permian Lucaogou Formation, Jimsar Sag, Junggar Basin. Geol. Rev. 2020, 66, 755–764, (In Chinese with English Abstract). [Google Scholar] [CrossRef]
- Zhang, J.L.; Li, Y.; Liu, J.S.; Yan, X.; Li, L.J.; Shen, W.L. Modeling Hydrocarbon Generation of Deeply Buried Type III Kerogen: A Study on Gas and Oil Potential of Lishui Sag, East China Sea Shelf Basin. Front. Earth Sci. 2021, 8, 609834. [Google Scholar] [CrossRef]
- Hu, T.; Pang, X.; Jiang, S.; Wang, Q.; Zheng, X.; Ding, X.; Zhao, Y.; Zhu, C.; Li, H. Oil content evaluation of lacustrine organic-rich shale with strong heterogeneity: A case study of the Middle Permian Lucaogou Formation in Jimusaer Sag, Junggar Basin, NW China. Fuel 2018, 221, 196–205. [Google Scholar] [CrossRef]
- Luo, Q.Y.; Gong, L.; Qu, Y.S.; Zhang, G.L.; Wang, S.Z. The tight oil potential of the Lucaogou Formation from the southern Junggar Basin, China. Fuel 2018, 234, 858–871. [Google Scholar] [CrossRef]
- Yu, H.Z. Hydrocarbon generation pattern of source rocks controlled by tectonic evolution of Bogda mountain. Sci. Technol. Eng. 2019, 19, 85–92, (In Chinese with English Abstract). [Google Scholar]
- Chen, J.P.; Wang, X.L.; Deng, C.P.; Liang, D.G.; Zhang, Y.Q.; Zhao, Z.; Ni, Y.Y.; Zhi, D.M.; Yang, H.B.; Wang, Y.T. Geochemical features of source rocks and crude oil in the Junggar Basin, Northwest China. Acta Geol. Sin. 2016, 90, 37–67, (In Chinese with English Abstract). [Google Scholar]
- Gao, Y.D. Organic Geochemical Characteristics and Its Paleoenvironmental Significance of the Middle Permian Oil Shale in the Southern Junggar Basin. Master’s Thesis, Hebei GEO University, Shijiazhuang, China, 2016. [Google Scholar]
- Zhang, X.; Zhuang, X.G.; Tu, Q.J.; Xu, S.Q.; Zhang, Y. Difference of geochemical characteristics and Paleoenvironment reconstruction of the Lucaogou Formation between Southern Junggar Basin and Chaiwopu Sag. Xinjiang Geol. 2016, 34, 423–427, (In Chinese with English Abstract). [Google Scholar]
- Wang, B.K.; Feng, Q.; Tian, F.Z.; Zhang, Y.; Xu, Z.S.; Li, H.B.; Zhou, H.F.; Qin, Y.; Tian, R.C. The characteristics and significance of biomarker compounds in the Permian Lucaogou Formation hydrocarbon source rock on the southern margin of the Junggar Basin. Geol. Bull. China 2017, 36, 304–313, (In Chinese with English Abstract). [Google Scholar]
- Xiong, J.H.; Liang, M.L.; Cao, Z.Y.; Wang, Z.X.; Zheng, J.J.; Wang, Z.D. The geochemical and mineralogical characteristics of shales in Chaiwobu Depression, Southern Margin of Junggar Basin. J. Geomech. 2017, 23, 585–593. [Google Scholar] [CrossRef]
- Zheng, D. Analysis of Organic Geochemistry Features of Permian Hydrocarbon Source Rocks on the Periphery of Bogda Mountain. Master’s Thesis, China University of Petroleum, Beijing, China, 2019. [Google Scholar]
- Chang, X.C.; Liu, X.M.; Shi, B.B.; Liu, T.J.; Xu, Y.D.; Liu, Z.Q.; Chen, G.; Zhang, P.F. Biodegradation levels of oils from the Chepaizi Uplift, Junggar Basin (NW China) evaluated by a full-range biodegradation index as constrained by adamantane, diamantane homologs and carboxylic acids. Mar. Pet. Geol. 2022, 146, 105939. [Google Scholar] [CrossRef]
- Andrea, S.; Sveva, C.; Luca, A.; Domenico, G. Overcoming pitfalls of vitrinite reflectance measurements in the assessment of thermal maturity: The case history of the lower Congo basin. Mar. Pet. Geol. 2016, 74, 59–70. [Google Scholar] [CrossRef]
- Bustin, R.M. Quantifying macerals: Some statistical and practical considerations. Int. J. Coal Geol. 1991, 17, 213–238. [Google Scholar] [CrossRef]
- Elyasi, S. Petroleum source-rock potential of the Piranj oil field, Zagros basin. Mar. Pet. Geol. 2016, 78, 448–454. [Google Scholar] [CrossRef]
- Chalmers, G.R.L.; Bustin, R.M. A multidisciplinary approach in determining the maceral (kerogen type) and mineralogical composition of upper cretaceous eagle ford Formations: Impact on pore development and pore size distribution. Int. J. Coal Geol. 2017, 171, 93–110. [Google Scholar] [CrossRef]
- Braun, R.L.; Burnham, A.K. Mathematical model of oil generation, degradation, and expulsion. Energy Fuels 1990, 4, 132–146. [Google Scholar] [CrossRef]
- Schaefer, R.G.; Schenk, H.J.; Hardelauf, H.; Harms, R. Determination of Gross Kinetic Parameters for Petroleum Formation from Jurassic Source Rocks of Different Maturity Levels by Means of Laboratory Experiments. Org. Geochem. 1990, 16, 115–120. [Google Scholar] [CrossRef]
- Chen, Z.H.; Li, M.W.; Ma, X.X.; Cao, T.T.; Liu, X.J.; Li, Z.M.; Jiang, Q.G.; Wu, S.Q. Generation kinetics based method for correcting effects of migrated oil on Rock-Eval data-An example from the Eocene Qianjiang Formation, Jianghan Basin, China. Int. J. Coal Geol. 2018, 195, 84–101. [Google Scholar] [CrossRef]
- Van Krevelen, D.W. Coal: Typology, Physics, Chemistry, Constitution; Elsevier: Amsterdam, The Netherlands, 1993; p. 979. [Google Scholar]
- Hall, P.B.; Douglas, A.G. The distribution of hicyclic alkanes in two lacustrine deposits. In Advances in Organic Geochemistry; Wiley: Chichester, UK, 1983; pp. 576–587. [Google Scholar]
- Jiang, Z.S.; Fowler, M.G.; Rullkötter, J. Carotenoid-derived alkanes in oils from north western China. In Advances in Organic Geochemistry; Leythaeuser, D., Ed.; Pergamon Press: Oxford, UK, 1986; pp. 831–839. [Google Scholar] [CrossRef]
- Irwin, H.; Meyer, T. Lacustrine organic facies. A biomarker study using multivariate statistical analysis. Adv. Org. Geochem. 1990, 16, 197–210. [Google Scholar] [CrossRef]
- Shi, B.B.; Chang, X.C.; Xu, Y.D.; Wang, Y.R.; Mao, L.X.; Wang, Y. Origin and migration pathway of biodegraded oils pooled in multiple-reservoirs of the Chepaizi Uplift, Junggar Basin, NW China: Insights from geochemical characterization and chemometrics methods. Mar. Pet. Geol. 2020, 122, 104655. [Google Scholar] [CrossRef]
- Connan, J.; Cassou, A.M. Properties of gases and petroleum liquids derived from terrestrial kerogen at various maturation levels. Geochem. Cosmochim. Acta 1980, 44, 1–23. [Google Scholar] [CrossRef]
- Shanmugam, G. Significance of coniferous rainforests and related organic matter in generating commercial quantities of oil, Gippsland Basin, Australia. AAPG (Am. Assoc. Pet. Geol.) Bull. 1985, 69, 1241–1254. [Google Scholar] [CrossRef]
- Chang, X.; Wang, Y.; Shi, B.; Xu, Y. Charging of Carboniferous volcanic reservoirs in the eastern Chepaizi uplift, Junggar Basin (northwestern China) constrained by oil geochemistry and fluid inclusion. AAPG (Am. Assoc. Pet. Geol.) Bull. 2019, 103, 1625–1652. [Google Scholar] [CrossRef]
- Peters, K.E. Guidelines for evaluating petroleum source rock using programmed pyrolysis. AAPG (Am. Assoc. Pet. Geol.) Bull. 1986, 70, 318–329. [Google Scholar] [CrossRef]
- Luo, Q.Y.; Zhang, L.; Zhong, N.N.; Wu, J.; Goodarzi, F.; Sanei, H.; Skovsted, C.B.; Václav, S.; Li, M.J.; Ye, X.Z.; et al. Thermal evolution behavior of the organic matter and a ray of light on the origin of vitrinite-like maceral in the Mesoproterozoic and Lower Cambrian black shales: Insights from artificial maturation. Int. J. Coal Geol. 2021, 244, 103813. [Google Scholar] [CrossRef]
- Karayigit, A.I.; Oskay, R.G.; Celik, Y. Mineralogy, petrography, and Rock-Eval pyrolysis of late Oligocene coal seams in the Malkara coal field from the Thrace Basin (NW Turkey). Int. J. Coal Geol. 2021, 244, 103814. [Google Scholar] [CrossRef]
- Huang, W.Y.; Meinschein, W.G. Sterols as ecological indicators. Geochim. Cosmochim. Acta 1979, 43, 739–745. [Google Scholar] [CrossRef]
- Volkman, J.K. A review of sterol markers for marine and terrigenous organic matter. Org. Geochem. 1986, 9, 83–99. [Google Scholar] [CrossRef]
- Qiu, N.S. Methods of thermal history reconstruction of sedimentary basins and their application in oil and gas exploration. Mar. Orig. Pet. Geol. 2005, 20, 45–51, (In Chinese with English Abstract). [Google Scholar]
- Wang, M.; Lu, S.F.; Xue, H.T. Kinetic simulation of hydrocarbon generation from lacustrine type I kerogen from the Songliao Basin: Model comparison and geological application. Mar. Pet. Geol. 2011, 28, 1714–1726. [Google Scholar] [CrossRef]
- Chen, Z.H.; Li, M.W.; Cao, T.T.; Ma, X.X.; Li, Z.M.; Jiang, Q.G.; Li, Z.; Jiang, C.Q. Hydrocarbon Generation Kinetics of a Heterogeneous Source Rock System: Example from the Lacsutrine Eocene-Oligocene Shahejie Formation, Bohai Bay Basin, China. Energy Fuels 2017, 31, 13291–13304. [Google Scholar] [CrossRef]
- Cai, L.X.; Zeng, Z.G.; Zhang, X.H.; Xiao, G.L.; Guo, X.W.; Pang, Y.M. Hydrocarbon Generation Kinetics of the Gas-Prone Kerogens in the Central Uplift of the South Yellow Sea Basin. Energy Fuels 2020, 34, 12225–12238. [Google Scholar] [CrossRef]
- Zhang, D.W.; Wang, L.H.; Su, L.; Wu, Y.D.; Sun, R.; Wu, C.J.; Song, D.J.; Tuo, J.C. The chemical kinetics of the semi-open hydrous pyrolysis system: Time series analysis of lithostatic pressure and fluid pressure. Int. J. Coal Geol. 2020, 220, 103418. [Google Scholar] [CrossRef]
- Li, Y.; Zhang, J.L.; Liu, Y.; Shen, W.L.; Chang, X.C.; Sun, Z.Q.; Xu, G.C. Organic geochemistry, distribution and hydrocarbon potential of source rocks in the Paleocene, Lishui Sag, East China Sea Shelf Basin. Mar. Pet. Geol. 2019, 107, 382–396. [Google Scholar] [CrossRef]
- Zheng, D.Y.; Pang, X.Q.; Ma, X.H.; Li, C.R.; Zheng, T.Y.; Zhou, L.M. Hydrocarbon generation and expulsion characteristics of the source rocks in the third member of the Upper Triassic Xujiahe Formation and its effect on conventional and unconventional hydrocarbon resource potential in the Sichuan Basin. Mar. Pet. Geol. 2019, 109, 175–192. [Google Scholar] [CrossRef]
- Wang, E.Z.; Liu, G.Y.; Pang, X.Q.; Li, C.R.; Zhao, Z.F.; Feng, Y.; Wu, Z.Y. An improved hydrocarbon generation potential method for quantifying hydrocarbon generation and expulsion characteristics with application example of Paleogene Shahejie Formation, Nanpu Sag, Bohai Bay Basin. Mar. Pet. Geol. 2020, 112, 104106. [Google Scholar] [CrossRef]
- Li, C.R.; Pang, X.Q.; Ma, X.H.; Wang, E.Z.; Hu, T.; Wu, Z.Y. Hydrocarbon generation and expulsion characteristics of the Lower Cambrian Qiongzhusi shale in the Sichuan Basin, Central China: Implications for conventional and unconventional natural gas resource potential. J. Pet. Sci. Eng. 2021, 204, 108610. [Google Scholar] [CrossRef]
- Wang, X.L.; Zhi, D.M.; Wang, Y.T.; Chen, J.P.; Qin, Z.J.; Liu, D.G.; Xiang, Y.; Lan, W.F.; Li, N. Geochemistry of Source Rock and Petroleum in the Junggar Basin; Petroleum Industry Press: Beijing, China, 2013; pp. 1–565, (In Chinese without English Abstract). [Google Scholar]


Disclaimer/Publisher’s Note: The statements, opinions and data contained in all publications are solely those of the individual author(s) and contributor(s) and not of MDPI and/or the editor(s). MDPI and/or the editor(s) disclaim responsibility for any injury to people or property resulting from any ideas, methods, instructions or products referred to in the content. |
© 2024 by the authors. Licensee MDPI, Basel, Switzerland. This article is an open access article distributed under the terms and conditions of the Creative Commons Attribution (CC BY) license (https://creativecommons.org/licenses/by/4.0/).