Article

Convective Hot Air Drying of Red Cabbage (Brassica oleracea var. Capitata Rubra): Mathematical Modeling, Energy Consumption and Microstructure

by
Antonio Vega-Galvez
1,
Luis S. Gomez-Perez
1,
Kong Shun Ah-Hen
2,
Francisca Zepeda
1,
Purificación García-Segovia
3,
Cristina Bilbao-Sainz
4,
Nicol Mejías
1 and
Alexis Pasten
1,*
1
Food Engineering Department, Universidad de La Serena, Av. Raúl Bitrán 1305, La Serena 1700000, Chile
2
Facultad de Ciencias Agrarias y Alimentarias, Instituto de Ciencia y Tecnología de los Alimentos, Universidad Austral de Chile, Valdivia 5090000, Chile
3
I-FOOD Team, Food-UPV, Universitat Politècnica de València, Camino de Vera s/n, 46021 Valencia, Spain
4
U.S. Department of Agriculture, Western Regional Research Center, 800 Buchanan St., Albany, CA 94710, USA
*
Author to whom correspondence should be addressed.
Processes 2024, 12(3), 509; https://doi.org/10.3390/pr12030509
Submission received: 6 February 2024 / Revised: 24 February 2024 / Accepted: 27 February 2024 / Published: 29 February 2024

Abstract

:
This study examined the convective drying of red cabbage at temperatures ranging from 50 to 90 °C. Mathematical modeling was used to describe isotherms, drying kinetics and rehydration process. The effects of drying conditions on energy consumption and microstructure were also evaluated. The Halsey model had the best fit to the isotherm data and the equilibrium moisture was determined to be 0.0672, 0.0490, 0 0.0379, 0.0324 and 0.0279 g water/g d.m. at 50, 60, 70, 80 and 90 °C, respectively. Drying kinetics were described most accurately by the Midilli and Kuçuk model. Also, the diffusion coefficient values increased with drying temperature. Lower energy consumption was found for drying at 90 °C and the rehydration process was best described by the Weibull model. Samples dehydrated at 90 °C showed high water holding capacity and better maintenance of microstructure. These results could be used to foster a sustainable drying process for red cabbage.

1. Introduction

Red cabbage (Brassica oleracea var. capitata rubra) is a Cruciferae vegetable and is widely consumed all over the world for its high nutritive value beneficial to health [1]. Generally, it is consumed in salad or as a boiled vegetable dish, being a good source of fiber, glucosinolates, polyphenols and vitamins [2,3]. Its use as a natural coloring agent and flavor enhancer for food products due to the high content of anthocyanins and amino acids has also been reported [4,5]. Nonetheless, high moisture content in fresh red cabbage and mechanical injury after harvesting can generate a series of undesirable physiological and biochemical changes [4]. To lengthen the shelf life and maintain the quality of red cabbage, cooking, drying and blanching are processing treatments commonly used in industrial production [1]. In particular, the drying operation is one of the most widely used and cost-effective preservation method since weight and volume of food can be reduced, minimizing transportation and storage costs [6]. The preferred drying method of the food industry is convective drying (CD) or hot air drying, in spite of several drawbacks such as low drying efficiency and tremendous energy consumption [7]. However, the primary reason why CD predominates in the food industry is its ease of operation, simplicity and dependability [6]. It is then vital to know the energy consumption through different parameters, such as the specific moisture extraction rate (SMER), the moisture extraction rate (MER) and the specific energy consumption (SEC) [8]. Until now, there have been no reports on energy consumption through such parameters for convective drying of red cabbage.
In addition to energy consumption, which is of great importance to the food industry, the drying kinetics, the rehydration kinetics and microstructure changes are also of great importance, as it indicates the level of damage caused by the drying operation [9,10,11]. Therefore, it will be interesting to corroborate these findings with the convective hot air drying of red cabbage at different process temperatures. Mathematical modeling of the drying process is also helpful to understand the mechanism and, to some extent, to control the process parameters. To our knowledge, desorption isotherms are still necessary since the most appropriate drying model should incorporate desorption equations so that it provides the time to final moisture content, corresponding to a water activity for safe storage [12]. However, there are still limited studies on the desorption isotherms of red cabbage. Therefore, the objectives of this research were to study the effect of convective hot air-drying temperatures on the desorption isotherms, drying kinetics and rehydration kinetics of red cabbage. Mathematical modeling for both the desorption isotherms, drying kinetics and rehydration kinetics was performed. The effects of process conditions on energy consumption and microstructure of red cabbage were also evaluated. These results provide an important theoretical reference for the application of the most commonly used drying method in the food industry.

2. Materials and Methods

2.1. Sample Preparation for Drying Process

Fresh red cabbage (Brassica oleracea var. capitata rubra) acquired from a greengrocer in Coquimbo, Chile, was cut into pieces with an approximate thickness of 1 cm, after removing any spoiled outer leaves. The cut sample was blanched following a similar procedure as described by Tao et al. [13]; briefly, the sample was placed in a sieve before immersing for 30 s in boiled water, then chilled in ice water and allowed to drip. The blanched sample was used for the drying process.

2.2. Drying Process and Determination of Effective Diffusion Coefficient (Deff)

A thin layer (10 mm) of the blanched cabbage samples (30 ± 1 g) was placed in metal wire mesh baskets in a laboratory scale convective hot-air dryer (oven dimensions: w × h × d = 0.44 m × 0.38 m × 0.47 m, 79 L) designed and built by the Department of Food Engineering of Universidad de La Serena. Process temperatures of 50, 60, 70, 80 and 90 °C were applied at an air velocity of 1.5 m/s. The weight loss was determined at defined time intervals using an analytical digital balance (Radwag AS 220-R2, Torunska, Poland) connected by an interface system (Ohaus, RS232, Parsippany, NJ, USA) to a computer, which recorded and stored data until constant weight. The drying experiments were performed in triplicate at each temperature and the moisture ratio (MR, dimensionless) and drying rate (DR, g water/g d.m. min) were determined according to Equations (1) and (2), respectively [14].
M R = X w t X w e X w 0 X w e  
D R = X w t 2 X w t 1 t 2 t 1  
where Xwt (g water/g d.m.) is the moisture content at time t, Xwe (g water/g d.m.) is the equilibrium moisture content and Xw0 (g water/g d.m.) is the initial moisture content. X w t 1 and X w t 2 are the dry-basis moisture content (g water/g d.m) at times t 1 and t 2 (min), respectively. Seven mathematical models (Equations (3)–(9)) [15] were used to fit the experimental data at different temperatures:
Newton
M R = exp k · t  
Page
M R = e x p k · t n  
Modified Page
M R = e x p k · t n
Logarithmic
M R = a · e x p k · t + c
Weibull
M R = e x p t β α
Silva and Alii
M R = exp a · t b t
Midilli and Kuçuk
M R = a · e x p k · t n + b t
where k, n, a, c, α, β and b are model parameters. The model parameters were determined using an iterative method implemented in the statistic software RStudio (V. 1.4.1717) by the Dose-Response Analysis (drc) library [16] and Nonlinear Least Squares with Brute Force (nls2) library.
The mass diffusion coefficient of the convective drying process (Deff) was obtained from Fick’s second law for an infinite flat plate (Equation (10)), assuming the internal resistance is negligible and that no volume change occurred during the drying process.
M R = 8 π 2 e x p D e f f π 2 t 4 L 2
where L (m) was half the plate thickness and t (s) the drying time.
The effects of drying temperature on the kinetic processes were evaluated using the Arrhenius equation (Equation (11)) and to determine the activation energy (Ea) from the mass diffusion coefficient.
D e f f = D e f f 0 e x p E a R T
where D e f f 0 is the Arrhenius pre-exponential constant, Ea is the activation energy (kJ/mol), R is the universal gas constant (0.008314 kJ/mol K) and T is the absolute temperature (K).

2.3. Modeling of Desorption Isotherm

The desorption isotherm was determined for the fresh red cabbage samples at 50 °C and 70 °C using the gravimetric method as described by Spiess and Wolf [17]. Eleven saturated salt solutions, including LiCl, CH3COOK, MgCl2, K2CO3, Mg(NO3)2, NaNO3, KI, NaCl, KCl, KNO3 and K2SO4 along with 1 g of cabbage sample in a Petri dish were placed inside different hermetic glass recipients. Thymol was introduced only in the cases exceeding 70% relative humidity in the recipients to inhibit microbial growth. The relative humidity of the saturated salt solutions can be reviewed in the Supplementary Materials (Table S1). The recipients were in turn placed inside an oven (Memmert UF 110, Schwabach, Germany) at a set temperatures of 50 °C or 70 °C. The weight loss of the sample was determined weekly using an analytical balance (±0.0001 g; HR200, A&D Company, Tokyo, Japan) until a constant weight was achieved. Subsequently, water content of the samples was determined in triplicate using the AOAC (934.06) method [18]. The equilibrium moisture content (Xwe) was then adjusted as a function of water activity (aw) using the Halsey, BET and GAB models (Equations (12)–(14), respectively) [19]:
X w e = A l n ( 1 / a w ) 1 B  
X w e = a w · X m · C 1 a w · a w · C 1 + 1
X w e = X m · c · K · a w 1 K · a w · 1 + c 1 · K · a w
where a w is the water activity (dimensionless), X w e is the equilibrium moisture content (g water/g d.m. (dry matter)), A and B are constants of the Halsey model, C is the energy constant for the BET model, K and c are constants of the GAB model and X m is the monolayer moisture content (g water/g d.m) in the GAB model.

2.4. Energy Consumption Inside the Drying Chamber

The total energy consumption ( E t ) and the specific energy required ( E k g ) for the convective drying process of red cabbage were determined by Equations (15) and (16) according to Motevali et al. [20]:
E t = A · v · ρ a i r · C p a i r · T · t
E k g = E t w 0
where A is the cross-sectional area of the container in which the sample was placed (0.0312 m2), v is the air velocity (m/s), ρ a i r is the air density (kg/m3), C p a i r is the specific heat of air (kJ/kg K), T is the temperature difference (°C) and w 0 is the initial weight of the sample (kg).
Three energy parameters were also determined, namely the specific moisture extraction rate ( S M E R ), the moisture extraction rate ( M E R ) and the specific energy consumption ( S E C ) [8]:
S M E R = w a t e r   r e m o v e d   d u r i n g   d r y i n g   k g t o t a l   e n e r g y   s u p p l i e d   i n   d r y i n g   p r o c e s s   k W h  
M E R = w a t e r   r e m o v e d   d u r i n g   d r y i n g   ( k g ) d r y i n g   t i m e   ( h )
S E C = t o t a l   e n e r g y   s u p p l i e d   i n   d r y i n g   p r o c e s s   ( k W h ) w a t e r   r e m o v e d   d u r i n g   d r y i n g   ( k g )

2.5. Rehydration Process

2.5.1. Rehydration Kinetics

Dried red cabbage samples (10 mg) were rehydrated by immersion in 250 mL of distilled water at 18 ± 1 °C. The samples were removed from the water, drained on the surface with absorbent paper, weighed and then returned to the water. The evaluation was carried out every 5 min during the first 20 min, then every 10 min up to 90 min and finally every 30 min until a constant weight of the sample. Subsequently, the moisture content (Xw(t), g water/g d.m.) [21] was determined according to Equation (20) and plotted as a function of net rehydration time.
X w ( t ) = W ( t ) W s W ( i )  
where W ( t ) was the sample weight over time, W s was the weight of the solid part of the sample and W ( i ) was the initial weight of dry matter in sample.

2.5.2. Mathematical Modeling of Rehydration Kinetics

Five mathematical models (Equations (21)–(25)) were evaluated to predict the moisture contents of red cabbage during the rehydration process at different temperatures. These models are the most commonly used to describe the rehydration process [22]:
Peleg model:
X w ( t ) = M 0 + t A + B t  
Weibull model:
X w ( t ) = M e + ( M 0 M e ) e x p ( t α β )  
First order model:
X w ( t ) = M e + ( M 0 M e ) e x p ( A t )
Exponential model:
X w ( t ) = M e + ( M 0 M e ) e x p ( A t k )
Exponential related equation:
X w ( t ) = M e 1 exp A t
where M 0 is the initial moisture content (g water/g d.m.), M e is the equilibrium moisture content (g water/g d.m.), A is the kinetic constant (min−1), B is the Peleg constant, α and β are the rate (scale) and shape parameters, respectively, in the Weibull model [8], k is the rehydration parameter in the exponential model and t is the rehydration time (min). The model parameters were determined using the iterative method and Rstudio software as described in Section 2.2.

2.5.3. Rehydration Indices

Water Absorption (Wabs) Index

The water absorption index (g water/g d.m.) was determined with Equation (26) for each sample at the end of the rehydration process.
W a b s = W ( t ) W s X w 0 W ( i )  
where W ( t ) is the sample weight over time, W s is the weight of the solid part of the sample, W ( i ) is the initial weight of dry matter in sample and X w 0 is the sample moisture content before the rehydration.

Water Holding Capacity (%WHC)

The water holding capacity was determined according to the procedure described by Wang et al. [23]. The rehydrated samples were centrifuged at 4000 rpm and 5 °C for 20 min in tubes fitted with a centrally placed metal mesh, which allowed water to drain freely from the sample. The water holding capacity (%WHC) was calculated according to Equation (27).
% W H C = W R e h W D r a W R e h × 100
where W R e h   and W D r a are the weights of the rehydrated and the drained centrifugated sample, respectively.

2.6. Microstructure Analysis

A Field Emission Scanning Electron Microscope (FESEM) (Zeiss Ultra 55, Carl Zeiss AG, Oberkochen, Germany) was used to examine the microstructure of a cross-section of the red cabbage dehydrated by convective drying at different process temperatures. The samples (0.5 cm2) were rehydrated for 10 h at room temperature. Samples were attached to a brass cryo holder using Tissue-Tek OCT compound (Sakura Finetek Inc., Torrance, CA, USA). They were frozen in slushed nitrogen to fix and stabilize their structure and composition. The frozen samples were transferred to a Quorum PP3010T cryo-SEM preparation system/cryo stage (Quorum Technologies Ltd., Laughton, UK). The chamber was kept at a constant temperature of −135 °C. The sample was sublimated at −90 °C under vacuum for 15 min. The sample’s surface was then coated with platinum in a cryo-coating chamber at 5 mA for 20 s before image analysis and capture.

2.7. Statistical Analysis

The goodness of fit of the applied mathematical models used to describe the drying kinetics, the desorption isotherms and the rehydration process were assessed by calculating the coefficient of determination (R2), the sum of squared errors (SSE) and chi-square ( χ 2 ) as described in Equations (28)–(30), respectively.
R 2 = 1 i = 1 N E x p i C a l i 2 i = 1 N E x p i E x p i ¯ 2  
S S E = 1 N i = 1 N E x p i C a l i 2  
χ 2 = i = 1 N E x p i C a l i 2 N z
where i is a specific experiment, N is the total number of experiments, E x p i is the experimental values, C a l i is the calculated values, E x p i ¯ is the average of the experimental values and z is the number of model constants. The analysis of variance (ANOVA) was performed using the Rstudio software (V. 1.4.1717) with a probability level of 5% (p = 0.05). A multiple range test (MRT) was also applied to identify homogeneous groups for Deff, Wabs and % WHC.

3. Results and Discussion

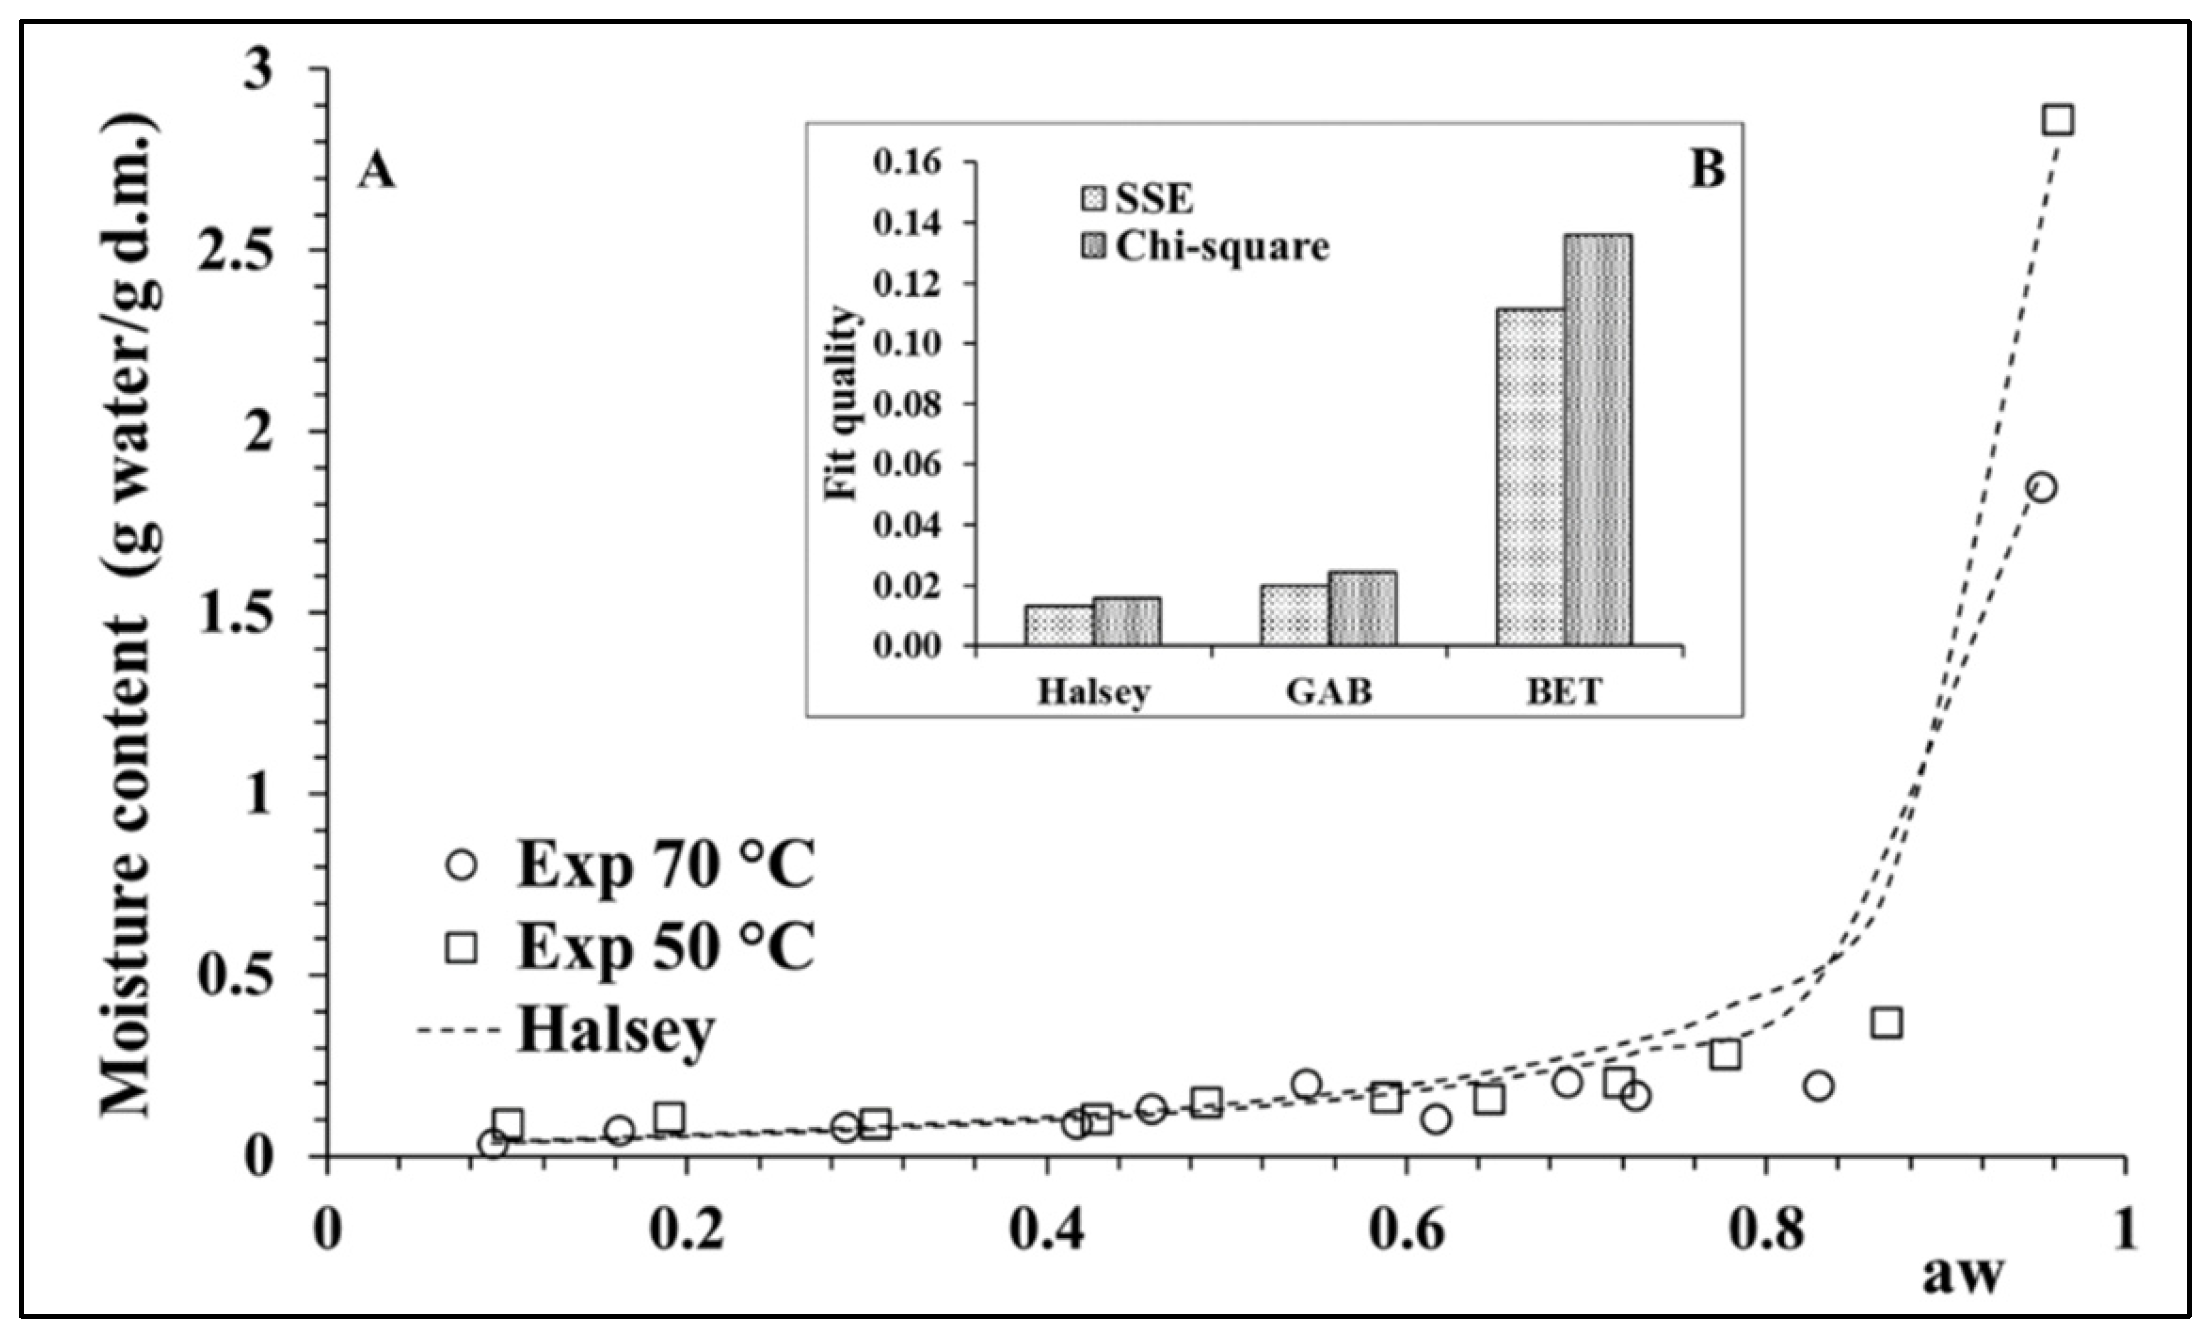
3.1. Modeling of Desorption Isotherms

The experimental data obtained for the moisture desorption isotherm at 50 and 70 °C (Figure 1A) showed a behavior that could be classified as a Type III desorption isotherm [24]; this commonly occurs and has been reported for vegetal foods [19] and is generally associated with the presence of soluble materials [25]. In the case of the red cabbage, three different zones could be observed on the desorption isotherm. The larger desorption area at aw > 0.60 is related to free water available for biochemical reactions and microbial growth. The central area (0.4 < aw < 0.6) is generally associated with a multilayer where water molecules are loosely bound to the food structure. The third area (aw < 0.4) involves the monolayer of water, which is composed of bound and non-available water molecules [26,27]. The desorption isotherm at 70 °C, especially with respect to the monolayer of water, had altogether lower moisture contents (i.e., higher bound water fraction) than the desorption isotherm at 50 °C.
The Halsey model showed the best fit to both desorption isotherms, with SSE = 0.0129, χ2 = 0.0158 and R2 = 0.989 (Figure 1B). The constants A and B of the Halsey model (Equation (12)) had values of 0.105935 and 0.9743, respectively, at 50 °C and 0.092241 and 0.9996, respectively, at 70 °C. Both desorption isotherms were almost identical up to an aw value of 0.9 and started to differ while approaching saturation pressure. Therefore, for practical purposes, the desorption isotherm at 50 °C was used for drying processes below 60 °C, while the desorption isotherm determined at 70 °C was more appropriate for drying above 60 °C.
To calculate the MR of Equation (1), the equilibrium moisture content (Xwe) was first estimated as a tentative theoretical value from the Mollier diagram for each process temperature using the water activity of the dry product. Subsequently, the Xwe was compared with the value determined by the established Halsey model, showing fair agreement. For the drying process at 50 and 60 °C, Xwe was satisfactorily determined using the Halsey model for the desorption isotherm at 50 °C, while for drying at 70, 80 and 90 °C Xwe was obtained using the desorption isotherm at 70 °C. The calculated equilibrium moisture content Xwe used in Equation (1) were 0.0672, 0.0490, 0.0379, 0.0324 and 0.0279 g water/g d.m. for 50 °C, 60 °C, 70 °C, 80 °C and 90 °C, respectively, showing a decrease in moisture content as process temperature increased [28,29].

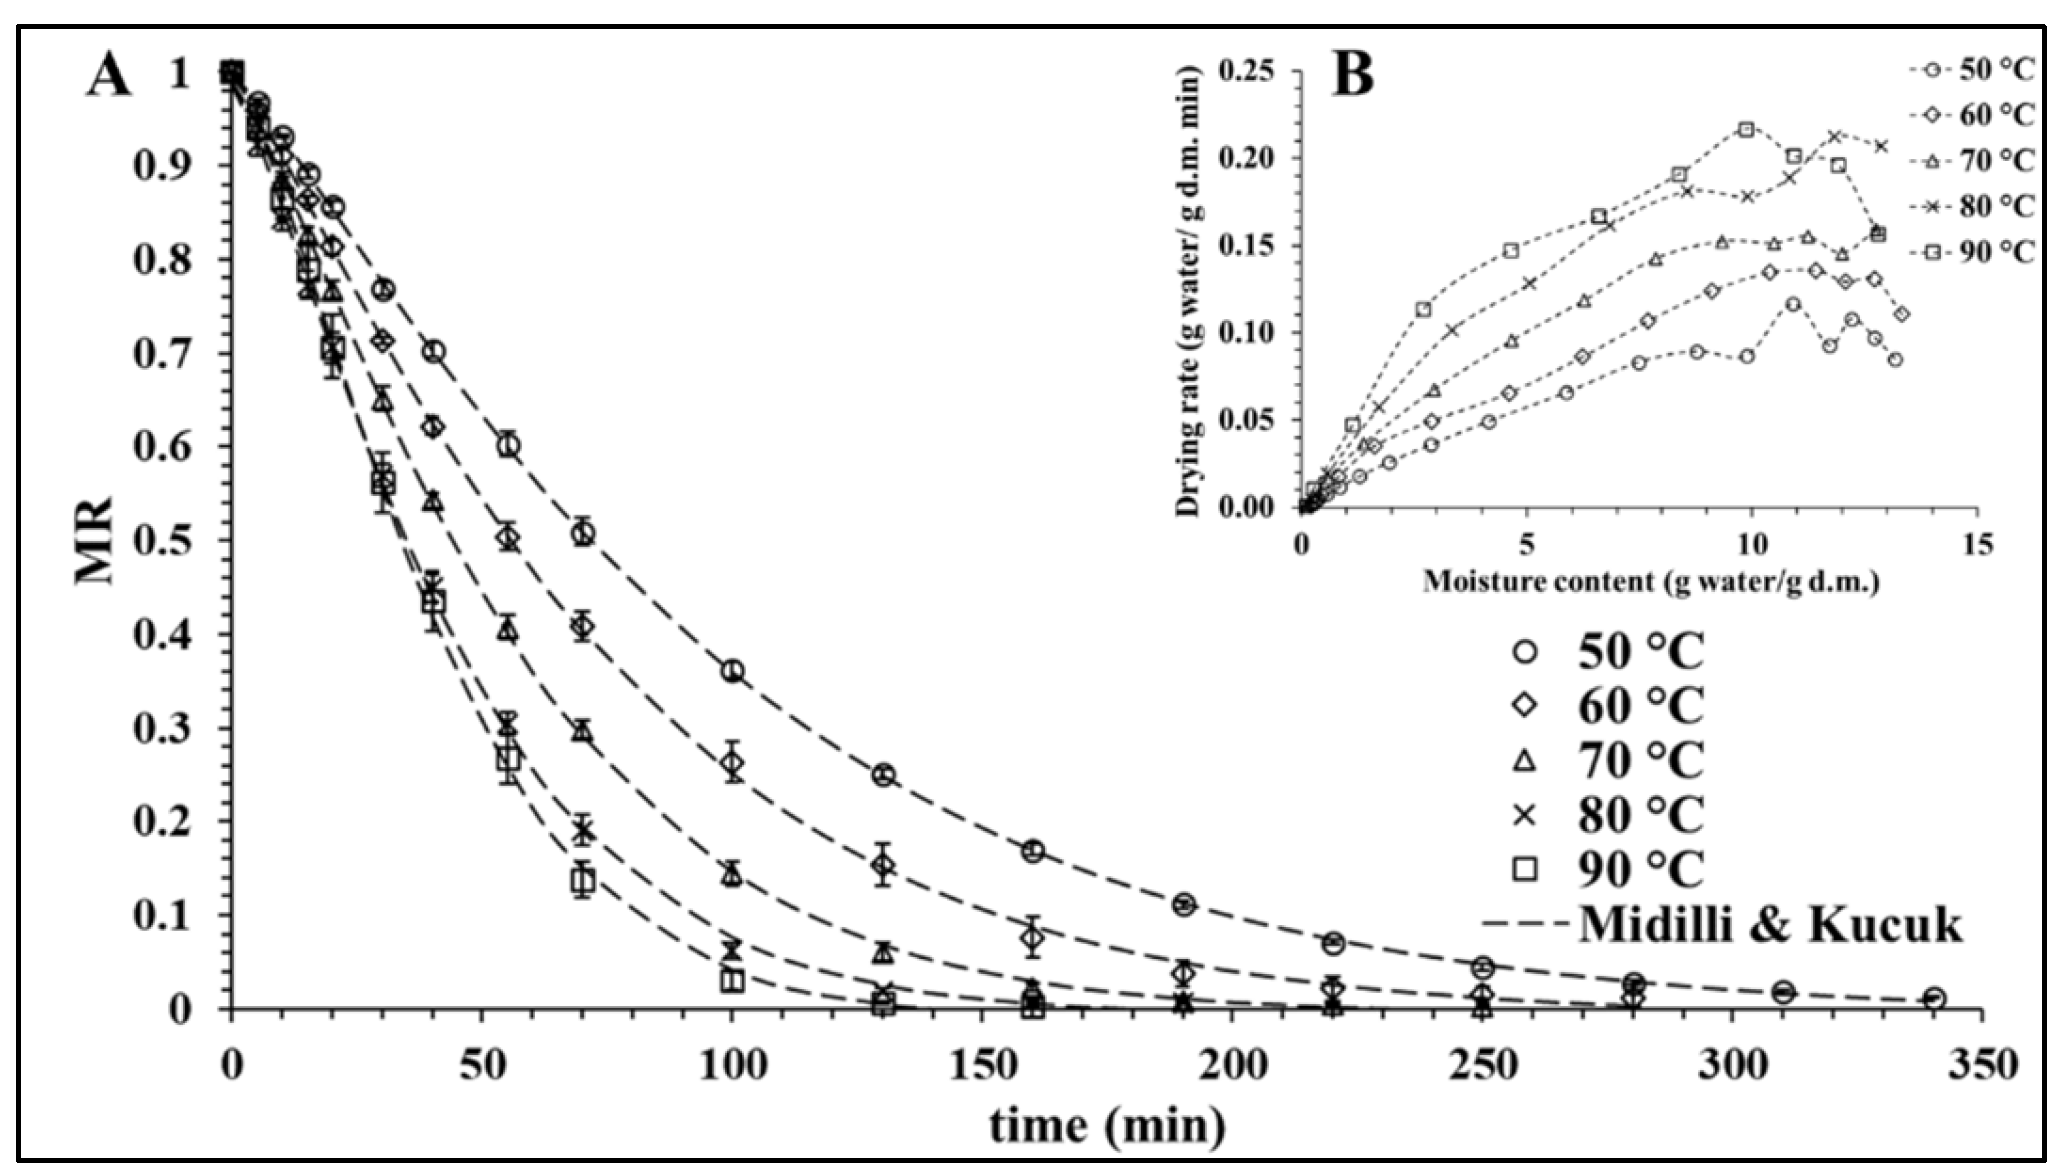
3.2. Drying Kinetics and Mathematical Modeling

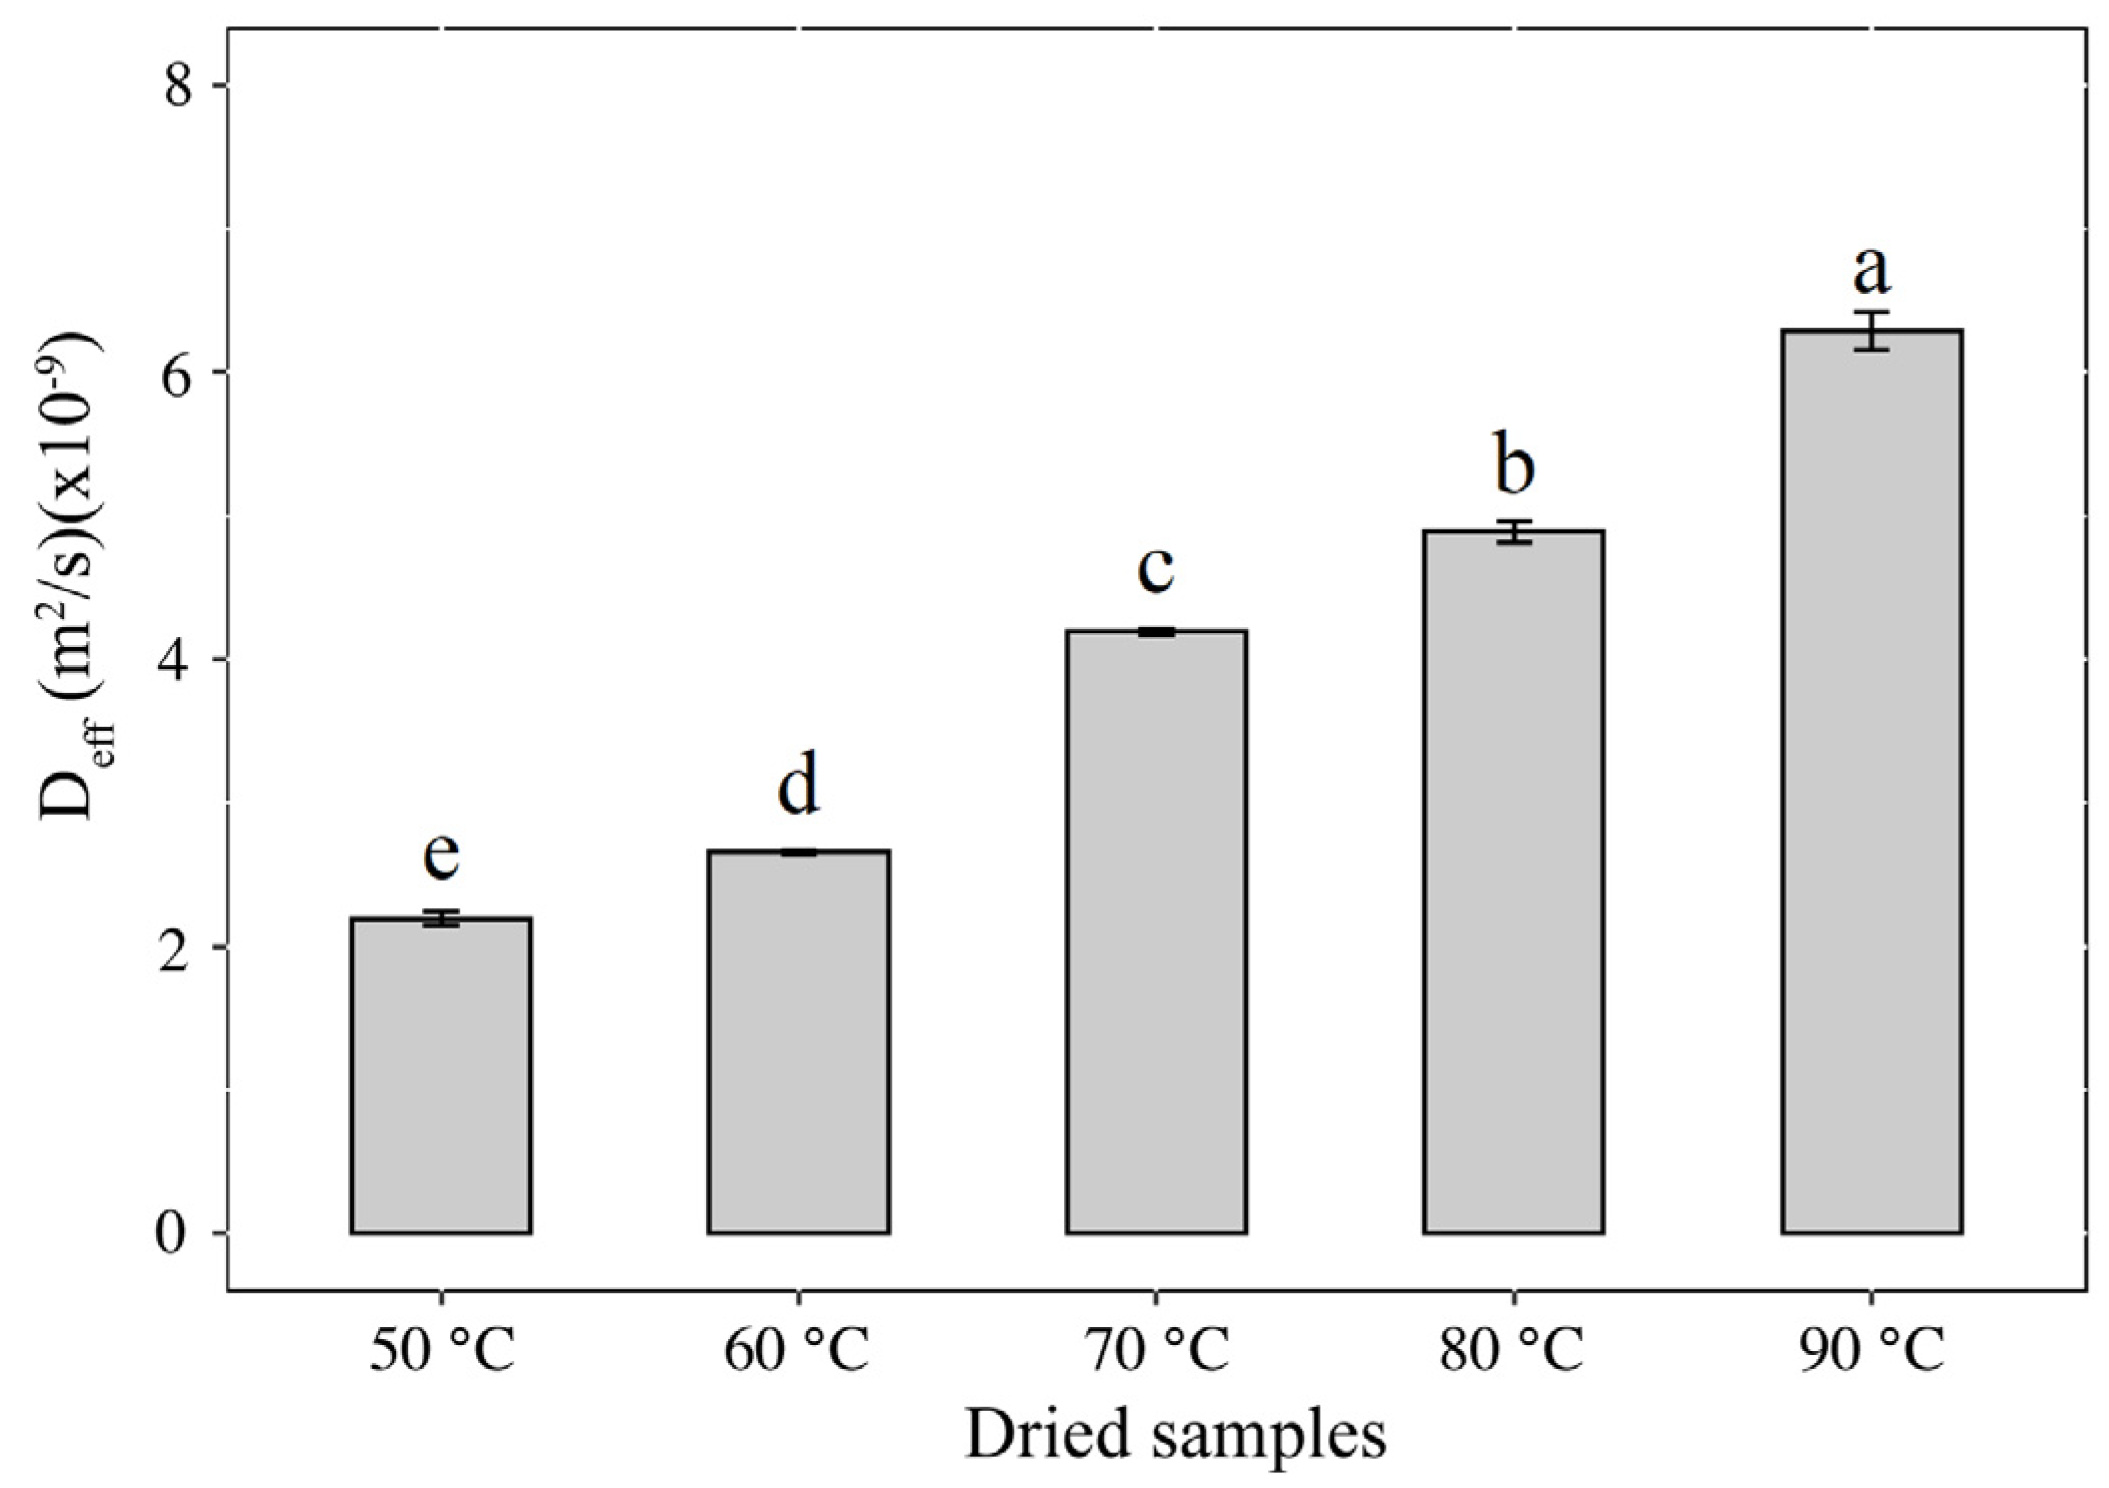
3.2.1. Drying Process and Determination of Diffusion Coefficient (Deff)

Figure 2A shows the drying kinetics of red cabbage at 50, 60, 70, 80 and 90 °C, where the moisture ratio (MR) decreased exponentially over the course of the process time (min). This behavior is commonly found in the dehydration process of fruits and vegetables [30]. The dehydration process was also faster at higher temperatures, which is a phenomenon commonly occurring during convective drying of other vegetables, such as onions [31], carrots [32], broccoli [33] and beetroots [34].
Figure 2B shows the drying rate as a function of moisture content at different temperatures. No clear period of constant drying rate occurred at all process temperatures. Only an initial adjustment period was observed during heating up of the sample before the drying rate began to fall. In this stage, the drying process of red cabbage was mainly controlled by the internal mass transfer resistance. Tao et al. [13] reported a similar phenomenon in the drying of white cabbage. A more pronounced second falling rate period occurred at higher temperatures, especially at 90 °C. At this point, the surface of the sample became dry and the amount of water removed was relatively small compared to the first falling rate period due to the slower drying process.
Seven mathematical models were used to fit the experimental data of the drying kinetics at different temperatures. As shown in Figure 2A, the Midilli and Kuçuk model showed the best fit. Table 1 shows the parameter values for each model and Table 2 shows the results of the goodness of fit. These results were consistent with other studies on dehydration of agro-food matrices, where the Midilli and Kuçuk model had been used to fit drying curves obtained from different drying technologies [35,36,37].
The k (time−n) and b (time−1) parameters of the Midilli and Kuçuk model [38] have been described as curvature and slope factor, respectively [39], with the slope factor being closely related to the drying rate [40]. The a and n parameters of the Midilli and Kuçuk model were dimensionless constants. The k parameter increased in value with an increase in process temperature. The dependence of k on temperature could be evaluated using the Arrhenius equation:
k = k 0 e x p E a R T  
The natural logarithm (ln) of both sides were taken and ln k was plotted as a function of the reciprocal temperature using the values of k at different temperatures (Table 2). The linear regression equation could then be written as l n   k = 783.97 1 T ( K ) 2.8578 and a value of 6.52 kJ/mol was determined for Ea and 17.42 for k0.
Figure 3 shows the mass diffusion coefficients at different drying temperatures. The diffusion coefficients increased in value with an increase in drying temperature. The Deff values were 2.195 ± 0.052 ( × 10−9), 2.654 ± 0.010 ( × 10−9), 4.189 ± 0.0253 ( × 10−9), 4.887 ± 0.076 ( × 10−9) and 6.281 ± 0.132 ( × 10−9) m/s2 at 50, 60, 70, 80 and 90 °C, respectively, with an 186.15% difference between the lowest and highest temperatures.
The effects of temperature on Deff could also be evaluated by using the Arrhenius equation (Equation (31)), with a plot of ln Deff as a function of the reciprocal temperature (1/K). The linear regression equation was then l n D e f f = 3184.8 1 T 10.099 with R2 = 0.9779. The pre-exponential constant D e f f 0 was determined to be 4.11 × 10⁻⁵ m/s2 and the activation energy (Ea) was determined to be 26.47 kJ/mol.

3.2.2. Energy Consumption Inside the Drying Chamber

Table 3 shows the energy consumption at each drying temperature. The total energy consumption (Et) increased between 50 °C and 70 °C, mainly due to the increase in process temperature, but consumption decreased at 80 °C and 90 °C. This effect was mainly due to a significant reduction in processing time, especially at 90 °C. Motevali et al. [20] reported similar results for convective drying, with lower energy consumption occurring at high temperatures. The energy required for drying 1 kg of red cabbage (Ekg) showed the same trend as Et, with the lowest energy consumption at 90 °C. SMER is a measure of energy efficiency of a dryer in terms of the amount of latent energy saved for removing a certain amount of water from food. The highest values of SMER occurred for drying at 50 °C and 90 °C, indicating higher system efficiencies at these temperatures [8]. In comparison, drying at 70 °C resulted in the lowest SMER value due to high energy usage (Et and Ekg) and a long process time. MER is a measure of the amount of water removed per unit time, with values ranging from 0.01876 to 0.04007 kg water removed/h for an increase in temperature from 50 to 90 °C. MER was found to depend linearly on temperature and could be evaluated using the equation MER = 0.000539T − 0.009564 with R2 = 0.97. Drying at 90 °C also resulted in the lowest SEC value due to the reduction in the total process time caused by temperature increase. These results were consistent with those found by Torki-Harchegani et al. [41], where lower SEC values were obtained at higher drying temperatures.

3.3. Rehydration Process

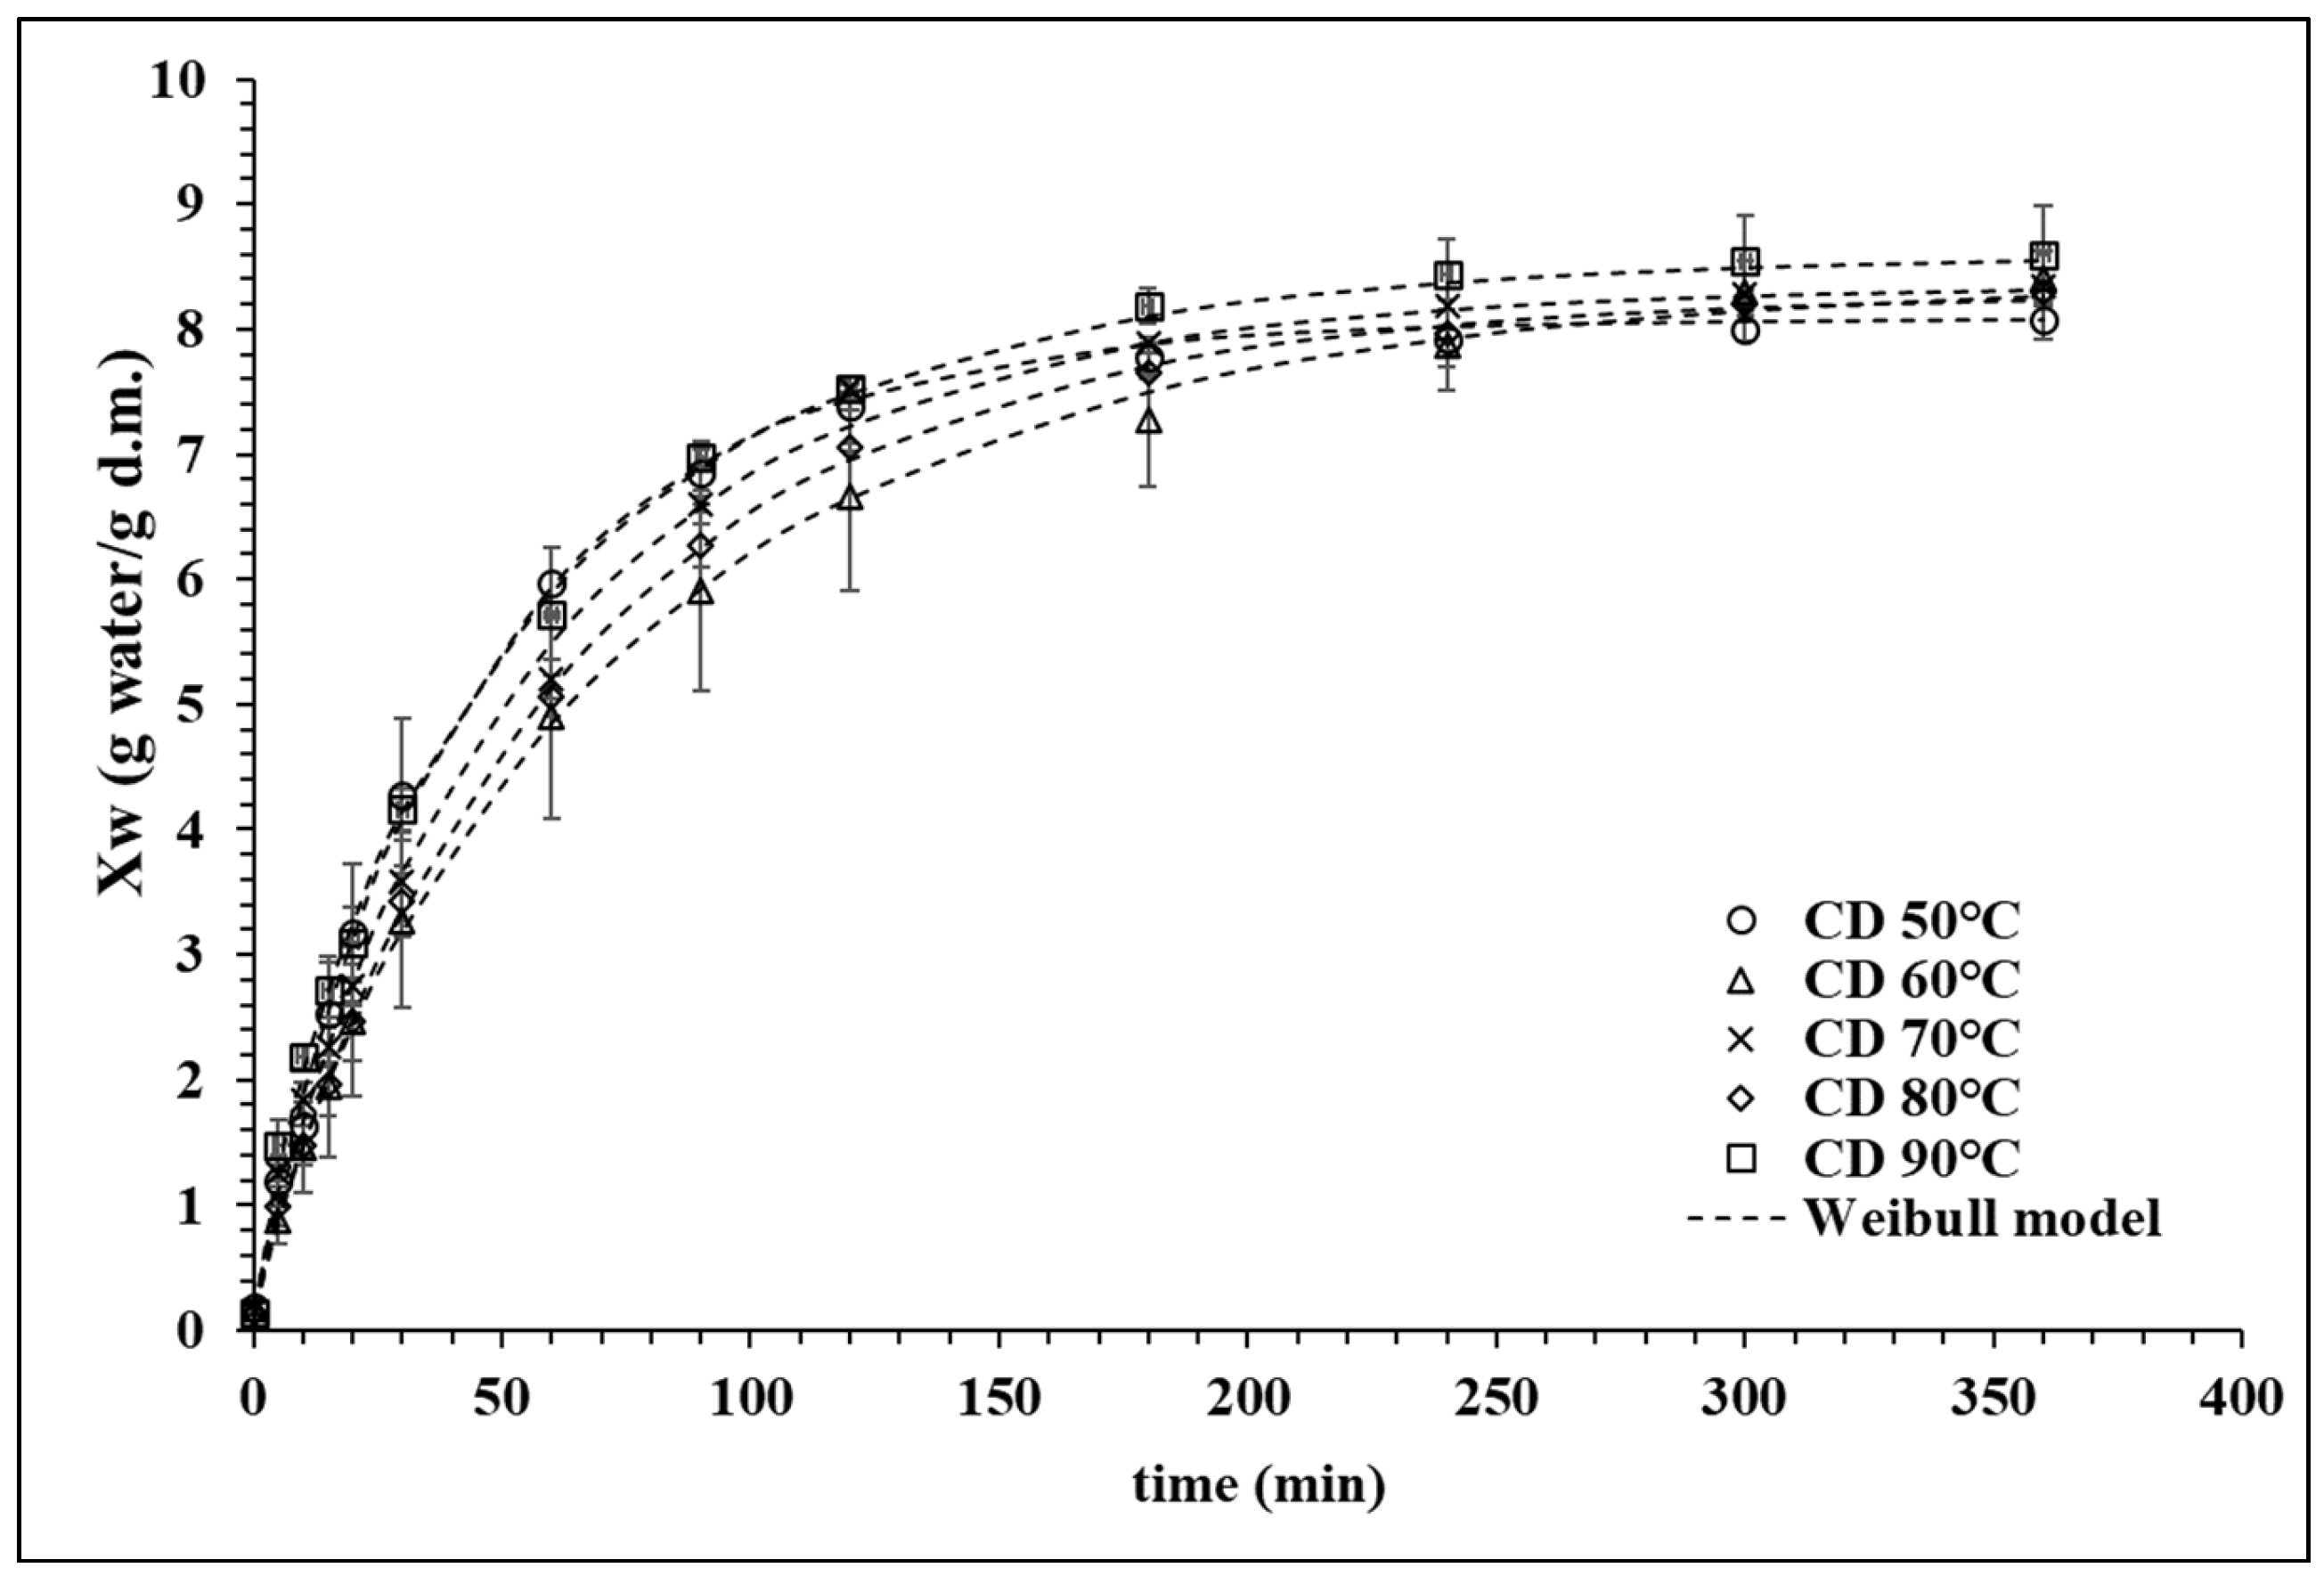
3.3.1. Rehydration Kinetics

The moisture contents of dehydrated red cabbage samples (Xw0) were determined to be 0.1871, 0.1745, 0.1550, 0.1480 and 0.1412 g/100 g w.b. for 50, 60, 70, 80 and 90 °C, respectively. A higher process temperature resulted in more moisture evaporation from the food. Figure 4 depicts the rehydration process of red cabbage dehydrated at different process temperatures. The rehydration curves exhibited an exponential increase in moisture contents for all samples, with high water absorption rates at the beginning of the process and slower absorption rates in the final stages of the process. This type of rehydration curve had been reported for different foods, such as onions [42], Rosa rubiginosa fruits [43] and tomatoes [44]. The high water absorption rates at the beginning of the process may be related to the rapid water intake in capillaries and cavities near the surface [45]. Subsequently, the water absorption rates decreased due to filling of free capillaries and intercellular spaces [21]. The 90 °C sample showed faster absorption due to less cell structure damage, which maintained the osmotic properties of the cells better than the samples processed at lower temperatures.

3.3.2. Mathematical Modelling of Rehydration Curves

Five mathematical models were used to fit the rehydration curves and the model parameters are presented in Table 4. The Weibull model had the best fit for all curves (Figure 4), with R2 = 0.9983, χ2 = 0.0127 and SEE = 0.0107. The Weibull distribution included the scale parameter (α), which was related to the reciprocal of the process rate constant, as well as the shape parameter (β), which was related to the sample geometry and transport mechanisms of the rehydration process [46,47]. The transport mechanisms were complex and diverse and included capillary imbibition, internal diffusion, convection on the surface and within large open pores and relaxation of the solid matrix. In this way, the 50 °C and 90 °C samples had the fastest rehydration processes with 1/α values of 0.022 and 0.019, respectively. Also, the β values of the samples ranged from 0.830 and 0.947, which had been reported to be related to a Fickian diffusion mechanism [48].

3.3.3. Total Water Absorption and Water Holding Capacity

Figure 5A shows the water absorption of the red cabbage samples at the end of the rehydration process. The samples showed no significant differences in values of water absorption, although the 90 °C sample had a slightly higher water absorption value. In comparison, Figure 5B shows that the red cabbage samples had different water holding capacities; the 90 °C sample showing a water holding capacity of almost 71%, whereas the 50 °C sample showed a value only close to 22%. These results are consistent with those reported by Afrin et al. [49], where orange samples dried at higher temperatures exhibited higher water holding capacity. This phenomenon could be related to cellular rupture and dislocation caused by the drying process [50], especially in samples that were exposed to heat over long periods, such as the 50 °C sample. In comparison, the 90 °C sample was subjected to less processing time and exposure to heat, resulting in less damage to the cell structure.

3.4. Microstructure Evaluation

Figure 6 shows the changes in microstructure of red cabbage subjected to convective drying at different temperatures. When examining the microstructure of fresh red cabbage (Figure 6a), intact and well-organized compartments could be observed, showing clearly oval cells. However, air temperatures used in drying processes can cause significant tissue shrinkage and collapse [51]. The oval cells would be deformed and folded and the intercellular spaces wrinkled, which is usually attributed to the temporary formation of a gradient of heat and moisture, along with a denaturation of specific chemical constituents [52,53]. As observed in the drying assays of red cabbage, the degree of deformation changed with drying temperature. While the cell walls of the samples dried at 50 °C (Figure 6b) and 60 °C (Figure 6c) were clearly deformed, the cell walls of the samples exposed to 70 °C (Figure 6d), 80 °C (Figure 6e) and 90 °C (Figure 6f) suffered less damage. This behavior might be due particularly to the different drying times (see Section 3.2.1). A prolonged drying process led to higher deformation of the cell shape compared to faster drying. Similar results were also observed by Pashazadeh et al. [53].
In addition, the microstructure was closely related to the rehydration rate [7]. As the degree of shrinkage and damage was obviously lower in the 90 °C sample, it was easier for water to penetrate inside the sample. In comparison, the 50 °C sample experienced structural cell collapse, leading to levelling of the rehydration curve at 180 min, which was much earlier than the other samples, so that the ability of to hold water was worse at that temperature. Qiu et al. [54] reported similar results, with mushrooms dried at 90 °C having higher water holding capacity compared with samples dried at lower temperatures.

4. Conclusions

This study examined the effects of convective drying temperature on desorption isotherm behavior, drying kinetics, energy consumption, rehydration behavior and microstructure of red cabbage. The Halsey model showed the best fit to experimental data of the desorption isotherm and could be used to determine the equilibrium moisture contents of red cabbage. For the drying kinetics, an exponential decrease in moisture ratio as a function of time was observed, with the Midilli and Kuçuk model showing the best fit to the experimental data. An increase in drying temperature led to shorter process times and an increase in moisture diffusion coefficients. The short drying processes at higher temperatures led to lower energy consumption inside the drying chamber. The Weibull model showed the best fit to the experimental rehydration curves, which suggests the occurrence of a Fickian diffusion in the red cabbage samples. The sample dried at 90 °C had the highest water holding capacity, which could be related to the effects of the drying process on the red cabbage microstructure. Scanning electron micrographs showed the 90 °C sample exhibited less cell structure damage. This was due to lesser heat exposure from the shorter process time at 90 °C. Finally, the models provided in this study can be utilized effectively not only in calculation and design related to convective drying process but also in calculation of required parameters in the design of other common thermal treatments of red cabbage such as cooking and blanching.

Supplementary Materials

The following supporting information can be downloaded at: https://www.mdpi.com/article/10.3390/pr12030509/s1, Table S1: Relative humidity of the eleven saturated salt solutions at different temperatures.

Author Contributions

Project administration, A.V.-G.; Validation, A.V.-G.; formal analysis, L.S.G.-P.; methodology, L.S.G.-P.; writing-original draft preparation, L.S.G.-P. and C.B.-S.; writing—review and editing, K.S.A.-H. and P.G.-S.; data curation, F.Z.; investigation, F.Z.; visualization, N.M.; conceptualization, A.P.; supervision, A.P. All authors have read and agreed to the published version of the manuscript.

Funding

This research was funded by the Agencia Nacional de Investigación y Desarrollo, ANID-Chile, grant number FONDECYT 1210124.

Data Availability Statement

Data are contained within the article.

Conflicts of Interest

The authors declare no conflicts of interest.

References

  1. Xu, Y.; Xiao, Y.; Lagnika, C.; Li, D.; Liu, C.; Jiang, N.; Song, J.; Zhang, M. A Comparative Evaluation of Nutritional Properties, Antioxidant Capacity and Physical Characteristics of Cabbage (Brassica oleracea var. Capitate var L.) Subjected to Different Drying Methods. Food Chem. 2020, 309, 124935. [Google Scholar] [CrossRef]
  2. Drozdowska, M.; Leszczyńska, T.; Piasna-Słupecka, E.; Domagała, D.; Koronowicz, A. Young Shoots and Mature Red Cabbage Inhibit Proliferation and Induce Apoptosis of Prostate Cancer Cell Lines. Appl. Sci. 2021, 11, 11507. [Google Scholar] [CrossRef]
  3. Hanschen, F.S. Domestic boiling and salad preparation habits affect glucosinolate degradation in red cabbage (Brassica oleracea var. capitata f. rubra). Food Chem. 2020, 321, 126694. [Google Scholar] [CrossRef] [PubMed]
  4. Liu, J.; Li, X.; Yang, Y.; Wei, H.; Xue, L.; Zhao, M.; Cai, J. Optimization of Combined Microwave and Hot Air Drying Technology for Purple Cabbage by Response Surface Methodology (RSM). Food Sci. Nutr. 2021, 9, 4568–4577. [Google Scholar] [CrossRef] [PubMed]
  5. Zanoni, F.; Primiterra, M.; Angeli, N.; Zoccatelli, G. Microencapsulation by Spray-Drying of Polyphenols Extracted from Red Chicory and Red Cabbage: Effects on Stability and Color Properties. Food Chem. 2020, 307, 125535. [Google Scholar] [CrossRef]
  6. Ali, A.; Oon, C.C.; Chua, B.L.; Figiel, A.; Chong, C.H.; Wojdylo, A.; Turkiewicz, I.P.; Szumny, A.; Łyczko, J. Volatile and polyphenol composition, anti-oxidant, anti-diabetic and antiaging properties, and drying kinetics as affected by convective and hybrid vacuum microwave drying of Rosmarinus officinalis L. Ind. Crops Prod. 2020, 151, 112463. [Google Scholar] [CrossRef]
  7. Guo, X.; Hao, Q.; Qiao, X.; Li, M.; Qiu, Z.; Zheng, Z.; Zhang, B. An evaluation of different pretreatment methods of hot-air drying of garlic: Drying characteristics, energy consumption and quality properties. LWT Food Sci. Technol. 2023, 180, 114685. [Google Scholar] [CrossRef]
  8. Altay, K.; Hayaloglu, A.A.; Dirim, S.N. Determination of the Drying Kinetics and Energy Efficiency of Purple Basil (Ocimum basilicum L.) Leaves Using Different Drying Methods. Heat Mass Transf. 2019, 55, 2173–2184. [Google Scholar] [CrossRef]
  9. Ojediran, J.O.; Okonkwo, C.E.; Olaniran, A.F.; Iranloye, Y.M.; Adewumi, A.D.; Erinle, O.; Afolabi, Y.T.; Adeyi, O.; Adeyi, A. Hot air convective drying of hog plum fruit (Spondias mombin): Effects of physical and edible-oil-aided chemical pretreatments on drying and quality characteristics. Heliyon 2021, 7, e08312. [Google Scholar] [CrossRef]
  10. Seremet, L.; Botez, E.; Nistor, O.V.; Andronoiu, D.G.; Mocanu, G.D. Effect of Different Drying Methods on Moisture Ratio and Rehydration of Pumpkin Slices. Food Chem. 2016, 195, 104–109. [Google Scholar] [CrossRef]
  11. Doymaz, İ. Drying Kinetics, Rehydration and Colour Characteristics of Convective Hot-Air Drying of Carrot Slices. Heat Mass Transf. 2017, 53, 25–35. [Google Scholar] [CrossRef]
  12. Ponwiboon, N.; Rojanakorn, T. Desorption isotherms and drying characteristics of Nile tilapia fish sheet. Int. Food Res. J. 2017, 24, 1292–1300. [Google Scholar]
  13. Tao, Y.; Han, M.; Gao, X.; Han, Y.; Show, P.L.; Liu, C.; Ye, X.; Xie, G. Applications of Water Blanching, Surface Contacting Ultrasound-Assisted Air Drying, and Their Combination for Dehydration of White Cabbage: Drying Mechanism, Bioactive Profile, Color and Rehydration Property. Ultrason. Sonochem. 2019, 53, 192–201. [Google Scholar] [CrossRef]
  14. Vega-Gálvez, A.; Uribe, E.; Pastén, A.; Vega, M.; Poblete, J.; Bilbao-Sainz, C.; Chiou, B. Sen Low-Temperature Vacuum Drying as Novel Process to Improve Papaya (Vasconcellea pubescens) Nutritional-Functional Properties. Futur. Foods 2022, 5, 100117. [Google Scholar] [CrossRef]
  15. Inyang, U.E.; Oboh, I.O.; Etuk, B.R. Kinetic Models for Drying Techniques—Food Materials. Adv. Chem. Eng. Sci. 2018, 8, 27–48. [Google Scholar] [CrossRef]
  16. Ritz, C.; Baty, F.; Streibig, J.C.; Gerhard, D. Dose-Response Analysis Using R. PLoS ONE 2015, 10, e0146021. [Google Scholar] [CrossRef] [PubMed]
  17. Spiess, W.; Wolf, W. The results of the COST 90 project on water activity. In Physical Properties of Foods; Jowitt, R., Escher, F., Hallstrom, F., Meffert, M., Spiess, W., Vos, G., Eds.; Applied Science Publisher: London, UK, 1983; pp. 65–91. [Google Scholar]
  18. Association of Official Analytical Chemist Official Methods of Analysis. AOAC Official Method 934.06, Moisture in Dried Fruits, 17th ed.; Association of Official Analytical Chemist Official Methods of Analysis: Rockville, MD, USA, 2000. [Google Scholar]
  19. Kemmene Dapabko, S.; Jiokap Nono, Y.; Arebga, A.W.; Kapseu, C.; Puiggali, J.R. Determination and Modeling Desorption Isotherms of Okra (Abelmoschus esculentus L. Moench) and Sweet Green Pepper (Capsicum annum L. Moench). J. Biosyst. Eng. 2021, 46, 60–80. [Google Scholar] [CrossRef]
  20. Motevali, A.; Minaei, S.; Khoshtagaza, M.H. Evaluation of Energy Consumption in Different Drying Methods. Energy Convers. Manag. 2011, 52, 1192–1199. [Google Scholar] [CrossRef]
  21. Vega-Gálvez, A.; Notte-Cuello, E.; Lemus-Mondaca, R.; Zura, L.; Miranda, M. Mathematical Modelling of Mass Transfer during Rehydration Process of Aloe Vera (Aloe barbadensis miller). Food Bioprod. Process. 2009, 87, 254–260. [Google Scholar] [CrossRef]
  22. Ghellam, M.; Koca, I. Modelling of Rehydration Kinetics of Desert Truffles (Terfezia spp.) Dried by Microwave Oven. Turk. J. Agric. Food Sci. Technol. 2020, 8, 407. [Google Scholar] [CrossRef]
  23. Wang, J.; Bai, T.; Wang, D.; Fang, X.; Xue, L.; Zheng, Z.; Gao, Z.; Xiao, H.W. Pulsed Vacuum Drying of Chinese Ginger (Zingiber officinale roscoe) Slices: Effects on Drying Characteristics, Rehydration Ratio, Water Holding Capacity, and Microstructure. Dry. Technol. 2018, 37, 301–311. [Google Scholar] [CrossRef]
  24. Mallek-Ayadi, S.; Bahloul, N.; Kechaou, N. Mathematical Modelling of Water Sorption Isotherms and Thermodynamic Properties of Cucumis Melo L. Seeds. LWT 2020, 131, 109727. [Google Scholar] [CrossRef]
  25. Caballero-Cerón, C.; Guerrero-Beltrán, J.A.; Mújica-Paz, H.; Torres, J.A.; Welti-Chanes, J. Moisture Sorption Isotherms of Foods: Experimental Methodology, Mathematical Analysis, and Practical Applications. In Water Stress in Biological, Chemical, Pharmaceutical and Food Systems; Gutiérrez-López, G., Alamilla-Beltrán, L., del Pilar Buera, M., Welti-Chanes, J., Parada-Arias, E., Barbosa-Cánovas, G., Eds.; Food Engineering Series; Springer: New York, NY, USA, 2015. [Google Scholar] [CrossRef]
  26. Al-Muhtaseb, A.H.; McMinn, W.A.M.; Magee, T.R.A. Moisture Sorption Isotherm Characteristics of Food Products: A Review. Food Bioprod. Process. Trans. Inst. Chem. Eng. Part C 2002, 80, 118–128. [Google Scholar] [CrossRef]
  27. Seetapan, N.; Limparyoon, N.; Fuongfuchat, A.; Gamonpilas, C.; Methacanon, P. Effect of Freezing Rate and Starch Granular Morphology on Ice Formation and Non-Freezable Water Content of Flour and Starch Gels. Int. J. Food Prop. 2015, 19, 1616–1630. [Google Scholar] [CrossRef]
  28. Bellagha, S.; Sahli, A.; Zid, M.B.; Farhat, A. Desorption Isotherms of Fresh and Osmotically Dehydrated Apples (Golden Delicious). Rev. Énergies Renouv. 2008, 2, 45–52. [Google Scholar]
  29. Pankaew, P.; Janjai, S.; Nilnont, W.; Phusampao, C.; Bala, B.K. Moisture Desorption Isotherm, Diffusivity and Finite Element Simulation of Drying of Macadamia Nut (Macadamia integrifolia). Food Bioprod. Process. 2016, 100, 16–24. [Google Scholar] [CrossRef]
  30. Onwude, D.I.; Hashim, N.; Janius, R.B.; Nawi, N.M.; Abdan, K. Modeling the Thin-Layer Drying of Fruits and Vegetables: A Review. Compr. Rev. Food Sci. Food Saf. 2016, 15, 599–618. [Google Scholar] [CrossRef] [PubMed]
  31. Demiray, E.; Seker, A.; Tulek, Y. Drying Kinetics of Onion (Allium cepa L.) Slices with Convective and Microwave Drying. Heat Mass Transf. 2017, 53, 1817–1827. [Google Scholar] [CrossRef]
  32. Sonmete, M.H.; Mengeş, H.O.; Ertekin, C.; Özcan, M.M. Mathematical Modeling of Thin Layer Drying of Carrot Slices by Forced Convection. J. Food Meas. Charact. 2017, 11, 629–638. [Google Scholar] [CrossRef]
  33. Liu, Z.L.; Bai, J.W.; Yang, W.X.; Wang, J.; Deng, L.Z.; Yu, X.L.; Zheng, Z.A.; Gao, Z.J.; Xiao, H.W. Effect of High-Humidity Hot Air Impingement Blanching (HHAIB) and Drying Parameters on Drying Characteristics and Quality of Broccoli Florets. Dry. Technol. 2019, 37, 1251–1264. [Google Scholar] [CrossRef]
  34. Manjunatha, S.S.; Raju, P.S. Mathematical Modelling the Drying Kinetics of Beetroot Strips during Convective Drying at Different Temperatures. Def. Life Sci. J. 2019, 4, 140–149. [Google Scholar] [CrossRef]
  35. Benseddik, A.; Azzi, A.; Zidoune, M.N.; Allaf, K. Mathematical Empirical Models of Thin-Layer Airflow Drying Kinetics of Pumpkin Slice. Eng. Agric. Environ. Food 2018, 11, 220–231. [Google Scholar] [CrossRef]
  36. Demirpolat, A.B. Investigation of Mass Transfer with Different Models in a Solar Energy Food-Drying System. Energies 2019, 12, 3447. [Google Scholar] [CrossRef]
  37. Ambawat, S.; Sharma, A.; Saini, R. Mathematical Modeling of Thin Layer Drying Kinetics and Moisture Diffusivity Study of Pretreated Moringa Oleifera Leaves Using Fluidized Bed Dryer. Processes 2022, 10, 2464. [Google Scholar] [CrossRef]
  38. Naderinezhad, S.; Etesami, N.; Najafabady, A.P.; Falavarjani, M.G. Mathematical Modeling of Drying of Potato Slices in a Forced Convective Dryer Based on Important Parameters. Food Sci. Nutr. 2016, 4, 110–118. [Google Scholar] [CrossRef]
  39. Koukouch, A.; Idlimam, A.; Asbik, M.; Sarh, B.; Izrar, B.; Bah, A.; Ansari, O. Thermophysical Characterization and Mathematical Modeling of Convective Solar Drying of Raw Olive Pomace. Energy Convers. Manag. 2015, 99, 221–230. [Google Scholar] [CrossRef]
  40. Midilli, A.; Kucuk, H.; Yapar, Z. A New Model for Single-Layer Drying. Dry. Technol. 2002, 20, 1503–1513. [Google Scholar] [CrossRef]
  41. Torki-Harchegani, M.; Ghanbarian, D.; Ghasemi Pirbalouti, A.; Sadeghi, M. Dehydration Behaviour, Mathematical Modelling, Energy Efficiency and Essential Oil Yield of Peppermint Leaves Undergoing Microwave and Hot Air Treatments. Renew. Sustain. Energy Rev. 2016, 58, 407–418. [Google Scholar] [CrossRef]
  42. Maftoonazad, N.; Dehghani, M.R.; Ramaswamy, H.S. Hybrid Microwave-Hot Air Tunnel Drying of Onion Slices: Drying Kinetics, Energy Efficiency, Product Rehydration, Color, and Flavor Characteristics. Dry. Technol. 2020, 40, 966–986. [Google Scholar] [CrossRef]
  43. Ohaco, E.H.; Ichiyama, B.; Lozano, J.E.; De Michelis, A. Rehydration of Rosa Rubiginosa Fruits Dried with Hot Air. Dry. Technol. 2015, 33, 696–703. [Google Scholar] [CrossRef]
  44. Lopez-Quiroga, E.; Prosapio, V.; Fryer, P.J.; Norton, I.T.; Bakalis, S. Model Discrimination for Drying and Rehydration Kinetics of Freeze-Dried Tomatoes. J. Food Process Eng. 2020, 43, e13192. [Google Scholar] [CrossRef]
  45. Doymaz, I.; Kocayigit, F. Drying and Rehydration Behaviors of Convection Drying of Green Peas. Dry. Technol. 2011, 29, 1273–1282. [Google Scholar] [CrossRef]
  46. Aravindakshan, S.; Nguyen, T.H.A.; Kyomugasho, C.; Buvé, C.; Dewettinck, K.; Van Loey, A.; Hendrickx, M.E. The Impact of Drying and Rehydration on the Structural Properties and Quality Attributes of Pre-Cooked Dried Beans. Foods 2021, 10, 1665. [Google Scholar] [CrossRef] [PubMed]
  47. Marabi, A.; Livings, S.; Jacobson, M.; Saguy, I.S. Normalized Weibull Distribution for Modeling Rehydration of Food Particulates. Eur. Food Res. Technol. 2003, 217, 311–318. [Google Scholar] [CrossRef]
  48. Marabi, A.; Saguy, I. Effect of Porosity on Rehydration of Dry Food Particulates. J. Sci. Food Agric. 2004, 84, 1105–1110. [Google Scholar] [CrossRef]
  49. Afrin, S.M.; Acharjee, A.; Sit, N. Convective Drying of Orange Pomace at Different Temperatures and Characterization of the Obtained Powders. J. Food Sci. Technol. 2022, 59, 1040–1052. [Google Scholar] [CrossRef] [PubMed]
  50. Ngamwonglumlert, L.; Devahastin, S. Microstructure and Its Relationship with Quality and Storage Stability of Dried Foods; Devahastin, S., Ed.; Woodhead Publishing: Sawston, UK; Elsevier: Amsterdam, The Netherlands, 2018; ISBN 9780081007648. [Google Scholar]
  51. Mahiuddin, M.; Khan, M.I.H.; Kumar, C.; Rahman, M.M.; Karim, M.A. Shrinkage of Food Materials During Drying: Current Status and Challenges. Compr. Rev. Food Sci. Food Saf. 2018, 17, 1113–1126. [Google Scholar] [CrossRef] [PubMed]
  52. Chumroenphat, T.; Somboonwatthanakul, I.; Saensouk, S.; Siriamornpun, S. Changes in Curcuminoids and Chemical Components of Turmeric (Curcuma longa L.) under Freeze-Drying and Low-Temperature Drying Methods. Food Chem. 2021, 339, 128121. [Google Scholar] [CrossRef]
  53. Pashazadeh, H.; Redha, A.A.; Koca, I. Effect of convective drying on phenolic acid, flavonoid and anthocyanin content, texture and microstructure of black rosehip fruit. J. Food Compost. Anal. 2024, 125, 105738. [Google Scholar] [CrossRef]
  54. Qiu, Y.; Bi, J.; Jin, X.; Hu, L.; Lyu, J.; Wu, X. An Understanding of the Changes in Water Holding Capacity of Rehydrated Shiitake Mushroom (Lentinula edodes) from Cell Wall, Cell Membrane and Protein. Food Chem. 2021, 351, 129230. [Google Scholar] [CrossRef]
Figure 1. (A) Experimental isotherm curves at 50 and 70 °C with the Halsey model predictions. (B) Fit quality of desorption isotherm models.
Processes 12 00509 g001
Figure 2. (A) Drying kinetics at five different process temperatures and the Midilli and Kucuk model fit. (B) Drying rate as a function of moisture content at different temperatures.
Processes 12 00509 g002
Figure 3. Diffusion coefficients at different drying temperatures. On the bars, different letters (a, b, c, d and e) indicate significant differences as per Multiple Range Test (MRT) (p < 0.05).
Processes 12 00509 g003
Figure 4. Rehydration curves of red cabbage dehydrated at five different process temperatures.
Processes 12 00509 g004
Figure 5. (A) Total water absorbed at equilibrium time; (B) Water holding capacity (%WHC). On the bars, different letters (a, b and c) indicate significant differences as per Multiple Range Test (MRT) (p < 0.05).
Processes 12 00509 g005
Figure 6. Microstructure of rehydrated red cabbage samples dried by convective drying at different process temperatures: (a) fresh; (b) 50 °C; (c) 60 °C; (d) 70 °C; (e) 80 °C and (f) 90 °C. ǀ―ǀ 20 µm.
Processes 12 00509 g006
Table 1. Mathematical model parameters for convective drying kinetics of red cabbage at different temperatures.
Drying Temperature (°C)
Models 5060708090
Newtonk0.010180 ± 0.0001650.012997 ± 0.0005400.016560 ± 0.0005250.020880 ± 0.0006880.021913 ± 0.001590
Pagek0.004708 ± 0.0002880.005883 ± 0.0008430.006623 ± 0.0005400.009064 ± 0.0008700.005749 ± 0.001787
n1.169864 ± 0.0105971.188153 ± 0.0445931.230600 ± 0.0114041.223348 ± 0.0194401.371160 ± 0.067486
Page mod.k0.010240 ± 0.0001700.013190 ± 0.0005860.016937 ± 0.0005050.021347 ± 0.0006980.022707 ± 0.001461
n1.169863 ± 0.0105971.188227 ± 0.0447161.230600 ± 0.0114011.223347 ± 0.0194371.371153 ± 0.067494
Logarithmick0.009506 ± 0.0002740.012230 ± 0.0003810.015837 ± 0.0004420.019757 ± 0.0010170.020080 ± 0.001790
c−0.050276 ± 0.007538−0.050397 ± 0.008757−0.046493 ± 0.001611−0.051090 ± 0.007556−0.088337 ± 0.017672
a1.078039 ± 0.0061401.081223 ± 0.0148451.081893 ± 0.0057511.082523 ± 0.0064301.141067 ± 0.026083
Weibullβ97.6603 ± 1.6257075.9217 ± 3.2904659.0857 ± 1.75080446.8750 ± 1.5529744.1670 ± 2.808941
α1.169667 ± 0.0105991.188000 ± 0.0446771.230333 ± 0.0113721.223333 ± 0.0193991.371333 ± 0.067300
Silva and Aliia0.012630 ± 0.0001670.016533 ± 0.0013690.021773 ± 0.0003040.027243 ± 0.0011970.032503 ± 0.001183
b−0.021893 ± 0.000320−0.027323 ± 0.006212−0.035607 ± 0.002063−0.038813 ± 0.004110−0.062863 ± 0.006886
Midilli and Kuçuka0.998500 ± 0.0040630.997967 ± 0.0044410.989249 ± 0.0049200.986276 ± 0.0065550.989854 ± 0.001858
k0.004788 ± 0.0004430.005674 ± 0.0005700.005957 ± 0.0001840.006740 ± 0.0010770.006097 ± 0.001637
n1.164000 ± 0.0165231.182000 ± 0.0401501.251335 ± 0.0028881.251189 ± 0.0000121.390367 ± 0.067817
c−0.000018 ± 0.000007−0.000026 ± 0.000018−0.000020 ± 0.000007−0.000027 ± 0.000012−0.000051 ± 0.000013
Table 2. Statistical fit for each mathematical model of the drying kinetics.
StatisticsR2
Models/T °C5060708090Average
Newton0.993070.981160.993970.985720.986050.987996
Page0.999890.999490.999830.999590.999450.999650
Page mod0.999890.999490.999830.999590.999450.999650
Logarithmic0.998070.990860.997640.986440.994480.993497
Weibull0.999890.999490.999830.999590.999450.999650
Silva and Alii0.999310.997910.999140.997660.997860.998375
Midilli and kucuk0.999940.999830.999860.999650.999510.999757
SSE
Newton0.00072330.00176540.00052530.00135860.00140100.001155
Page0.00000790.00003180.00001320.00003170.00005150.000027
Page mod0.00000880.00004110.00001320.00003170.00005150.000029
Logarithmic0.00018480.00057400.00014870.00042480.00052890.000372
Weibull0.00000880.00004100.00001320.00003170.00005150.000029
Silva and Alii0.00006940.00018570.00007280.00021050.00021110.000150
Midilli and kucuk0.00000570.00001200.00001070.00002910.00004770.000021
χ2
Newton0.0007610.0018490.0005580.0014560.0015180.001228
Page0.0000090.0000350.0000150.0000370.0000610.000031
Page mod0.0000100.0000450.0000150.0000370.0000610.000033
Logarithmic0.0002170.0006650.0001810.0005310.0006880.000456
Weibull0.0000100.0000450.0000150.0000370.0000610.000033
Silva and Alii0.0000770.0002040.0000820.0002430.0002490.000171
Midilli and kucuk0.0000070.0000150.0000140.0000400.0000690.000029
Table 3. Energy consumption parameters for red cabbage dehydration by convective drying.
Drying Temperature (°C) Process Time (h)Et (kWh)Ekg
(kWh/kg Sample)
SMER
(kg Water Removed/kWh)
MER
(kg Water Removed/h)
SEC
(kWh/kg Water Removed)
505.6708.75475.860.012150.0187682.31
604.6709.32281.210.011290.0225388.58
704.16710.09386.970.010610.0257194.21
803.1678.95877.050.011960.0338383.61
902.6708.56873.980.012490.0400780.06
Table 4. Parameters of the kinetic models for the rehydration process.
Drying Temperature
Rehydration
Models
5060708090
First orderA0.023 ± 0.0050.014 ± 0.0040.018 ± 0.0010.016 ± 0.0010.021 ± 0.003
PelegA4.235 ± 0.9677.025 ± 2.5175.221 ± 0.3686.052 ± 0.6694.289 ± 0.570
B0.110 ± 0.0060.101 ± 0.0040.104 ± 0.0020.103 ± 0.0010.104 ± 0.007
Weibullα45.257 ± 8.87474.233 ± 17.97756.482 ± 1.50363.360 ± 3.49051.137 ± 7.498
β0.947 ± 0.0500.891 ± 0.0540.912 ± 0.0520.932 ± 0.0580.830 ± 0.029
ExponentialA0.029 ± 0.0100.023 ± 0.0100.026 ± 0.0060.022 ± 0.0060.039 ± 0.009
k0.947 ± 0.0500.891 ± 0.0540.912 ± 0.0520.932 ± 0.0580.830 ± 0.029
Exponential relatedA0.024 ± 0.0050.015 ± 0.0040.019 ± 0.0010.932 ± 0.0580.021 ± 0.003
Disclaimer/Publisher’s Note: The statements, opinions and data contained in all publications are solely those of the individual author(s) and contributor(s) and not of MDPI and/or the editor(s). MDPI and/or the editor(s) disclaim responsibility for any injury to people or property resulting from any ideas, methods, instructions or products referred to in the content.

