Article

Data-Based Modeling, Multi-Objective Optimization and Multi-Criteria Decision Making of a Catalytic Ozonation Process for Degradation of a Colored Effluent

by
Seyed Reza Nabavi
1,*,
Saheleh Ghahri
1 and
Gade Pandu Rangaiah
2,3,*
1
Department of Applied Chemistry, Faculty of Chemistry, University of Mazandaran, Babolsar 4741695447, Iran
2
Department of Chemical and Biomolecular Engineering, National University of Singapore, Singapore 117585, Singapore
3
School of Chemical Engineering, Vellore Institute of Technology, Vellore 632014, India
*
Authors to whom correspondence should be addressed.
Processes 2024, 12(3), 515; https://doi.org/10.3390/pr12030515
Submission received: 15 January 2024 / Revised: 28 February 2024 / Accepted: 29 February 2024 / Published: 3 March 2024

Abstract

:
In the catalytic ozonation process (COP), the reactions are complex, and it is very difficult to determine the effect of different operating parameters on the degradation rate of pollutants. Data-based modeling tools, such as the multilayer perceptron (MLP) neural network, can be useful in establishing the complex relationship of degradation efficiency with the operating variables. In this work, the COP of acid red 88 (AR88) with Fe3O4 nano catalyst was investigated in a semi-batch reactor and a MLP model was developed to predict the degradation efficiency (%DE) of AR88 in the range of 25 to 96%. The MLP model was trained using 78 experimental data having five input variables, namely, AR88 initial concentration, catalyst concentration, pH, inlet air flow rate and batch time (in the ranges of 150–400 mg L−1, 0.04–0.4 g L−1, 4.5–8.5, 0.5–1.90 mg min−1 and 5–30 min, respectively). Its optimal topology was obtained by changing the number of neurons in the hidden layer, the momentum and the learning rates to 7, 0.075 and 0.025, respectively. A high correlation coefficient (R2 > 0.98) was found between the experimental and predicted values by the MLP model. Simultaneous maximization of %DE and minimization of Fe3O4 concentration was carried out by multi-objective particle swarm optimization (MOPSO) and the Pareto-optimal solutions were successfully obtained. The trade-off was analyzed through multi-criteria decision making, and one Pareto-optimal solution was selected. The developed model and optimal points are useful for treatment of AR88 wastewater.

1. Introduction

The discharge of massive quantities of industrial-colored effluents into water bodies has become a major concern [1]. Globally, the annual release of dyestuff into the environment is reported to be 0.28 million tons, from different sources including the textile, leather goods, cosmetic and food industries [2]. These synthetic dyes are toxic for humans, fauna and flora even at low levels [3]. They can be carcinogenic and cause dermatitis and allergic sensitization [4]. Therefore, it is very important to utilize an effective treatment process for these types of wastewaters before discharging into the environment. Due to the resistance of textile wastewaters to biodegradation and their toxic effects on microorganisms, the use of alternative treatment methods to achieve the aim of mineralizing or transforming refractory molecules into others which could be further biodegraded is of great importance. The application of combined physical and chemical processes, such as coagulation, flocculation, filtration and adsorption, has been developed [5]. Researchers continue to explore more efficient techniques to address the drawbacks of the previous methods, such as low efficiency, high volumes of sludge and high operating/capital costs [6]. The ozonation process, mostly used with catalysts (i.e., the catalytic ozonation process, COP), is an efficient treatment when mineralization is desired [7]. Gutowska et al. [8] concluded that ozonation is more effective compared to the Fenton process for the degradation of reactive orange 113 dye. COP is classified in the category of advanced oxidation processes (AOPs), which are widely used in water treatment processes [9].
Ozone is a powerful oxidant and an effective purifier in water and wastewater treatment. Especially, ozonation treatment is widely applied to mineralize organic pollutants in water. However, when ozone is used alone, mineralization is not completely effective and some toxic and resistant byproducts (such as ketone, aldehyde, carboxylic acid and bromate) are generated [10]. To reduce these problems, the catalytic ozonation process (COP) is used to treat wastewaters containing high concentrations of refractory complexes based on the formation of very reactive groups, particularly hydroxyl radicals. This process is used to degrade a variety of organic compounds [11].
Recently, the combination of ozone with heterogeneous catalyst has attracted a lot of attention from researchers of water and wastewater treatment [12]. During COP, highly reactive free radicals, especially hydroxyl ( O H ), are produced; they have outstanding ability in the rapid degradation of recalcitrant and toxic organic compounds [13]. The hydroxyl radical is the second strongest oxidant, with an oxidation potential of 2.8 V (whereas fluorine has the highest electrochemical oxidation potential of 3.03 V). It rapidly and non-selectively attacks the carbon–hydrogen bonds of organic components and converts them to simple and mineral compounds [14]. Many synthesized catalysts—including metal oxides [9,15], metal oxides attached on support [13,16] and iron-based [11,12]—have been studied in COPs. Among them, magnetic Fe3O4 has received increasing attention in water treatment due to its magnetic properties, low cost, recyclability and non-toxicity [17]. In addition, Fe3O4 contains both Fe2+ and Fe3+ in the octahedral sites and accelerates the reaction of electron transfer during ozonation, which can facilitate the production of free radicals and improve the oxidation efficiency. Therefore, magnetic Fe3O4 catalysts have been successfully applied in COPs and are shown to exhibit high catalytic activity for the reduction of organic pollutants [16,18].
Determining the effects of various operational parameters in AOPs is very difficult because of the complexity of reactions. This problem leads to uncertainty during the design of industrial chemical reactors. Obviously, this problem cannot be solved by simple linear multivariate regression. Hence, artificial neural networks (ANNs) can be considered as a promising alternative modeling approach. Multilayer perceptron (MLP) is a class of ANNs that is widely used in data-based modeling and machine learning concerning chemical processes [19,20]. One of the characteristics of modeling based on MLP is that it does not require the mathematical description of the phenomena involved in the process. Hence, MLP can be useful in the simulation of complex AOPs. So far, MLP has been widely used in the modeling of AOPs. Cüce et al. [21] used MLP in the modeling of Fenton and photo–Fenton processes. Photocatalytic degradation of dispersed dye by ZnO nano catalyst was modeled using MLP, by Kıranşan et al. [22]. ANN modeling of different combinations of AOPs includes sonocatalytic degradation [23], the solar photocatalytic process [24] and photo-electrocatalysis of organic pollutants [25]. COP is also included in this list due to the complexity of its reaction mechanism [26]. Asgari et al. [27] applied ANNs to the modeling of the catalytic ozonation of textile wastewater using carbon doped/MgO nano catalyst. Fluoxetine was degraded during COP, and this process of modeling and optimization was performed [28].
Process optimization is one of the main goals of modeling. In this regard, the development of data-based models such as MLP is a step towards achieving this goal. Presently, the use of multi-objective optimization (MOO) has found a special place in many continuous, semi-batch and batch processes of chemical engineering [29]. Unlike single-objective optimization, the solutions obtained from MOO are a set of non-dominated (Pareto-optimal) solutions; one of them can be selected as the optimal alternative using weighting methods and multi-criteria decision making (MCDM) [30].
In this paper, an ANN model was first developed using the experimental data of an AR88 degradation in an ozonation reactor with Fe3O4 nano catalyst in semi-batch mode. Then, MOO was carried out by considering the objective functions to maximize the degradation efficiency of AR88 and to minimize the catalyst dosage simultaneously, to obtain Pareto-optimal solutions. Finally, an optimal alternative was selected by using two weighting methods—i.e., criteria importance through intercriteria correlation (CRITIC) and entropy, followed by the technique for order of preference by similarity to ideal solution (TOPSIS) and multi-attributive border approximation area comparison (MABAC) methods. To the best of our knowledge, MOO/MCDM of the COP of AR88 has not been reported in the literature so far.
The rest of this paper is organized as follows: In Section 2, the synthesis of the nano catalyst is summarized. Then, the setup of COP and the conditions of experiments, along with the lower and upper limits of operating variables, are given. In Section 3, the theory of MLP, the building of the MLP model, the optimization method and the theory of MCDM are described. The simulation results and the trends of variables are given in Section 4 and Section 5, respectively. The optimization results and the selection of an optimum solution using MCDM are covered in Section 6. Finally, the main findings of this study are summarized in Section 7.

2. Experimental Details

2.1. Synthesis of Catalyst

Synthesis of mesoporous nano iron oxide was performed according to the procedure described by Zhang et al. [31]. To this end, 8.5 g FeCl3·6H2O and 3.0 g FeCl2·4H2O were pulverized and dissolved in 38 mL of 0.4 M HCl solution, which is deoxygenated by nitrogen purging for 15 min. Then, under vigorous shaking in an ultrasonic bath at room temperature, this solution is quickly added to 375 mL of a 0.7 M deoxygenated ammonia solution. The black precipitate was separated by a magnetic field, washed with ultra-pure water (18 MΩ) and dried in a vacuum oven at 55 °C. All these chemicals, at an analytical grade, were purchased from Merck (Darmstadt, Germany). Characterization details of the synthesized catalyst are given in the Supplementary Materials and in the work by Fahadi et al. [16]. AR88 was obtained from Sigma-Aldrich Co. (St. Louis, MO, USA). It is from the category of azo dyes. The chemical structure and some physical properties of AR88 are given in Table 1. The structure of AR88 dye includes two main parts, chromophore (-N=N-) and auxochrome (-OH and -SO3Na). A chromophore is a part of a molecule that creates color in it, and visible color occurs when a substance absorbs a certain wavelength of visible light and passes or reflects the rest. The auxochrome groups provide other properties, like solubility, charge and affinity, to substances [32].

2.2. COP Experiments and Data Collection

The COP was performed in a semi-batch glass reactor with continuous stirring (Figure 1). Catalytic ozonation experiments were performed as follows. First, 350 mL of AR88 solution with a desired concentration was poured into the reactor. Next, a specific amount of catalyst was added to 50 mL of deionized water and sonicated for 30 min for proper dispersion and homogenization. The catalyst solution was also added to the reactor solution. The pH of the solution was adjusted by adding the desired volume of 0.1 M HCl and NaOH solutions, with the help of a pH meter (Knick-766, Knick Elektronische Messgeräte GmbH & Co. KG, Berlin, Germany). Before starting ozonation, the reactor mixture was stirred for 30 min. Dry air at a pressure of 2 bar was supplied from a cylinder. The excess ozone in the reactor outlet stream was trapped in two containers containing potassium iodide (2% w/w) solution before venting to the atmosphere.
Air enters the mass flow controller through a needle valve and then enters the ozone generator at a specified flow rate. The generated ozone is blown through a silicone tube connected to the gas sparger at the top of the blade of the stirrer. Unreacted ozone enters the ozone destruction unit and finally the gas products are discharged into the environment. Sampling via the port (not shown in Figure 1) at the top of the reactor was done at specific time intervals (usually 5 min).
To neutralize the dissolved ozone, 1 mL of sodium thiosulfate (0.1 M) was first added to the sample. Next, the catalyst was separated by a super magnet and then by a centrifuge at a speed of 8000 rpm. The remaining AR88 concentration was measured using a UV–Vis spectrophotometer (Unico-4802 double beam, Unico, Shanghai, China). For each sample, the degradation efficiency (%DE) was calculated by 100 (C0 − Ct)/C0, where C0 and Ct are the initial and the final concentrations of AR88, respectively. The data required for building the model were generated from the experiments conducted within the lower and upper limits of the input variables listed in Table 2. These limits are based on preliminary experiments. For example, a catalyst concentration of less than 0.04 g/L results in a low %DE. If batch time is less than 5 min, getting the AR88 sample is difficult, whereas %DE reaches a constant level when the batch time is more than 30 min. Lower and upper bounds of air flow are based on the range of the mass flow controller. All experimental runs were performed randomly to avoid any bias in the collected data due to the sequence employed for experiments [33], and 78 datasets were generated. For each experiment, AR88 degradation was measured.

3. MLP Model, Particles Swarm Optimization and MCDM

3.1. MLP Model Development

ANN consists of an interconnected group of artificial nodes (neurons), which adapt to map a set of input parameters to a set of output parameters, without knowing the complicated relationships between them [34]. MLP is a supervised feedforward neural network that is widely used by researchers for multivariate nonlinear regression. It contains one input layer, an output layer and multiple (usually one) hidden layers. Each node in a layer is connected to the nodes in the layer before and after it. Depending on the application, the number of nodes in each layer changes for better modeling. In the MLP topology used in this study (Figure 2), there are five input nodes—which are input process variables—and one output neuron. One bias node is also added to the input and output layers. The optimum number of neurons in the hidden layer was determined based on trials and is discussed in the next section. The nodes in the first layer have no transfer function, and can only take inputs and transmit them into the network; the hyperbolic tangent (tanh) transfer function is used in the hidden nodes, whereas the linear transfer function is set to the output neuron. The total available datasets (patterns) were divided into training (55 patterns) and testing (23 patterns). All inputs and output were normalized to [0, 1] and [−0.9, 0.9], respectively, by the following equation:
x n r = x i x m i n x m a x x m i n r m a x r m i n + r m i n
Here, x n r stands for the normalized value, x i for input/output value, xmin and xmax are the minimum and maximum values of each input or output variable. The rmax and rmin are the normalized range for input and target data [34].
In the training process, the sum of each input ( x h ), multiplied by the corresponding weight of each neuron ( w h ) in the hidden layer, is added to the bias value ( b j ); this is given inside the brackets in the following equation. The output of each neuron ( z j ) is then calculated by:
z j = t a n h h = 1 H w h x h + b j
Here, H is the number of weights from the preceding layer of neurons that connect to the current hidden neurons (here, H = 5). Similarly, these values are fed as input for the nodes of the output layer, and finally, the output of the network is calculated by the following:
y ^ i = j = 1 m u j z j + b 2
Here u j , b 2 and m are, respectively, the jth weight, bias value and number of weights from the preceding layer of neurons that connect to the current output neuron. The output for each pattern ( y ^ i ) is compared with the corresponding target pattern ( y i ). This process is repeated for all patterns in the training set (k = 55), and the sum of squares of their differences (E) is then calculated as follows.
E = 1 k i = 1 k y ^ i y i 2
Next, the values of weights in the output and hidden layer neurons are updated according to Equations (5) and (6), respectively.
w i , t + 1 = w i η E w + μ w i , t w i , t 1
u i , t + 1 = u i η E u + μ u i , t u i , t 1
The parameters η , µ and t are the learning rate, the momentum rate and the iteration number, respectively [34,35]. The correction of the weights is done until the number of iterations reaches the maximum set by the user.
The values of the learning rate and momentum constants, along with the number of neurons in the hidden layer, affect the performance of the MLP and should be determined through optimization. To this end, two performance indexes, namely, root mean squared error (RMSE) and correlation coefficient (R2), are calculated for both testing and training datasets.
R M S E = i = 1 n y i y ^ i 2 n
R 2 = 1 i = 1 n y i y ^ i 2 i = 1 n y i y ¯ 2
Here, y ¯ is the average of the target values and n is the number of patterns used in training and test sets. Other variables are defined as before.

3.2. MOPSO Algorithem

Various multi-objective optimization algorithms have been used in the optimization of chemical engineering problems [29]. The particles swarm optimization (PSO) algorithm has advantages such as simplicity, few adjustable parameters and faster convergence. In this algorithm, a population of particles scattered in the search space is used to discover the best value of the objective function. The difference between this algorithm and others that use swarm intelligence is the type of particle motion.
Each particle, according to the best experience it has ever had (personal best), P i b e s t g ; the best experience all particles in the swarm have ever had (global best), G b e s t g ; and the current velocity, V i g , selects a new velocity (or movement), V i g + 1 and then moves to a new position, x i g + 1 . The equations for this are as follows:
V i g + 1 = α × V i g + c 1 × r 1 × P i b e s t g x i g   + c 2 × r 2 × G b e s t g x i g
x i g + 1 = x i g + V i g + 1    
Here, α denotes the inertia weight, c 1 is the cognitive learning factor, c 2 is the social learning factor, and r 1 and r 2 are random numbers in the range [0, 1]. What makes the MOPSO different from the PSO is its ability to handle several objective functions, which requires the concept of dominance and the addition of the repository concept in the MOPSO. The elite particles are then used as candidates for personal and global best particles [36].

3.3. Weighting and MCDM Methods

Both the CRITIC and entropy methods start with the objective matrix having m rows (with one row for each Pareto-optimal solution or alternative) and n columns (with one column for each objective). The following steps are carried out for the CRITIC method. The first step is the normalization of objective functions by Equations (11) and (12) for the maximization and minimization functions, respectively [36].
Y i j = y i j m i n i m y i j m a x i m y i j m i n i m y i j
Y i j = m a x i m y i j y i j m a x i m y i j m i n i m y i j
Here, y i j is the value of the jth function for the ith solution in the objective matrix; Y i j is the value of y i j after normalization. Then, the Pearson product moment correlation between any two objective functions is calculated by the following equation.
φ j k = i = 1 m ( Y i j Y j ¯ ) ( Y i k Y k ¯ ) i = 1 m ( Y i j Y j ¯ ) 2 i = 1 m ( Y i k Y k ¯ ) 2           j , k [ 1 ,   n ]
Here, Y ¯ j = 1 m i = 1 m Y i j and Y k ¯ = 1 m i = 1 m Y i k represent the arithmetic mean of the jth and kth normalized objectives, respectively. Finally, the weight ( w j ) for each objective function is computed by Equation (15), which requires the standard deviation of each objective function (Equation (14)).
s t d j = i = 1 m ( Y i j Y j ¯ ) 2 m               j [ 1 ,   n ] ,
w j = s t d j k = 1 n ( 1 φ j k ) j = 1 n s t d j k = 1 n ( 1 φ j k )             j [ 1 ,   n ]
In the entropy method, the objective matrix is normalized using the sum normalization:
Y i j = y i j k = 1 m y k j
The entropy value of each objective function is calculated using the normalized objective matrix.
E n j = 1 ln m i = 1 m ( Y i j ln Y i j )             j [ 1 ,   n ]
Finally, the weights are given by the below:
w j = 1 E n j j = 1 n ( 1 E n j )                     j [ 1 ,   n ]
In the TOPSIS method, the weighted normalized objective function matrix is computed by Equation (19). The ideal ( P + ) and negative-ideal ( P ) solutions are determined by Equations (20) and (21), respectively:
ϑ i j = w j y i j i = 1 m y i j 2
P + = ϑ 1 + , . . ϑ n + = m a x j ϑ i j i R , m i n j ϑ i j i R
P = ϑ 1 , . . ϑ n = m i n j ϑ i j i R , m a x j ϑ i j i R
Here, R′ denotes the benefit criteria and R″ indicates the cost criteria among the objective functions. Equations (22) and (23) are then used to calculate the Euclidean distance of each solution from the positive ( d j + ) and negative ( d j ) ideal solutions, respectively.
d j + = i = 1 n ϑ i j ϑ 1 + 2
d j = i = 1 n ϑ i j ϑ 1 2
Finally, the closeness coefficient (C) of each solution is calculated by the following:
C = d j d j + d j +
The solution (alternative) with the highest value of C is the solution recommended by the TOPSIS method [37].
The MABAC method is started by weighting the objective functions using [38].
v i j = ( 1 + Y i j ) × w j         i 1 ,   m   a n d   j 1 ,   n
Then, the boundary approximation area and the distance of each non-dominated solution to the boundary approximation area are calculated by Equations (26) and (27), respectively.
b j = ( i = 1 m v i j ) 1 / m   j 1 ,   n
q i = j = 1 n ( v i j b j )   i 1 ,   m  
The recommended and top-ranked solution has the greatest distance [29]. All MCDM calculations were performed using a Microsoft Excel (2019) program developed by Wang and Rangaiah [37].

4. Optimization of MLP Topology

4.1. Effect of the Number of Neurons in the Hidden Layer

Figure 3 shows the effect of the number of neurons in the hidden layer of the MLP network on the evaluation indices (R2 and RMSE); these indices were calculated for both the test and training datasets. The lowest value of RMSE and the highest value of R2 for the test and training data are for the MLP network with seven neurons in the hidden layer. Therefore, the subsequent experiments to determine the optimal structure of the network were performed with this number of neurons in the hidden layer.

4.2. Effect of the Momentum Rate

To determine the optimal values of the momentum and learning constants, experiments were performed on the MLP network with seven neurons in the hidden layer, using different values for the momentum rate. The resulting R2 and RMSE indices for each value of the momentum rate are shown in Figure 4, which indicates that the optimal momentum rate is 0.075.

4.3. Effect of Learning Rate

The effect of the learning rate on the RMSE and R2 indexes is presented in Figure 5, for MLP with seven neurons in the hidden layer and a momentum rate at the optimal value found earlier. These results show that the optimum learning rate for the current dataset is 0.025.
Predictions of %DE of the COP by the optimal MLP network are compared with the experimental data in Figure 6. As shown by this parity plot, high correlation coefficients ( 0.98) are obtained for both training and test sets.
The MLP network provides the weights that are coefficients between the artificial neurons and are considered analogous to synapse strengths between the axons and dendrites in real biological neurons [39]. The optimal ANN used in this work has the weights listed in Table 3. The level of influence of each input variable on relating the output variable to it can be obtained through the neural weight matrix [40]. The level of importance of each variable was calculated by Equation (4) in the work of Izadkhah et al. [40]; the calculated values are given in Table 4. As can be seen, all the variables—initial concentration of AR88 (C0), Fe3O4 concentration (Ccat), pH, air flow rate (Qair) and batch time (t)—have effects on the %DE. In particular, pH, air flow rate and batch time have strong effects.

5. Analysis of the COP of AR88 Using the Optimal MLP Network

5.1. Effect of Inlet Air Flow Rate

Using the optimal MLP network, the effect of the inlet air flow rate through the ozone generator on AR88 removal efficiency was investigated, and the results are shown in Figure 7. The values predicted by the network are shown as continuous lines and the experimental data are presented as individual points. As depicted, within the range tested, increasing the air flow rate increases the dye degradation due to the increasing concentration of ozone molecules. Note that ozone molecules in the reactor are first absorbed by the active sites of the catalyst and then converted into active radicals such as O H and O 2 - , which degrade the pollutant [10].

5.2. Effect of the Catalyst Concentration

Catalyst concentration is one of the important factors of the COP. To determine the optimal amount of catalyst to achieve the maximum efficiency of AR88 degradation, different concentrations of Fe3O4 catalyst were selected. The results are given in Figure 8, which shows that increasing the amount of catalyst increases the %DE within the range tested; the reason for this increasing trend is the presence of more active sites for ozone molecule placement and its degradation into active radicals [41]. As shown in Figure 8, the MLP model has a good ability to predict the %DE with increasing catalyst concentration.

5.3. Effect of Initial pH of the Solution

The pH value of the aqueous solution has a significant effect on the COP of organic compounds because it affects the surface properties of the catalyst, as well as the decomposition of ozone and organic molecules. As can be seen in Figure 9, the %DE decreases with the increase of the pH within the range tested; a possible reason for this is the change in the electric charge on the surface of the catalyst when the pH of the solution changes [16]. Further, the optimal MLP model accurately predicts the effect of pH.

5.4. Effect of Initial Concentration of AR88

The pollutant concentration is another important factor that affects the COP. The effect of the initial concentration of AR88 was investigated in the range of 150–400 ppm, and the experimental and prediction results are presented in Figure 10. When the concentration of dye increases, the number of active radicals will be limited and will not be able to destroy all dye molecules; as a result, the %DE decreases [42]. As depicted in Figure 10, the AR88 degradation with time for different initial concentrations is well-simulated by the trained MLP.

5.5. Catalytic Ozonation Reaction Mechanism

The heterogeneous catalytic ozonation is complex, involving multiple reactions and steps influenced by various factors [16]. The catalyst plays diverse roles such as providing reaction sites for adsorption and catalysis. Heterogeneous COP encompasses three main mechanisms: (i) adsorption of ozone molecules on the catalyst surface and their decomposition into free radicals, which then react with organic pollutants; (ii) adsorption of organic pollutants on the catalyst, which are susceptible to attack by ozone molecules or other active species; and (iii) simultaneous adsorption of organic pollutants and ozone molecules on the catalyst surface, followed by interaction with each other. In a specific study [17], the Fe3O4 catalyst was found to enhance the yield of free radicals and significantly improve the degradation efficiency of a specific pollutant compared to the ozonation process without any catalyst.
In heterogeneous COP, reactions take place both in the solution and on the catalyst surface. The proposed mechanisms in the solution phase are represented by the following:
O 3 + A R 88 m a n y   s t e p s C O 2 + H 2 O
O H + A R 88 m a n y s t e p s C O 2 + H 2 O
In the solid phase, the adsorption of ozone molecules onto the surface Lewis acid sites of Fe2+ leads to the production of FeO2+ (Equation (30)). The adsorbed H2O on the surface of Fe3O4 can dissociate into OH, forming the surface hydroxyl groups (Equation (31)). Consequently, Fe3+ can be obtained from the transformation of FeO2+, and it can further react with O3 and H2O to produce OH and H+ (Equation (32)). Additionally, Fe3+ is reduced back to Fe2+ via reactions with superoxide ( O 2 ) or perhydroxyl radicals ( H O 2 ), as shown in Equations (35) and (36); thus, the AR88 molecules in the solution could occupy the surface of the catalyst and decompose or even be mineralized by O 2 and O H (Equations (35) and (36)).
F e 2 + + O 3 F e O 2 + + O 2
F e O 2 + + H 2 O F e 3 + + O H + O H
F e 3 + + O 3 + H 2 O F e O 2 + + O H + O 2 + H +
F e 2 + + O 3 F e 3 + + O 3
O 3 + O H O 2 + H O 2
F e 3 + + O 2 F e 2 + + O 2
F e 3 + + H O 2 F e 2 + + H + + O 2
O H + A R 88 m a n y   s t e p s C O 2 + H 2 O
O 2 + A R 88 m a n y   s t e p s C O 2 + H 2 O
A comparison of degradation efficiency with biological, photocatalysis and adsorption processes in the literature is shown in Table S2. Although high %DE has been reported in these processes, the initial concentration of contaminant is lower than the value tested in this study. In addition, the time required to reach these high levels of %DE is much higher than that elapsed in the present study.

6. MOO/MCDM of Catalytic Ozonation Process

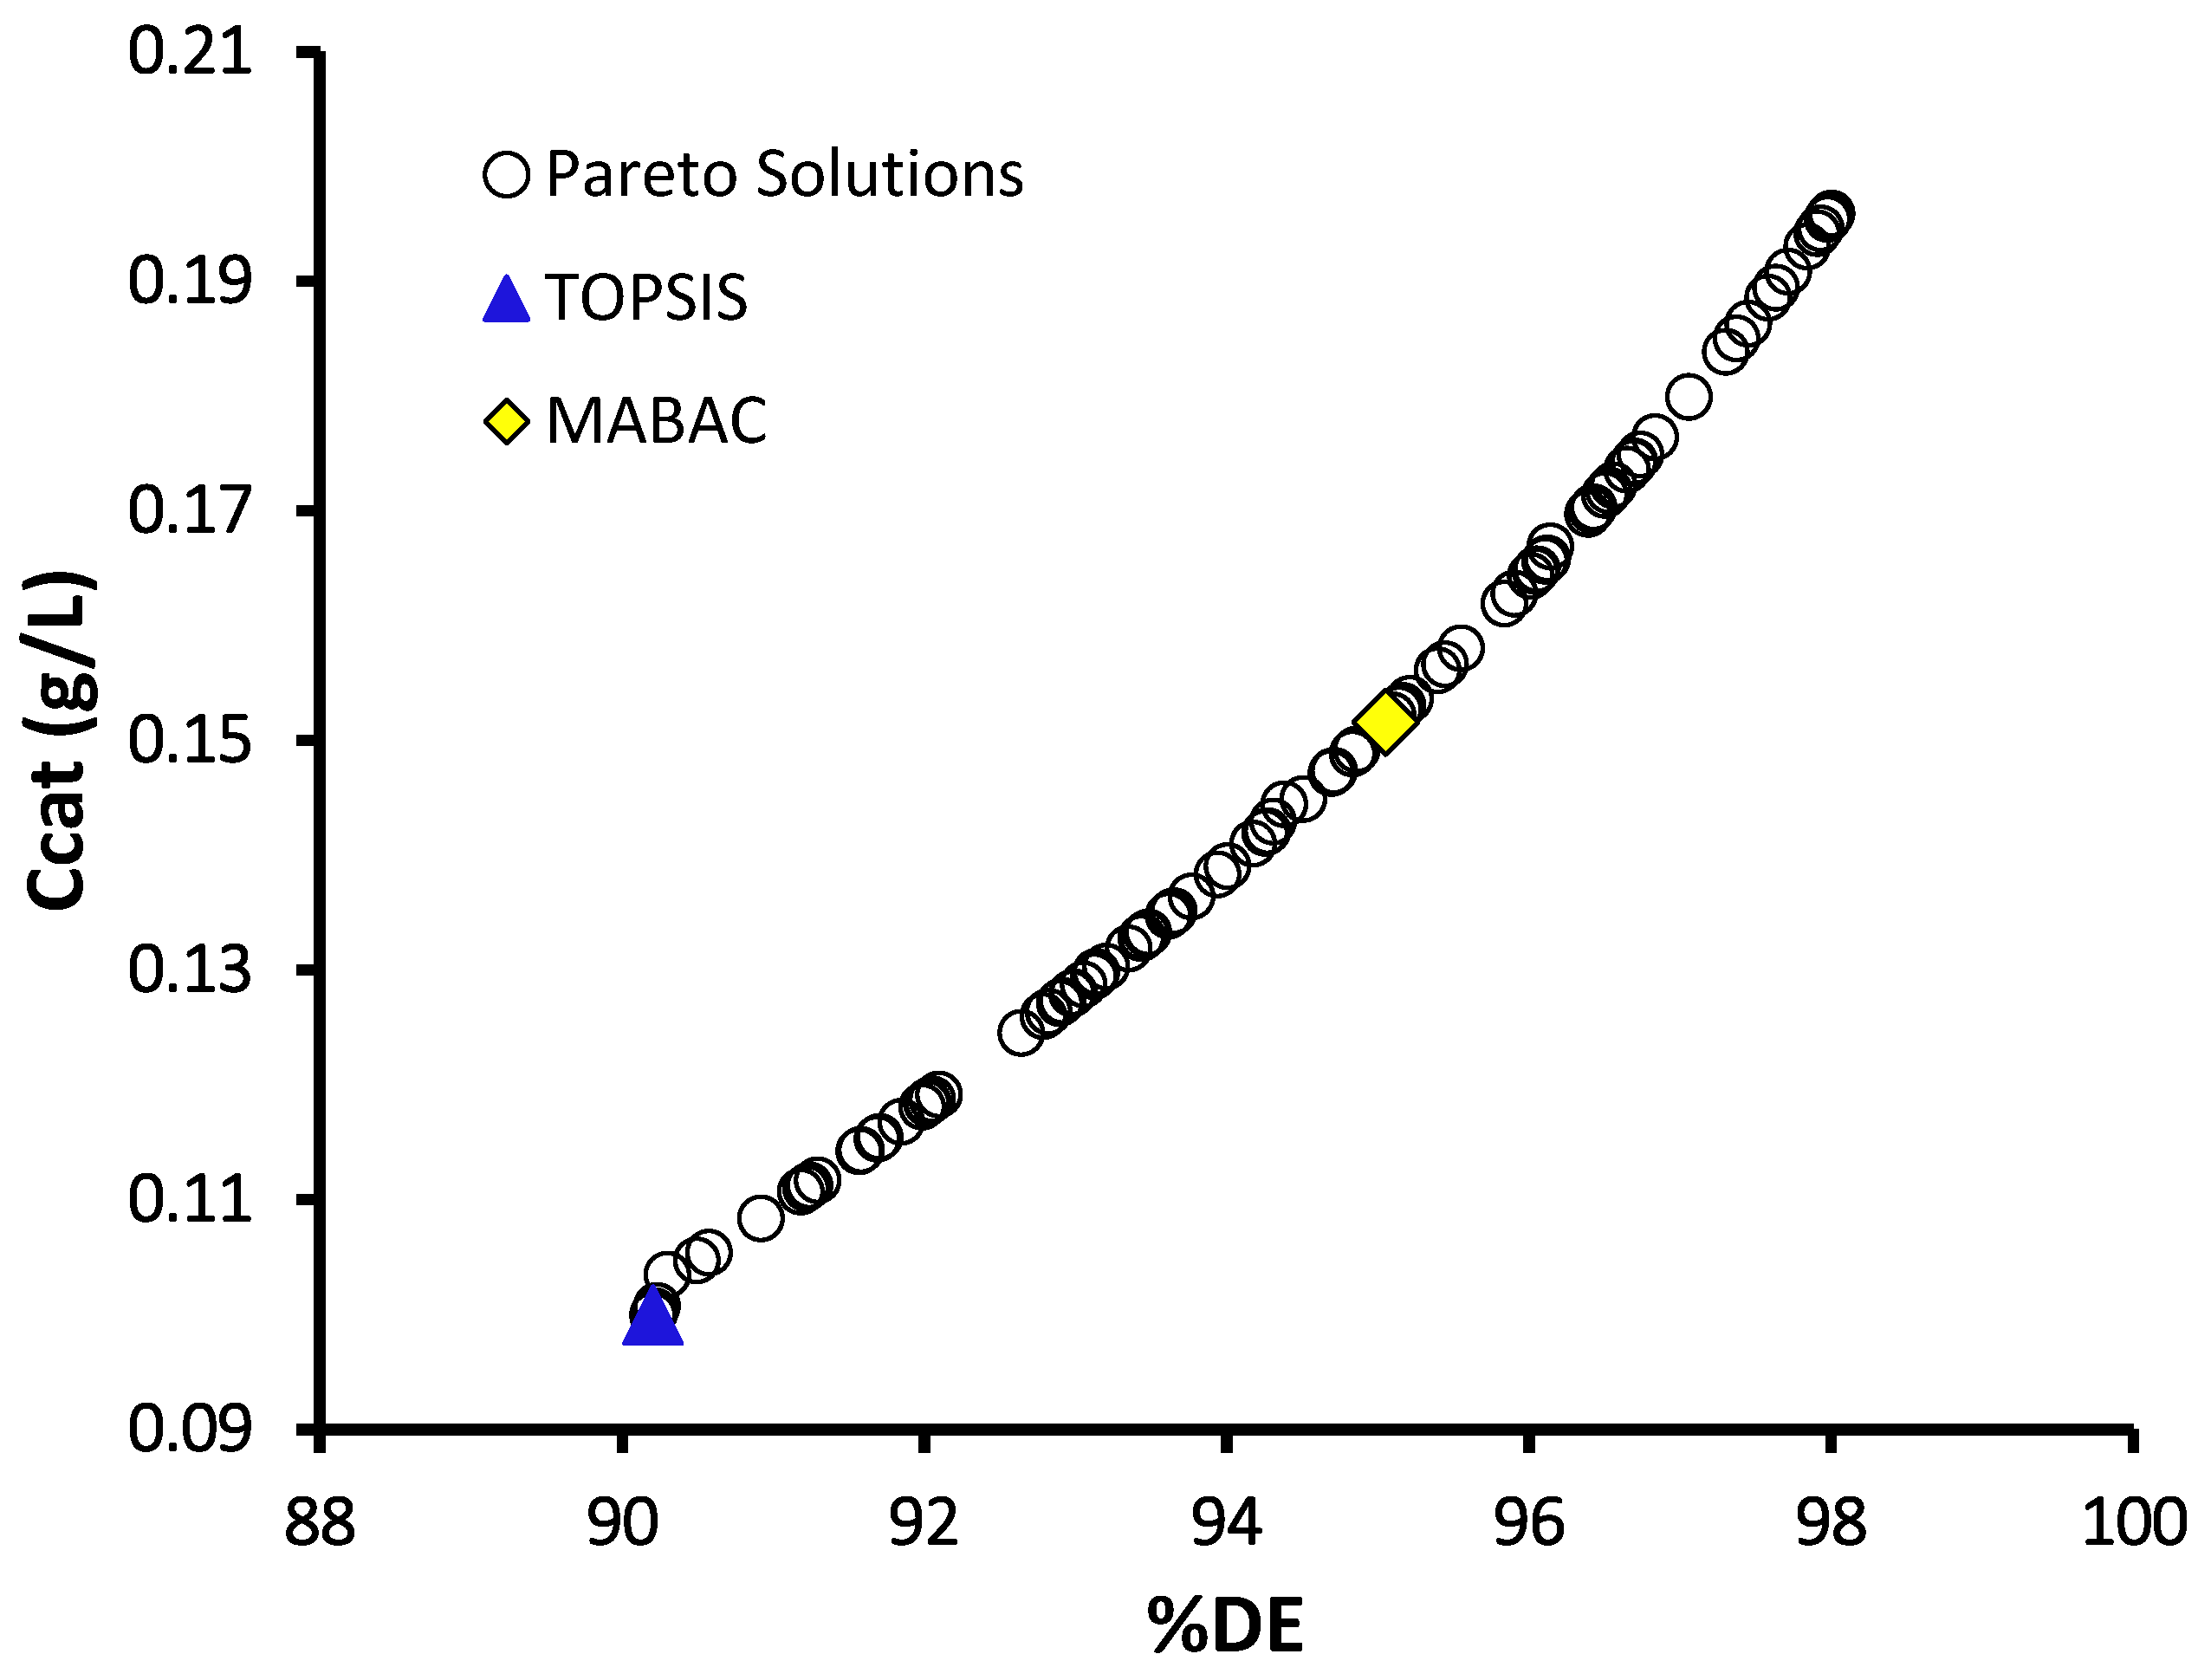
The simultaneous maximization of %DE and minimization of the catalyst concentration were considered for the COP of AR88. Figure 11 shows the Pareto-optimal solutions obtained by the MOPSO algorithm. Clearly, the %DE of AR88 increases with the increase in Fe3O4 concentration; thus, there is a trade-off between the two selected objective functions. Further, the Pareto-optimal front has a wide range and good distribution.
For selecting one of the Pareto-optimal solutions, the CRITIC and entropy methods were applied to these non-dominated solutions and the objective weights were calculated. The values of weights are given in Table 5. The CRITIC method gives nearly equal weights for both objective functions. However, the entropy weights have more difference and catalyst concentration has a high weight. With the CRITIC weights, the TOPSIS and MABAC methods were applied, and the optimal solutions recommended by these MCDM methods are shown by the (Δ) and () symbols in Figure 11, respectively.
The optimal solutions recommended by TOPSIS and MABAC are different when using CRITIC weights (Table 6). A low degradation efficiency and Fe3O4 concentration is preferred by the TOPSIS method, whereas MABAC selected the moderate %DE (95.05%) and catalyst concertation (0.152 g/L). The recommended solution when using entropy weights was the same for both TOPSIS and MABAC (Table 6). Note that TOPSIS and MABAC, both using entropy weights, may or may not give the same recommended solution depending on the application [30].

7. Conclusions

In this work, a data-based model was developed to enhance the degradation process of AR88 effluent in the presence of Fe3O4 nano catalyst and ozone. The developed neural network model is a three-layered MLP with five inputs, one output and seven neurons in the hidden layer. The MLP topology optimization, along with those of the learning rate and momentum parameter, was carried out. The optimum values of 0.025 and 0.075 were found for the learning rate and momentum parameter, respectively. The optimum MLP model has a regression coefficient of 0.99 and 0.98 for the training and test dataset, respectively. An analysis of COP was performed and the MLP model made excellent predictions of the extensive experimental data. An analysis of the weights of neurons revealed that pH, inlet air flow rate and time have the biggest effect on the COP process. The maximization of %DE and the minimization of catalyst concentration in the COP process were done using the optimal MLP model and MOPSO. As expected, there is a trade-off between these objectives, and the optimal range for %DE is 90–98 while for catalyst concentration it is 0.1–0.196. One optimal solution was selected using the CRITIC and entropy weighting methods followed by the TOPSIS and MABAC algorithms. The TOPSIS algorithm with both weighting methods, as well as the MABAC algorithm with entropy weights, recommended the solution using the optimal values of 90.20% and 0.100 g/L for %DE and Fe3O4 concentration, respectively. The techniques of data-based modelling and optimization for multiple objectives, successfully employed in this work, can be adopted for experimental data on many wastewater treatment processes to find the optimal conditions.

Supplementary Materials

The following supporting information can be downloaded at: https://www.mdpi.com/article/10.3390/pr12030515/s1, Refs [43,44,45,46,47,48,49] are cited in Supplementary Materials. Title of Figures and Tables in supplementary matrials as follow: Figure S1. XRD patterns of Fe3O4 nanoparticles; Figure S2. FTIR spectrums of mesoporous Fe3O4; Figure S3. (a) N2 adsorption-desorption isotherms and (b) BJH plot for Fe3O4 nanoparticles; Figure S4. FESEM image (plot a) and EDS spectrum (plot b) of Fe3O4 nanoparticles; Table S1. Porosity data obtained from BET, BJH and t-Plot for mesoporous Fe3O4 nanoparticle; Table S2. Comparison of degradation efficiency (DE%) of AR88 by COP with other processes in the literature.

Author Contributions

S.R.N.: conceptualization, supervision, resources, writing—original draft preparation; S.G.: methodology, software, formal analysis; G.P.R.: conceptualization, visualization, writing—review and editing. All authors have read and agreed to the published version of the manuscript.

Funding

This research received no external funding.

Data Availability Statement

All data is available through communication with the first author.

Conflicts of Interest

The authors declare no conflicts of interest.

References

  1. Tanveer, R.; Yasar, A.; Nizami, A.S.; Tabinda, A.B. Integration of physical and advanced oxidation processes for treatment and reuse of textile dye-bath effluents with minimum area footprint. J. Clean. Prod. 2023, 383, 135366. [Google Scholar] [CrossRef]
  2. Zewde, A.A.; Zhang, L.; Li, Z.; Odey, E.A. A review of the application of sonophotocatalytic process based on advanced oxidation process for degrading organic dye. Rev. Environ. Health 2019, 34, 365–375. [Google Scholar] [CrossRef]
  3. Huang, T.; Yan, M.; He, K.; Huang, Z.; Zeng, G.; Chen, A.; Peng, M.; Li, H.; Yuan, L.; Chen, G. Efficient removal of methylene blue from aqueous solutions using magnetic graphene oxide modified zeolite. J. Colloid Interface Sci. 2019, 543, 43–51. [Google Scholar] [CrossRef]
  4. Nachiyar, C.V.; Rakshi, A.D.; Sandhya, S.; Jebasta, N.B.D.; Nellore, J. Developments in treatment technologies of dye-containing effluent: A review. Case Stud. Chem. Environ. Eng. 2023, 7, 100339. [Google Scholar] [CrossRef]
  5. Solayman, H.M.; Hossen, M.A.; Abd Aziz, A.; Yahya, N.Y.; Leong, K.H.; Sim, L.C.; Monir, M.U.; Zoh, K.D. Performance evaluation of dye wastewater treatment technologies: A review. J. Environ. Chem. Eng. 2023, 11, 109610. [Google Scholar] [CrossRef]
  6. Jorfi, S.; Pourfadakari, S.; Kakavandi, B. A new approach in sono-photocatalytic degradation of recalcitrant textile wastewater using MgO@ Zeolite nanostructure under UVA irradiation. Chem. Eng. J. 2018, 343, 95–107. [Google Scholar] [CrossRef]
  7. Bilińska, M.; Bilińska, L.; Gmurek, M. Homogeneous and Heterogeneous Catalytic Ozonation of Textile Wastewater: Application and Mechanism. Catalysts 2022, 13, 6. [Google Scholar] [CrossRef]
  8. Gutowska, A.; Kałużna-Czaplińska, J.; Józ, W.K. Degradation mechanism of Reactive Orange 113 dye by H2O2/Fe2+ and ozone in aqueous solution. Dyes Pigm. 2007, 74, 41–46. [Google Scholar] [CrossRef]
  9. Yang, Z.; Yang, H.; Liu, Y.; Hu, C.; Jing, H.; Li, H. Heterogeneous catalytic ozonation for water treatment: Preparation and application of catalyst. Ozone Sci. Eng. 2023, 45, 147–173. [Google Scholar] [CrossRef]
  10. Issaka, E.; Amu-Darko, J.N.O.; Yakubu, S.; Fapohunda, F.O.; Ali, N.; Bilal, M. Advanced catalytic ozonation for degradation of pharmaceutical pollutants―A review. Chemosphere 2022, 289, 133208. [Google Scholar] [CrossRef]
  11. Wang, J.; Yuan, S.; Dai, X.; Dong, B. Application, mechanism and prospects of Fe-based/Fe-biochar catalysts in heterogenous ozonation process: A review. Chemosphere 2023, 7, 138018. [Google Scholar] [CrossRef]
  12. Li, X.; Fu, L.; Chen, F.; Zhao, S.; Zhu, J.; Yin, C. Application of heterogeneous catalytic ozonation in wastewater treatment: An overview. Catalysts 2023, 13, 342. [Google Scholar] [CrossRef]
  13. Chen, W.; He, H.; Liang, J.; Wei, X.; Li, X.; Wang, J.; Li, L. A comprehensive review on metal based active sites and their interaction with O3 during heterogeneous catalytic ozonation process: Types, regulation and authentication. J. Hazard. Mater. 2023, 443, 130302. [Google Scholar] [CrossRef]
  14. Yu, G.; Wang, Y.; Cao, H.; Zhao, H.; Xie, Y. Reactive oxygen species and catalytic active sites in heterogeneous catalytic ozonation for water purification. Environ. Sci. Technol. 2020, 54, 5931–5946. [Google Scholar] [CrossRef]
  15. Ikhlaq, A.; Brown, D.R.; Kasprzyk-Hordern, B. Catalytic ozonation for the removal of organic contaminants in water on alumina. Appl. Catal. B 2015, 165, 408–418. [Google Scholar] [CrossRef]
  16. Fahadi, M.; Nabavi, S.R.; Chaichi, M.J. Mesoporous Fe3O4/graphene oxide nanohybrid for catalytic Ozonation: Preparation, characterization and process modeling by neural network. J. Taiwan Inst. Chem. Eng. 2022, 134, 104278. [Google Scholar] [CrossRef]
  17. An, W.; Li, X.; Ma, J.; Ma, L. Advanced treatment of industrial wastewater by ozonation with iron-based monolithic catalyst packing: From mechanism to application. Water Res. 2023, 235, 119860. [Google Scholar] [CrossRef] [PubMed]
  18. Liu, M.; Ye, Y.; Ye, J.; Gao, T.; Wang, D.; Chen, G.; Song, Z. Recent Advances of Magnetite (Fe3O4)-Based Magnetic Materials in Catalytic Applications. Magnetochemistry 2023, 9, 110. [Google Scholar] [CrossRef]
  19. Pirdashti, M.; Curteanu, S.; Kamangar, M.H.; Hassim, M.H.; Khatami, M.A. Artificial neural networks: Applications in chemical engineering. Rev. Chem. Eng. 2013, 29, 205–239. [Google Scholar] [CrossRef]
  20. Bakhtyari, A.; Bardool, R.; Rahimpour, M.R.; Mofarahi, M.; Lee, C.H. Performance analysis and artificial intelligence modeling for enhanced hydrogen production by catalytic bio-alcohol reforming in a membrane-assisted reactor. Chem. Eng. Sci. 2023, 268, 118432. [Google Scholar] [CrossRef]
  21. Cüce, H.; Temel, F.A.; Yolcu, O.C. Modelling and optimization of Fenton processes through neural network and genetic algorithm. Korean J. Chem. Eng. 2021, 38, 2265–2278. [Google Scholar] [CrossRef]
  22. Kıranşan, M.; Khataee, A.; Karaca, S.; Sheydaei, M. Artificial neural network modeling of photocatalytic removal of a disperse dye using synthesized of ZnO nanoparticles on montmorillonite. Spectrochim. Acta Part A Mol. Biomol. Spectrosc. 2015, 140, 465–473. [Google Scholar] [CrossRef]
  23. Haddadi, S.; Khataee, A.; Arefi-Oskoui, S.; Vahid, B.; Orooji, Y.; Yoon, Y. Titanium-based MAX-phase with sonocatalytic activity for degradation of oxytetracycline antibiotic. Ultrason. Sonochem. 2023, 92, 106255. [Google Scholar] [CrossRef]
  24. Reddy, P.S.; Das, S. Modeling of Solar Photocatalytic Degradation of Rhodamine B Dye by TiO2 Nanoparticles Using an Artificial Neural Network. Chem. Eng. Technol. 2023, 46, 1587–1595. [Google Scholar] [CrossRef]
  25. Khodabandeloo, F.; Sheydaei, M.; Moharramkhani, P.; Masteri-Farahani, M.; Khataee, A. Preparation of Fe2(MoO4)3/graphene/Ti nanocomposite electrode for visible-light photoelectrocatalytic degradation of organic pollutants. Chemosphere 2023, 330, 138766. [Google Scholar] [CrossRef]
  26. Nghia, N.T.; Tuyen, B.T.K.; Quynh, N.T.; Thuy, N.T.T.; Nguyen, T.N.; Nguyen, V.D.; Tran, T.K.N. Response Methodology Optimization and Artificial Neural Network Modeling for the Removal of Sulfamethoxazole Using an Ozone–Electrocoagulation Hybrid Process. Molecules 2023, 28, 5119. [Google Scholar] [CrossRef] [PubMed]
  27. Asgari, G.; Faradmal, J.; Nasab, H.Z.; Ehsani, H. Catalytic ozonation of industrial textile wastewater using modified C-doped MgO eggshell membrane powder. Adv. Powder Technol. 2019, 30, 1297–1311. [Google Scholar] [CrossRef]
  28. Aghaeinejad-Meybodi, A.; Ebadi, A.; Shafiei, S.; Khataee, A.; Kiadehi, A.D. Degradation of Fluoxetine using catalytic ozonation in aqueous media in the presence of nano-γ-alumina catalyst: Experimental, modeling and optimization study. Sep. Purif. Technol. 2019, 211, 551–563. [Google Scholar] [CrossRef]
  29. Rangaiah, G.P.; Feng, Z.; Hoadley, A.F. Multi-objective optimization applications in chemical process engineering: Tutorial and review. Processes 2020, 8, 508. [Google Scholar] [CrossRef]
  30. Wang, Z.; Nabavi, S.R.; Rangaiah, G.P. Selected Multi-criteria Decision-Making Methods and Their Applications to Product and System Design. In Optimization Methods for Product and System Design; Springer Nature: Singapore, 2023; pp. 107–138. [Google Scholar]
  31. Zhang, Y.; Zeng, G.M.; Tang, L.; Huang, D.L.; Jiang, X.Y.; Chen, Y.N. A hydroquinone biosensor using modified core–shell magnetic nanoparticles supported on carbon paste electrode. Biosens. Bioelectron. 2007, 22, 2121–2126. [Google Scholar] [CrossRef] [PubMed]
  32. Asghar, A.; Raman AA, A.; Daud, W.M.A.W. Advanced oxidation processes for in-situ production of hydrogen peroxide/hydroxyl radical for textile wastewater treatment: A review. J. Clean. Prod. 2015, 87, 826–838. [Google Scholar] [CrossRef]
  33. Walpole, R.E.; Myers, R.H.; Myers, S.L.; Ye, K. Probability and Statistics for Engineers and Scientists; Macmillan: New York, NY, USA, 1993; Volume 5. [Google Scholar]
  34. Ren, Y.M.; Alhajeri, M.S.; Luo, J.; Chen, S.; Abdullah, F.; Wu, Z.; Christofides, P.D. A tutorial review of neural network modeling approaches for model predictive control. Comput. Chem. Eng. 2022, 165, 107956. [Google Scholar] [CrossRef]
  35. Abdelkareem, M.A.; Soudan, B.; Mahmoud, M.S.; Sayed, E.T.; AlMallahi, M.N.; Inayat, A.; Al Radi, M.; Olabi, A.G. Progress of artificial neural networks applications in hydrogen production. Chem. Eng. Res. Des. 2022, 182, 66–86. [Google Scholar] [CrossRef]
  36. Niu, W.-J.; Feng, Z.-K.; Cheng, C.-T.; Wu, X.-Y. A parallel multi-objective particle swarm optimization for cascade hydropower reservoir operation in southwest China. Appl. Soft. Comput. 2018, 70, 562–575. [Google Scholar] [CrossRef]
  37. Wang, Z.; Rangaiah, G.P. Application and analysis of methods for selecting an optimal solution from the Pareto-optimal front obtained by multiobjective optimization. Ind. Eng. Chem. Res. 2017, 56, 560–574. [Google Scholar] [CrossRef]
  38. Pamučar, D.; Ćirović, G. The selection of transport and handling resources in logistics centers using Multi-Attributive Border Approximation Area Comparison (MABAC). Expert. Syst. Appl. 2015, 42, 3016–3028. [Google Scholar] [CrossRef]
  39. Khataee, A.R.; Kasiri, M.B. Artificial neural networks modeling of contaminated water treatment processes by homogeneous and heterogeneous nanocatalysis. J. Mol. Catal. A Chem. 2010, 331, 86–100. [Google Scholar] [CrossRef]
  40. Izadkhah, B.; Nabavi, S.R.; Niaei, A.; Salari, D.; Badiki, T.M.; Çaylak, N. Design and optimization of Bi-metallic Ag-ZSM5 catalysts for catalytic oxidation of volatile organic compounds. J. Ind. Eng. Chem. 2012, 18, 2083–2091. [Google Scholar] [CrossRef]
  41. Wang, J.; Chen, H. Catalytic ozonation for water and wastewater treatment: Recent advances and perspective. Sci. Total Environ. 2020, 704, 135249. [Google Scholar] [CrossRef]
  42. Mahmoodi, N.M.; Hayati, B.; Arami, M.; Lan, C. Adsorption of textile dyes on pine cone from colored wastewater: Kinetic, equilibrium and thermodynamic studies. Desalination 2011, 268, 117–125. [Google Scholar] [CrossRef]
  43. Bahram, M.; Salami, S.; Moghtader, M.; Moghadam, P.N.; Fareghi, A.R.; Rasouli, M.; Salimpour, S. Photocatalytic degradation of anionic azo dyes Acid Orange 7 and Acid Red 88 in aqueous solutions using TiO2-containing hydrogel. Anal. Bioanal. Chem. Res. 2017, 4, 53–63. [Google Scholar] [CrossRef]
  44. Gao, B.; Yap, P.S.; Lim, T.M.; Lim, T.T. Adsorption-photocatalytic degradation of Acid Red 88 by supported TiO2: Effect of activated carbon support and aqueous anions. Chem. Eng. J. 2011, 171, 1098–1107. [Google Scholar] [CrossRef]
  45. Ghadamnan, E.; Nabavi, S.R.; Abbasi, M. Nano LTA Zeolite in Water Softening Process: Synthesis, Characterization, Kinetic studies and process optimization by Response Surface Methodology (RSM). J. Water Environ. Nanotechnol. 2019, 4, 119–138. [Google Scholar]
  46. Guo, S.; Wu, H.; Gao, G.; Zhou, X.; Zhang, Y. Control on the formation of Fe3O4 nanoparticles on chemically reduced graphene oxide surfaces. CrystEngComm 2011, 14, 499–504. [Google Scholar] [CrossRef]
  47. Karaagac, O.; Kockar, H.; Beyaz, S.; Tanrisever, T. A simple way to synthesize superparamagnetic iron oxide nanoparticles in air atmosphere: Iron ion concentration effect. IEEE Trans. Magn. 2010, 46, 3978–3983. [Google Scholar] [CrossRef]
  48. Khehra, M.S.; Saini, H.S.; Sharma, D.K.; Chadha, B.S.; Chimni, S.S. Biodegradation of azo dye C.I. Acid Red 88 by an anoxic—Aerobic sequential bioreactor. Dye. Pigment. 2006, 70, 1–7. [Google Scholar] [CrossRef]
  49. Vinodha, G.; Shima, P.D.; Cindrella, L. Mesoporous magnetite nanoparticle-decorated graphene oxide nanosheets for efficient electrochemical detection of hydrazine. J. Mater. Sci. 2018, 54, 4073–4088. [Google Scholar] [CrossRef]
Figure 1. Schematic of the experimental setup for COP.
Processes 12 00515 g001
Figure 2. The MLP structure used in the modeling of COP in this study.
Processes 12 00515 g002
Figure 3. Effect of the number of neurons in the hidden layer on the performance of MLP: (a) RMSE and (b) R2 index.
Processes 12 00515 g003
Figure 4. Effect of momentum rate on the (a) RMSE and (b) R2 indexes of MLP network.
Processes 12 00515 g004
Figure 5. Effect of learning rate on the (a) RMSE and (b) R2 indexes of the MLP network.
Processes 12 00515 g005
Figure 6. Comparison of the experimental results with the predictions by the optimal MLP network: (a) training and (b) test dataset.
Processes 12 00515 g006
Figure 7. Effect of input air flow rate (0.5 L/min to 1.9 L/min) through the ozone generator on dye degradation efficiency (pH = 5.5, initial dye concentration = 150 ppm and catalyst concentration = 0.4 g/L).
Processes 12 00515 g007
Figure 8. Effect of the catalyst concentration (0.04 to 0.4 g/L) on the DE (pH = 5.5, initial dye concentration = 150 ppm).
Processes 12 00515 g008
Figure 9. Effect of pH (4.5 to 8.5) on the DE (initial dye concentration = 150 ppm, catalyst concentration = 0.4 g/L).
Processes 12 00515 g009
Figure 10. Effect of the initial concentration of AR88 (150 to 400 g/L) on the %DE (pH = 5.5, catalyst concentration = 0.4 g/L).
Processes 12 00515 g010
Figure 11. Pareto-optimal front for the simultaneous maximization of %DE and minimization of catalyst concentration. The optimum solutions selected by TOPSIS and MABAC with CRITIC weights are shown by (Δ) and (), respectively.
Processes 12 00515 g011
Table 1. Chemical and physical properties of AR88 [32].
Chemical StructurePhysical Properties
Processes 12 00515 i001Commercial name: Acid red 88
Molecular formula: C10H13N2NaO4S
Molecular weight (g/mol): 400.38
Chemical class: Azo
Color: Dark red
λmax (nm): 504 nm
Color index number: 51620
CAS registry number: 1658-56-6
Table 2. The lower and upper limits of input variables.
Variable NameUnitsMinimumMaximum
Air flowL/min0.51.9
pH-4.58.5
Nano catalyst concentrationg/L0.040.4
AR88 concentrationppm150400
Batch timeminutes530
Table 3. Weights between input and hidden layers (W); weights between hidden and output layers (U); and weights for bias of input (Bias 1) and output (Bias 2) neurons.
NeuronsWU
Inputs
Air Flow Rate (L/min)Fe3O4 Concentration (g/L)pHAR88 Concentration (ppm)Batch Time (min)Bias 1Output
13.007−1.7655−0.16340.1607−2.2531.92791.7037
20.39352.0732−1.23260.430.85010.15941.3765
3−0.75180.84130.63311.42492.4173−0.08231.0787
41.2668−0.01894.18090.27290.90840.5251−1.8337
51.15590.05422.44570.3421.10181.01841.1093
6−0.5103−0.13470.91342.09120.68460.0846−1.0664
7−0.30970.50310.70260.07940.05010.05010.1756
Bias 2 1.204
Table 4. Relative importance (%) of each input variable for the DE of AR88.
VariablesImportance %
C012.2
Ccat14.5
pH28.9
Qair20.0
Batch time24.4
Total100
Table 5. Weights recommended by CRITIC and entropy methods.
Weighting Method%DECcat (g/L)
CRITIC0.50430.4957
Entropy0.01620.9838
Table 6. Optimal solutions selected by TOPSIS and MABAC using CRITIC and entropy methods.
With CRITIC WeightsWith Entropy Weights
%DECcat (g/L)%DECcat (g/L)
TOPSIS90.200.10090.200.1
MABAC95.050.15290.200.1
Disclaimer/Publisher’s Note: The statements, opinions and data contained in all publications are solely those of the individual author(s) and contributor(s) and not of MDPI and/or the editor(s). MDPI and/or the editor(s) disclaim responsibility for any injury to people or property resulting from any ideas, methods, instructions or products referred to in the content.

