Article

Hyperspectral and Microtomographic Analyses to Evaluate the Stability of Quercetin and Calcium Effervescent Tablets Exposed to Heat and Ultraviolet Radiation †

1
Department of Pharmaceutical Technology, Faculty of Pharmaceutical Sciences in Sosnowiec, Medical University of Silesia in Katowice, 3 Kasztanowa Str., 41-200 Sosnowiec, Poland
2
Institute of Biomedical Engineering, Faculty of Science and Technology, University of Silesia, 39 Bedzinska Str., 41-200 Sosnowiec, Poland
3
Department of Basic Biomedical Science, Faculty of Pharmaceutical Sciences in Sosnowiec, Medical University of Silesia in Katowice, 3 Kasztanowa Str., 41-200 Sosnowiec, Poland
4
Faculty of Pharmaceutical Sciences in Sosnowiec, Doctoral School, Medical University of Silesia in Katowice, 41-200 Sosnowiec, Poland
*
Author to whom correspondence should be addressed.
Presented at the 2nd International Electronic Conference on Processes: Process Engineering—Current State and Future Trends (ECP 2023), which will be hosted online by https://ecp2023.sciforum.net/ from 17 to 31 May 2023.
Processes 2024, 12(3), 531; https://doi.org/10.3390/pr12030531
Submission received: 16 February 2024 / Revised: 1 March 2024 / Accepted: 5 March 2024 / Published: 7 March 2024

Abstract

:
This study aimed to assess the changes occurring during the storage of tablets of three effervescent preparations available in Polish pharmacies containing calcium and quercetin from various manufacturers under stressful conditions (45 °C, UV radiation) using a hyperspectral Specim IQ camera (Finland), X-ray microtomography (Germany), and selected pharmacopoeial parameters. All measurements were made three times at the beginning of the experiment (day 0) and then on days 3 and 10. In general, for all analyzed preparations, the values of reflectance (within a range from visible light to near-infrared) were significantly higher on day 0 than after 10 days of heat and UV (p < 0.001 each). The hardness of the tablets of all analysed preparations was higher on days 3 and 10 compared to day 0. Significant differences were found in the density of the internal structure of the tested preparations (p < 0.001), but in Preparations 1 and 2 on day 10, the density was higher compared to the initial density. In contrast, the porosity was lower on day 10 than on day 0 for Preparations 1 and 2, while in Preparation 3, it remained the same. In conclusion, lower reflectance values indicate that more light passes through/into the tablet, and the increase in density and decrease in porosity may indicate changes in the microstructure of the tablets.

1. Introduction

The efficacy and safety of pharmacotherapy depend on the quality of pharmaceutical formulations of all types. Factors affecting the quality of solid dosage forms include moisture, temperature, and the effect of light [1,2,3]. Changes in the drug also depend on the reactivity of the active substance itself, as well as the excipients/the packaging materials themselves. Possible interactions between the active substance and excipients and/or between various types of excipients and between the active substance and the packaging material should be taken into account as well. Every manufactured medicine, dietary supplement, or other preparation bought from a pharmacy is characterized by storage conditions specified by the manufacturer. However, data demonstrated that few patients read the leaflets accompanying the products or check the storage information carefully [4]. Incorrect drug storage may affect its effectiveness, and in consequence may be harmful to health.
The literature data on the evaluation of the quality of effervescent tablets during storage are not common. The effervescent form of tablets is in growing usage as it can be easily administered especially to elder people and children who may have difficulties in swallowing oral dosage forms. Such a formulation of active substances facilitates patient compliance [5].
Some of the most popular active ingredients in effervescent tablets are quercetin and calcium. Quercetin is a polyphenolic flavonoid that is found in some fruits and vegetables in the form of glycone or carbohydrate conjugates [6]. The body’s daily requirement of quercetin is between 5 and 40 mg. Its molecule consists of three rings and a 5-hydroxyl group. Numerous studies show a wide range of quercetin’s activities, the most important being antioxidant, anticancer, antibacterial, anti-inflammatory, antiviral, antidiabetic, anti-inflammatory, anticancer, cardiovascular protective, anti-tumor, immune-modulatory, anti-hypertensive, and gastroprotective [7,8,9,10,11]. In light of the increasing prevalence of allergic diseases, researchers’ attention has focused on the role of diet in their prevention. The literature data indicate that quercetin has high anti-allergic potential and can be used in the prevention or treatment of allergic diseases such as allergic rhinitis, allergic asthma, and atopic dermatitis [12,13,14]. In a clinical study on patients with allergic rhinitis in the sensitization phase, it was observed that the use of oral quercetin (200 mg/day) for 4 weeks relieved symptoms such as itchy eyes, sneezing, nasal discharge, and sleep disturbances, compared with the placebo group [15]. In another study, supplemental use of quercetin during standard treatment of subjects with mild–moderate asthmatic attacks and rhinitis gave better results as compared with standard treatment [16].
Additionally, calcium plays an important role in smooth muscle contraction, neuronal signaling, activity of intracellular enzyme regulation, blood coagulation, exocytosis, and metabolic regulation [17]. Calcium preparations are indicated as dietary supplements in states of increased calcium requirement, e.g., children who are at risk of rickets during rapid growth, older adults who are at risk of bone fractures, thyroidectomy, postmenopausal women, pre-eclampsia prevention, prediabetes, and sarcopenic, non-malnourished older adults [18,19,20,21,22,23,24]. Increasing the calcium intake of people younger than 35 years of age has been shown to improve bone mineral density throughout the body [25]. A survey performed on a group of 220 children (110 allergic and 110 non-allergic) showed that atopic children may be at greater risk of inadequate intake of dairy products, insufficient calcium, and insufficient vitamin D [26]. Another study by Miyake et al. [27] demonstrated the association between maternal intake of dairy foods, calcium, and vitamin D during pregnancy and childhood allergic disorders (atopic eczema, infantile eczema, asthma).
The quality of a pharmaceutical form can be verified using various techniques, including spectral or microtomographic methods. One of the spectral methods is hyperspectral imaging (HSI), which measures the reflectance in a wide range of wavelengths. The ratio of the radiation reflected from the sample surface to the radiation reflected in an identical beam geometry by an ideal and diffuse standard surface irradiated under the same conditions as the sample surface is called the reflection coefficient [28]. HSI uses hundreds of spectral bands, providing spatial information on the analyzed object. All materials reflect, scatter, or absorb energy differently depending on both their chemical and physical structures when exposed to electromagnetic radiation in different wavelength ranges. Light absorption relates to the chemical composition of the target materials, while light scattering is related to particle diameter, cell structure, tissue composition, and other physical properties of the materials [29,30]. HSI provides a rapid, high-throughput, and non-invasive method of examining the surface of materials [31].
In turn, X-ray microtomography enables the 3D visualization of the internal structure of solid dosage forms of drugs. Recently, this imaging method has been of increasing interest in pharmacy as many different parameters may be analyzed microtomographically. Some studies have demonstrated the relationship between the pore architecture and the quality parameters of pharmaceutical tablets [32,33,34]. There are also data on the use of X-ray microtomography to evaluate the density of the interior of pharmaceutical tablets [35].
Previously, we used total directional hemispherical reflectance (THR) and computed tomography to assess the stability of effervescent tablets containing magnesium and vitamin B6 [36,37].
This study aimed to evaluate three types of effervescent tablets containing quercetin and calcium as the main active substances available on the Polish market during a 10-day exposure to elevated temperature and UV radiation. The stability of the tablets was assessed before, during, and after the experiment based on appearance, selected pharmacopoeial tests, and the results of hyperspectral and microtomographic analyses.

2. Materials and Methods

2.1. Analyzed Tablets

The study analyzed three types of effervescent tablets manufactured by Polish pharmaceutical plants that have been available on the Polish market for many years and were purchased in a community pharmacy in Katowice, Poland:
  • Preparation 1—composed of citric acid, sodium carbonates, calcium carbonate, sorbitols, corn starch, quercetin, polyvinylpyrrolidone, polyethylene glycol, acesulfame K, aspartame;
  • Preparation 2—composed of citric acid, calcium carbonate, sorbitol, sodium bicarbonate, extract from leaves of the common pachnotica (Perilla frutescens), lemon flavor, quercetin, sweetener carrier: polyethylene glycol, sodium saccharin, vitamin D3, riboflavin;
  • Preparation 3—composed of citric acid, sodium bicarbonate, calcium carbonate, sorbitol, corn starch, sodium cyclamate, quercetin, flavors: aspartame, acesulfame K, sodium selenate; folic acid, vitamin B12.

2.2. Evaluation of the Effervescent Tablets

Uniformity of weight was assessed according to Ph. Eur. [38]. Using an analytical balance (HR60, A&D Weighing Company, Tokyo, Japan), each of the 20 randomly selected tablets from one batch was weighed and their arithmetic mean weight and weight variation were calculated.
The crush resistance of the tablets was determined in the MultiTest50 hardness tester (Pharmatron Dr. Schleuniger, Thun, Switzerland). From the force Pmax recorded by the apparatus, at which the tablet was crushed, a hardness factor was calculated.
An in vitro disintegration test was performed according to Ph. Eur. [38] for six tablets. A tablet was placed in each 250 mL beaker containing 200 mL of ultra-pure water at 15–25 °C.

2.3. Photodegradation under Simulated Aging

To perform the accelerated aging test, the randomly selected tablets were placed in a Solarbox 1500 chamber (COFOMEGRA Srl, Milan, Italy). Irradiation of the effervescent tablets was performed under simulated solar light at 350 W m2 (1500 W Xenon lamp, 300–800 nm) at 45 °C for 7 days. A soda-lime glass UV filter, mounted in the test chamber, simulated solar light conditions through indoor glass. The tablets were taken before the start of the irradiation (day 0), then on day 3 of the irradiation (day 3), and after the end of the irradiation on day 10 (day 10). At the three time points tested (day 0, day 3, day 10) during the experiment, 20 effervescent tablets of each type were analysed.

2.4. Hyperspectral Imaging

A hyperspectral Specim IQ camera (Spectral Imaging Ltd., Oulu, Finland) was used to obtain hyperspectral profiles of the analyzed tablets in the subsequent days of the experiment within the wavelength range of 400–1030 nm and a spectral resolution of 7 nm. The reflectance of each tablet was measured every 3 nm, which gave 204 measurements in total. The spatial resolution was 512 × 512 and the pixel size was 17.58 μm × 17.58 μm. The distance of the camera from the analyzed tablet was 30 cm. During each measurement, a white reference was used to measure the incident light that was seen by the camera before it reached the test sample. The tablets were illuminated with external light consisting of two bulbs with flat spectral characteristics in the spectral range of the device, i.e., 400–1000 nm, and the integration time of a single frame for this lighting ranged from 12 ms to 19 ms. Image analysis and raw data conversion to the matrix was performed with the software of MATLAB version 7.11.0.584 (R2010b). At the three study time points (day 0, day 3, day 10) of the experiment, 10 effervescent tablets of each type were analysed.

2.5. X-ray Microtomography

The tablets were scanned using the GE PHOENIX v|tom|x s system (General Electric Sensing and Inspection Technologies/Phoenix X-ray, Wunstorff, Germany) at the Computed Microtomography Laboratory of the University of Silesia in Katowice (Poland). Scanning was performed with a voltage of 120 kV, a current of 200 µA, and a projection time of 250 ms. A total of 2100 projections were taken, and the reconstructed volume was a voxel size of 22 µm. Three randomly selected tablets from each preparation and each time point (day 0, day 3, day 10) were scanned. These scans were then used to assess the density and porosity of the preparations.

2.5.1. Analysis of the Density of the Inner Structure Using X-ray Microtomography

The detailed methodology for estimating the density of the internal structure of the tablets was described earlier [39]. A density template from QRM Micro-CT HA Phantom (Quality Assurance in Radiology and Medicine GmbH, Möhrendorf, Germany) was placed between the tablets and scanned. The following software was used for this purpose: myVGL 3.1 software (Viewer for Data Processed by Volume Graphics GmbH, Heidelberg, Germany) and ImageJ software (ImageJ 1.53a; National Institutes of Health, Madison, WI, USA). Density evaluation was based on the relationship between the brightness of the pixels in the X-ray scans and the density of the analyzed area. Simultaneously with the analyzed tablets, the calibration phantom was scanned with the reference density areas (W1 = 1.13 g/cm3, W2 = 1.16 g/cm3, W3 = 1.26 g/cm3, W4 = 1.65 g/cm3, and W5 = 1.90 g/cm3). For each analyzed preparation, a calibration curve was determined for the correlation between the pixel brightness and the density of standards from the calibration phantom by reading the curve equations, from which the density of the analyzed areas of the tested tablets was then calculated.

2.5.2. Porosity Analysis Using X-ray Microtomography

After reconstruction, the volume of the tablets was oriented parallel/perpendicular to the main cutting planes. Volumes saved with this orientation were loaded and analyzed using the ImageJ 1.44p software (National Institutes of Health, Bethesda, MD, USA). Porosity was analyzed in an area with a diameter of 22 mm and for approximately 200 layers for each tablet. The results of the porosity are presented as the average of the measurements of three of the same type of tablets at the same time point and thermal history.

2.6. Statistical Analyses

Statistical analyses were performed using the Statistica 13 software (StatSoft; Statistica, Tulsa, OK, USA). Graphs were made using Microsoft Excel 2019 (Office 365, Microsoft Corporation, Redmond, WA, USA). The data were expressed as means along with standard deviations (M ± SD). The quantitative data were evaluated for the normality of the distribution using the Shapiro–Wilk W test. As all data were time-dependent continuous variables (i.e., obtained before the experiment (day 0) and then on days 3 and 10), they were analyzed using repeated-measures ANOVA. When a significant relationship between three measurements was found, the Bonferroni post hoc test was used to compare pairs of measurements. The results with p ≤ 0.05 were found to be statistically significant.

3. Results

3.1. Characteristics of the Analysed Effervescent Tablets

The evaluated properties of the effervescent tablets are shown in Table 1. The weight uniformity of the tablets tested was found to be within the range recommended by pharmacopoeial guidelines: the percentage limit is ±5.0% due to an average tablet weight of more than 250 mg. Significant statistical differences in mean weights between the three days of the experiment were observed for Preparation 3.
In the case of the strength parameters, we observed a significant (p < 0.05) increase in the hardness of all types of the effervescent tablets tested after 3 and 10 days of storage under stress conditions, as compared to the values determined on day 0, i.e., at the beginning of the experiment. However, the force needed to crush the tablet differed significantly between the days of the experiment in Preparation 2 and Preparation 3 (Table 1).
The effervescent tablets must dissolve in water within 5 min. The dissolution time for the tablets tested ranged from 1.01 min ± 0.01 (Preparation 3) to 1.35 min ± 0.01 (Preparation 1). It was observed that the disintegration time for Preparation 1 and Preparation 2 increased during the exposure to heat and UV radiation in the following order: day 0 < day 3 < day 10. The differences between the days of the experiment for these preparations were significant (p = 0.002 and p < 0.001, respectively). No significant changes in the disintegration for Preparation 3 during the experiment were demonstrated (Table 1).

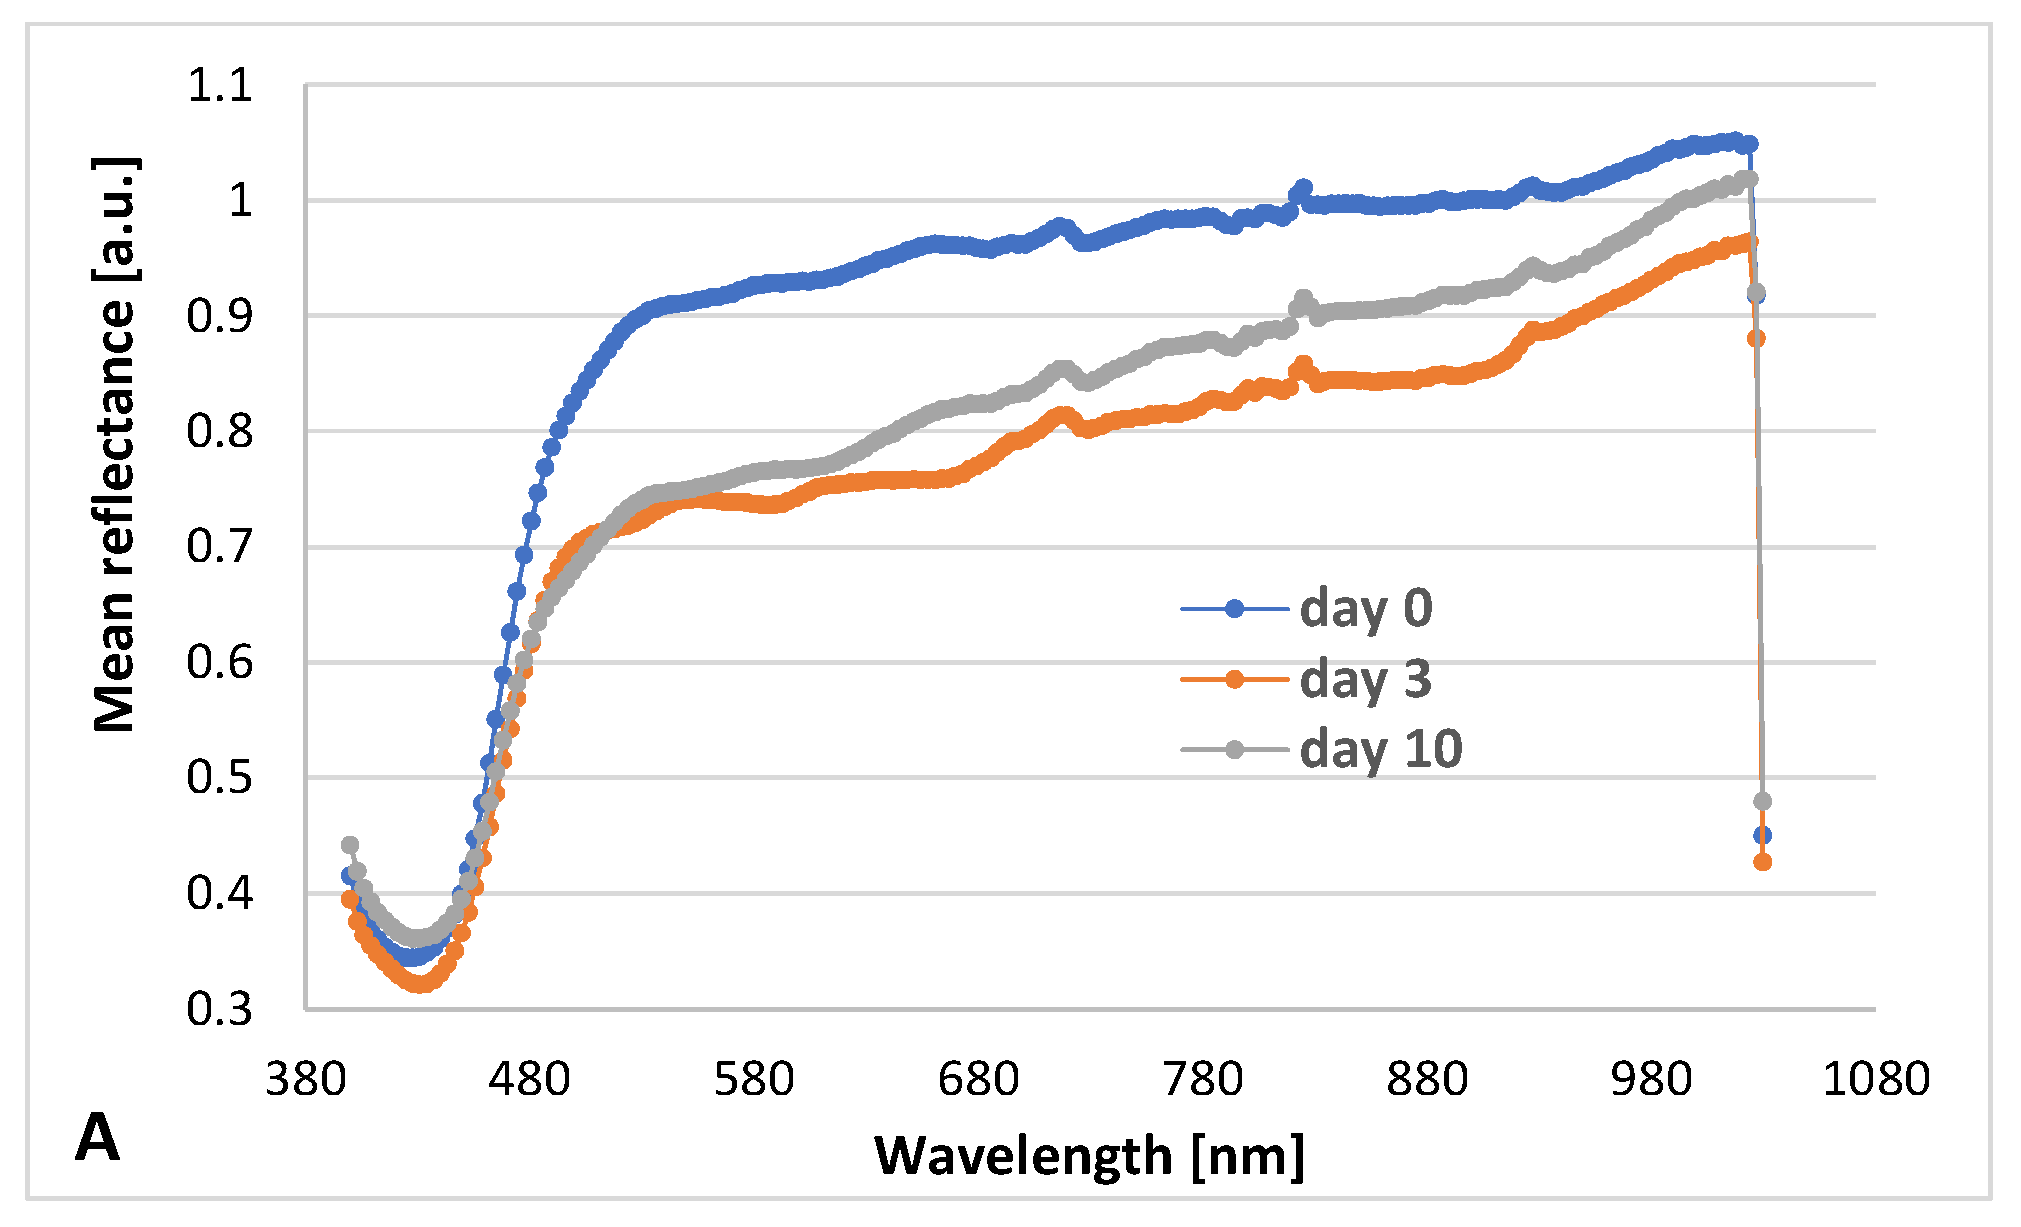
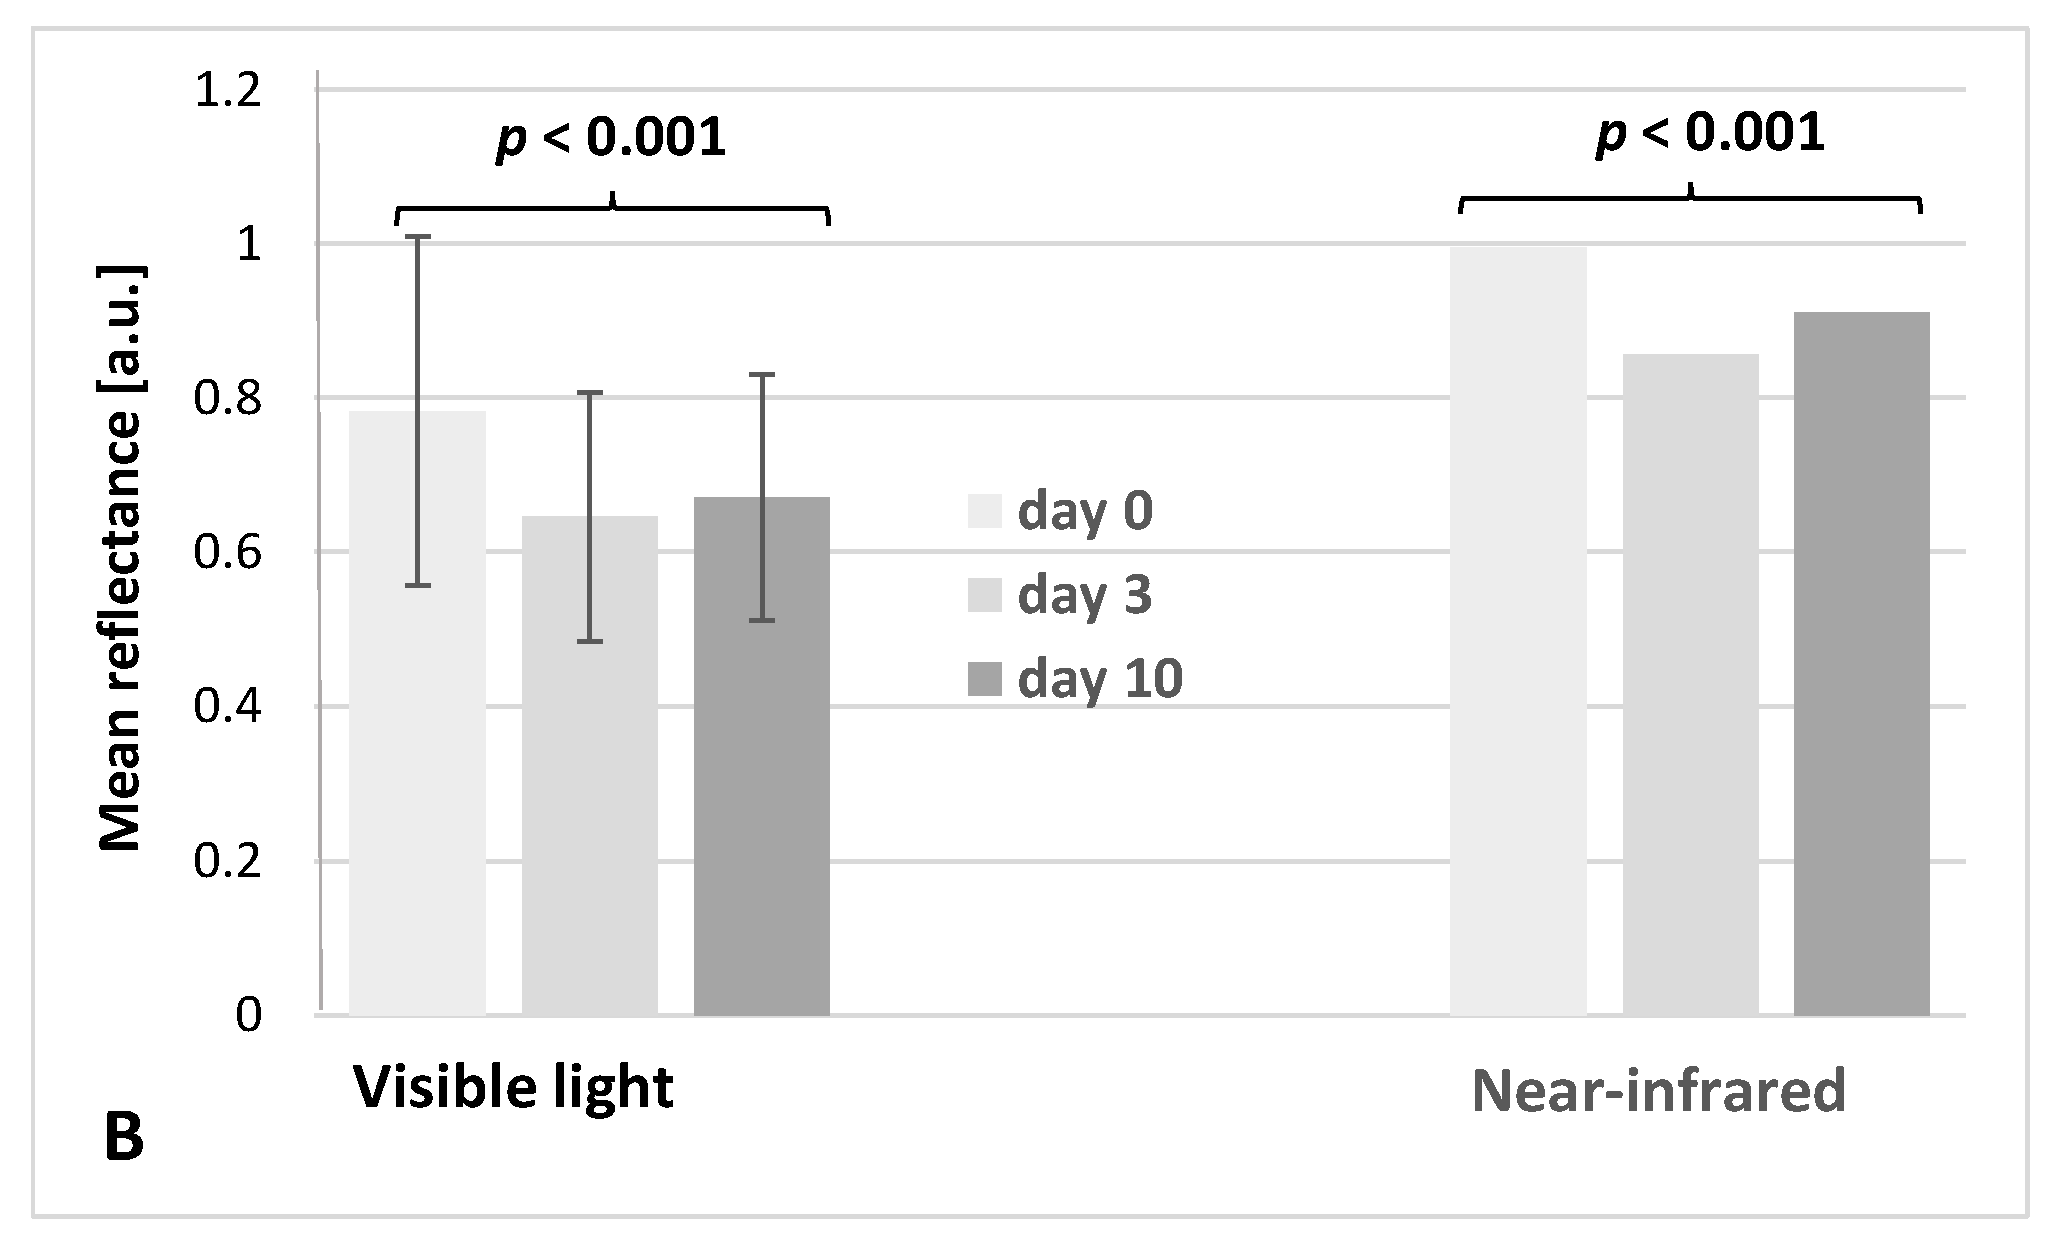
3.2. Hyperspectral Analysis

For Preparation 1, in general, the mean reflectance was the lowest in each measurement wavelength on the last day of the experiment—therefore, after 10 days of exposure to high temperature and UV, more radiation from the visible to near-infrared range passed through the tablet surface (Figure 1A). In addition, reflectance obtained in the hyperspectral analysis was also analyzed as the joint mean value of reflectance within two spectral ranges, i.e., visible light (400–698 nm) and near-infrared (701–1030 nm). Figure 1B shows bar charts of average reflectances determined on subsequent days of the experiment (day 0, day 3, and day 10) for Preparations 1. Significant differences between the three days of the experiment both within visible light and near-infrared were noted (p < 0.001 each).
For Preparation 2, reflectance on day 3 was comparable to reflectance on day 10 (the course of the curve is similar) (Figure 2A). However, these are lower values compared to the reflectance of tablets assessed before the stress conditions were applied. The average reflectance values for Preparation 2 analyzed in two spectral ranges, i.e., visible light and near-infrared, again indicated significant differences between the days of the experiment (p < 0.001 for each range) (Figure 2B).
In turn, for Preparation 3, lower values were observed on the reflectance curve on day 3 from 514 nm as compared to the reflectance on day 10 (Figure 3A). Still, these were lower values than those from before the study began. This relationship is more clearly visible in the bar chart in the averaged reflectance values in visible and near-infrared light—the reflectance values on day 10 are higher than the values on day 3 (Figure 3B).

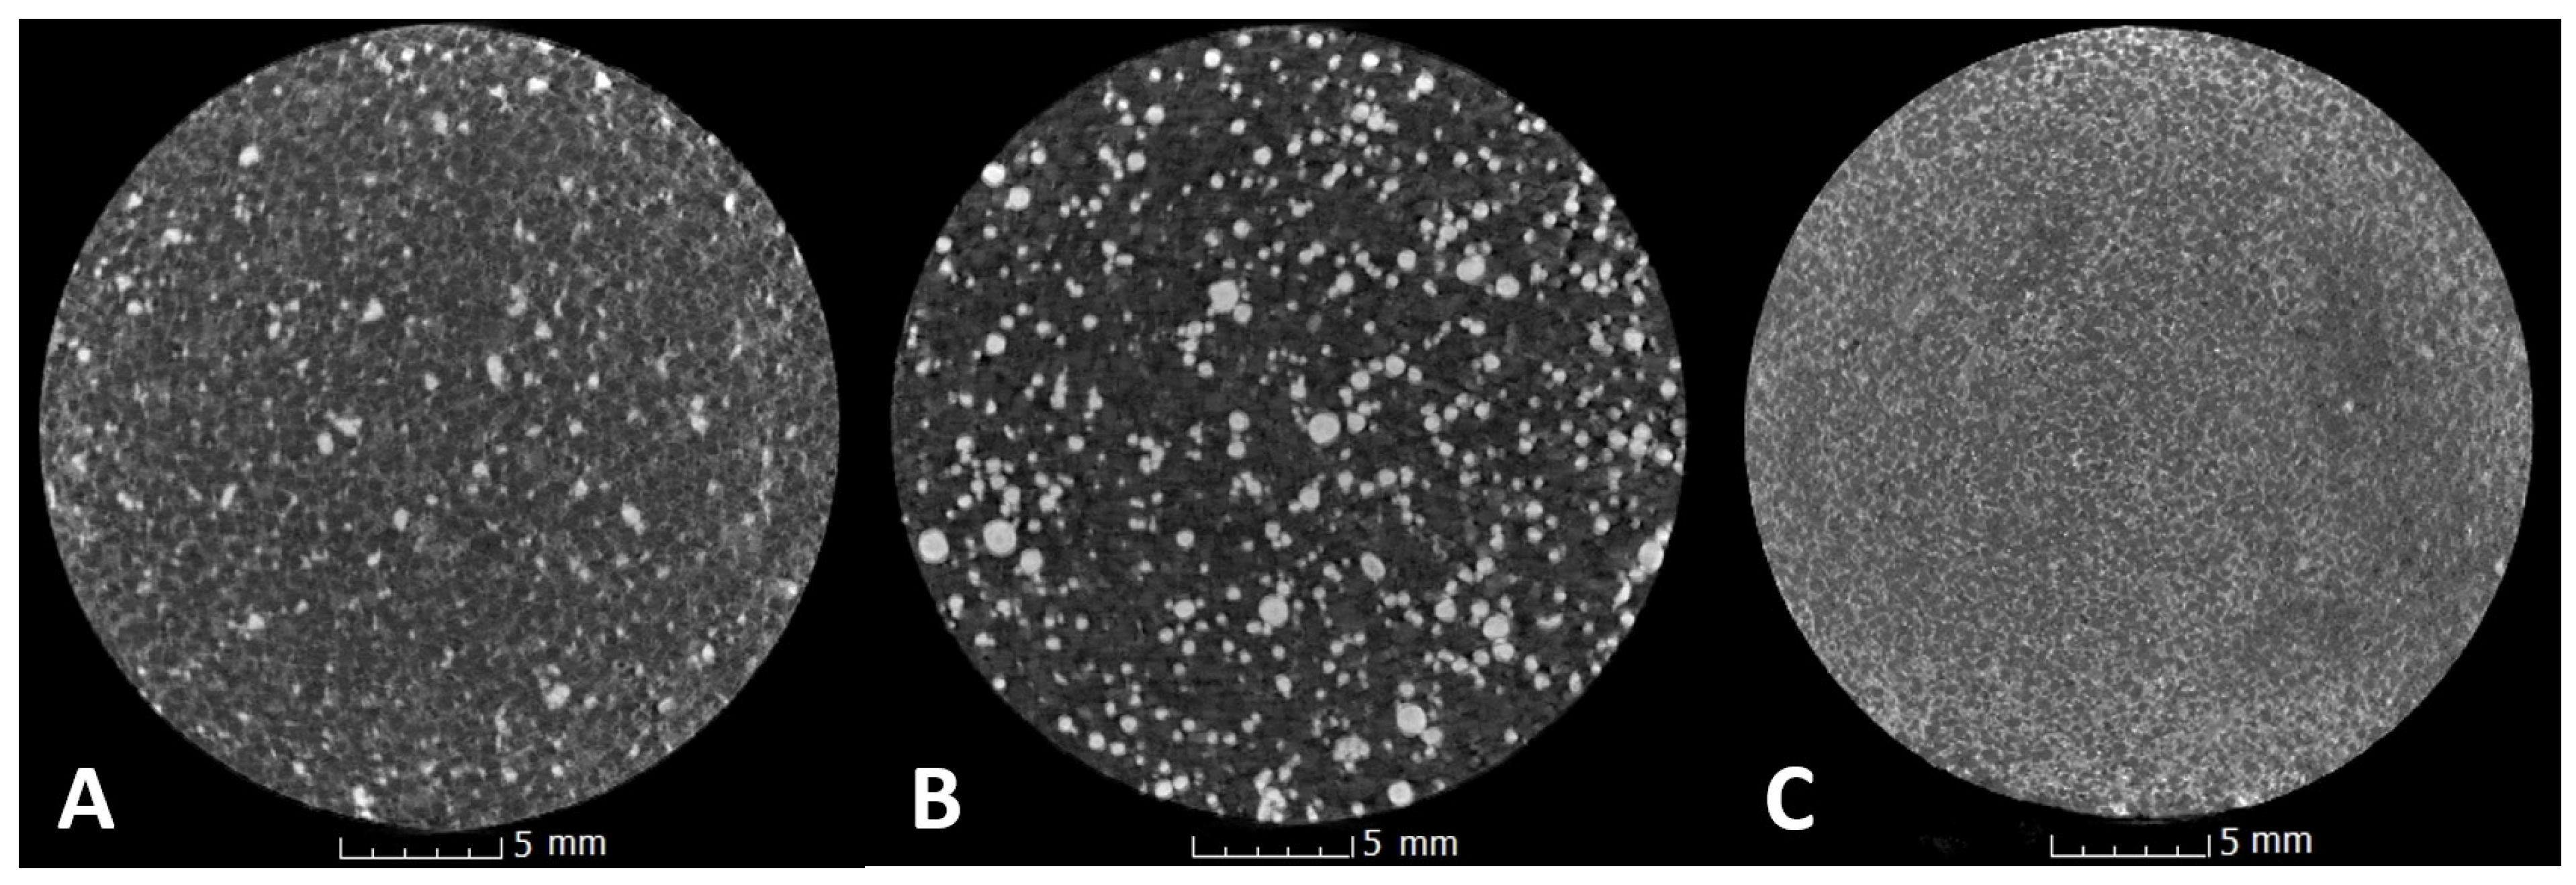
3.3. X-ray Microtomography Analyses

3.3.1. Measurement of Density of Analyzed Tablets

For Preparation 1 and Preparation 2, the density after three days of elevated temperature and UV light was comparable to the density before the start of the experiment (Table 2). After 10 days of stress conditions, a significantly higher density was found for these preparations.

3.3.2. Measurement of Porosity of Analyzed Tablets

Images of the effervescent tablets stored under stress conditions for 10 days, obtained using X-ray microtomography, are shown in Figure 4.
The porosity of Preparation 1 and Preparation 2 on day 3 and day 10 of application of elevated temperature and UV radiation was significantly lower than the porosity at the beginning of the experiment (day 0) (p < 0.001) (Table 2).
In the case of Preparation 3 tablets, after three days under the stress conditions, the mean values of this parameter were significantly higher (p < 0.001) compared to the values determined at the beginning of the experiment. In contrast, after 10 days of the experiment, the density of these tablets was similar to the baseline values (day 0).

4. Discussion

In the present study, hyperspectral analysis and X-ray CT scanning were used to control the stability of photo-aged and heated effervescent tablets. X-ray CT scanning was performed to determine the density and porosity of the tablets and hyperspectral analysis was used to assess how stressful conditions change the reflectance values of effervescent tablets. The data obtained by these methods were compared with results based on pharmacopoeial methods. It was observed that after 10 days under heat and UV radiation, there was a significant decrease in the mean reflectance value for tablets of the tested preparations. This decrease was also confirmed when we analyzed the averaged reflectance values separately for the visible and near-infrared light ranges. A change in the reflectance coefficient may indicate changes in the microstructure of the tablets, which result in easier penetration of radiation through/into the tablets.
X-ray microtomography is a non-destructive imaging technique. The method is derived from clinical computed tomography for the imaging diagnosis of patients and is adapted for the analysis of small samples. This allows for higher resolutions (voxel size of 0.4 µm to 100 µm). The resolution is dependent on the design of the microtomograph, the sample size, and the region of interest (ROI). In the case of the tablets tested in our study, the voxel size was 22 µm. Computed tomography allows the 3D structure of solid dosage forms to be characterized and the distribution of API particles and excipients to be determined [40]. In this technique, a virtual ‘cut’ of the sample in each axis and an in-depth analysis of the selected area can be made. A single scan gives a series of data on dimensions, material characteristics, defects (e.g., pores or cracks), and internal structure in a non-destructive manner. Parameters such as density, pore structure, and porosity, obtained using this method, provide information on the microstructure of the tablet [41,42]. In addition, defects observed in the obtained image in the form of microcracks and delamination correlate with the mechanical properties of the tablets [3,37,43,44].
Hyperspectral imaging is an advanced technology that combines spectroscopy with imaging capabilities. The technique involves capturing and analysing data from a large number of narrow, contiguous bands across the electromagnetic spectrum, resulting in a high-resolution spectrum for each image pixel. The spectrum obtained by this method can be likened to a fingerprint, as each material and compound reacts differently with light. In our study, illumination with flat spectral characteristics in the camera’s operating range, i.e., 400–1000 nm with a spectral resolution of 7 nm and number of spectral channels of 86, was used to illuminate the tablets tested.
After the experiment we performed, all of the tablet types showed higher tensile strength. In the case of Preparation 1 and Preparation 2, the increase in density resulted in higher hardness values, an increase in dissolution time, and a decrease in porosity (the latter parameter only on day 3 of the test). On day 10, the porosity of these preparations was significantly higher compared to the value determined after 3 days, but at the same time significantly lower than at the start of the experiment. The differences in the values describing the tested parameters may be due to the absorption of small amounts of moisture and the formation of hydrates. In contrast, for Preparation 3, a significant increase in porosity, a decrease in density, and a shorter dissolution time were observed on day 3 of storage under stress conditions, compared to the initial values (day 0). The values of these 3 parameters at day 10 are similar to those determined at the start of the test (day 0).
The measured stability indices for Preparation 3 were characterized by a different tendency of changes, which may result from differences in the composition of the tested preparations.
Effervescent tablets are uncoated tablets designed to be dissolved or dispersed in water before administration [45]. For pharmaceuticals that damage the stomach or are sensitive to gastric pH, administration in this form may be beneficial for both patient comfort and the efficacy of the drug used. In addition, drugs requiring large doses can be administered as effervescent tablets [46]. This form may provide faster absorption of the API than conventional oral formulations and, therefore, a faster pharmacological effect [47]. In effervescent tablets, carbonates or bicarbonates and organic acids account for a large proportion by weight., and their presence in the formulation allows decomposition with the release of CO2 upon contact with water. Effervescent products are unstable due to their hygroscopic nature. A small amount of moisture can lead to an interaction that depends on the affinity of the solid to bind moisture, the strength of the bond, the functional groups present on the surface of the solid, and the exposed surface [48]. To prevent this, their production takes place under controlled hygrothermal conditions (relative humidity below 20%, at 25 °C) and the final product is packaged in containers containing a moisture absorber or foil pouches [46,49].
Citric acid is a highly hygroscopic component of effervescent formulations, probably due to the presence of carboxylic groups. During moisture sorption it turns into a liquid form, and during desorption it turns into monohydrate citric acid. Even a low-moisture uptake can initiate an autocatalytic reaction between citric acid and sodium bicarbonate. Co-crystallization of citric acid with nicotinamide blocks the interaction sites with water, making it a non-hygroscopic compound [50].
In addition to composition, the presence of pores in the tablet matrix is an important quality parameter. Porosity affects the mechanical stability (hardness, friability, tensile strength, etc.), as well as the disintegration and subsequent release of the drug. This parameter is investigated by various methods, the most commonly used methods being mercury porosimetry, helium pycnometry, and NMR [51]. In contrast to the aforementioned methods, terahertz techniques and computed tomography allow for imaging of not only open and connected pores in pharmaceutical tablets but also closed ones [52,53]. Moradikouchi et al. [54] showed a correlation between porosity measured by the terahertz method and the dissolution rate and disintegration time of ibuprofen and indomethacin-containing formulations. In another study, an increase in the concentration of l-menthol (used as a porogen) in captopril-containing floating tablets was shown to increase porosity and API release rate in vitro and in vivo [55].
In the available literature, to the authors’ knowledge, there are no data on the physical and morphological changes occurring under UV and elevated temperatures. However, the mechanism of the degradation process occurring under the influence of moisture in effervescent preparations is generally known.
Previously, Donoso et al. [56] used NIR to measure the porosity and hardness of theophylline tablets and demonstrated a correlation between hardness and compressive strength and the corresponding NIR spectra, i.e., an increase in hardness and a decrease in porosity of the formulations increased near-infrared absorption.
At every stage of a medicinal product’s ‘life’ (production, transport, storage, use at home), it is exposed to light. From a practical point of view, during trips or holidays, medicines should be stored in their original packaging, and moisture-absorbing substances should not be removed from the packaging of effervescent medicines, the packaging should not be closed tightly or the tablets should be stored in undamaged foil pouches. However, patients who suffer from visual disturbances, cognitive impairment, or physical impairment, especially the older ones, are unable to follow therapeutic recommendations [57,58,59].
Dijkstra et al. [60] surveyed elderly people living at home (over 65 years of age) who were taking more than five different prescription medications per day. The authors showed that the patients stored their medications in places not intended for this purpose or stored them with the possibility of future use, or gave them to others. They chose as storage places for their medications those that reminded them of the times to take them, such as next to the tap; on the bedside table, kitchen table or sofa; on the windowsill; in the kitchen cupboard; or in the bathroom next to the toothbrush. In contrast, medicines meant for later use were stored in places other than those used daily, e.g., in wardrobes or basements. Expired medicines were among the stockpiles. It is noteworthy that the patients interviewed did not realize that the appearance of signs and symptoms of adverse reactions to medicines could be related to their improper use.
In the study by Funk et al. [61], the household medication storage locations in terms of temperature and humidity recommendations were analysed via online survey. The authors found that 76.7% of the households surveyed stored medicines inappropriately, with moisture and temperature issues affecting around 11% and 17% of households, respectively.
The choice of storage location is justified by patients on the grounds of convenience with bathroom, bedroom, or kitchen being the most frequently indicated locations [62,63]. A study by Hewson et al. [62] confirmed that the kitchen and bathroom may not be suitable places to store moisture- and temperature-sensitive medicines. The authors observed very wide ranges of temperature and RH both in the kitchen (temp. from 16.0 to 36.3 °C and RH from 27.2% to 85.2%) and in the bathroom (temp. from 13.8 °C to 31.5 °C and RH from 33% to 100%) [62].
In turn, a Dutch study performed on 170 geriatric patients aged over 65 years showed that 13.6% stored their medication in a humid or sunny place, despite other indications on the product label [63]. Again, the temperature measured in the kitchen, in the bedroom, and in the bathroom ranged from low to high values (from 7.6 °C to 30.3 °C in the kitchen, from 8.4 °C to 28.6 °C in the bedroom, and from 10.1 °C to 24.4 °C in the bathroom).

5. Conclusions

The proposed hyperspectral imaging and computed tomography methods do not re-quire prior sample preparation for testing and can be performed for tablets taken directly from the package. This also eliminates the risk of sample damage/contamination during sample preparation. The lack of need to tamper with the sample allows it to be preserved intact after testing, so it is a non-invasive method. The hyperspectral camera used is, in our opinion, a device compact enough to allow measurements to be taken in the field, e.g., in pharmacies or wholesalers where medicines are stored. Both methods used in the study are environmentally friendly and fast. The tests are performed in real time and do not require additional reagents.
Using hyperspectral analysis, significant changes in reflectance values in the range from visible to near-infrared light were demonstrated after the exposure of three effervescent preparations to stress conditions (heat, UV). Lower reflectance values at the end of the photoaging test indicate that more light passes into the tablet. The significant increase in density and decrease in porosity (for Preparations 1 and 2) indicate that changes are taking place in the microstructure of the tablets. These changes also translate into their mechanical properties.
The authors also wished to draw attention to the paucity of research related to the problem of inadequate storage of pharmaceutical preparations by patients and the possibility of adverse reactions. In this context, rapid, non-invasive analytical methods (e.g., hyperspectral analysis), become useful tools in the initial control of their quality.

Author Contributions

Conceptualization, B.S.-M. and B.S.-H.; methodology, B.S.-M., B.S.-H., M.M. and P.D.; software, B.S.-M., B.S.-H., M.M. and P.D.; validation, B.S.-M., B.S.-H., M.M. and P.D.; formal analysis, B.S.-M. and B.S.-H.; investigation, B.S.-M., B.S.-H., M.M. and P.D.; resources, B.S.-M.; data curation, B.S.-M., B.S.-H., M.M. and P.D.; writing—original draft preparation, B.S.-M., B.S.-H., M.M. and P.D.; writing—review and editing, B.S.-M. and B.S.-H.; visualization, B.S.-M. and B.S.-H.; supervision, B.S.-M.; project administration, B.S.-M.; funding acquisition, B.S.-M. All authors have read and agreed to the published version of the manuscript.

Funding

The experimental part of this study as well as the APC were funded by the Medical University of Silesia in Katowice (Poland) within the projects PCN-1-059/K/2/F.

Data Availability Statement

Data are contained within the article.

Conflicts of Interest

The authors declare no conflicts of interest.

References

  1. Jamrógiewicz, M.; Karczewska-Kaliszak, A.; Milewska, K. Light-sensitive medicinal compounds—The latest review of studies and strategies in proceedings. Farm. Pol. 2019, 75, 575–583. (In Polish) [Google Scholar] [CrossRef]
  2. Ramos, P.; Broncel, M. Influence of Storage Conditions on the Stability of Gum Arabic and Tragacanth. Molecules 2022, 27, 1510. [Google Scholar] [CrossRef]
  3. Gul, W.; Basheer, S.; Karim, F.; Ayub, S. Effect of Acid. Base. Temperature and U.V. Light on Amlodipine Besylate. Int. J. Adv. Res. Chem. Sci. 2015, 2, 21–24. [Google Scholar]
  4. Mira, J.J.; Lorenzo, S.; Guilabert, M.; Navarro, I.; Pérez-Jover, V. A Systematic Review of Patient Medication Error on Self-Administering Medication at Home. Expert Opin. Drug Saf. 2015, 14, 815–838. [Google Scholar] [CrossRef]
  5. Mohammed, K.A.; Ibrahim, H.K.; Ghorab, M.M. Effervescent tablet formulation for enhanced patient compliance and the therapeutic effect of risperidone. Drug Deliv. 2016, 23, 297–306. [Google Scholar] [CrossRef]
  6. Li, Y.; Yao, J.; Han, C.; Yang, J.; Chaudhry, M.T.; Wang, S.; Liu, H.; Yin, Y. Quercetin. Inflammation and Immunity. Nutrients 2016, 18, 167. [Google Scholar] [CrossRef]
  7. Popiolek-Kalisz, J.; Fornal, E. The Effects of Quercetin Supplementation on Blood Pressure—Meta-Analysis. Curr. Probl. Cardiol. 2022, 47, 101350. [Google Scholar] [CrossRef] [PubMed]
  8. Özsoy Gökbilen, S.; Becer, E.; Vatansever, H.S. Senescence-mediated anticancer effects of quercetin. Nutr. Res. 2022, 104, 82–90. [Google Scholar] [CrossRef] [PubMed]
  9. Calabrese, E.J.; Hayes, A.W.; Pressman, P.; Dhawan, G.; Kapoor, R.; Agathokleous, E.; Calabrese, V. Quercetin induces its chemoprotective effects via hormesis. Food Chem. Toxicol. 2024, 184, 114419. [Google Scholar] [CrossRef] [PubMed]
  10. Di Petrillo, A.; Orrù, G.; Fais, A.; Fantini, M.C. Quercetin and its derivates as antiviral potentials: A comprehensive review. Phytother. Res. 2022, 36, 266–278. [Google Scholar] [CrossRef] [PubMed]
  11. Nguyen, T.L.A.; Bhattacharya, D. Antimicrobial Activity of Quercetin: An Approach to Its Mechanistic Principle. Molecules 2022, 27, 2494. [Google Scholar] [CrossRef]
  12. Mlcek, J.; Jurikova, T.; Skrovankova, S.; Sochor, J. Quercetin and Its Anti-Allergic Immune Response. Molecules 2016, 21, 623. [Google Scholar] [CrossRef]
  13. Jafarinia, M.; Sadat Hosseini, M.; Kasiri, N.; Fazel, N.; Fathi, F.; Ganjalikhani Hakemi, M.; Eskandari, N. Quercetin with the potential effect on allergic diseases. Allergy Asthma Clin. Immunol. 2020, 16, 36. [Google Scholar] [CrossRef] [PubMed]
  14. Dębińska, A.; Sozańska, B. Dietary Polyphenols-Natural Bioactive Compounds with Potential for Preventing and Treating Some Allergic Conditions. Nutrients 2023, 15, 4823. [Google Scholar] [CrossRef] [PubMed]
  15. Yamada, S.; Shirai, M.; Inaba, Y.; Takara, T. Effects of repeated oral intake of a quercetin-containing supplement on allergic reaction: A randomized, placebo-controlled, double-blind parallel-group study. Eur. Rev. Med. Pharmacol. Sci. 2022, 26, 4331–4345. [Google Scholar] [CrossRef] [PubMed]
  16. Cesarone, M.R.; Belcaro, G.; Hu, S.; Dugall, M.; Hosoi, M.; Ledda, A.; Feragalli, B.; Maione, C.; Cotellese, R. Supplementary prevention and management of asthma with quercetin phytosome: A pilot registry. Minerva Med. 2019, 110, 524–529. [Google Scholar] [CrossRef] [PubMed]
  17. Beto, J.A. The role of calcium in human aging. Clin. Nutr. Res. 2015, 4, 1–8. [Google Scholar] [CrossRef]
  18. Xing, T.; Hu, Y.; Wang, B.; Zhu, J. Role of oral calcium supplementation alone or with vitamin D in preventing post-thyroidectomy hypocalcaemia: A meta-analysis. Medicine 2019, 98, e14455. [Google Scholar] [CrossRef] [PubMed]
  19. Fardellone, P.; Brazier, M.; Kamel, S.; Guéris, J.; Graulet, A.M.; Liénard, J.; Sebert, J.L. Biochemical effects of calcium supplementation in postmenopausal women: Influence of dietary calcium intake. Am. J. Clin. Nutr. 1998, 67, 1273–1278. [Google Scholar] [CrossRef]
  20. Jin, X.; Shen, J.; Liu, T.; Zhou, R.; Huang, X.; Wang, T.; Wu, W.; Wang, M.; Xie, R.; Yuan, J. The significance of short-term preoperative calcium and activated vitamin D3 supplementation in thyroidectomy: A randomized trial and prospective study. Endocr. Connect. 2023, 13, e230377. [Google Scholar] [CrossRef]
  21. Sittitrai, P.; Ruenmarkkaew, D.; Klibngern, H.; Ariyanon, T.; Hanprasertpong, N.; Boonyaprapa, S.; Sreesawat, M. Perioperative versus postoperative calcium and vitamin D supplementation to prevent symptomatic hypocalcemia after total thyroidectomy: A randomized placebo controlled trial. Int. J. Surg. 2023, 109, 13–20. [Google Scholar] [CrossRef]
  22. Woo Kinshella, M.L.; Sarr, C.; Sandhu, A.; Bone, J.N.; Vidler, M.; Moore, S.E.; Elango, R.; Cormick, G.; Belizan, J.M.; Hofmeyr, G.J.; et al. PRECISE Network. Calcium for pre-eclampsia prevention: A systematic review and network meta-analysis to guide personalised antenatal care. BJOG Int. J. Obstet. Gynaecol. 2022, 129, 1833–1843. [Google Scholar] [CrossRef]
  23. Cormick, G.; Betran, A.P.; Romero, I.B.; Cormick, M.S.; Belizán, J.M.; Bardach, A.; Ciapponi, A. Effect of Calcium Fortified Foods on Health Outcomes: A Systematic Review and Meta-Analysis. Nutrients. 2021, 3, 316. [Google Scholar] [CrossRef]
  24. Zhang, D.; Zhong, X.; Cheng, C.; Su, Z.; Xue, Y.; Liu, Y.; Zhang, Y.; Feng, M.; Xu, Z.; Zhao, T.; et al. Effect of Vitamin D and/or Calcium Supplementation on Pancreatic β-Cell Function in Subjects with Prediabetes: A Randomized. Controlled Trial. J. Agric. Food Chem. 2023, 71, 347–357. [Google Scholar] [CrossRef]
  25. Liu, Y.; Le, S.; Liu, Y.; Jiang, H.; Ruan, B.; Huang, Y.; Ao, X.; Shi, X.; Fu, X.; Wang, S. The effect of calcium supplementation in people under 35 years old: A systematic review and meta-analysis of randomized controlled trials. elife 2022, 11, e79002. [Google Scholar] [CrossRef]
  26. Darwin, A.H.; Carroll, M.P.; Galvis Noda, S.D.; Perez Perez, S.F.; Mhaskar, R.S.; Spoto-Cannons, A.C.; Lockey, R.F. Calcium and vitamin D intake in allergic versus non-allergic children and corresponding parental attitudes towards dairy products. World Allergy Organ. J. 2021, 14, 100579. [Google Scholar] [CrossRef] [PubMed]
  27. Miyake, Y.; Tanaka, K.; Okubo, H.; Sasaki, S.; Arakawa, M. Maternal consumption of dairy products. calcium. and vitamin D during pregnancy and infantile allergic disorders. Ann. Allergy Asthma Immunol. 2014, 113, 82–87. [Google Scholar] [CrossRef] [PubMed]
  28. Schaepman-Strub, G.; Schaepman, M.E.; Painter, T.H.; Dangel, S.; Martonchik, J.V. Reflectance quantities in optical remote sensing—Definitions and case studies. Remote Sens. Environ. 2006, 103, 27–42. [Google Scholar] [CrossRef]
  29. Wu, Y.; Xu, Z.; Yang, W.; Ning, Z.; Dong, H. Review on the Application of Hyperspectral Imaging Technology of the Exposed Cortex in Cerebral Surgery. Front. Bioeng. Biotechnol. 2022, 10, 906728. [Google Scholar] [CrossRef] [PubMed]
  30. Carrasco, O.; Gomez, R.B.; Chainani, A.; Roper, W.E. Hyperspectral imaging applied to medical diagnoses and food safety. In Geo-Spatial and Temporal Image and Data Exploitation III; SPIE: Bellingham, WA, USA, 2023; Volume 5097, pp. 215–221. [Google Scholar] [CrossRef]
  31. Sarić, R.; Nguyen, V.D.; Burge, T.; Berkowitz, O.; Trtílek, M.; Whelan, J.; Lewsey, M.G.; Čustović, E. Applications of hyperspectral imaging in plant phenotyping. Trends Plant Sci. 2022, 27, 301–315. [Google Scholar] [CrossRef] [PubMed]
  32. Vijayakumar, J.; Goudarzi, N.M.; Eeckhaut, G.; Schrijnemakers, K.; Cnudde, V.; Boone, M.N. Characterization of Pharmaceutical Tablets by X-ray Tomography. Pharmaceuticals 2023, 16, 733. [Google Scholar] [CrossRef]
  33. da Silva, Í.B. X-ray Computed microtomography technique applied for cementitious materials: A review. Micron 2018, 107, 1. [Google Scholar] [CrossRef]
  34. Landis, E.N.; Keane, D.T. X-ray microtomography. Mater. Charact. 2010, 61, 1305. [Google Scholar] [CrossRef]
  35. Dave, V.S.; Shahin, H.I.; Youngren-Ortiz, S.R.; Chougule, M.B.; Haware, R.V. Emerging technologies for the non-invasive characterization of physical-mechanical properties of tablets. Int. J. Pharm. 2017, 532, 299–312. [Google Scholar] [CrossRef]
  36. Meisner, M.; Duda, P.; Szulc-Musioł, B.; Sarecka-Hujar, B. X-ray Microtomography as a Non-Invasive Method for Evaluating the Stability of Commercial Effervescent Tablets. Eng. Proc. 2023, 37, 94. [Google Scholar] [CrossRef]
  37. Sarecka-Hujar, B.; Szulc-Musioł, B.; Meisner, M.; Duda, P. The Use of Novel. Rapid Analytical Tools in the Assessment of the Stability of Tablets—A Pilot Analysis of Expired and Unexpired Tablets Containing Nifuroxazide. Processes 2022, 10, 1934. [Google Scholar] [CrossRef]
  38. European Pharmacopoeia, 10th ed.; EDQM Council of Europe: Strasbourg, France, 2022.
  39. Meisner, M.; Duda, P.; Szulc-Musioł, B.; Sarecka-Hujar, B. Characteristics of Commercial Effervescent Tablets Using Selected Pharmacopeial and Novel Analytical Methods. Appl. Sci. 2023, 13, 3171. [Google Scholar] [CrossRef]
  40. Vanbillemont, B.; Everaert, H.; De Beer, T. New advances in the characterization of lyophi-lised orally disintegrating tablets. Int. J. Pharm. 2020, 579, 119153. [Google Scholar] [CrossRef] [PubMed]
  41. Miguélez-Morán, A.M.; Wu, C.-Y.; Dong, H.; Seville, J.P.K. Characterisation of density distri-butions in roller-compacted ribbons using micro-indentation and X-ray micro-computed tomography. Eur. J. Pharm. Biopharm. 2009, 72, 173–182. [Google Scholar] [CrossRef] [PubMed]
  42. Wiedey, R.; Kleinebudde, P. The Density distribution in Ribbons from Roll Compaction. Chem. Ing. Tech. 2017, 89, 1017–1024. [Google Scholar] [CrossRef]
  43. Akseli, I.; Iyer, S.; Lee, H.P.; Cuitiño, A.M. A quantitative correlation of the effect of density distributions in roller-compacted ribbons on the mechanical properties of tablets using ul-trasonics and X-ray tomography. AAPS Pharm. Sci. Tech. 2011, 12, 834–853. [Google Scholar] [CrossRef]
  44. Mazel, V.; Diarra, H.; Malvestio, J.; Tchoreloff, P. Lamination of biconvex tablets: Numerical and experimental study. Int. J. Pharm. 2018, 542, 66–71. [Google Scholar] [CrossRef]
  45. Palanisamy, P.; Abhishekh, R.; Kumar, D. Formulation and evaluation of effervescent tablets of aceclofenac. Int. Res. J. Pharm. 2011, 2, 185–190. [Google Scholar] [CrossRef]
  46. Aslani, A.; Fattahi, F. Formulation. characterization and physicochemical evaluation of ranitidine effervescent tablets. Adv. Pharm. Bull. 2013, 3, 315–322. [Google Scholar] [CrossRef]
  47. Dubray, C.; Maincent, P.; Milon, J.Y. From the pharmaceutical to the clinical: The case for effervescent paracetamol in pain management. A narrative review. Curr. Med. Res. Opin. 2021, 37, 1039–1048. [Google Scholar] [CrossRef]
  48. Sandler, N.; Reiche, K.; Heinamaki, J.; Yliruusi, J. Effect of Moisture on Powder Flow Properties of Theophylline. Pharmaceutics 2010, 2, 275–290. [Google Scholar] [CrossRef]
  49. Oliveira, M.S.; Torres, M.P.R.; Raiser, A.L.; Ribeiro, E.B.; Andrighetti, C.R.; Valladão, D.M.S. Effervescent vitamin C tablets and its quality control. Sci. Elec. Arch. 2020, 13, 73–79. [Google Scholar] [CrossRef]
  50. Sudhir, K.; Pagire, S.; Seaton, C.; Anant Paradkar, A. Improving Stability of Effervescent Products by Co-Crystal Formation: A Novel Application of Crystal Engineered Citric Acid. Cryst. Growth Des. 2020, 20, 4839–4844. [Google Scholar] [CrossRef]
  51. Sun, C.C. Microstructure of Tablet-Pharmaceutical Significance, Assessment, and Engineering. Pharm. Res. 2017, 34, 918–928. [Google Scholar] [CrossRef] [PubMed]
  52. Lu, X.; Sun, H.; Chang, T.; Zhang, J.; Cui, H.L. Terahertz detection of porosity and porous microstructure in pharmaceutical tablets: A review. Int. J. Pharm. 2020, 591, 120006. [Google Scholar] [CrossRef]
  53. Anuschek, M.; Bawuah, P.; Zeitler, J.A. Terahertz time-domain spectroscopy for powder compact porosity and pore shape measurements: An error analysis of the anisotropic bruggeman model. Int. J. Pharm. 2021, 3, 100079. [Google Scholar] [CrossRef]
  54. Moradikouchi, A.; Sparén, A.; Folestad, S.; Stake, J.; Rodilla, H. Terahertz frequency domain sensing for fast porosity measurement of pharmaceutical tablets. Int. J. Pharm. 2022, 618, 121579. [Google Scholar] [CrossRef]
  55. Raza, A.; Hayat, U.; Wang, H.J.; Wang, J.Y. Preparation and evaluation of captopril loaded gastro-retentive zein based porous floating tablets. Int. J. Pharm. 2020, 579, 119185. [Google Scholar] [CrossRef]
  56. Donoso, M.; Kildsig, D.O.; Ghaly, E.S. Prediction of tablet hardness and porosity using near-infrared diffuse reflectance spectroscopy as a nondestructive method. Pharm. Dev. Technol. 2003, 8, 357–366. [Google Scholar] [CrossRef] [PubMed]
  57. Notenboom, K.; Beers, E.; van Riet-Nales, D.A.; Egberts, T.C.; Leufkens, H.G.; Jansen, P.A.; Bouvy, M.L. Practical problems with medication use that older people experience: A qualitative study. J. Am. Geriatr. Soc. 2014, 62, 2339–2344. [Google Scholar] [CrossRef]
  58. Kollerup, M.G.; Curtis, T.; Schantz Laursen, B. Visiting nurses’ posthospital medication management in home health care: An ethnographic study. Scand. J. Caring. Sci. 2018, 32, 222–232. [Google Scholar] [CrossRef] [PubMed]
  59. Lau, C.L.L.; Hor, C.Y.; Ong, S.T.; Roslan, M.F.; Beh, X.Y.; Permal, D.; Rama, S. Home medication management problems and associated factors among psychiatric patients using home care pharmacy services at government hospitals in western Malaysia. BMC Health Serv. Res. 2022, 22, 726. [Google Scholar] [CrossRef]
  60. Dijkstra, N.E.; Sino, C.G.M.; Schuurmans, M.J.; Schoonhoven, L.; Heerdink, E.R. Medication self-management: Considerations and decisions by older people living at home. Res. Social. Adm. Pharm. 2022, 18, 2410–2423. [Google Scholar] [CrossRef] [PubMed]
  61. Funk, O.G.; Yung, R.; Arrighi, S.; Lee, S. Medication Storage Appropriateness in US Households. Innov. Pharm. 2021, 12, 10. [Google Scholar] [CrossRef]
  62. Hewson, C.; Shen, C.C.; Strachan, C.; Norris, P. Personal medicines storage in New Zealand. J. Prim. Health Care 2013, 5, 146–150. [Google Scholar] [CrossRef] [PubMed]
  63. Vlieland, N.D.; van den Bemt, B.J.F.; Bekker, C.L.; Bouvy, M.L.; Egberts, T.C.G.; Gardarsdottir, H. Older Patients’ Compliance with Drug Storage Recommendations. Drugs Aging 2018, 35, 233–241. [Google Scholar] [CrossRef] [PubMed]
Figure 1. (A) Hyperspectral profiles of Preparation 1; blue, orange, and gray lines correspond to the average reflectances on day 0, day 3, and day 10 of the experiment, respectively. (B) Mean values of reflectance obtained in the hyperspectral analysis within two distinguished spectral ranges (i.e., from 400 to 698 nm as visible light and from 701 to 1030 nm as near-infrared) between the subsequent days of experiment. The SD bars for infra-red reflectance in (B) are not visible because the value is too low (approx. 0.05 for each time point).
Processes 12 00531 g001
Figure 2. (A) Hyperspectral profiles of Preparation 2; blue, orange, and gray lines correspond to the average reflectance on day 0, day 3, and day 10 of the experiment, respectively. (B) Mean values of reflectance obtained in the hyperspectral analysis within two distinguished spectral ranges (i.e., from 400 to 698 nm as visible light and from 701 to 1030 nm as near-infrared) between the subsequent days of experiment. The SD bars for infra-red reflectance in (B) are not visible because the value is too low (approx. 0.07 for each time point).
Processes 12 00531 g002
Figure 3. (A) Hyperspectral profiles of Preparation 3; blue, orange, and gray lines correspond to the average reflectance on day 0, day 3, and day 10 of the experiment, respectively. (B) Mean values of reflectance obtained in the hyperspectral analysis within two distinguished spectral ranges (i.e., from 400 to 698 nm as visible light and from 701 to 1030 nm as near-infrared) between the subsequent days of experiment. The SD bars for infra-red reflectance in (B) are not visible because the value is too low (approx. 0.06 for each time point).
Processes 12 00531 g003aProcesses 12 00531 g003b
Figure 4. Microtomographic images of the analyzed preparations after 10 days of the experiment (order: (A)—Preparation 1, (B)—Preparation 2 and (C)—Preparation 3).
Processes 12 00531 g004
Table 1. Selected pharmacopoeial parameters of the analyzed effervescent tablets including weight, the force needed to crush the tablet, the hardness factor, and the disintegration time during the experiment.
PreparationDuration of
Experiment [Days]
Weight [g]
n = 20, M ± SD
Force Needed to Crush the Tablet [N]
n = 5, M ± SD
Hardness Factor
[N/m2]
n = 5, M ± SD
Disintegration Time [min]
n = 6, M ± SD
Preparation 1day 04.210 ± 0.05648.860 ± 2.97135.13 × 104 ± 1.23 × 1041.08 ± 0.05
day 34.192 ± 0.06952.480 ± 7.17437.57 × 104 ± 3.64 × 1041.19 ± 0.01
day 104.168 ± 0.03662.240 ± 10.01344.58 × 104 ± 5.04 × 1041.35 ± 0.01
p 0.1320.1450.040 10.002 2
Preparation 2day 03.990 ± 0.04997.540 ± 19.40368.24 × 104 ± 10.48 × 1041.15 ± 0.01
day 33.991 ± 0.03197.380 ± 6.99769.61 × 104 ± 3.42 × 1041.17 ± 0.01
day 104.025 ± 0.046126.260 ± 9.45589.93 × 104 ± 3.42 × 1041.29 ± 0.01
p 0.5190.017 30.012 4<0.001 5
Preparation 3day 04.227 ± 0.01185.210 ± 2.33059.34 × 104 ±1.75 × 1041.05 ± 0.00
day 34.174 ± 0.015137.74 ± 3.69197.51 × 104 ± 2.08 × 1041.01 ± 0.01
day 104.183 ± 0.033145.24 ± 9.633102.38 × 104 ± 4.89 × 1041.05 ± 0.02
p <0.001 6<0.001 7<0.001 80.053
M—mean; SD—standard deviation. The significant differences are in bold. 1 post-hoc analysis: day 0 vs. day 10 p = 0.049; 2 post-hoc analysis: day 0 vs. day 10 p = 0.003 and day 3 vs. day 10 p = 0.002; 3 post-hoc analysis: day 0 vs. day 10 p = 0.035 and day 3 vs. day 10 p = 0.034; 4 post-hoc analysis: day 0 vs. day 10 p = 0.022 and day 3 vs. day 10 p = 0.030; 5 post-hoc analysis: day 0 vs. day 10 p < 0.001 and day 3 vs. day 10 p < 0.001; 6 post-hoc analysis: day 0 vs. day 3 p < 0.001, day 0 vs. day 10 p = 0.003, 7 post-hoc analysis: day 0 vs. day 3 p < 0.001 and day 0 vs. day 10 p < 0.001; 8 post-hoc analysis: day 0 vs. day 3 p < 0.001, and day 0 vs. day 10 p < 0.001.
Table 2. The mean density and porosity of the inner structure of the analyzed effervescent tablets.
PreparationDuration
of Experiment [Days]
Density (g/cm3)
n = 9, M ± SD
Porosity (%) n = 9, M ± SD
Preparation 1day 01.501 ± 0.0230.2070 ± 0.0525
day 31.495 ± 0.0250.0927 ± 0.0591
day 101.511 ± 0.0310.1355 ± 0.0321
p <0.001 2< 0.001 4
Preparation 2day 01.429 ± 0.0491.1700 ± 0.1793
day 31.420 ± 0.0550.4365 ± 0.0625
day 101.445 ± 0.0480.8523 ± 0.1037
p 0.001 1<0.001 5
Preparation 3day 01.452 ± 0.0300.0003 ± 0.0006
day 31.440 ± 0.0300.0007 ± 0.0008
day 101.450 ± 0.0280.0003 ± 0.0007
p <0.001 3<0.001 6
M—mean; SD—standard deviation. The significant differences are in bold. 1 post-hoc analysis for Preparation 1: day 0 vs. day 10 p < 0.001 and day 3 vs. day 10 p < 0.001; 2 post-hoc analysis for Preparation 2: day 3 vs. day 10 p < 0.001; 3 post-hoc analysis for Preparation 3: day 0 vs. day 3 p < 0.001 and day 3 vs. day 10 p = 0.001; 4 in a post-hoc analysis of p < 0.001: for each analyzed pair for Preparation 1 preparation; 5 in a post-hoc analysis of p < 0.001: for each analyzed pair for Preparation 2 preparation; 6 in a post-hoc analysis of p < 0.001: for each analyzed pair for Preparation 3 preparation day 0 vs. day 10.
Disclaimer/Publisher’s Note: The statements, opinions and data contained in all publications are solely those of the individual author(s) and contributor(s) and not of MDPI and/or the editor(s). MDPI and/or the editor(s) disclaim responsibility for any injury to people or property resulting from any ideas, methods, instructions or products referred to in the content.

