Review

Paddy Drying Technologies: A Review of Existing Literature on Energy Consumption

1
Energy and Efficiency Institute, University of California, Davis, CA 95616, USA
2
Department of Food Science and Technology, University of California, Davis, CA 95616, USA
*
Author to whom correspondence should be addressed.
Processes 2024, 12(3), 532; https://doi.org/10.3390/pr12030532
Submission received: 30 January 2024 / Revised: 3 March 2024 / Accepted: 4 March 2024 / Published: 7 March 2024
(This article belongs to the Section Food Process Engineering)

Abstract

:
This study explores the existing literature on specific energy consumption (SEC) use for paddy drying and consolidates all relevant data for comparisons across technologies. Energy consumption data for a range of drying technologies are consolidated from published literature and normalized to enable comparison. A large proportion of the source data are generated from operational performance in industrial or laboratory settings, while the remainder is derived from computer simulations. The SEC of paddy drying is driven primarily by technology type; however, operational factors (such as the system size, temperature, and airflow) and external factors (such as the local climate and paddy moisture content) also heavily influence system energy use. The results of our analysis show that the industrial drying technologies explored in this study have an average SEC of 5.57 ± 2.21 MJ/kg, significantly lower than the 20.87 ± 14.97 MJ/kg observed in a laboratory setting, which can potentially be attributed to differences in processing capacity. Multi-stage drying typically has higher energy efficiency when tempering stages are incorporated. The self-circulating design of some drying systems may provide additional opportunities for heat exchange, leading to efficient drying performance without the need for a separate tempering stage. Beyond traditional methods, we have observed a notable shift towards solar-assisted and infrared drying technologies in laboratory settings, reflecting an increasing interest in sustainable and efficient drying solutions. In summary, this review consolidates SEC data for rice drying technologies, analyzes the energy intensity and performance of each drying technology, and identifies data gaps that might be addressed in future research.

Graphical Abstract

1. Introduction

The drying process is essential for maintaining the quality of the freshly harvested paddy for downstream storage and distribution through the supply chain. Paddy, also known as rough rice, is the whole rice grain with the husk still attached, harvested directly from the field. Once processed to remove the husk, it becomes what is commonly known as processed rice. Freshly harvested paddy typically has a high moisture content of 20–26% wet basis (MCwb). Delayed or improper drying may cause deterioration due to mold and insects, either before or during the storage phase [1]. To ensure paddy rice has consistent quality and a longer duration of storage life, it must be dried to an MCwb of 14% or lower before storage [2,3].
The moisture in the harvested paddy exists in two areas: the surface and the inner core of the rice kernel. Drying technologies are generally optimized to manage drying in both areas while minimizing the negative impact of paddy drying [4]. During the paddy drying process, the moisture removal rate varies depending on the location of the moisture in the kernel [5,6]. The surface moisture generally evaporates faster, since the grains are exposed directly to hot air throughout the drying process. In contrast, removing moisture from the core of the kernel requires the right balance of heat for moisture to migrate from the core to the outer surface, which may take longer than drying surface moisture. Thus, paddy drying is characterized by three phases: the preheating period where the paddy begins to absorb heat but expresses only a slight moisture change; the constant-rate period, where the surface of the paddy reaches a steady temperature and continuous water evaporation; and the falling-rate period, which represents the time for internal water to migrate to the surface and evaporate at a declining rate, usually occurring when the MCwb of paddy is below 18% MC [7,8].
Optimizing the drying operations for the paddy is a delicate balance between time and temperature, and if these components are not balanced, the quality of the processed rice may be compromised. For instance, elevating the drying temperature can notably enhance the drying rate, but it also raises the risk of cracking or breaking the rice kernel, leading to a reduction in its market value [9,10,11]. Thus, modern paddy drying operations usually include a tempering stage to balance moisture within grains, minimizing stress and cracking, and enhancing milling quality by reducing breakage [12,13]. This process not only improves grain hardness and allows for final moisture content adjustments but also contributes to energy savings by optimizing subsequent drying phases [14]. Additionally, the tempering process provides a crucial opportunity to recycle residual heat and increase the overall energy efficiency of the system [15,16]. By including the tempering stage, the paddy drying process can achieve optimal results in terms of both quality and energy efficiency.
Commercialized paddy drying can broadly be divided into different categories, including convective mechanical dryers, infrared dryers, microwave dryers, and hybrid dryers.
  • Convective dryers are the most widely used method for paddy drying due to their efficiency, simplicity, and relatively low cost. They utilize a combination of hot air and mechanical agitation to remove moisture from the paddy.
  • Microwave dryers and infrared dryers work by heating the paddy using electromagnetic radiation and are gaining attention due to their ability to provide uniform drying and lower energy consumption [8,17,18,19].
  • Vacuum and freeze dryers reduce the air pressure or temperature, respectively, and are used in some specialized applications [20].
  • Solar-assisted dryers, ranging from simple solar dryers to advanced hybrid systems, utilize solar energy to reduce operational costs and environmental impact. These methods not only expedite the drying process but also align with sustainable agricultural practices by leveraging renewable energy sources and optimizing energy consumption [21,22,23,24].
The choice of dryer depends on various factors, such as the desired throughput, energy consumption, and product quality. Each type of dryer has its advantages and limitations. They can also be divided into single-stage and multi-stage systems based on the number of drying phases utilized [25,26].
Single-stage drying describes an independent dryer technology that applies heat and airflow to remove paddy moisture until the desired moisture content is reached, while multi-stage drying utilizes two or more dryer units or stages to gradually reduce the moisture content to the desired level. In a multi-stage system, the paddy is typically subjected to an initial drying stage, followed by a tempering stage, where the moisture level of the grain is equilibrated before being dried further in a subsequent stage. The most common convective mechanical drying technologies include the Fluidized Bed Dryer (FBD), the Louisiana State University Dryer (LSU), and the Spouted Bed Dryer (SBD). The FBD is a batch dryer that uses high-pressure hot air through a perforated bed, creating a stream of air that flows through the fluidized paddy and promotes efficient heat transfer. The LSU is a type of high-capacity continuous-flow dryer that blows high-speed hot air through the paddy bed, while the heat generated by the wet grains is recycled to help reduce the overall specific energy consumption (SEC) of the system [27]. The SBD comprises a deep vessel filled with paddy particulate through which superheated steam passes vertically via a small opening (or slot) located at the base of the vessel [28,29].
As part of a multi-stage or single-step processing process, FBD, LSU, and SBD can be employed depending on the application. During the initial stage, they are capable of reducing the initial moisture content of the paddy to 18% or less, and further decreasing it in subsequent stages in multi-stage systems with different drying conditions. In contrast, the ambient air dryer (AAV) and inclined bed dryer (IBD) are more appropriate for the second and third stages of drying as they are less effective at reducing the moisture content of paddy quickly. The AAV utilizes a vacuum-based system to remove water vapor from the drying environment, while the IBD has an inclined drying bed that facilitates the faster discharge of the dried paddy [10].
As well as these well-established technologies, a number of emerging technologies have been developed to improve paddy drying efficiency, including vibro-fluidized bed dryers (VFDs), membrane drying, and desiccant-based drying beads [30,31]. However, these technologies are still in the early stages of development and have not yet been commercially deployed. Although single-stage drying systems remain prevalent around the world due to their lower initial capital cost, ease of operation, and shorter drying time—all crucial factors during the harvest season when producers are seeking to maximize output—the trend is shifting towards multi-stage drying systems [32]. Despite the advantages of using a single-stage drying system, multi-stage drying is increasingly adopted, especially in countries like Thailand and China, due to its ability to produce higher quality paddy while using less SEC overall compared to single-stage systems [33,34]. Moreover, this approach can effectively reduce energy use and lower the cracking and germination inactivation rate [5,35].
While maintaining processed rice quality is critical for drying operations, reducing energy consumption remains an important goal. The SEC of paddy drying depends on a variety of factors, including the drying temperature, initial moisture content of the paddy, the desired final moisture content, the surface roughness, dimensions of paddy and thickness of the husk, the type of dryer being used, and the specific conditions of the drying process [36,37,38]. Of these, drying temperature is a particularly important factor. While some studies have shown that higher temperatures can lead to higher heat loss through increased convection and radiation losses, this effect is usually offset by the more rapid drying rates that can be achieved at higher temperatures, which can result in lower overall energy use [39,40,41,42,43,44]. The relative humidity of the local region plays an important role, as a humid environment increases the initial moisture content of the paddy, and thus requires more energy to remove this additional moisture from the product. Additionally, most drying processes use dry air as the medium to dry paddy. In higher-humidity climates, additional energy is required to both heat and dry the humid air [45,46]. Finally, additional studies show an inverse relationship between processing capacity and SEC, demonstrating an economy of scale where larger systems require lower energy inputs per unit of paddy compared to smaller systems [12,47,48].
Although several previous studies have explored the relative efficiency of one or more paddy drying technologies in terms of SEC and product quality, there is a dearth of studies that have compared the overall energy intensity of multiple technologies across a range of operational scales. This article aims to analyze a full suite of paddy drying operations at the industrial level, while also integrating additional data from lab studies and modeling simulations to develop as complete an understanding as possible of the SEC of paddy drying operations. The findings of this study could facilitate future research efforts aimed at improving the energy efficiency and sustainability of paddy drying operations. In addition to contributing to the current status of paddy drying technology, this study also provides valuable insights into data reporting for future paddy drying research.

2. Materials and Methods

The review of the literature encompasses a variety of sources published in the last two decades, including academic papers, official government documents, and reports from non-governmental organizations (NGOs) with a focus on paddy drying and SEC.
This study identified three different types of SEC estimates within the literature: observational data from large-scale drying operations, small-scale laboratory experiments, and computer simulation studies. The SEC estimates within each type of study were then categorized by technology and regional relative humidity. Ambient sun drying is a common paddy dehydrating process in developing countries but was excluded since it is outside the scope of our work and does not require energy inputs (beyond direct solar and human energy). This article primarily focuses on the drying of fresh paddy. Consequently, studies involving parboiled rice and rice that has been dried and subsequently re-wetted were not included in our analysis. The exclusion of parboiled rice is due to its altered physical properties resulting from the parboiling process, which markedly differ from those of fresh paddy. Similarly, re-wetted rice was excluded as its prior drying and re-wetting can change its physical characteristics, making comparisons with fresh paddy less meaningful. These exclusions ensure that our analysis remains focused on conditions most representative of fresh paddy drying, providing a coherent and directly comparable set of findings.
Table 1 below summarizes the drying technologies and their key characteristics.

2.1. Data Availability

Although this study aimed to provide a comprehensive analysis of the SEC of multiple paddy drying operations, several limitations must be acknowledged. Most notably, while the search for literature sources was thorough, there is a possibility that some relevant studies were inadvertently excluded from the analysis. Additionally, the focus of most paddy drying research is on quality improvement, including whiteness/head rice yield, rather than SEC. As a result, our study encountered challenges in finding comparable energy consumption data for all drying technologies. Furthermore, the lack of consistent data reporting across studies, including the absence of moisture content and drying condition information in some cases, made cross-comparison of technologies challenging. For certain drying technologies included in our study, only a limited number of studies were available that provided critical information for cross-comparison, including SEC data, moisture content, drying conditions, and initial and final moisture content.
The inability to differentiate between thermal and electrical energy usage in some studies further limits the accuracy of the total SEC estimates reported in this study. Most studies do not differentiate energy usage disaggregated by type (thermal or electrical). The use of thermal energy is directly related to the temperature and humidity difference between the target dry temperature/humidity and local temperature/humidity, which varies between different geographical regions. In contrast, the use of electrical energy is mainly from the operation of fans and/or conveyor systems and is less affected by weather and harvest season. Acknowledging this difference, we elected to present our results as total SEC (electrical + thermal) without further specification since this information was not clearly disaggregated in the source materials.

2.2. Drying Data Unifying

For a better estimation of total energy input, the SEC of industrial paddy drying is often calculated as the energy required per kg of dried paddy or the energy input per hour. However, this latter metric is not sufficient for comparative assessments of technologies deployed worldwide, given regional differences in energy pricing. Instead, the SEC is calculated as the energy consumed per unit of water removed (MJ/kg water removed), as commonly presented in academic literature [49,50]. It is important to note that most studies provide an SEC value based on the mean or median energy consumption, while several studies provide a variety of energy consumption values for various drying conditions. Consequently, Equations (1) and (2) were used to transform the thermal energy from MJ/kg of dried paddy to MJ/kg of water removed. This allowed us to compare the energy intensity of different drying technologies based on the amount of water removed rather than the mass of dry paddy.
While we recognize that using multiple energy consumption values for different drying conditions can provide a more accurate representation of the energy intensity of each technology, it is important to ensure that each study is given equal weight in our final dataset for cross-comparison. To achieve this, we took a standardized approach and averaged the provided high and low values for studies that reported data as a range. For studies that provided a more detailed and robust dataset, we calculated the average of all the data points to obtain a single representative value.
m f = m × ( 1 M i M f )
where
m f = the weight of paddy after drying
m = the weight of the wet paddy
M i = initial moisture content of the paddy
M f = final moisture content of the paddy after drying
E s = m × ( 1 ( M i M f ) ) m × ( M i M f ) × E d
where
E s = specific energy consumption of paddy (MJ/kg)
E d = energy consumption in MJ/kg dried paddy

2.3. Drying Temperature

While the SEC for paddy drying is influenced by multiple factors, such as the initial and targeted moisture content of paddy and airflow speed, drying temperature remains the most critical operational variable influencing SEC. Most studies, including those by Amantea et al. and Tirawanichakul et al., have shown that drying speed increases substantially with a rise in temperature due to the enhanced thermal gradient between the hot and cold sides of the system, leading to a more rapid heat transfer [39,51]. In addition to the drying temperature, the ambient air temperature also plays a vital role. The environmental temperature surrounding the drying setup can notably affect the efficiency of heat transfer and energy usage. Most drying systems use air as the heating medium; thus, the energy required to heat this air is directly related to the ambient air temperature. For instance, when the ambient temperature is lower, it requires additional energy to raise the air temperature to the desired drying level (without accounting for differences in ambient air relative humidity). It is important to consider both the temperature of the drying air and the ambient environmental temperature, as they collectively determine the overall drying dynamics and energy efficiency.

2.4. Comparison of Relative Humidity of Regional Environment

The SEC of different drying technologies can be influenced by the relative humidity of the cultivation region, which affects not only the initial and final moisture of the crop but also the relative humidity of the heating medium, typically ambient air. To make a fair comparison of SEC, we divided our review data into two sub-groups: low-humidity areas (with less than 60% average relative humidity) such as Iran (38%), and high-humidity areas (with an average relative humidity greater than 60%) such as Thailand (~80% RH). This categorization helps to account for variations in humidity levels and ensures that our comparisons are based on similar environmental conditions across studies. By using this approach, we can better evaluate the energy efficiency of drying technologies and identify the most effective solutions for different regions and climates.

2.5. Energy Consumption vs. Processing Capacity

Numerous studies have examined the effects of processing capacity on SEC for various drying technologies. According to most studies, larger systems with higher loads tend to consume less energy on a per-unit basis than smaller systems. In part, this can be attributed to the greater energy efficiency of larger equipment, which maintains a constant temperature and airflow rate more effectively, thereby reducing energy losses and enhancing overall efficiency. For instance, Jittanit et al. found that the SEC per unit of paddy in a large machine (5 tons of paddy per hour) was about two-thirds that of a smaller-scale system (3 tons of paddy per hour) [49]. In addition, research from multiple studies reported that energy requirements per kg of grain in small dryers (3.5 tons per hour) have an average of 1.63 times or higher than those in large dryers (>3.5 tons per hour) [52,53,54,55]. To ensure consistency across technologies, we averaged the data from processing capacity when multiple data points were available from the same literature. In addition, we differentiated between lab-scale and industrial-scale systems.

2.6. Statistical Test

Within the framework of our study’s methodology, which aimed to harmonize diverse data on specific energy consumption (SEC) from a wide array of literature, we encountered the challenge of comparing datasets with inherent variability and non-normal distribution. To address this, we applied the Mann–Whitney U test, a non-parametric statistical analysis tool, suitable for assessing the significance of differences between two independent groups without assuming a normal distribution of data [56]. All the analysis was performed using R [57].
The Mann–Whitney U test operates by ranking all observations from both groups being compared and then calculating the U statistic, which represents the sum of ranks in one group minus the expected rank sum if there were no differences between the groups. Specifically, the U statistic is calculated as shown in Equation (3).
U = R n ( n + 1 ) 2
where
  • R = the sum of ranks for a group
  • n = the number of observations within that group
The test also yields the W statistic, or the rank sum, which serves a similar purpose for result reporting. For a given group with n observations, each observation is ranked based on its value across the combined dataset of both groups. The W statistic is calculated as follows:
W = i = 1 n R i
where
Ri = the rank of the ith observation in the combined dataset. (In cases of tied values, average ranks are assigned to each of the tied observations.)
Significance is determined by the p-value, reflecting the probability of achieving the observed rank distribution if there were no actual differences between the groups; a p-value below 0.05 indicates a statistically significant difference. By applying the Mann–Whitney U test, we rigorously evaluated the SEC variations across drying technologies. This analysis, grounded in the ranks of specific energy consumption values, provided a robust basis for our evaluation.

3. Results

The relative SEC for multiple drying technologies is presented below in Figure 1. Comprehensive details, including references, stages of drying, drying technologies utilized, and specific energy information, are meticulously compiled and can be found in Appendix A, Table A1, for further reference and analysis. Given the influence of regional humidity and system scale on the level of SEC, the individual drying technologies are identified as being deployed in both lower (<60% environmental RH) and high-humidity (>60% environmental RH) regions and clustered in terms of industrial systems, lab-scale studies, and computer simulations. The results show that the SEC values from laboratory studies tend to be higher than those for industrial systems, while the estimates from the computer simulations tend to align well with the values for industrial systems. Similarly, as expected, we also found for the same type of drying technology, that the SEC use required for high-humidity regions is generally higher than that for low-humidity regions.

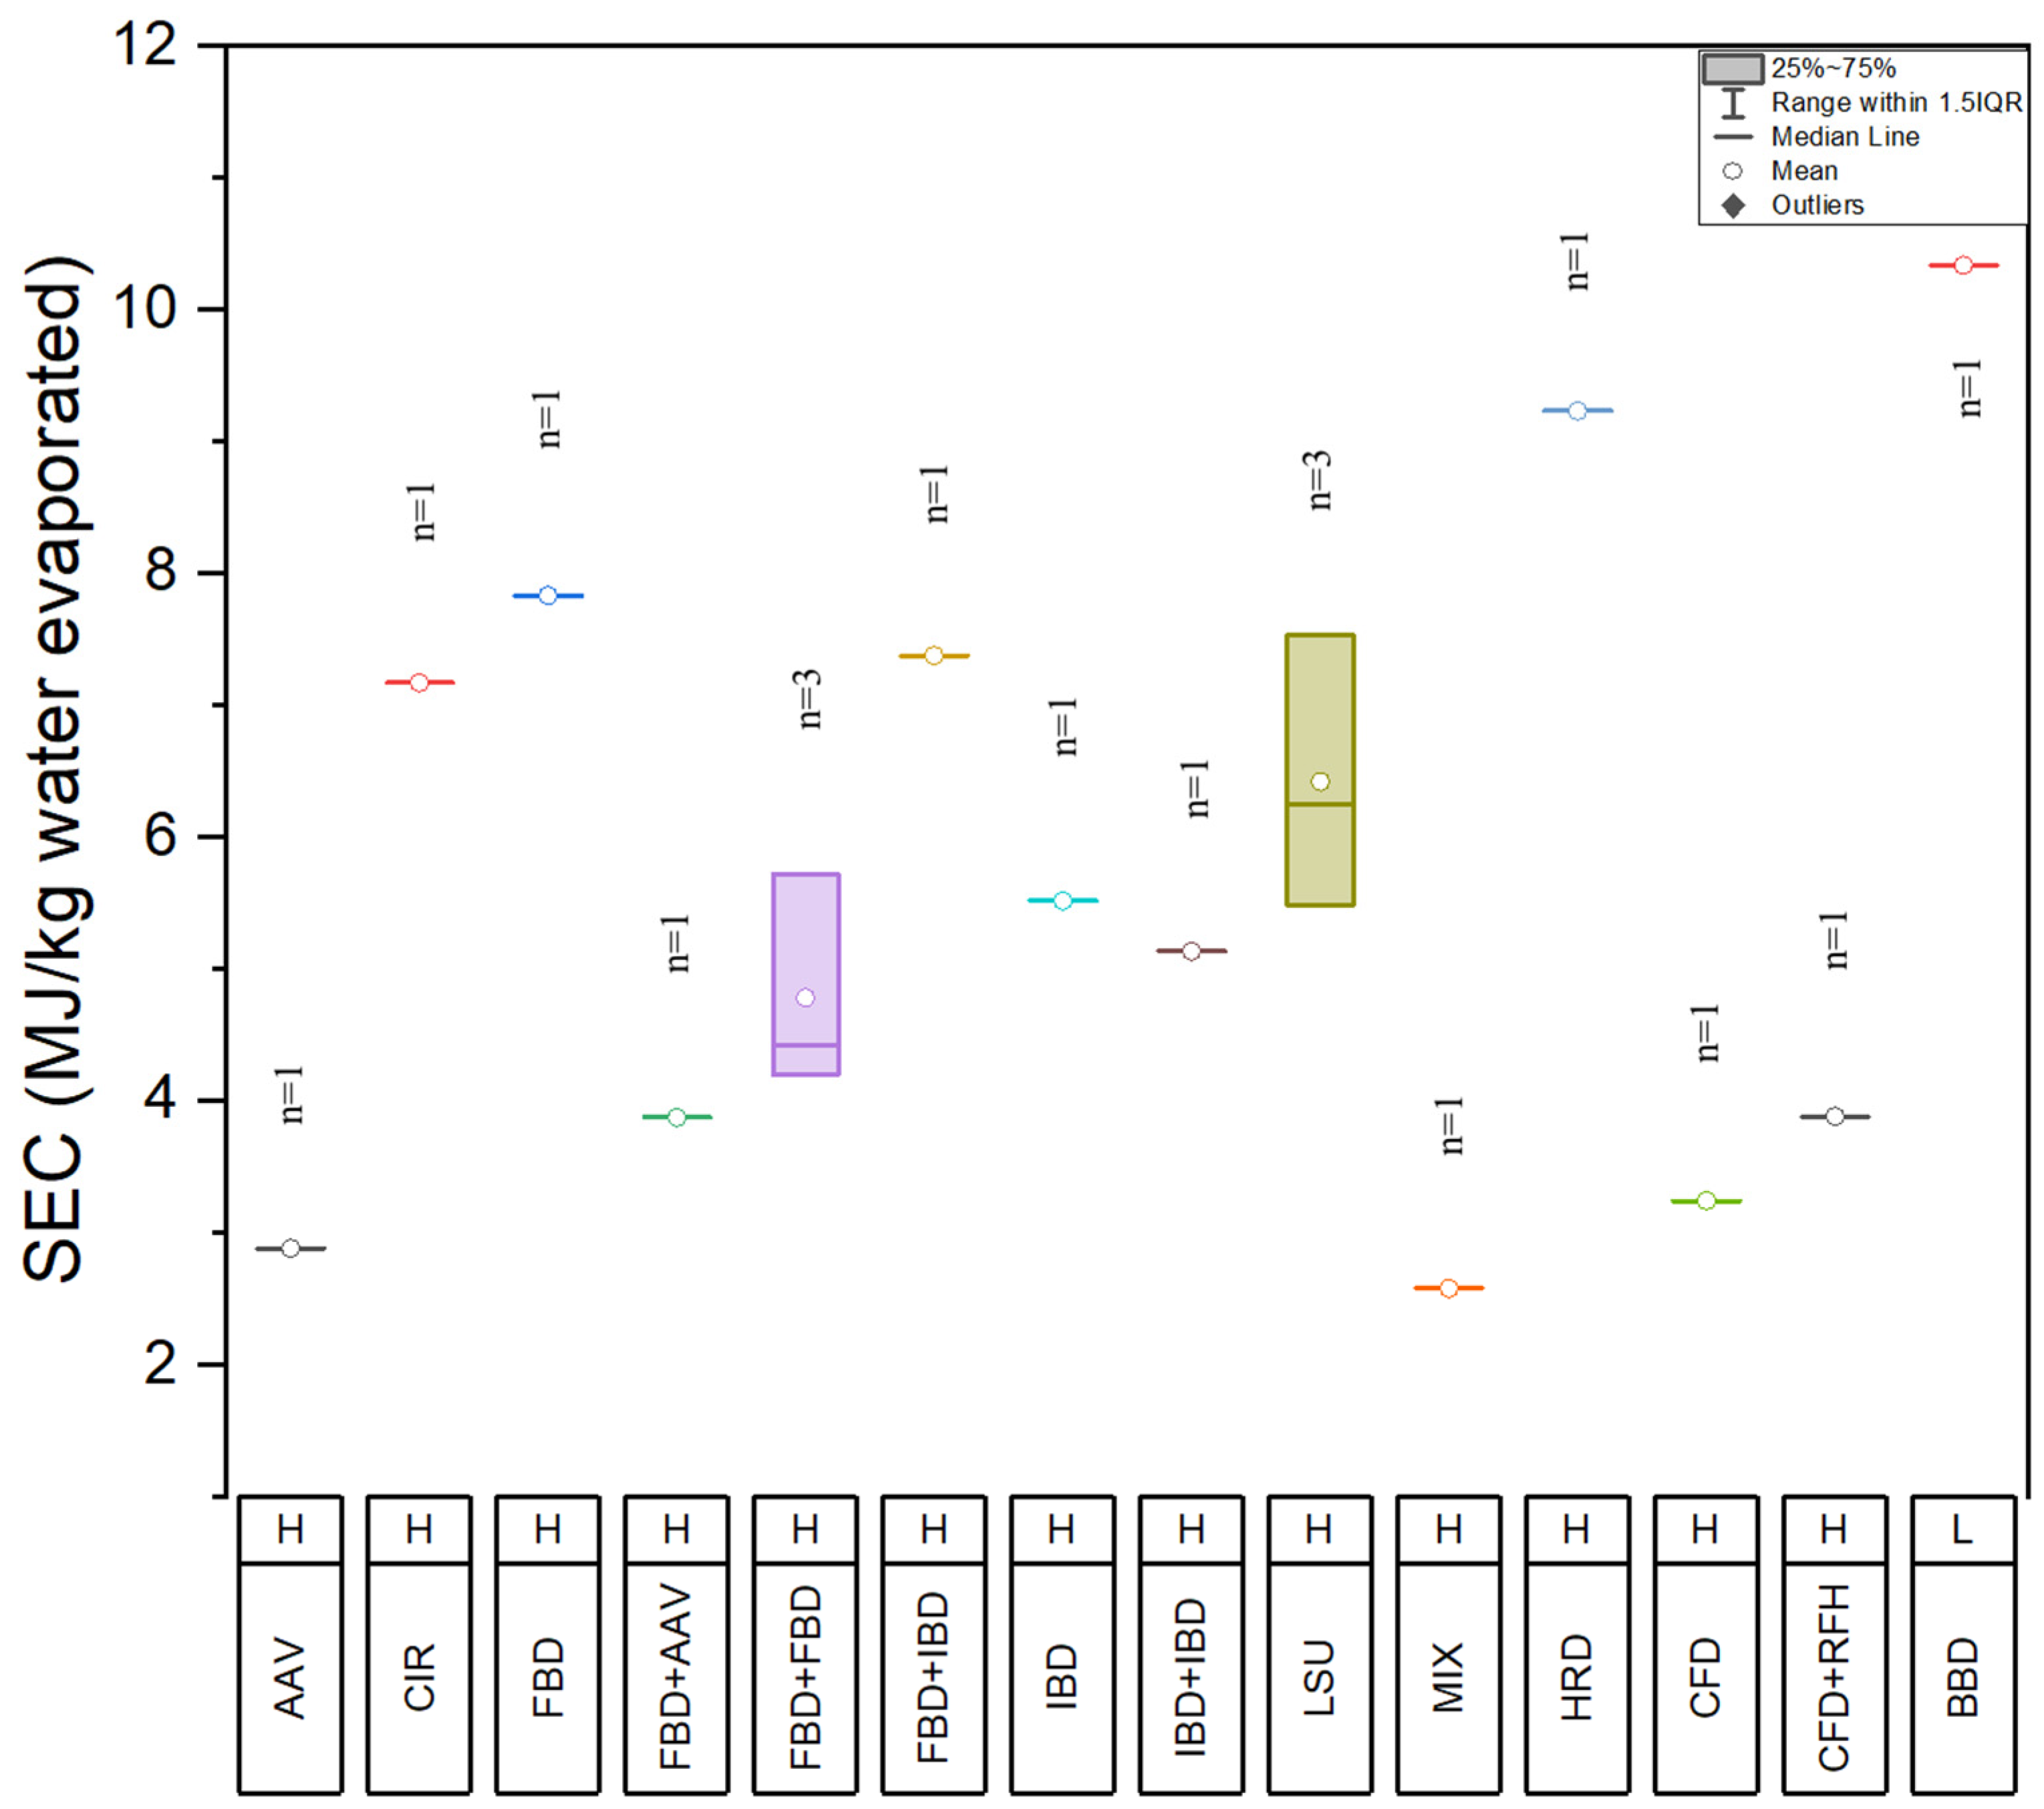
3.1. Industrialized Drying Technology

Figure 2 presents the SEC values for the industrial drying technologies specifically (same as in Figure 1) and highlights the differences between single-stage and multi-stage drying systems. The overall range across all industrial technologies extends from 2.58 MJ/kg to 14.71 MJ/kg of water evaporated. Among the four main drying technologies, FBD, LSU, IBD, and CIR, SEC values of 7.83 MJ/kg, 6.42 MJ/kg, 5.52 MJ/kg, and 7.71 MJ/kg, respectively, were observed. The FBD has the highest SEC but usually has the fastest drying speed, while the IBD has the slowest drying speed among these four methods. Other single-stage drying technologies, including the Horizontal Rotary Dryer (HRD) and AAV, have an SEC of 10.33 MJ/kg and 2.88 MJ/kg, respectively. The LSU Mixed Flow Dryer (MIX), as the newest drying technology, has the lowest energy intensity among all drying technologies (2.58 MJ/kg) but has not been widely adopted by the industry. For two-stage drying systems, a system with high-temperature IBD for first-stage drying and low-temperature IBD for second-stage drying has an SEC of 5.14 MJ/kg, which is 0.4 MJ/kg lower compared to the single-stage system in the same study. Similarly, for systems with the following first- and second-stage configurations FBD/AAV, FBD/FBD, and FBD/FBD, the SEC values were estimated to be 3.87 MJ/kg, 4.78 MJ/kg, and 7.38 MJ/kg, with all three technologies having a lower SEC compared to the single-stage FBD. However, it is observed that for the cross-flow dryer (CFD), the SEC for the single-stage system is slightly lower (3.24 MJ/kg) compared to adding a second stage of radio frequency heating (CFH) at 3.88 MJ/kg.

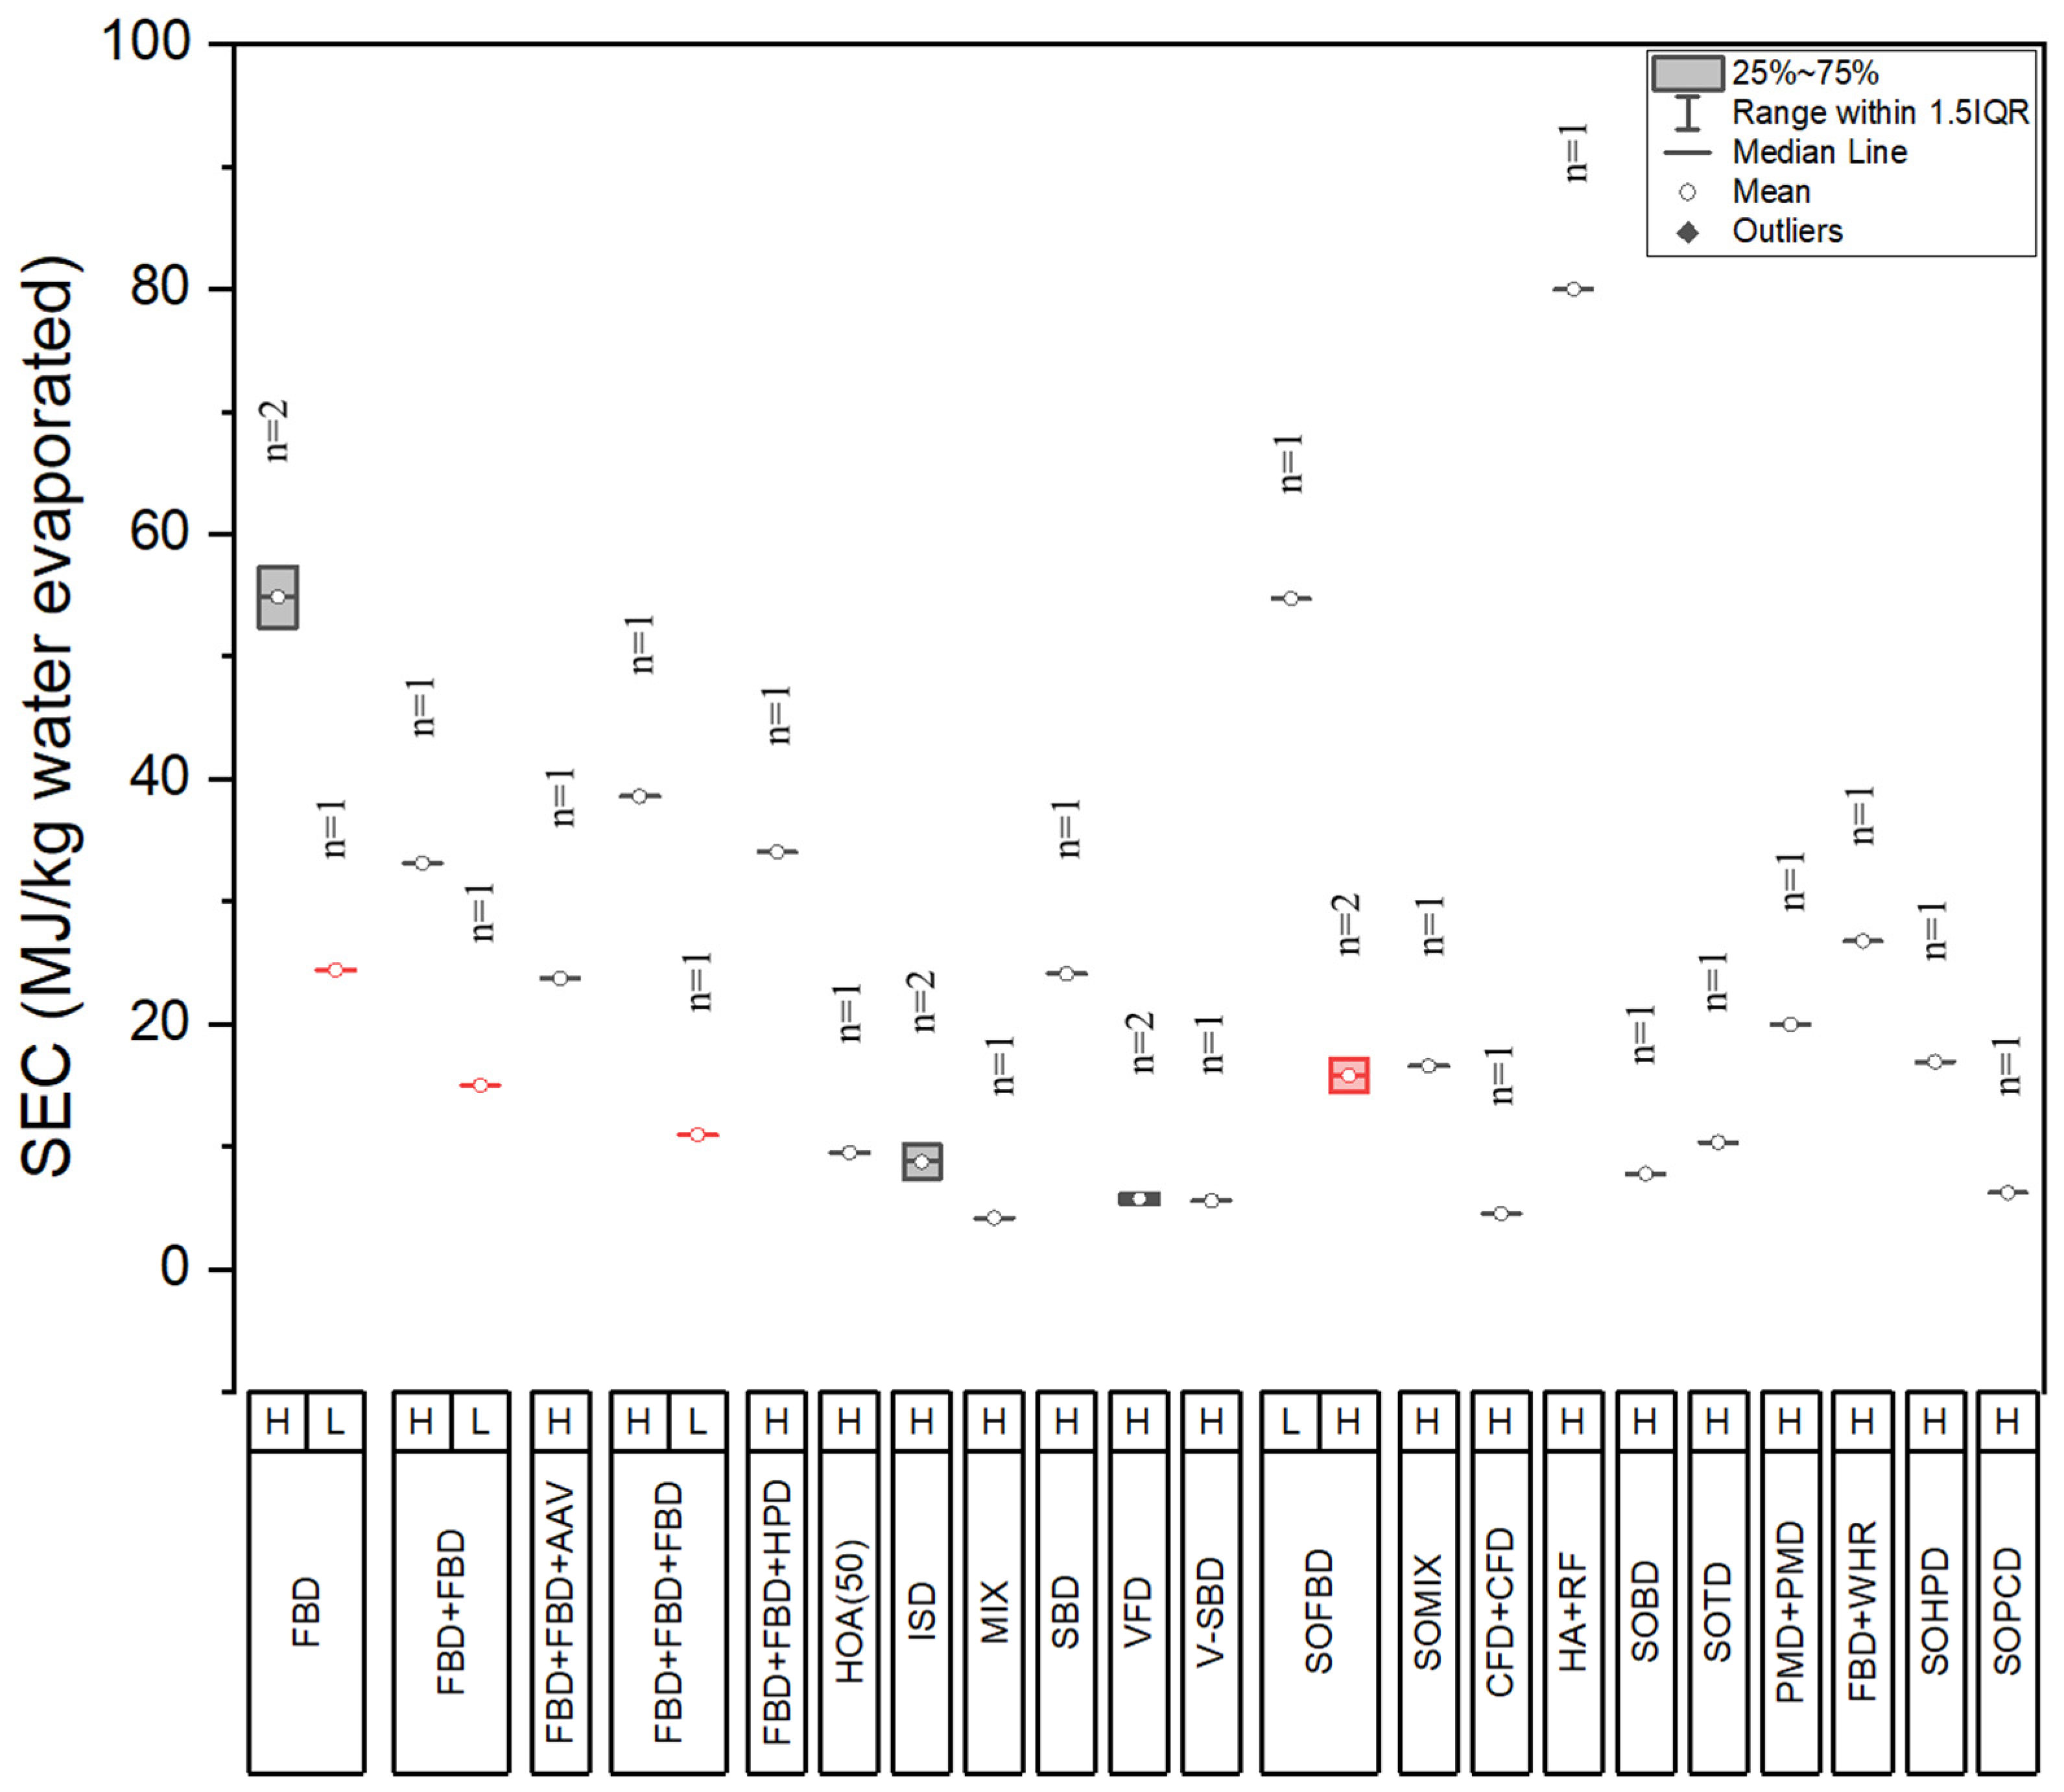
3.2. Laboratory and Simulation Drying Technology

In our analysis, a notable variation in specific energy consumption (SEC) was observed across different lab drying groups, as illustrated in Figure 3. The variation underscores the impact of humidity and the configuration of drying systems on energy efficiency. For the FBD, the average SEC was 44.69 MJ/kg. This variation correlated with humidity levels: 54.84 MJ/kg in regions with higher humidity compared to 24.39 MJ/kg in areas of lower humidity. When employing a two-stage FBD system (FBD + FBD), the SEC reduced to 24.04 MJ/kg, demonstrating improved efficiency, particularly in lower humidity regions (14.97 MJ/kg). The addition of heat recovery to FBD (FBD + WHR) resulted in an SEC of 26.75 MJ/kg, indicating comparability with the two-stage system. Advanced configurations like FBD + FBD + AAV and FBD + FBD + HPD (Hybrid Drying) further optimized the SEC to 23.71 MJ/kg and 38.56 MJ/kg, respectively. A three-stage FBD system showed an average SEC of 24.79 MJ/kg, with a notable decrease to 10.93 MJ/kg in lower humidity settings. This data suggests multi-stage systems, particularly those incorporating advanced technologies or configurations, tend to exhibit better energy efficiency than single-stage systems. The observed discrepancies highlight the influence of operational settings, regional climatic conditions, and technological advancements on drying efficiency.
Other technologies, such as the Impinging Stream Dryer (ISD), MIX, Spouted Bed Dryer (SBD), two-stage pneumatic dryer (PMD + PMD) and Hot Ambient Air at 50 °C (HOA50), reported SECs of 8.74 MJ/kg, 4.14 MJ/kg, 14.78 MJ/kg, 19.95 MJ/kg, and 9.49 MJ/kg, respectively. Emerging technologies like the Vibro-Fluidized Bed Dryer (V-FBD) and Vertical Spouted Bed Dryer (V-SBD) showed considerably lower energy intensities at 5.73 MJ/kg and 5.54 MJ/kg, challenging conventional norms. The Continuous Flow Dryer (CFD) exhibited minimal differences between single and multi-stage drying, with SECs of 4.99 MJ/kg and 4.51 MJ/kg, aligning with observations made in industrial settings. Notably, the combination of hot air with radio frequency heating and tempering (HA + RF) registered the highest SEC at 79.98 MJ/kg.
In examining solar-assisted drying technologies, the solar bubble dryer (SOBD) and solar tunnel dryer (SOTD) demonstrated SECs of 7.74 MJ/kg and 10.33 MJ/kg, respectively, indicating a slight efficiency advantage for the bubble design over the tunnel design. The solar-assisted fluidized bed dryer (SOFBD) exhibited a distinct variation in SEC between lower humidity (54.72 MJ/kg) and higher humidity regions (15.77 MJ/kg). Additionally, for the solar-assisted heat pump dryer (SOHPD), mix flow dryer (SOMIX), and parabolic collector type (SOPCD), the observed SECs were 16.88 MJ/kg, 16.54 MJ/kg, and 6.18 MJ/kg, respectively.
The simulation study for the deep bed dryer (DBD) and MIX technology reported energy intensities of 7.48 MJ/kg and 3.90 MJ/kg, respectively. These figures were derived under idealized environmental conditions through computer modeling, suggesting that actual energy consumption in real-world scenarios may be higher due to environmental variabilities and operational factors.

3.3. Difference between Laboratory and Industrial Dryer

Our analysis reveals a distinct difference between industrial and laboratory drying technologies in terms of SEC. For industrial drying technologies, the mean SEC is observed at 5.57 MJ/kg with a median of 5.48 MJ/kg, indicating a relatively tight distribution around this central value, as reflected by a standard deviation of 2.21 MJ/kg. This suggests a moderate variation in energy efficiency across different industrial technologies. Conversely, laboratory drying technologies (Group 2) exhibit a considerably higher mean SEC of 20.87 MJ/kg and a median of 14.97 MJ/kg, accompanied by a larger standard deviation of 18.76 MJ/kg. This greater variance underscores the experimental nature of laboratory setups and possibly a wider range of drying conditions and technologies under consideration.
The Mann–Whitney U test, yielding a W statistic of 88 and a p-value of 1.3 × 10⁻⁵, statistically confirms the significant difference (p < 0.05) in the SEC between the two groups. This result supports the hypothesis that the location shift between industrial and laboratory drying technologies is not equal to zero, indicating a substantial difference in energy consumption profiles. The statistical analysis underscores the efficiency of industrial drying technologies in minimizing energy consumption compared to their laboratory counterparts, potentially reflecting optimizations and scale effects that were not presented in experimental settings.

4. Discussion

This assessment required collecting and consolidating paddy drying SEC data from a variety of sources in the literature. We were able to compare the energy intensities of a range of paddy drying technologies by normalizing the data by transforming all energy data into SEC and clustering the results by regional humidity levels (high and low) and scale of operations (industrial, laboratory, and computer simulation). This comparison allows us to identify some clear trends and draw broader conclusions about these technology types.
The SEC difference between multi-stage drying systems and single-stage drying systems is observed in both industry and lab studies. Although the FBD, LSU, and SBD are all used for rapidly drying the paddy to 18% or less moisture content, all except one of the multi-stage drying systems used the FBD as the first-stage drying technology [9,46]. In our comparison of industrial multi-stage drying to single-stage drying, the data show a decrease in SEC ranging from 5–39%. However, for the laboratory results, multi-stage systems show a reduction in SEC of 29 to 55% compared to single-stage systems [12,44,47]). We observed that adding more stages to the drying process, such as transitioning from two-stage to three-stage drying, does not necessarily reduce the SEC. In fact, some studies indicate an increase in SEC with the addition of drying stages [44]. This increase is potentially attributed to the heat loss encountered between different drying stages, highlighting the importance of considering energy transfer efficiency in multi-stage drying systems. Thus, minimizing this kind of heat loss is crucial for multi-stage drying to maintain energy efficiency benefits.
Multi-stage drying technologies present an opportunity to decrease the SEC of drying operations while providing better control over drying temperatures. By reducing the duration of paddy exposure to high temperatures, this method has substantial benefits for processed rice quality and storage longevity. Employing a strategic approach, multi-stage drying techniques utilize varying drying temperatures to minimize rice kernels’ exposure to high temperatures, which in turn reduces grain quality deterioration and energy consumption. During the initial stages, higher drying temperatures rapidly remove moisture from the grain’s outer layers. As the drying process continues, the temperature is gradually lowered to avoid excessive moisture loss and ensure uniform drying throughout the kernel. This temperature-controlled method not only preserves optimal grain quality but also improves the overall efficiency of the drying process.
Incorporating tempering into multi-stage drying systems can reduce the SEC. During the tempering period, drying is temporarily paused, allowing the paddy to rest and facilitating moisture redistribution within the kernels. This intermittent drying process not only achieves uniform moisture content but also potentially reduces energy consumption by up to 30%. The tempering process minimizes the energy required to evaporate residual moisture during subsequent drying stages, thus contributing to energy savings. While transitioning from a single-stage to a multi-stage system may yield substantial energy savings, it is important to note the associated increase in costs, as at least two drying machines are needed. As a result, a thorough assessment of the economic feasibility of such an investment is crucial to ensure the optimal balance between energy efficiency and cost-effectiveness in paddy drying operations.
Overall, we observed a significantly higher drying SEC in the lab compared to industrial systems using the Mann–Whitney test. Although drying temperature/moisture is better controlled in the lab and may potentially lower the energy cost, the increased energy consumption is likely a result of smaller processing capacity, as discussed in the literature. Studies have found that increasing the processing capacity in the lab will lower the SEC by up to 55% and only lead to a 10% difference compared to the same drying technology in the industry [4,40]. Meanwhile, the computer simulation results show overall lower energy intensities compared to industry and lab. Given these distinctions, it was best to cluster these three groups of data for internal comparison between technology types.

5. Conclusions

This study provides a comprehensive review of global literature on the SEC of paddy drying technologies, drawing on peer-reviewed journals and governmental reports. To facilitate comparison, the data were standardized by study type (industry, laboratory, or computer simulation) and regional humidity level, despite some limitations in the consolidated dataset. Multi-stage drying systems were found to be more energy-efficient than single-stage systems, but face barriers to adoption due to higher equipment and storage costs. Among advanced drying technologies, the MIX, with its tempering function, has been found to have the lowest energy consumption, but it is also the most expensive. The FBD, with its low cost and higher energy consumption, remains a popular choice for both drying companies and farmers. Laboratory studies suggest that emerging technologies such as VFD and V-SBD could potentially reduce energy consumption by 30–50% compared to standard FBD and SBD technologies, although their cost and practicality must also be considered. Ratios of laboratory FBD/SBD to industrialized FBD/SBD can be used to estimate the energy consumption of these emerging technologies in the industry.
Our study encountered limitations regarding the collection of complete data on paddy drying. Moving forward, complete data should include, at a minimum, the relative humidity of the drying environment, the moisture content of the paddy at the beginning and the end of the drying process, and the drying temperature. This will enable better comparisons of different technologies and a more accurate estimation of their energy consumption. Our recommendation is to conduct further research employing a life cycle analysis to fully understand the energy consumption of the drying process. This analysis should consider not only the energy consumption of the drying equipment but also the resultant losses from drying damage or incomplete drying. Further, the implications of our research are not limited to paddy drying alone but extend to other grains, such as wheat and cereal rye, which exhibit similar drying patterns. By improving the quality and completeness of the data reported, we can gain a better understanding of the energy intensity of different drying technologies and their potential environmental impact.

Author Contributions

Conceptualization, T.Y. and E.S.S.; methodology, T.Y.; software, T.Y.; validation, T.Y. and E.S.S.; formal analysis, T.Y.; investigation, T.Y.; data curation, T.Y.; writing—original draft preparation, T.Y.; writing—review and editing, T.Y. and E.S.S.; visualization, T.Y.; supervision, E.S.S.; project administration, E.S.S.; funding acquisition, E.S.S. All authors have read and agreed to the published version of the manuscript.

Funding

This research was supported by the Foundation for Food and Agriculture Research (FFAR) through the project titled “A Novel Desiccant System Enable Energy-Efficient Drying to Reduce Post-harvest Loss of Agricultural Commodities and Foods”. Additional support was provided by the UC Davis Innovation Institute for Food Health (IIFH).

Data Availability Statement

The original contributions presented in the study are included in the article, further inquiries can be directed to the corresponding author.

Acknowledgments

The authors would like to thank Irwin Donis-Gonzalez and Chris Simmons for their invaluable support and guidance in the design and refinement of this experiment. Their expertise and insights have been instrumental in the successful execution of this study.

Conflicts of Interest

The authors declare no conflicts of interest. The funders had no role in the design of the study; in the collection, analyses, or interpretation of data; in the writing of the manuscript; or in the decision to publish the results.

Appendix A

Table A1. Paddy Drying Energy Intensity by Drying Technology, Type and Region.
Total StageTypeCountry/RegionSpecific Energy
Consumption (MJ/kg Water)
Reference
AAVIndThailand2.88[58]
CIRIndUnited States7.72[40]
FBDIndMalaysia7.83[46]
FBD + AAVIndThailand3.87[9]
FBD + FBDIndThailand4.42[9]
FBD + FBDIndThailand5.72[48]
FBD + FBDIndThailand4.20[59]
FBD + IBDIndMalaysia7.38[46]
HRDIndIran10.34[45]
IBDIndMalaysia5.52[46]
IBD + IBDIndMalaysia5.14[46]
LSUIndBangladesh6.25[53]
LSUIndMalaysia5.48[60]
LSUIndBangladesh7.53[52]
MIXIndUnited States2.58[61]
IBDIndMalaysia3.18[62]
CFDIndChina3.24[63]
CFD + RFHIndThailand3.88[64]
FBDLabIran24.39[12]
FBDLabAustralia57.33[49]
FBDLabThailand52.36[47]
FBD + FBDLabIran14.97[12]
FBD + FBDLabThailand33.11[44]
FBD + FBD + AAVLabThailand23.71[44]
FBD + FBD + FBDLabIran10.93[12]
FBD + FBD + FBDLabThailand38.57[44]
FBD + FBD + HPDLabThailand34.04[44]
HOA(50)LabThailand9.49[44]
ISDLabThailand10.13[41]
ISDLabThailand7.36[65]
MIXLabBangladesh 4.14[52]
SBDLabAustralia24.06[49]
VFDLabThailand5.29[62]
VFDLabThailand6.16[66]
V-SBDLabThailand5.54[42]
SOFBDLabIran54.72[21]
CFD + CFDlabChina4.51[26]
CFDLabThailand3.60[67]
CFDLabThailand6.39[68]
HA + RFLabChina79.98[36]
SOBDLabIndia7.74[22]
SOTDLabIndia10.33[22]
PMD + PMDLabThailand19.95[69]
FBD + WHRLabIndonesia26.75[23]
SOFBDLabIndonesia17.14[70]
SOFBDLabIndonesia14.40[71]
SOHPDLabIndonesia16.88[72]
SOMIXLabIndonesia16.54[73]
SOPCDLabIndia6.18[24]
DPBSimIran7.48[74]
MIXSimChina3.90[54]

References

  1. Madamba, P.S.; Yabes, R.P. Determination of the optimum intermittent drying conditions for rough rice (Oryza sativa L.). LWT—Food Sci. Technol. 2005, 38, 157–165. [Google Scholar] [CrossRef]
  2. Prakash, B.; Pan, Z. Modeling moisture movement in rice. In Advanced Topics in Mass Transfer, 1st ed.; EI-Amin, M., Ed.; IntechOpen: London, UK, 2011; pp. 283–304. [Google Scholar]
  3. Sarker, M.S.H.; Ibrahim, M.N.; Aziz, N.A.; Punan, M.S. Overall energy requisite and quality feature of industrial rice drying. Dry. Technol. 2015, 33, 1360–1368. [Google Scholar] [CrossRef]
  4. Dong, R.; Lu, Z.; Liu, Z.; Nishiyama, Y.; Cao, W. Moisture distribution in a rice kernel during tempering drying. J. Food Eng. 2009, 91, 126–132. [Google Scholar] [CrossRef]
  5. Akhtaruzzaman, M.; Mondal, M.H.T.; Sarker, M.S.H.; Biswas, M.; Shanta, S.A.; Sheikh, M.A.M. Evaluation of drying characteristics, energy consumption and quality of parboiled paddy: Two stage drying. J. Agric. Food Res. 2022, 8, 100284. [Google Scholar] [CrossRef]
  6. Mossman, A.P.; Miller, G.E. A review of basic concepts in rice-drying research. Crit. Rev. Food Sci. Nutr. 1986, 25, 49–71. [Google Scholar] [CrossRef] [PubMed]
  7. Hasatani, M.; Itaya, Y.; Miura, K. Hybrid drying of granular materials by combined radiative and convective heating. Dry. Technol. 1988, 6, 43–68. [Google Scholar] [CrossRef]
  8. Song, Z.; Yao, L.; Jing, C.; Zhao, X.; Wang, W.; Ma, C. Drying behavior of lignite under microwave heating. Dry. Technol. 2017, 35, 433–443. [Google Scholar] [CrossRef]
  9. Jittanit, W.; Srzednicki, G.; Driscoll, R. Corn, rice, and wheat seed drying by two-stage concept. Dry. Technol. 2010, 28, 807–815. [Google Scholar] [CrossRef]
  10. Sarker, M.S.H.; Ibrahim, M.N.; Aziz, N.A.; Salleh, P.M. Energy and rice quality aspects during drying of freshly harvested paddy with industrial inclined bed dryer. Energy Convers. Manag. 2014, 77, 389–395. [Google Scholar] [CrossRef]
  11. Xangsayasane, P.; Vongxayya, K.; Phongchanmisai, S.; Mitchell, J.; Fukai, S. Rice milling quality as affected by drying method and harvesting time during ripening in wet and dry seasons. Plant Prod. Sci. 2019, 22, 98–106. [Google Scholar] [CrossRef]
  12. Golmohammadi, M.; Assar, M.; Rajabi-Hamaneh, M.; Hashemi, S.J. Energy efficiency investigation of intermittent rice dryer: Modeling and experimental study. Food Bioprod. Process. 2015, 94, 275–283. [Google Scholar] [CrossRef]
  13. Poomsa-ad, N.; Soponronnarit, S.; Prachayawarakorn, S.; Terdyothin, A. Effect of tempering on subsequent drying of paddy using fluidisation technique. Dry. Technol. 2002, 20, 195–210. [Google Scholar] [CrossRef]
  14. Bootkote, P.; Soponronnarit, S.; Prachayawarakorn, S. Process of producing parboiled rice with different colors by fluidized bed drying technique including tempering. Food Bioprocess Technol. 2016, 9, 1574–1586. [Google Scholar] [CrossRef]
  15. Ben Mustapha, N.; Boumnijel, I.; Mihoubi, D. Tempering drying and energy consumption. J. Heat Transf. 2022, 144, 102103. [Google Scholar] [CrossRef]
  16. Golmohammadi, M.; Rajabi-Hamane, M.; Hashemi, S.J. Optimization of drying–tempering periods in a paddy rice dryer. Dry. Technol. 2012, 30, 106–113. [Google Scholar] [CrossRef]
  17. Abhiram, G.; Amarathunga, K.S.P. Effects of far-infrared radiation on the gelatinized rice starch granules. Dry. Technol. 2024, 42, 114–124. [Google Scholar] [CrossRef]
  18. Jafari, H.; Kalantari, D.; Azadbakht, M. Energy consumption and qualitative evaluation of a continuous band microwave dryer for rice paddy drying. Energy 2018, 142, 647–654. [Google Scholar] [CrossRef]
  19. EL-Mesery, H.S.; El-Khawaga, S.E. Drying process on biomass: Evaluation of the drying performance and energy analysis of different dryers. Case Stud. Therm. Eng. 2022, 33, 101953. [Google Scholar] [CrossRef]
  20. Tumpanuvatr, T.; Jittanit, W.; Surojanametakul, V. Effects of drying conditions in hybrid dryer on the GABA rice properties. J. Stored Prod. Res. 2018, 77, 177–188. [Google Scholar] [CrossRef]
  21. Mehran, S.; Nikian, M.; Ghazi, M.; Zareiforoush, H.; Bagheri, I. Experimental investigation and energy analysis of a solar-assisted fluidized-bed dryer including solar water heater and solar-powered infrared lamp for paddy grains drying. Sol. Energy 2019, 190, 167–184. [Google Scholar] [CrossRef]
  22. Jyoti, Y.K.; Dash, S.K.; Rayaguru, K.; Pal, U.S.; Mishra, N.; Ananth, P.N.; Khandai, S. Enhancement of thermal and techno-economic performance and prediction of drying kinetics of paddy dried in solar bubble dryer. Energy Nexus 2023, 11, 100224. [Google Scholar] [CrossRef]
  23. Yahya, M.; Rachman, A.; Hasibuan, R. Performance analysis of solar-biomass hybrid heat pump batch-type horizontal fluidized bed dryer using multi-stage heat exchanger for paddy drying. Energy 2022, 254, 124294. [Google Scholar] [CrossRef]
  24. Dina, S.F.; Jufrizal, S.M.; Sipahutar, E.H.; Limbong, H.P.; Misran, E. Performance of paddy dryer with screw conveyor assisted parabolic cylinder collector as thermal generator. Indian J. Sci. Technol. 2020, 13, 4446–4453. [Google Scholar] [CrossRef]
  25. Li, B.; Li, C.; Li, T.; Zeng, Z.; Ou, W.; Li, C. Exergetic, energetic, and quality performance evaluation of paddy drying in a novel industrial multi-field synergistic dryer. Energies 2019, 12, 4588. [Google Scholar] [CrossRef]
  26. Li, C.; Fang, Z.; Zhong, J.; Li, B.; Li, C. Evaluating the dynamic characteristics and energetic performance of a paddy multistage counter-flow dryer. Biosyst. Eng. 2022, 221, 208–223. [Google Scholar] [CrossRef]
  27. Islam, M.A.; Mondal, M.H.T.; Akhtaruzzaman, M.; Sheikh, M.A.M.; Islam, M.M.; Haque, M.A.; Sarker, M.S.H. Energy, exergy, and milling performance of parboiled paddy: An industrial LSU dryer. Dry. Technol. 2022, 40, 2058–2072. [Google Scholar] [CrossRef]
  28. Madhiyanon, T.; Soponronnarit, S.; Tia, W. A mathematical model for continuous drying of grains in a spouted bed dryer. Dry. Technol. 2002, 20, 587–614. [Google Scholar] [CrossRef]
  29. Zhonghua, W.; Mujumdar, A.S. Simulation of the hydrodynamics and drying in a spouted bed dryer. Dry. Technol. 2007, 25, 59–74. [Google Scholar] [CrossRef]
  30. Djaeni, M.; Aishah, N.; Kiono, B.F.T.; van Boxtel, A.J.B. A novel energy efficient adsorption drying with zeolite for food quality product: A case study in paddy and corn drying. In Proceedings of the International Symposium of Advancing Engineering, Busan, Republic of Korea, 13 November 2013. [Google Scholar]
  31. Soontarapa, K.; Arnusan, J. Dehydration of paddy rice in a chitosan membrane drier. Sep. Purif. Technol. 2019, 209, 401–408. [Google Scholar] [CrossRef]
  32. VijayaVenkataRaman, S.; Iniyan, S.; Goic, R. A review of solar drying technologies. Renew. Sustain. Energy Rev. 2012, 16, 2652–2670. [Google Scholar] [CrossRef]
  33. Thakur, A.K.; Gupta, A.K. Two stage drying of high moisture paddy with intervening rest period. Energy Convers. Manag. 2016, 47, 3069–3083. [Google Scholar] [CrossRef]
  34. Xu, X.; Zhao, T.; Ma, J.; Song, Q.; Wei, Q.; Sun, W. Application of two-stage variable temperature drying in hot air-drying of paddy rice. Foods 2022, 11, 888. [Google Scholar] [CrossRef]
  35. Islam, M.; Nasrin, T.; Islam, M.; Sarker, S.H. Investigation on appropriate two-stage drying techniques for quality paddy seeds. J. Food Process Eng. 2021, 44, e13690. [Google Scholar] [CrossRef]
  36. Mahmood, N.; Liu, Y.; Munir, Z.; Zhang, Y.; Niazi, B.M.K. Effects of hot air assisted radio frequency drying on heating uniformity, drying characteristics and quality of paddy. LWT 2022, 158, 113131. [Google Scholar] [CrossRef]
  37. Chungcharoen, T.; Prachayawarakorn, S.; Tungtrakul, P.; Soponronnarit, S. Effects of germination time and drying temperature on drying characteristics and quality of germinated paddy. Food Bioprod. Process. 2015, 94, 707–716. [Google Scholar] [CrossRef]
  38. Beigi, M.; Torki, M.; Khoshnam, F.; Tohidi, M. Thermodynamic and environmental analyses for paddy drying in a semi-industrial dryer. J. Therm. Anal. Calorim. 2021, 146, 393–401. [Google Scholar] [CrossRef]
  39. Amantéa, R.P.; Fortes, M.; Ferreira, W.R.; Santos, G.T. Energy and exergy efficiencies as design criteria for grain dryers. Dry. Technol. 2018, 36, 491–507. [Google Scholar] [CrossRef]
  40. Amaratunga, K.S.P.; Pan, Z.; Zheng, X.; Thompson, J.F. Comparison of drying characteristics and quality of rough rice dried with infrared and heated air. In Proceedings of the 2005 ASAE Annual Meeting, Tampa, FL, USA, 17 July 2005. [Google Scholar]
  41. Kumklam, P.; Prachayawarakorn, S.; Devahastin, S.; Soponronnarit, S. Effects of operating parameters of impinging stream dryer on parboiled rice quality and energy consumption. Dry. Technol. 2020, 38, 634–645. [Google Scholar] [CrossRef]
  42. Madhiyanon, T.; Soponronnarit, S. High temperature spouted bed paddy drying with varied downcomer air flows and moisture contents: Effects on drying kinetics, critical moisture content, and milling quality. Dry. Technol. 2005, 23, 473–495. [Google Scholar] [CrossRef]
  43. Morey, R.V.; Cloud, H.A.; Lueschen, W.E. Practices for the efficient utilization of energy for drying corn. Trans. ASAE 1976, 19, 151–155. [Google Scholar] [CrossRef]
  44. Tumpanuvatr, T.; Jittanit, W.; Surojanametakul, V. Study of hybrid dryer prototype and its application in pregerminated rough rice drying. Dry. Technol. 2018, 36, 205–220. [Google Scholar] [CrossRef]
  45. Firouzi, S.; Alizadeh, M.R.; Haghtalab, D. Energy consumption and rice milling quality upon drying rice with a newly-designed horizontal rotary dryer. Energy 2017, 119, 629–636. [Google Scholar] [CrossRef]
  46. Sarker, M.S.H.; Ibrahim, M.N.; Aziz, N.A.; Punan, M.S. Drying kinetics, energy consumption, and quality of rice (MAR-219) during drying by the industrial inclined bed dryer with or without the fluidized bed dryer. Dry. Technol. 2013, 31, 286–294. [Google Scholar] [CrossRef]
  47. Khanali, M.; Banisharif, A.; Rafiee, S. Modeling of moisture diffusivity, activation energy and energy consumption in fluidized bed drying of rough rice. Heat Mass Transf. 2016, 52, 2541–2549. [Google Scholar] [CrossRef]
  48. Prachayawarakorn, S.; Poomsa-ad, N.; Soponronnarit, S. Quality maintenance and economy with high-temperature paddy-drying processes. J. Stored Prod. Res. 2005, 41, 333–351. [Google Scholar] [CrossRef]
  49. Jittanit, W.; Srzednicki, G.; Driscoll, R.H. Comparison between fluidized bed and spouted bed drying for seeds. Dry. Technol. 2013, 31, 52–56. [Google Scholar] [CrossRef]
  50. Abhiram, G.; Diraj, R.; Eeswaran, R. Optimization of Black Tea Drying Temperature in an Endless Chain Pressure (ECP) Dryer. AgriEngineering 2023, 5, 1989–1999. [Google Scholar] [CrossRef]
  51. Tirawanichakul, S.; Prachayawarakorn, S.; Varanyanond, W.; Tungtrakul, P.; Soponronnarit, S. Effect of fluidized bed drying temperature on various quality attributes of rice. Dry. Technol. 2004, 22, 1731–1754. [Google Scholar] [CrossRef]
  52. Mondal, M.H.T.; Shiplu, K.S.P.; Sen, K.P.; Roy, J.; Sarker, M.S.H. Performance evaluation of small-scale energy efficient mixed flow dryer for drying of high moisture rice. Dry. Technol. 2019, 37, 1541–1550. [Google Scholar] [CrossRef]
  53. Ahiduzzaman, M.; Sadrul Islam, A. Energy utilization and environmental aspects of rice processing industries in Bangladesh. Energies 2009, 2, 134–149. [Google Scholar] [CrossRef]
  54. Cao, C.W.; Yang, D.Y.; Liu, Q. Research on modeling and simulation of mixed flow grain dryer. Dry. Technol. 2007, 25, 681–687. [Google Scholar] [CrossRef]
  55. Billiris, M.A.; Siebenmorgen, T.J. Energy use and efficiency of rice-drying systems II. Commercial, cross-flow dryer measurements. Appl. Eng. Agric. 2014, 30, 217–226. [Google Scholar]
  56. Mann, H.B.; Whitney, D.R. On a test of whether one of two random variables is stochastically larger than the other. Ann. Math. Stat. 1947, 18, 50–60. [Google Scholar] [CrossRef]
  57. R Core Team. R: A Language and Environment for Statistical Computing; R Foundation for Statistical Computing: Vienna, Austria, 2024; Available online: https://www.R-project.org/ (accessed on 17 February 2021).
  58. Soponronnarit, S.; Chinsakoltanakorn, S. Energy consumption patterns in drying paddy by various drying strategies. In Proceedings of a Regional Seminar on Alternative Energy Applications in Agriculture; Chiang Mai University: Chiang Mai, Thailand, 1986; Volume 14. [Google Scholar]
  59. Sopanronnarit, S.; Rordprapat, W.; Wetchacama, S. Mobile fluidized bed paddy dryer. Dry. Technol. 1998, 16, 1501–1513. [Google Scholar] [CrossRef]
  60. Azmi, M.Z.; Rukunudin, I.H.; Ismail, H.A.; Aznan, A.A. Specific Energy Consumption and Drying Efficiency Analysis of Commercial Mixed-Flow Batch Type Seed Drying System. J. Adv. Res. Fluid Mech. Therm. Sci. 2019, 55, 39–50. [Google Scholar]
  61. Jennifer, L.B.; Johnson, A. Energy Efficiency Study on Two Wisconsin Grain Drying Systems: Mixed Flow and Continuous Cross Flow Grain Dryers. In Proceedings of the American Society of Agricultural and Biological Engineers 2010, Pittsburgh, PA, USA, 23 June 2020. [Google Scholar]
  62. Wetchacama, S.; Soponronnarit, S.; Jariyatontivait, W. Development of a commercial scale vibro-fluidized bed paddy dryer. Agric. Nat. Resour. 2000, 34, 423–430. [Google Scholar]
  63. Li, T.; Li, C.; Li, B.; Li, C.; Fang, Z.; Zeng, Z.; Ou, W.; Huang, J. Characteristic analysis of heat loss in multistage counter-flow paddy drying process. Energy Rep. 2020, 6, 2153–2166. [Google Scholar] [CrossRef]
  64. Chitsuthipakorn, K.; Thanapornpoonpong, S.N. Effect of large-scale paddy rice drying process using hot air combined with radio frequency heating on milling and cooking qualities of milled rice. Foods 2022, 11, 519. [Google Scholar] [CrossRef] [PubMed]
  65. Nimmol, C.; Devahastin, S. Evaluation of performance and energy consumption of an impinging stream dryer for paddy. Appl. Therm. Eng. 2010, 30, 2204–2212. [Google Scholar] [CrossRef]
  66. Soponronnarit, S.; Wetchacama, S.; Trutassanawin, S.; Jariyatontivait, W. Design, testing, and optimization of vibro-fluidized bed paddy dryer. Dry. Technol. 2001, 19, 1891–1908. [Google Scholar] [CrossRef]
  67. Hemhirun, S.; Bunyawanichakul, P. Effect of the initial moisture content of the paddy drying operation for the small community. J. Agric. Eng. 2020, 51, 176–183. [Google Scholar] [CrossRef]
  68. Hemhirun, S.; Bunyawanichakul, P. Cross-flow paddy dryer application using infrared gas burner. Int. J. Adv. Res. Eng. Technol. 2020, 11, 204–214. [Google Scholar]
  69. Nimmol, C.; Yodrux, A.; Hirunwat, A. Rapid drying of high-moisture paddy using a pneumatic dryer with corrugated-surface drying column. In Proceedings of the E3S Web of Conferences, Virtual, 23–24 November 2020; Volume 141, p. 01006. [Google Scholar]
  70. Yahya, M.; Fahmi, H.; Fudholi, A.; Sopian, K. Performance and economic analyses on solar-assisted heat pump fluidised bed dryer integrated with biomass furnace for rice drying. Solar Energy 2018, 174, 1058–1067. [Google Scholar] [CrossRef]
  71. Yahya, M.; Fudholi, A.; Sopian, K. Energy and exergy analyses of solar-assisted fluidized bed drying integrated with biomass furnace. Renew. Energy 2017, 105, 22–29. [Google Scholar] [CrossRef]
  72. Yahya, M.; Fahmi, H.; Hasibuan, R.; Fudholi, A. Development of hybrid solar-assisted heat pump dryer for drying paddy. Case Stud. Therm. Eng. 2023, 45, 102936. [Google Scholar] [CrossRef]
  73. Yahya, M.; Fahmi, H.; Hasibuan, R. Experimental Performance Analysis of a Pilot-Scale Biomass-Assisted Recirculating Mixed-Flow Dryer for Drying Paddy. Int. J. Food Sci. 2022, 2022, 4373292. [Google Scholar] [CrossRef]
  74. Zare, D.; Chen, G. Evaluation of a simulation model in predicting the drying parameters for deep-bed paddy drying. Comput. Electron. Agric. 2009, 68, 78–87. [Google Scholar] [CrossRef]
Figure 1. SEC of rice drying technologies by technology, scale, and regional humidity, where ‘H’ denotes high-humidity regions, ‘L’ represents low-humidity regions.
Processes 12 00532 g001
Figure 2. SEC of industrialized drying technologies across different humidity levels, where ‘H’ denotes high-humidity regions, ‘L’ represents low-humidity regions, and ‘n’ represents the number of sample points.
Processes 12 00532 g002
Figure 3. SEC of laboratory drying technologies across different humidity levels, where ‘H’ denotes high-humidity regions, ‘L’ represents low-humidity regions, and ‘n’ represents the number of sample points.
Processes 12 00532 g003
Table 1. Comparison of Key Characteristics of Various Drying Technologies for Paddy.
Drying TechnologyKey Characteristics
Sun DryingSimple and low-cost method; highly dependent on weather conditions (outside of research scope)
Infrared DryerEnergy-efficient; short drying time; can lead to uneven drying
Microwave DryerRapid and uniform drying; high initial investment cost
Vacuum DryerLow-temperature drying; preserves color and flavor; requires a high initial investment cost
Hybrid DryerCombines multiple drying technologies for improved efficiency and flexibility
Impinging Stream DryerRapid and uniform drying; suited for heat-sensitive materials
Fluidized Bed DryerEfficient heat transfer and drying; produce uniform product quality
Spouted Bed DryerHigh heat and mass transfer rates; low investment and operating costs
Louisiana State DryerMulti-stage dryer with tempering function for energy-efficient drying
Vibro-Fluidized Bed DryerProduces uniform product quality; flexible operating parameters
Vertical Spouted Bed DryerHigh drying rate and uniformity; requires low investment and operating costs
Deep Bed DryerSuited for heat-sensitive and high-moisture products; low operating costs
Mix-Flow DryerEnergy-efficient drying with low-temperature drying air; produces uniform product quality
Ambient Air Vacuum DryerUses natural airflow and operates in batches.
Solar-Assisted DryerLow operational costs; environmentally sustainable; weather-dependent efficiency.
Cross (Counter)-Flow DryerOptimized moisture removal; energy-efficient; uniform product quality.
Pneumatic DryerRapid drying; high versatility; efficient heat distribution.
Disclaimer/Publisher’s Note: The statements, opinions and data contained in all publications are solely those of the individual author(s) and contributor(s) and not of MDPI and/or the editor(s). MDPI and/or the editor(s) disclaim responsibility for any injury to people or property resulting from any ideas, methods, instructions or products referred to in the content.

