Article

A New Multi-Objective Optimization Strategy for Improved C3MR Liquefaction Process

1
School of Control and Mechanical Engineering, Tianjin Chengjian University, Tianjin 300380, China
2
School of Energy and Safety Engineering, Tianjin Chengjian University, Tianjin 300380, China
*
Author to whom correspondence should be addressed.
Processes 2024, 12(3), 542; https://doi.org/10.3390/pr12030542
Submission received: 22 January 2024 / Revised: 27 February 2024 / Accepted: 4 March 2024 / Published: 10 March 2024
(This article belongs to the Section Chemical Processes and Systems)

Abstract

:
In the traditional C3MR process (T-C3MR), the boiling gas (BOG) output from the last stage of the gas–liquid separator is directly discharged, in which the excellent low-temperature capability is not utilized, and the system efficiency is decreased. In liquefied natural gas (LNG), single-objective optimization methods are commonly used to optimize system parameters, which may result in incomplete system analysis. To solve the above problems, this paper proposes a multi-objective optimization strategy for the improved C3MR process(I-C3MR) based on a new multi-objective optimization algorithm called EHR-GWO-GA. Firstly, the main work proposes an I-C3MR structure. Secondly, an optimization strategy of the I-C3MR with the maximization of liquefaction amount, minimization of unit energy consumption and minimization of exergy loss as objective functions are proposed. Based on the optimization results, the influence of decision variables on liquefaction amount, unit energy consumption and exergy loss are analyzed, and the results show that the decision variables have good adaptability. Finally, a detailed exergy analysis of the equipment used is made, and the results show that the main exergy losses come from the water coolers and compressors, accounting for 32% and 34%, respectively. Compared to the T-C3MR, the improved C3MR based on EHR-GWO-GA(E-C3MR) has an approximate 8% increase in liquefaction amount—a roughly 23% decrease in unit energy consumption and a decrease of nearly 24% in exergy loss.

1. Introduction

As a clean energy source, natural gas (NG) has received widespread attention, and its consumption has rapidly increased [1]. There are several modes of transporting NG to the market from gas fields in remote areas, including liquefied natural gas (LNG), compressed natural gas (CNG), and natural gas hydrate (NGH) [2].
The liquefaction process of NG has entered the commercialization stage as a fairly promising delivery method [3]. In terms of commercialization, there are three main types of NG liquefaction processes, including single-mixed refrigerant (SMR), double-mixed refrigerant (DMR), and propane pre-cooled mixed refrigerant (C3MR) [4]. The SMR process is simple, requires less equipment, and has a relatively high energy consumption of about 1200 kJ/kg-LNG [5]. The DMR process consists of double refrigerant cycles and is more energy efficient than the SMR process, about 1100 kJ/kg-LNG [6]. The C3MR process is a new liquefaction process developed by APCI based on the mixed refrigerant liquefaction cycle. Although the C3MR process is complex and requires a good deal of equipment, its energy consumption is the lowest at about 1000 kJ/kg-LNG [7]. Due to its energy-saving characteristics, the C3MR process occupies the largest market share in the liquefaction of NG, with a market share of about 60% in 2017 [8].
He et al. [9] conducted a comparative investigation of three liquefaction processes, SMR, DMR, and C3MR, to determine their potential for energy saving and production increase during the winter based on the optimal conditions under different ambient temperatures obtained by the genetic algorithm (GA). However, the optimization method also uses a single-objective approach, and the exergy analysis has yet to be demonstrated. Park et al. [10] proposed a process for applying liquid air to the C3MR by introducing liquid air as a recovery medium to recover the cold energy released from the LNG, a GA was used for optimization, and a detailed analysis was performed. However, the optimization method also uses a single objective method. Hajji et al. [11] investigated the thermodynamic aspects of C3MR by changing variables to improve the overall performance and heat recovery of the LNG process. Simulations and sensitivity analyses were carried out for two objectives in which the unit energy consumption, compressor power consumption, and energy consumption in the liquefaction process were reduced by varying the process parameters. However, a detailed exergy analysis of the process still needs to be done.
Over the past decade, there has been an exciting surge in LNG process optimization research, primarily driven by economic reasons and encouraged by the growing capabilities of computing tools. Ghorbani et al. [12] studied the DMR process, and the structure of the DMR was designed. Rao et al. [13] proposed an operation optimization program for the multi-stream heat exchangers (MHEXs) process and demonstrated their method on the C3MR process. Wang et al. [14] optimized the C3MR process and proposed a propane and iso-butane pre-cooled mixed refrigerant liquefaction process (C3&C4-MR). The improved liquefaction process can significantly reduce the system’s energy consumption and greatly improve the exergy efficiency. Primabudi et al. [15] proposed a multi-objective optimization method to optimize the C3MR process, and the dual objective function maximizes the exergy efficiency and minimizes the total cost of the product. During the exergy analysis of the above article, the equipment considered includes compressors, heat exchangers, valves, and water coolers. Sabbagh et al. [16] used Aspen Plus to establish a new NGL/LNG integration scheme based on the C3MR refrigeration system. Ali et al. [17] studied the surrogate-assisted modeling and optimization of the SMR, and an approximate surrogate model was established using the radial basis function combined with the thin plate spline method to solve the computational load problem and obtain the results in a complex and reasonable amount of time. Sabbagh et al. [18] introduced a new NGL/LNG scheme based on an established industrial NGL plant and performed single, double, and triple-objective optimizations. Geng et al. [19] proposed a new integrated liquefaction process using an improved dual-mixed refrigerant pre-cooling method.
In this paper, the unit energy consumption is used as the objective, and the particle swarm optimization algorithm is used to optimize the system mentioned in this paper. However, this paper continues to use the single-objective optimization method. Jin et al. [20] proposed a novel liquefaction process that integrates propane-free mixed refrigerant and nitrogen expander cycles (MR-N2) and the unit energy consumption as the objective using GA to find the optimal decision variables. Li et al. [21] studied an improved refrigeration system and optimized it using GA with specific energy consumption as the objective, followed by exergy and energy analyses. Awad et al. [22] investigated the optimization of an LNG process based on GA and compared it with a knowledge-based search algorithm based on the same process and objective function implementation. The results of this paper demonstrated that the GA outperforms the knowledge-based search algorithm proposed in earlier studies. Ting He et al. [23] proposed a series of novel natural gas liquefaction systems integrated with waste heat utilization of gas turbine exhaust to reduce the energy consumption of the liquefaction plants. Jinwoo Park et al. [24] proposed the use of liquid air as a medium for recycling cold energy; this significantly enhanced the LNG supply chain by not only improving its energy performance but also contributing to the utilization of cold energy by using the empty LNG ship on the return journey. However, in the traditional optimization of the natural gas liquefaction process, single-objective optimization is usually adopted, which will lead to the system performance being too tilted in the direction of the objective function, resulting in the reduction of the remaining performance indicators of the system. The significance of multi-objective analysis is to optimize the system as a whole to achieve a more comprehensive optimal operation mode. Furthermore, as a sophisticated algorithm that emulates natural selection and genetic mechanisms in nature, the GA is well suited for solving nonlinear models. However, slow convergence and a tendency to get stuck in local optima are common problems in traditional GA.
Grey wolf optimization (GWO) is a meta-heuristic algorithm based on the social structure and hunting behavior of wolves to solve optimization problems [25]. This method is widely used to solve various engineering problems. For example, a group of researchers applied GWO to civil engineering problems involving the design of water supply networks. The goal is to minimize financial costs and reduce the number of network components, including pipe sizes, pump ratings, and other elements. This method meets established performance and cost expectations [26]. On the other hand, Majeed and Rao built a GWO-based model to automate the design process of analog circuits. Through this application, they effectively demonstrated the utility of GWO and produced enhanced circuit design in the shortest possible time [27]. In general, the GWO could be used to improve the results of different clustering methods and be applied to different fields, such as medicine, engineering, and astronomy [28,29,30].
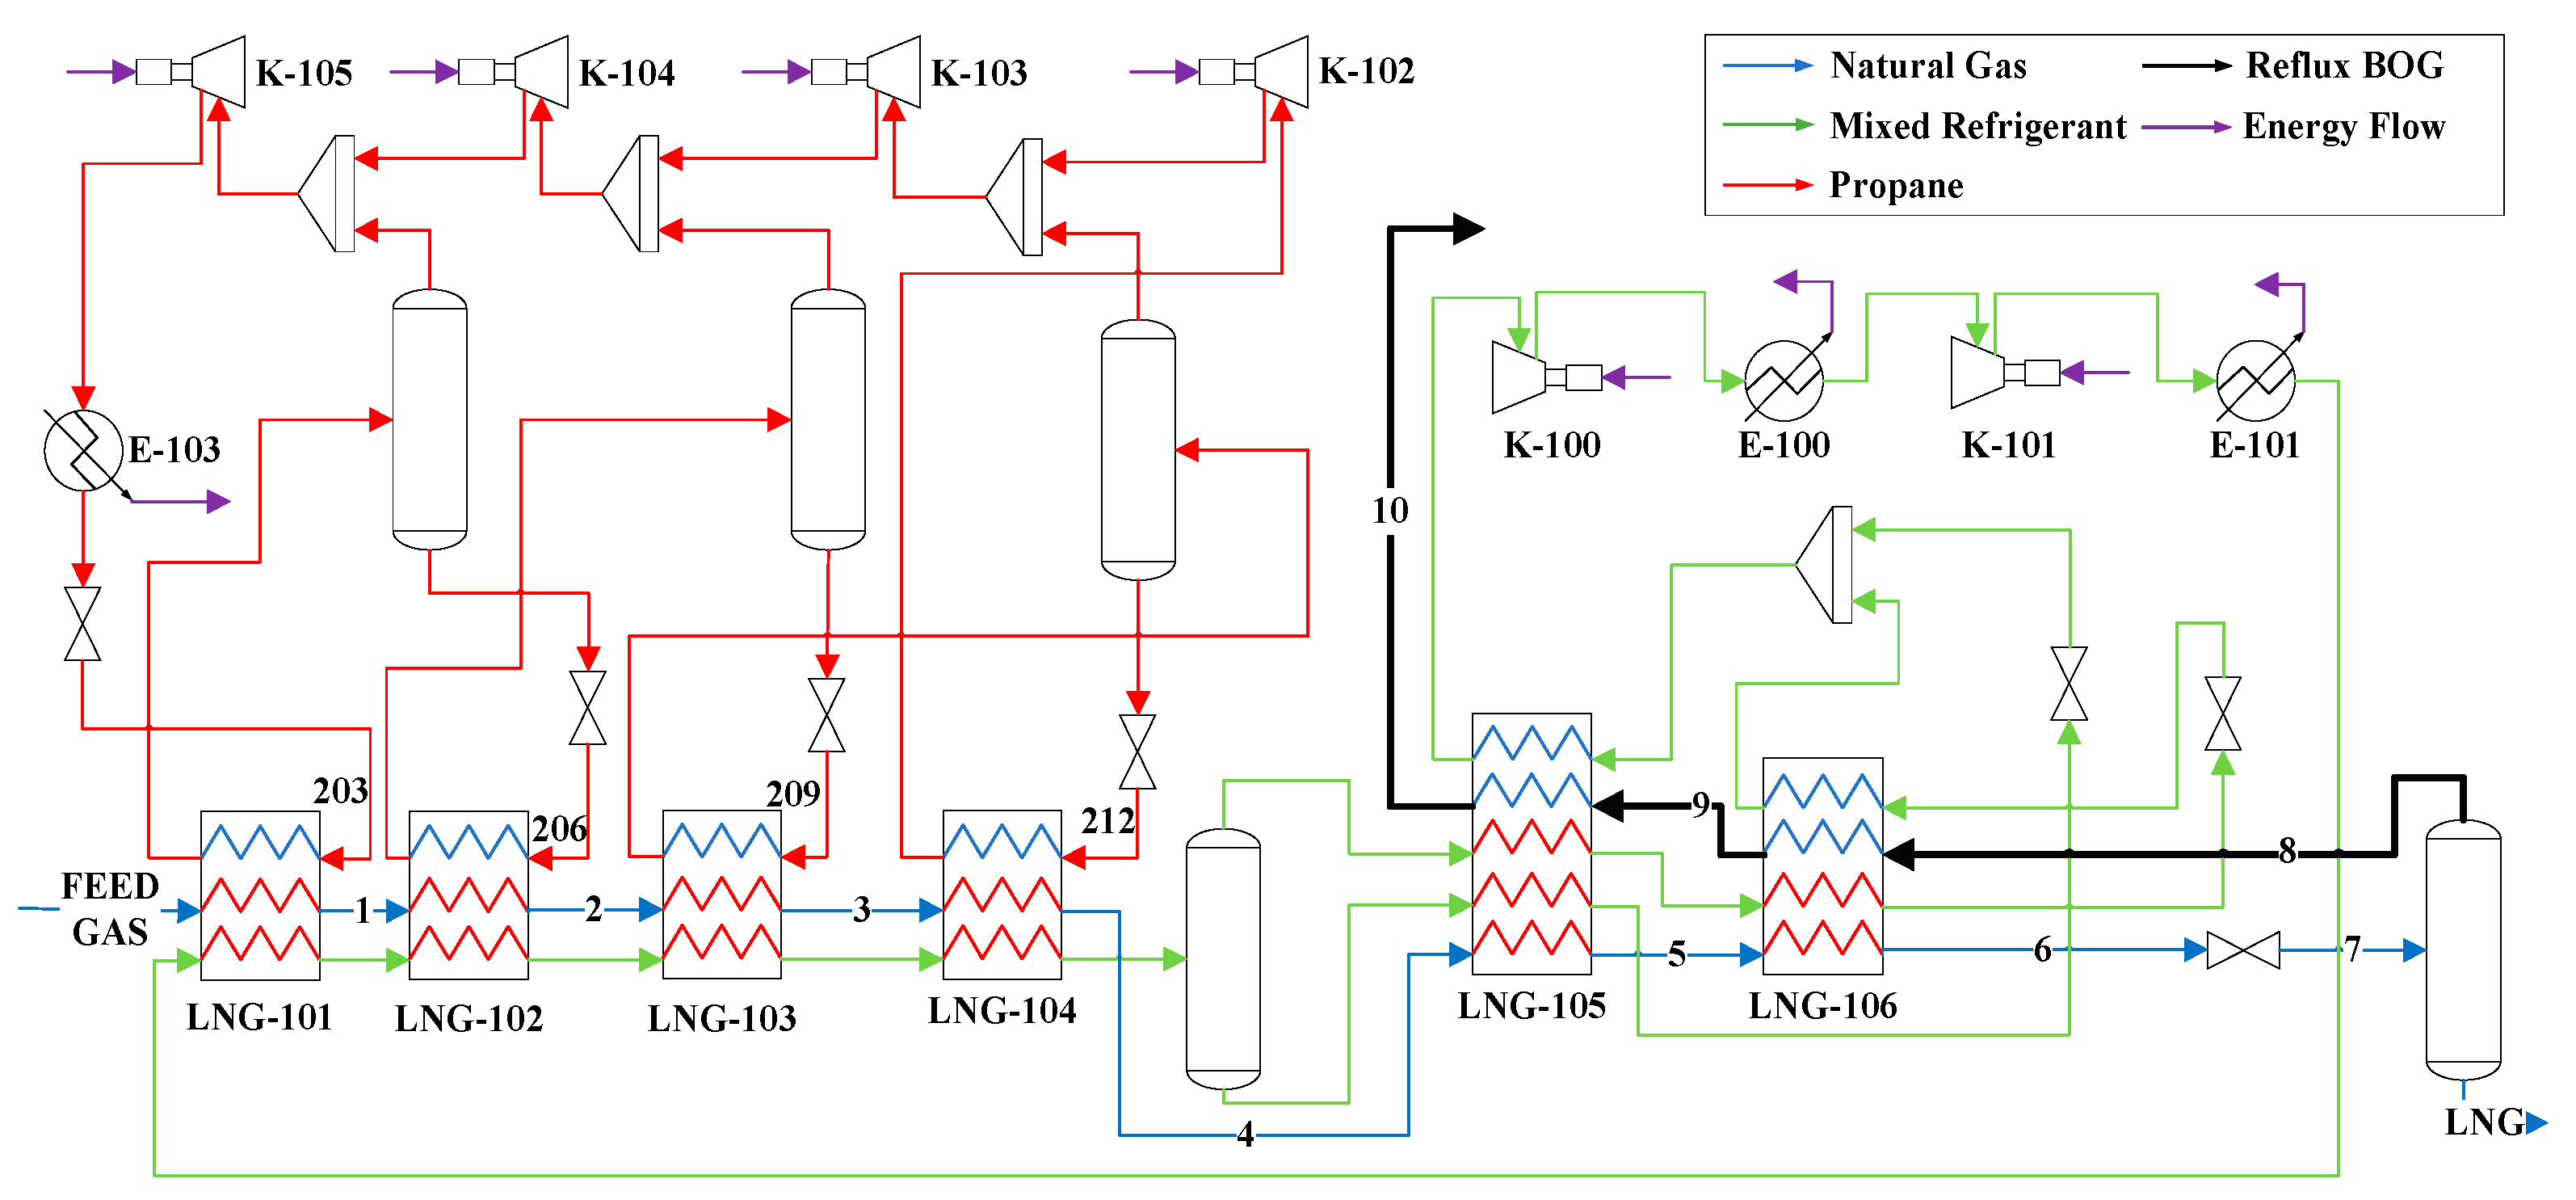
The main contributions of this work are as follows: (1) An improved C3MR is proposed, which is based on the traditional C3MR (T-C3MR), and the excellent low-temperature performance of the boiling gas (BOG) is fully utilized. (2) An improved GA based on endocrine hormone regulation (EHR) and grey wolf optimization (GWO) is proposed. In this method, the crossover operator and mutation operator of GA are improved by using EHR, and GWO is introduced to solve the problem of GA’s slow convergence speed. (3) A multi-objective optimization method, EHR-GWO-GA, is proposed to optimize the liquefaction process with the objective of determining the liquefaction amount, unit energy consumption, and exergy loss. (4) Based on the optimization results, the influence of decision variables on liquefaction amount and unit energy consumption is analyzed in detail, and the liquefaction amount, unit energy consumption, and exergy loss of the traditional C3MR process (T-C3MR), improved C3MR process (I-C3MR), and improved C3MR based on EHR-GWO-GA process (E-C3MR) were compared. In the exergy analysis, the specific equipment considered are compressors, heat exchangers, valves, and water coolers, and the exergy analyses of equipment of these processes are compared.

2. Process Design and Models

2.1. Process Description

In T-C3MR, BOG is mostly discharged directly into the air as exhaust gas. Because BOG is a gas separated from the gas–liquid separator of the same level as LNG, it has the same low temperature as LNG, so BOG has excellent low-temperature performance. Direct emissions undoubtedly waste BOG’s excellent low-temperature performance.
An improved C3MR is proposed in this paper, as shown in Figure 1. The low-temperature gas, which was separated from the last stage of the gas–liquid separation device, is as the cold flow back into the LNG-106 and the LNG-105 for providing cooling energy in turn, which could decrease unit energy consumption and exergy loss, and increase the liquefaction amount.
In Figure 1, I-C3MR is comprised of three parts. In the first part, NG enters through the inlet and is pre-cooled by a propane refrigeration cycle (C3 cycle). NG is cooled by the mixed refrigerant cycle (MR cycle) after reaching the appropriate temperature. After cooling by the MR cycle, the gas–liquid separation is performed by the gas–liquid separation device and the LNG is stored in the liquid storage tank. In the second part, MR is pre-cooled by propane to a lower temperature, and then the pre-cooled NG is deeply cooled. In the third part, the C3 cycle includes the heat transfer, pressure, condensation, and throttling cycle. The last part of this paper discusses the improvement of T-C3MR. While the last stage gas–liquid separation device separates the liquefied LNG, the BOG is guided back to the last-stage heat exchanger by the gas outlet. It then uses its excellent low-temperature performance to cool the natural gas, forming good feedback. This section has been labeled with a bold solid line in Figure 1. 1–10 in Figure 1 is the flow direction of the feed gas.

2.2. Given Parameters

To better demonstrate the superiority of the improved C3MR, similar parameters and assumptions to T-C3MR were adopted [31].
In the process of the liquefaction of NG, the pressure of feed natural gas (PFG) is 6500 kPa, the temperature of feed natural gas (TFG) is 25 °C, the mass flow rate of feed natural gas (MFG) is 5000 kg/h, and the pressure of the LNG storage tank is 110 kPa.
The specific specifications used here are shown in Table 1.

2.3. Thermodynamic Model

2.3.1. Phase Equilibrium Equations

Aspen HYSYS mainly provides two of the most commonly used state equations: the Peng–Robinson state equation and the SRK state equation.
The Peng–Robinson state equation is ideal for calculating the vapor-liquid equilibrium of the system and the liquid density of the hydrocarbon system [32]. It has a large scope of application and is more accurate for predicting some non-ideal systems. For gas processing, the Peng–Robinson equation of state is the commonly recommended physical property method. Aspen HYSYS has strengthened the equation to calculate many systems accurately under a wide range of operating conditions with high processing efficiency and reliable calculation results. The Peng–Robinson equation of state can accurately calculate the phase equilibrium of cryogenic high-temperature and high-pressure systems.
In many cases, the SRK state equation [33] can also obtain similar results to the Peng–Robinson state equation, but its scope of application is much smaller than the Peng–Robinson state equation. This method is not reliable for non-ideal systems.
Therefore, considering that the Peng–Robinson state equation is more suitable for the natural gas liquefaction process, it is selected in this paper.
The phase equilibrium equation is the basis for calculating the physical parameters in the liquefaction process. The Peng–Robinson state equation, which is used to calculate thermodynamic parameters [32], is selected in this paper. The formulas are shown in Equations (1)–(5):
p = R T V b a ( T ) V ( V + b ) b ( V b )
a ( T ) = 0.457235 R 2 T c 2 α ( T ) p c
b = 0.077796 R T c p c
α ( T ) = 1 + 0.37464 + 1.54226 ω 0.26992 ω 2 1 T r 0.5 2
T r = T T c
where p is the pressure, Pa; R is the gas constant (R = 8.314), J/(mol·K); T is the temperature, K; v is the molar amount, m3/mol; α is the function of temperature; b is the constant; u is the centrifugal factor; Tc is the critical temperature, K; and pc is the critical pressure, Pa.

2.3.2. Exergy Analytical Model

In this paper, the exergy analysis method is used to calculate the exergy loss of the equipment in the process [34].
The assumptions are proposed as follows: the losses of pressure and heat are ignored, and the flows in the process are stable.
The detailed equation for exergy losses of the heat exchangers is shown in Equation (6):
E hx = E in E out = T 0 S out S in
The detailed equation for exergy losses of the compressors is shown in Equation (7):
E com = E in E out + W = T 0 S out S in
The detailed equation for exergy losses of the water coolers is shown in Equation (8):
E wc = E in E out = T 0 S out S in + Q
The detailed equation for exergy losses of the valves is shown in Equation (9):
E v = E in E out = T 0 S out S in

3. Improvement of GA

The optimization of the liquefaction process of NG involves several decision variables and optimization objectives that are interconnected. The solution’s complexity is much greater than that of a typical planning problem. Currently, intelligent optimization algorithms such as GA are mainly employed to address the objective function. In addition, the basic operation cases of genetic algorithms are also detailed in the references [35,36].
Although GA is a widely used intelligent algorithm, it has two unavoidable shortcomings. First, it is the slow convergence speed. This is because GA needs to search for the global optimal solution fully, which means GA wastes a lot of computing power in the non-optimal direction. This will inevitably lead to the problem of slow speed. Second, it is easy to fall into a local optimal solution. This is because, in different optimization processes, super individuals may appear in the population in the early stage of optimization. In the early stage of evolution, the search has not covered all the data, and the emergence of super individuals leads to the fitness value of the individual greatly exceeding the average individual fitness value of the current population so that the algorithm converges to the local optimal solution earlier. The search range of GA in the optimization process is determined by the crossover probability and mutation probability; there is a positive correlation between them. Because the value of crossover probability and mutation probability need to take into account the needs of the early and late stages of population evolution, a moderate constant is often used. The fixed crossover probability and mutation probability lead to the search range not being large enough in the early stage of population evolution. When the super individual appears in the early stage of evolution, the optimization tends to converge to the super individual in advance. In other words, the fixed crossover and mutation probability are the main problems leading to the local optimal solution.
An improved GA method based on EHR and GWO is proposed to address the above problems. The details are discussed below.

3.1. Improved GA Based on EHR

The basic law of EHR was proposed by FARHY in 2004. It reveals that hormones have monotonic and non-negative change characteristics. The up-regulation function Fup (G) and the down-regulation function Fdown (G) of EHR follow the Hill function. The formulas are shown in Equations (10) and (11) [37].
F u p ( G ) = G n D n + G n
F d o w n ( G ) = D n D n + G n
In Equations (10) and (11), G is the function independent variable; d is the threshold, and D > 0; n is the Hill coefficient, and n ≥ 1; n and D jointly determine the slope of the rising and falling curve.
The Hill function for D = 50, n = 5 [37] is shown in Figure 2. Figure 2 shows the rising and falling characteristics of the Hill function, respectively.
In this section, the crossover operator and mutation operator of GA are improved by using EHR, which is named EHR-GA. The crossover operator and the mutation operator had a certain adaptability, and their size will change according to the increase in the number of iterations. That is to say, in the early stage of population evolution, EHR-GA has a larger crossover probability and a smaller mutation probability, which is conducive to the search of the population and avoids the occurrence of super individuals. At the late stage of population evolution, the global search is nearing the end, and it does not need too much crossover probability. At this time, EHR-GA has a larger mutation probability and a smaller crossover probability. The large mutation probability helps to search for the optimal solution more accurately at the later stage of the search, which is conducive to the solution of the optimal solution. Therefore, the problem of falling into the local optimum will be avoided in the optimization process.

3.2. EHR-GA Combined with GWO

GWO is a new intelligent algorithm proposed by Mirialili et al. in 2014 [38]. The core of the grey wolf algorithm is to simulate the hunting behavior of wolves in the natural environment. According to the individual’s performance in the objective function, the individual with the best performance is found as the leader wolf, and the leader wolf’s position is used to transmit information to other individuals so that they can adjust their position in the direction of the leader wolf. It is precisely because of a direction selection mechanism similar to wolf predation that GWO has a faster convergence speed.
Compared to EHR-GA, GWO has the characteristics of fast convergence. Therefore, GWO’s direction selection mechanism is added to EHR-GA to solve the problem of GA’s slow convergence speed in the optimization process.
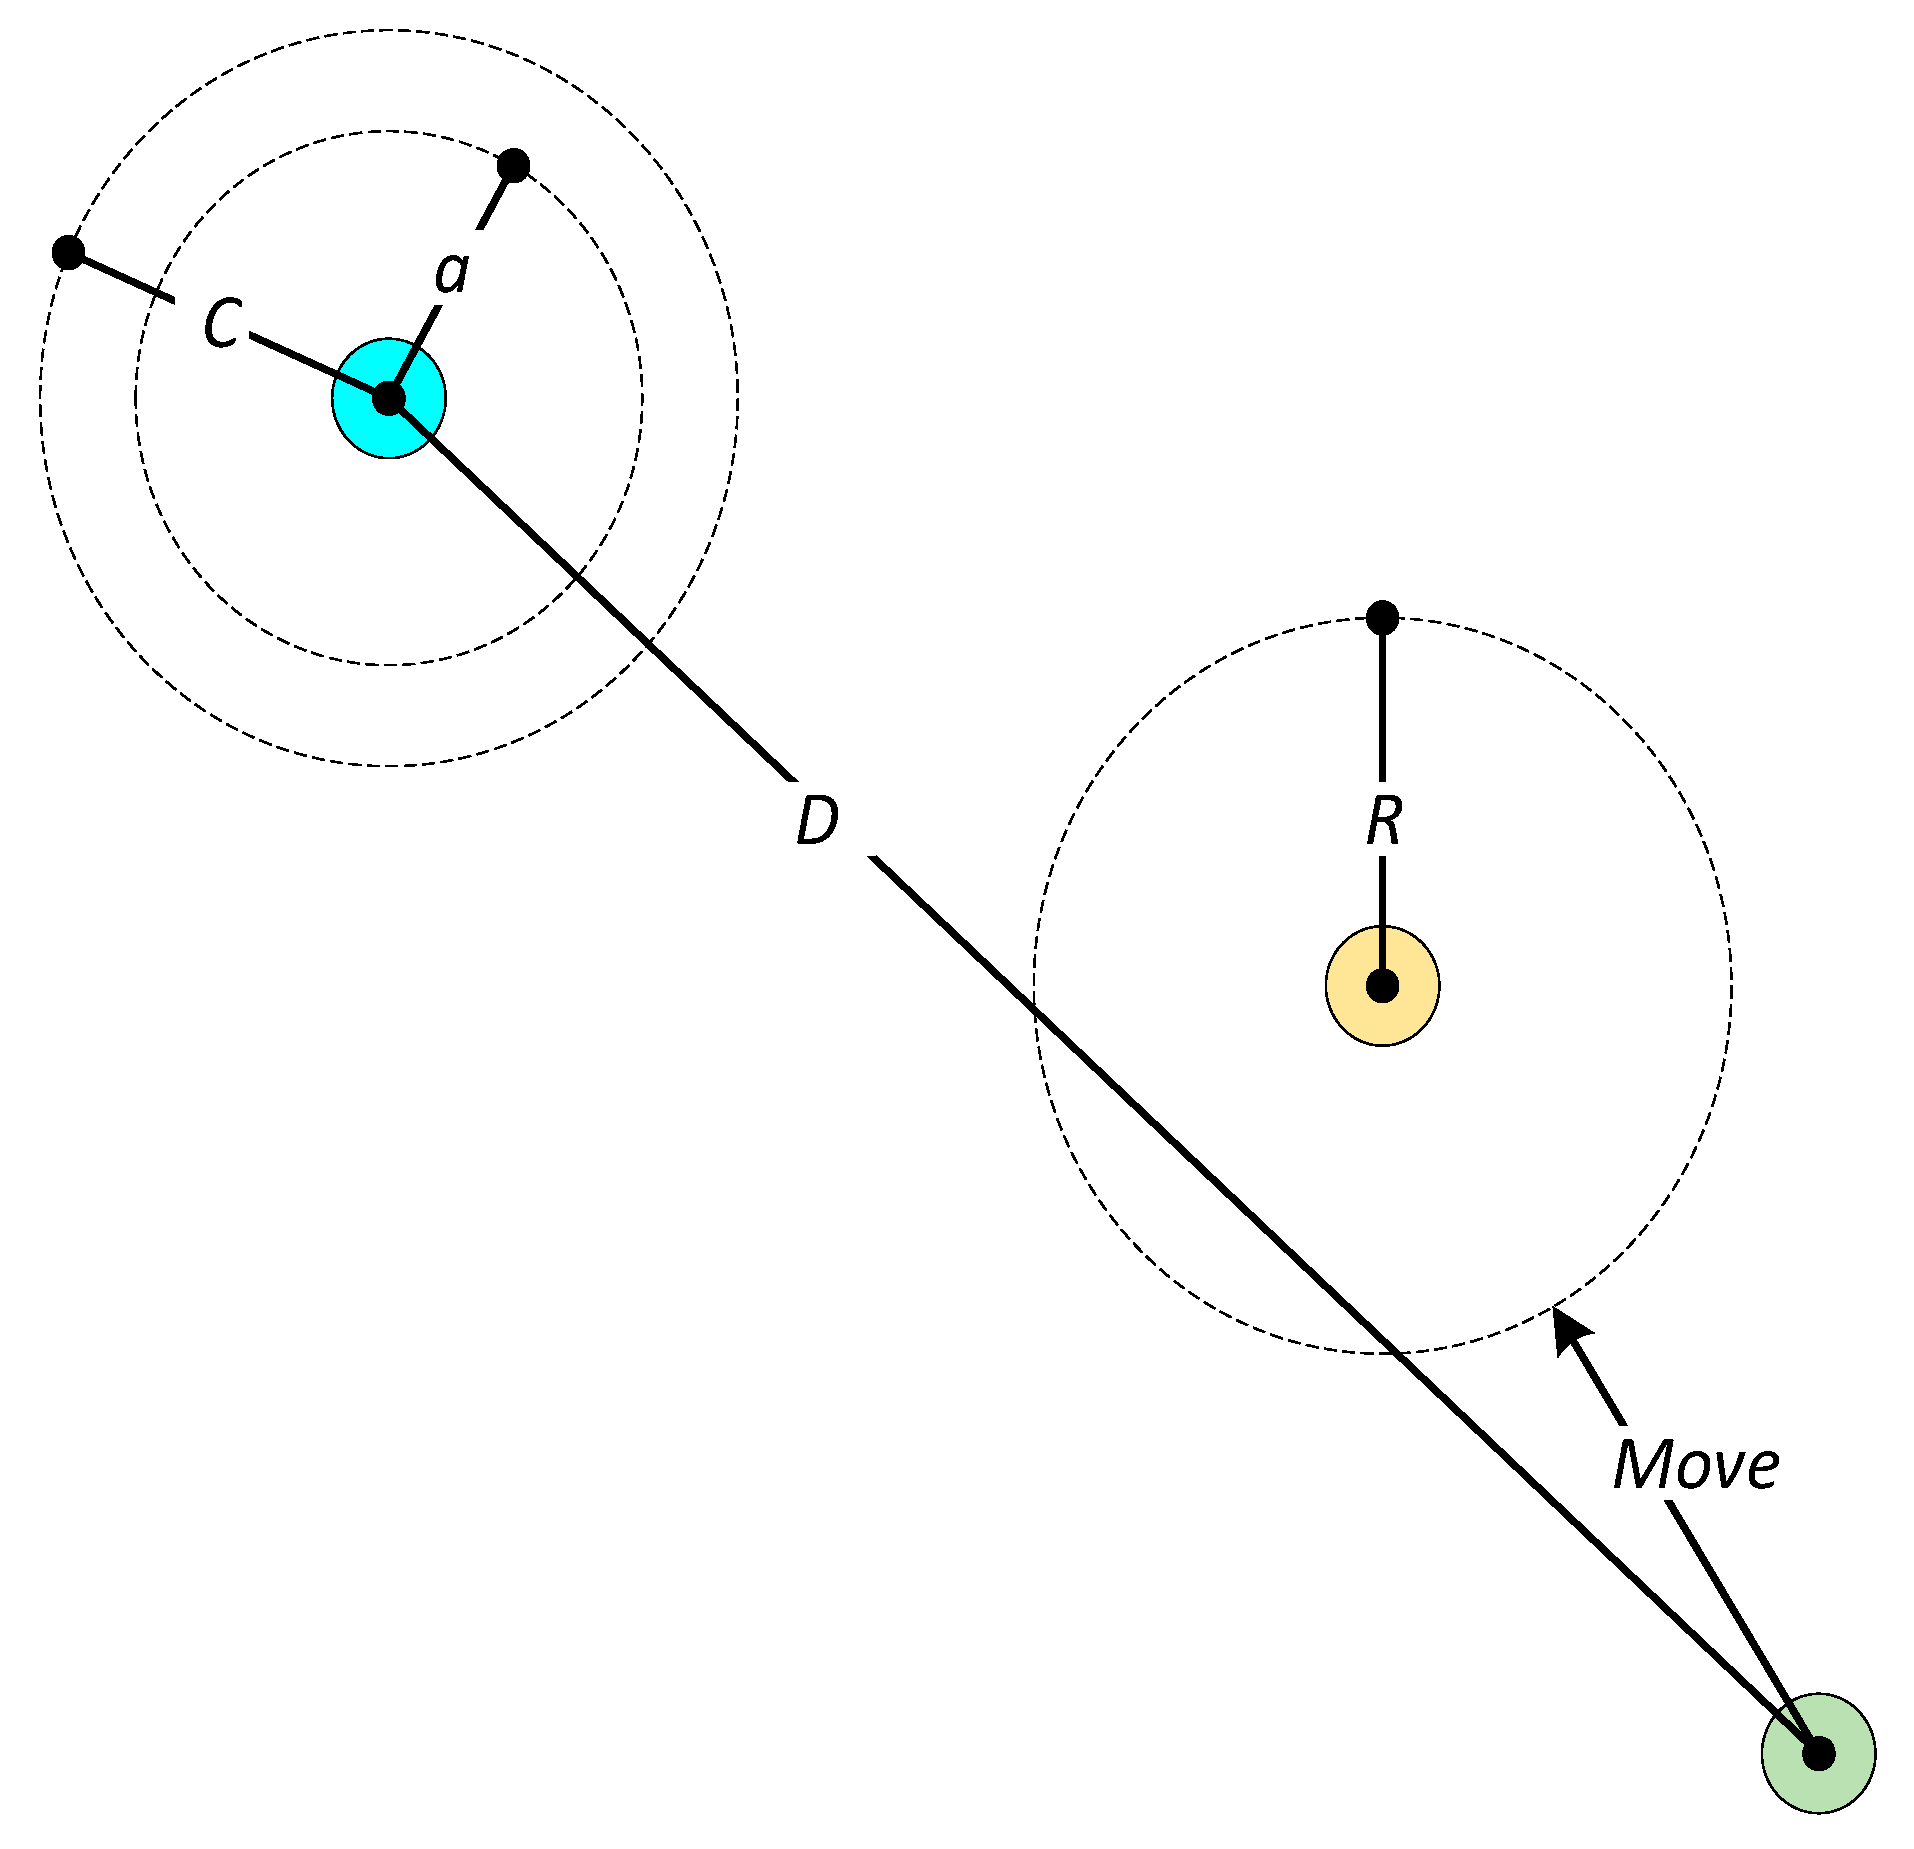
The formulas are shown in Equations (12)–(15). The directional mechanism of EHR-GA with GWO is shown in Figure 3.
D = C X P t X t
X t + 1 = X P t A D
A = 2 a r 1 a
C = 2 r 2
Among them, t represents the number of current iterations, XP represents the optimal population, and X represents the optimal individual. a decreases from 2 to 0 during the iteration, and r 1 and r 2 are random vectors in [0, 1]. R is the perturbation radius. D is the direction of the leading wolf, that is, the direction of the optimal solution.
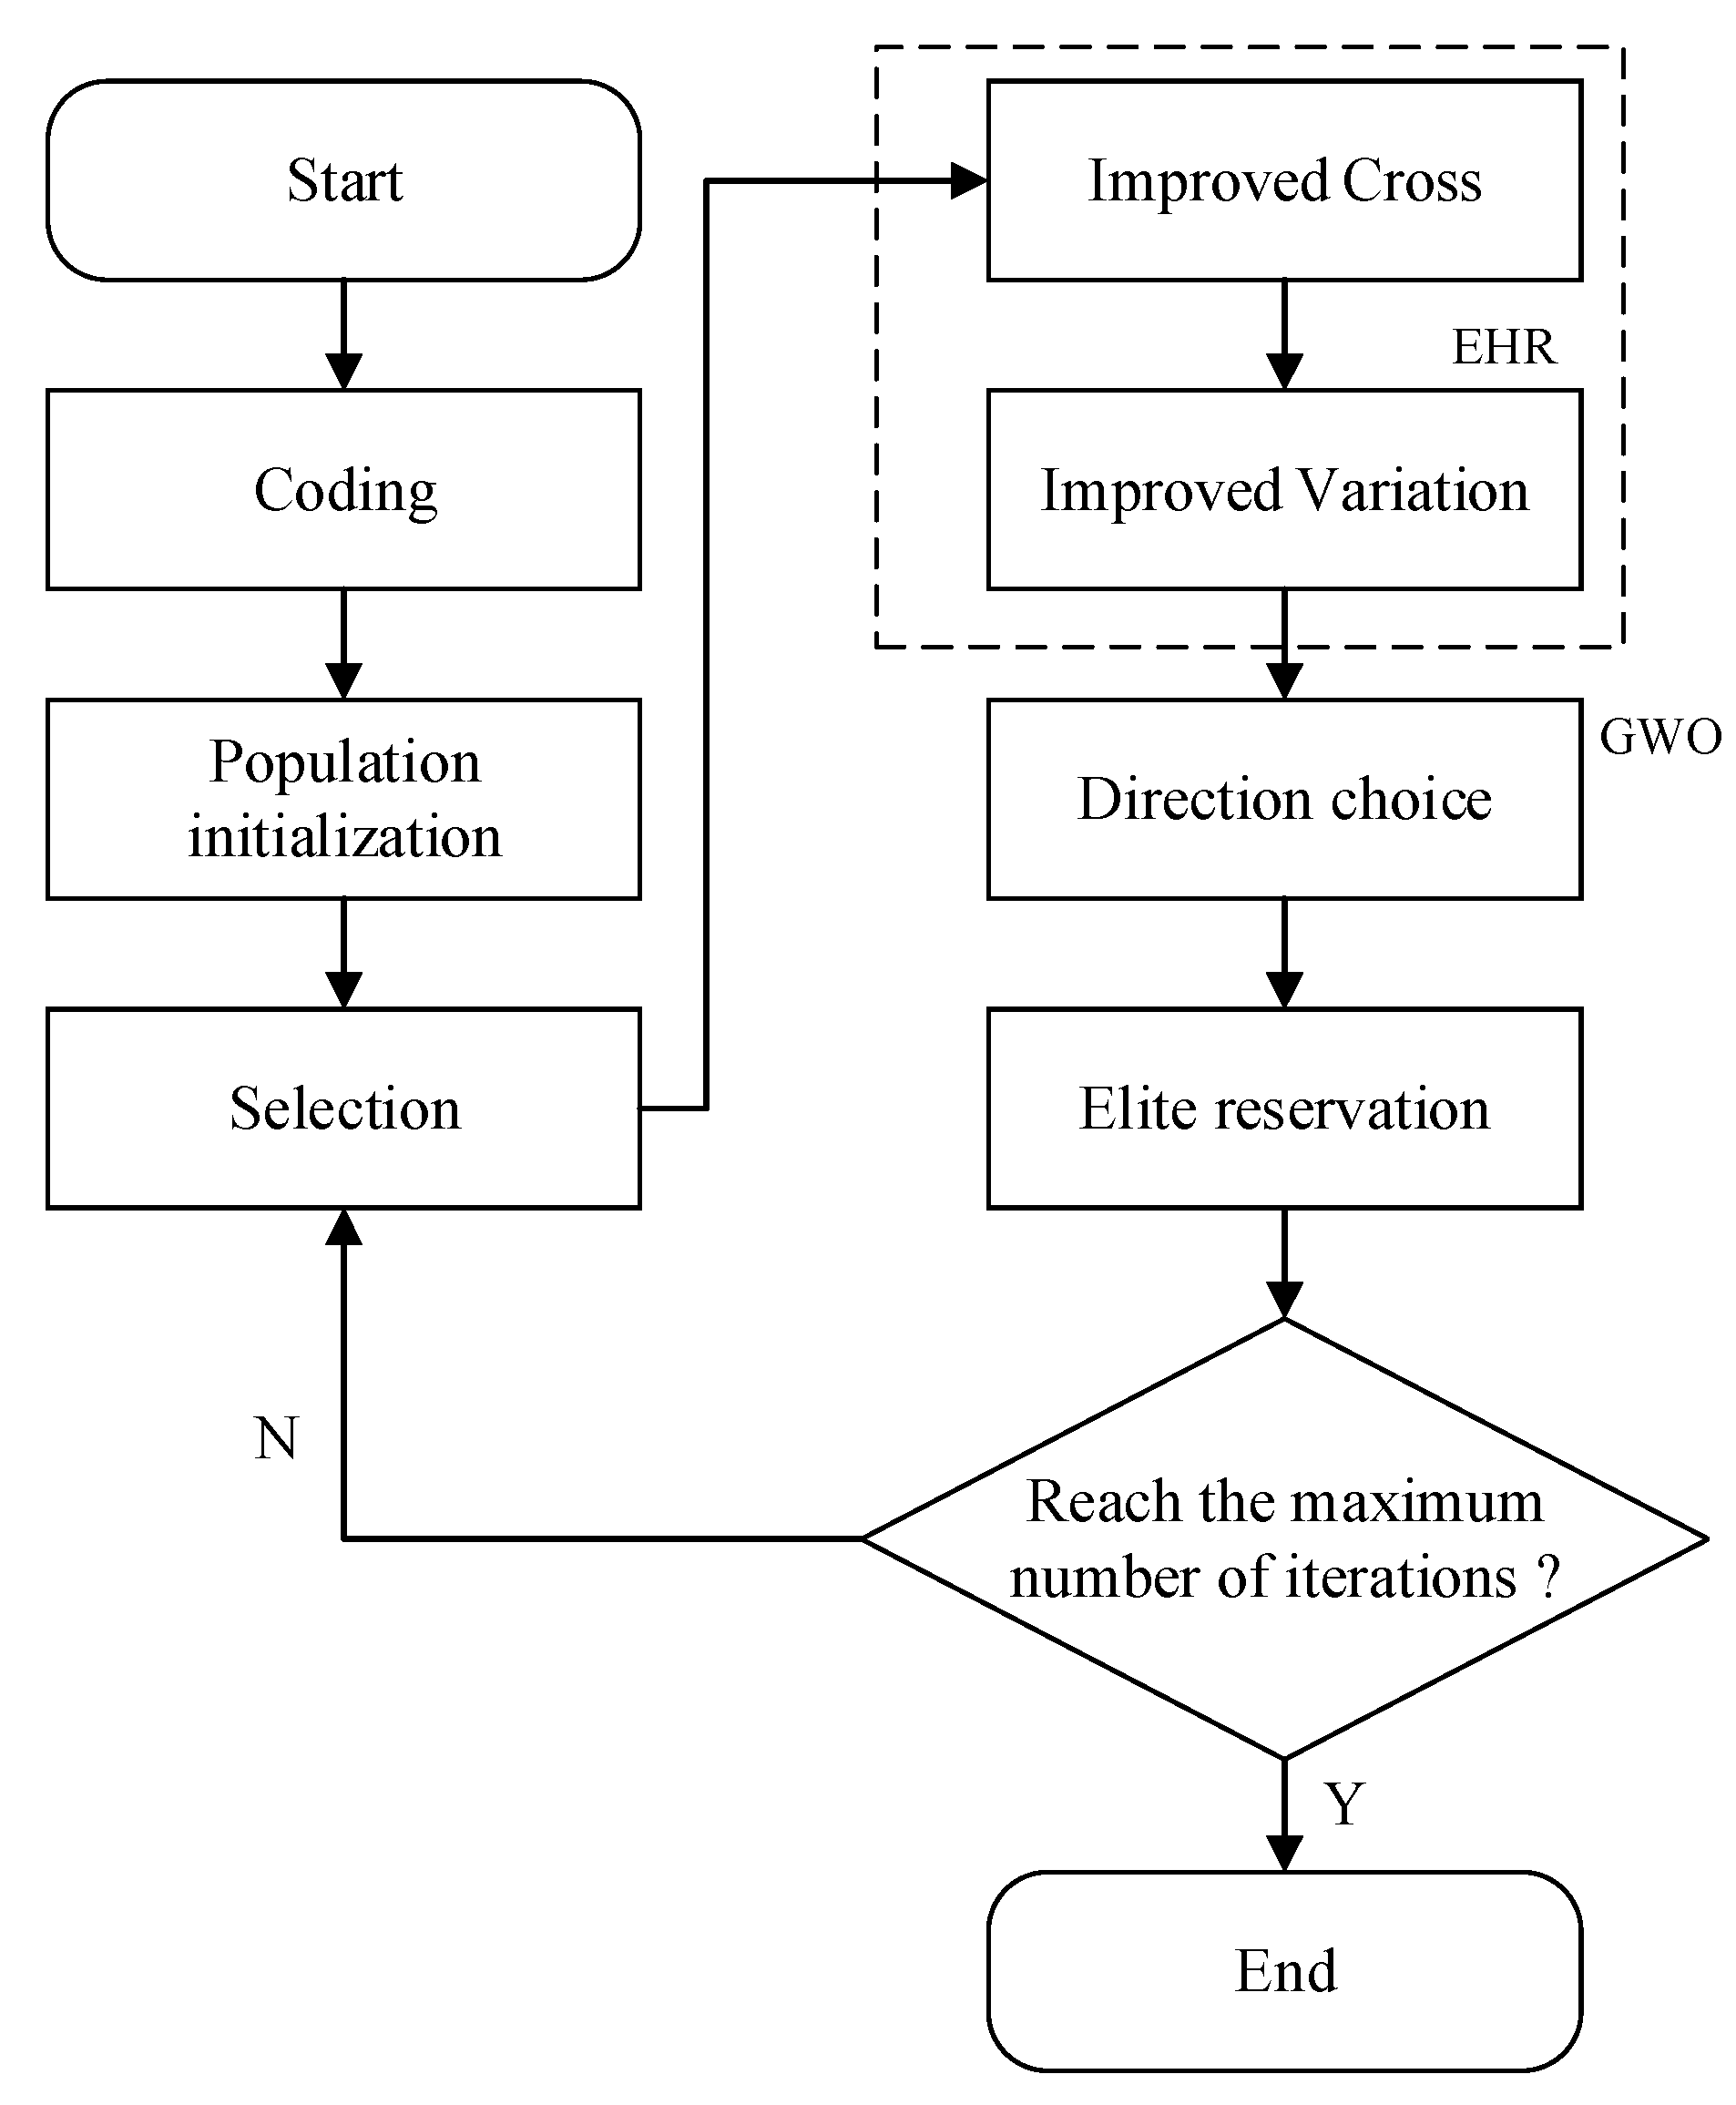
Therefore, EHR, GWO and GA are combined, which is named EHR-GWO-GA, to solve the two problems mentioned above, and the workflow of EHR-GWO-GA is shown in Figure 4.

3.3. Performance Testing

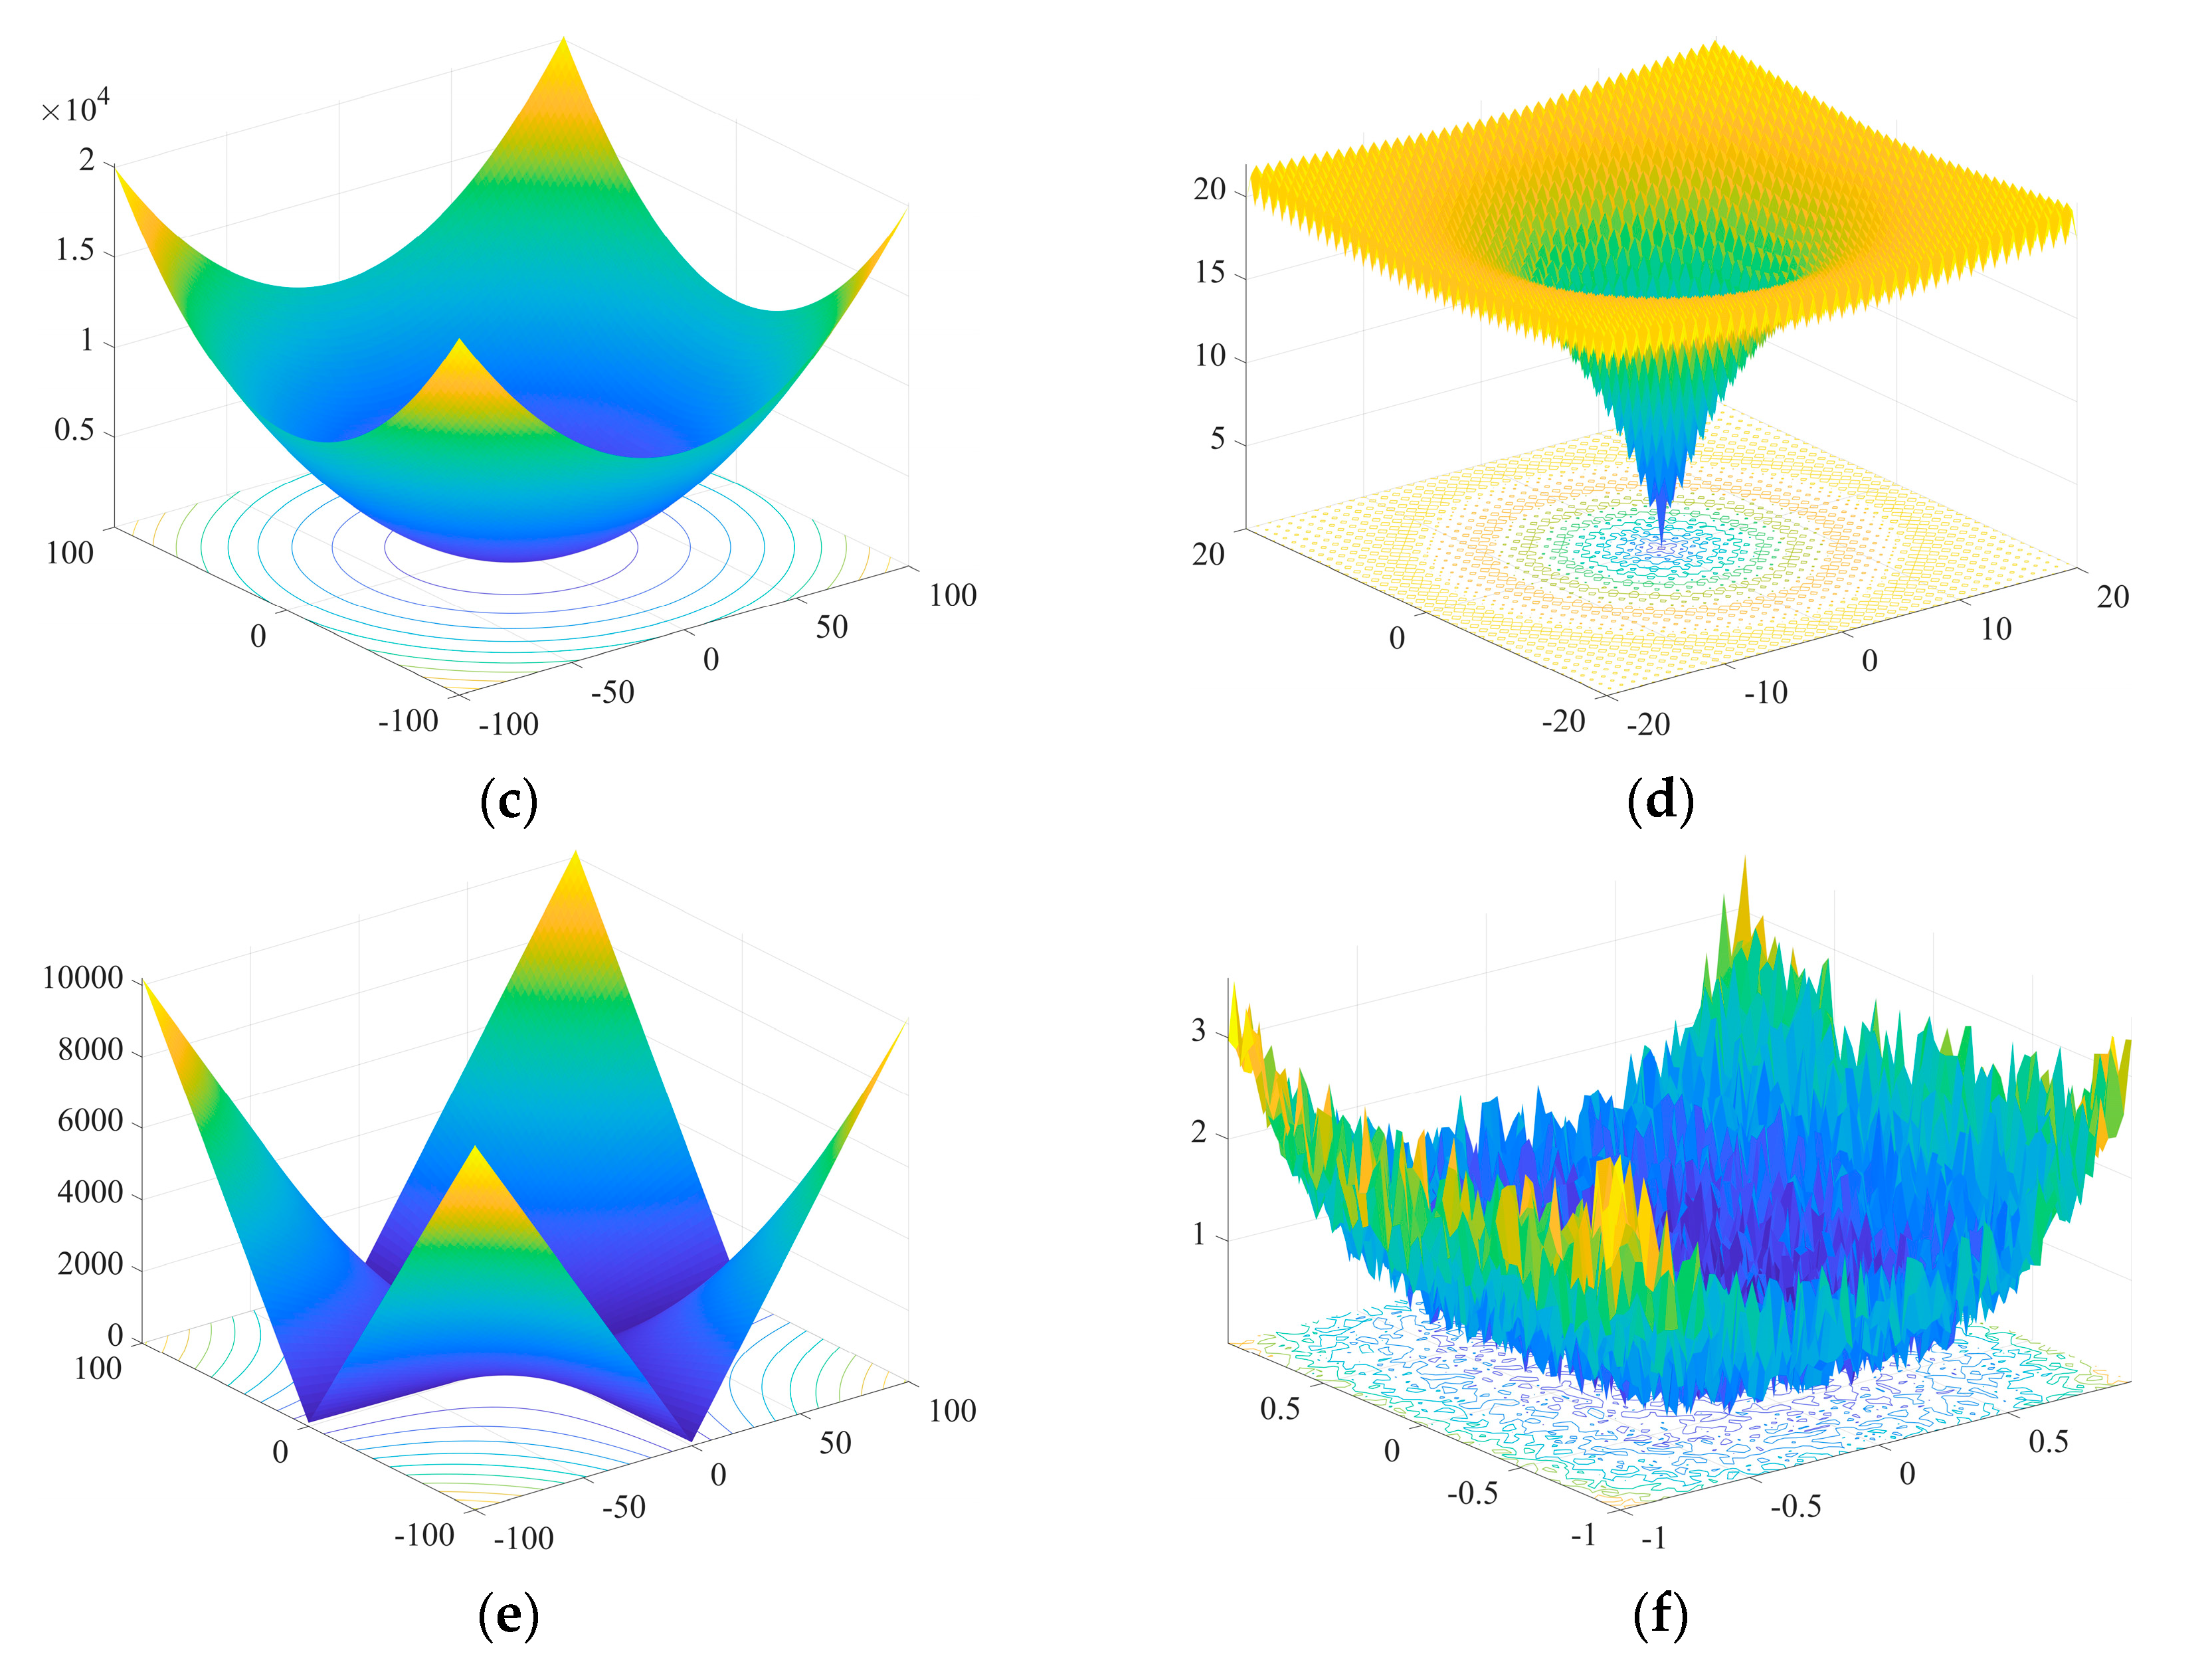
In order to verify the effect of EHR-GWO-GA, six test functions [38,39] with two different characteristics are used to test the performance of EHR-GWO-GA and GA from the standard functional test library. The test functions have two different characteristics, and they are unimodal functions: f1(x), f2(x), f3(x), f5(x) and multimodal functions: f4(x), f6(
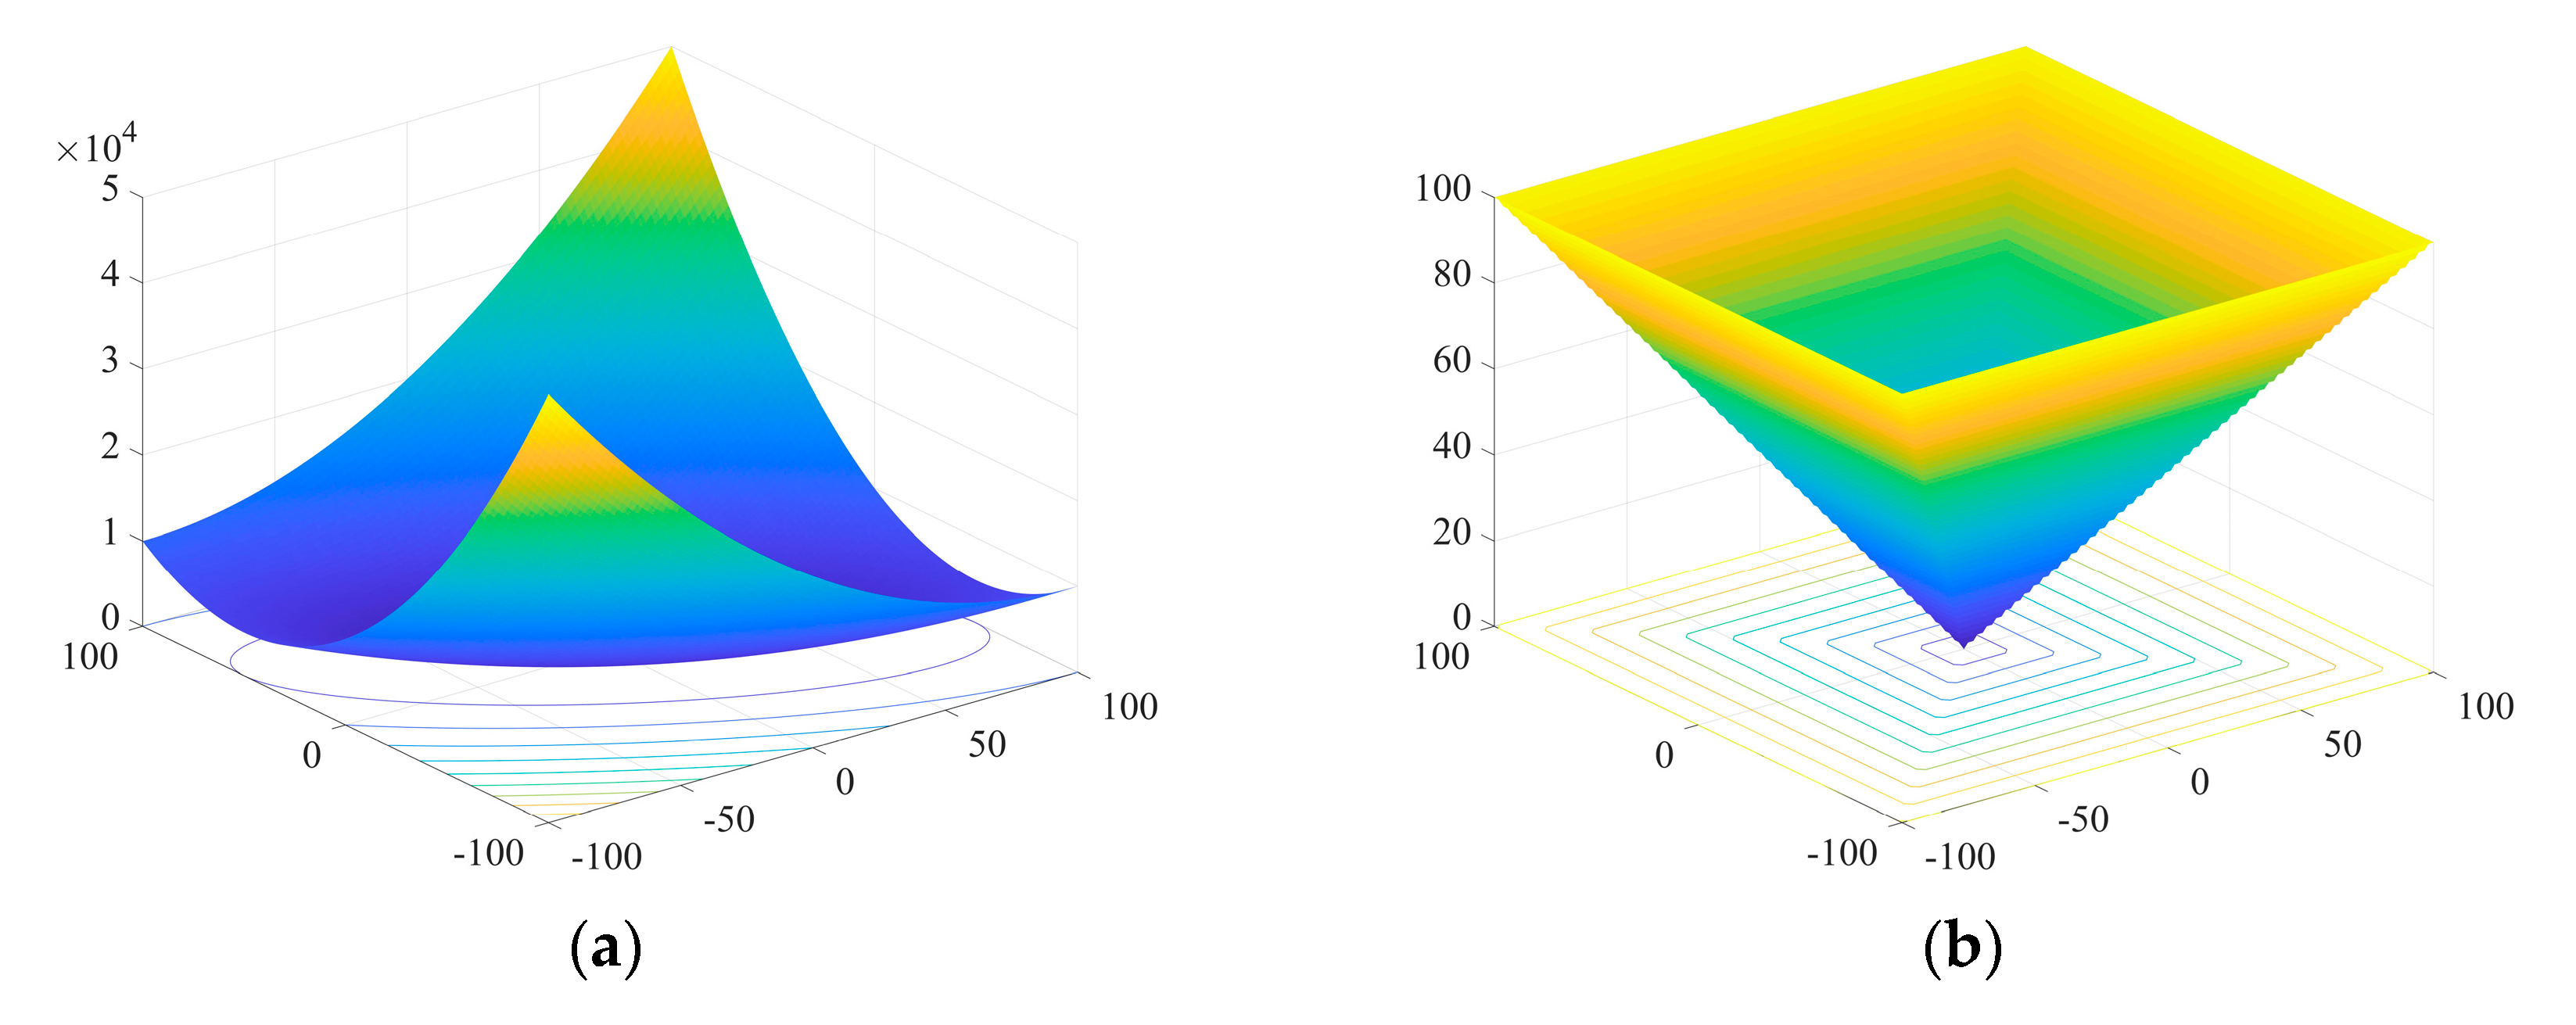
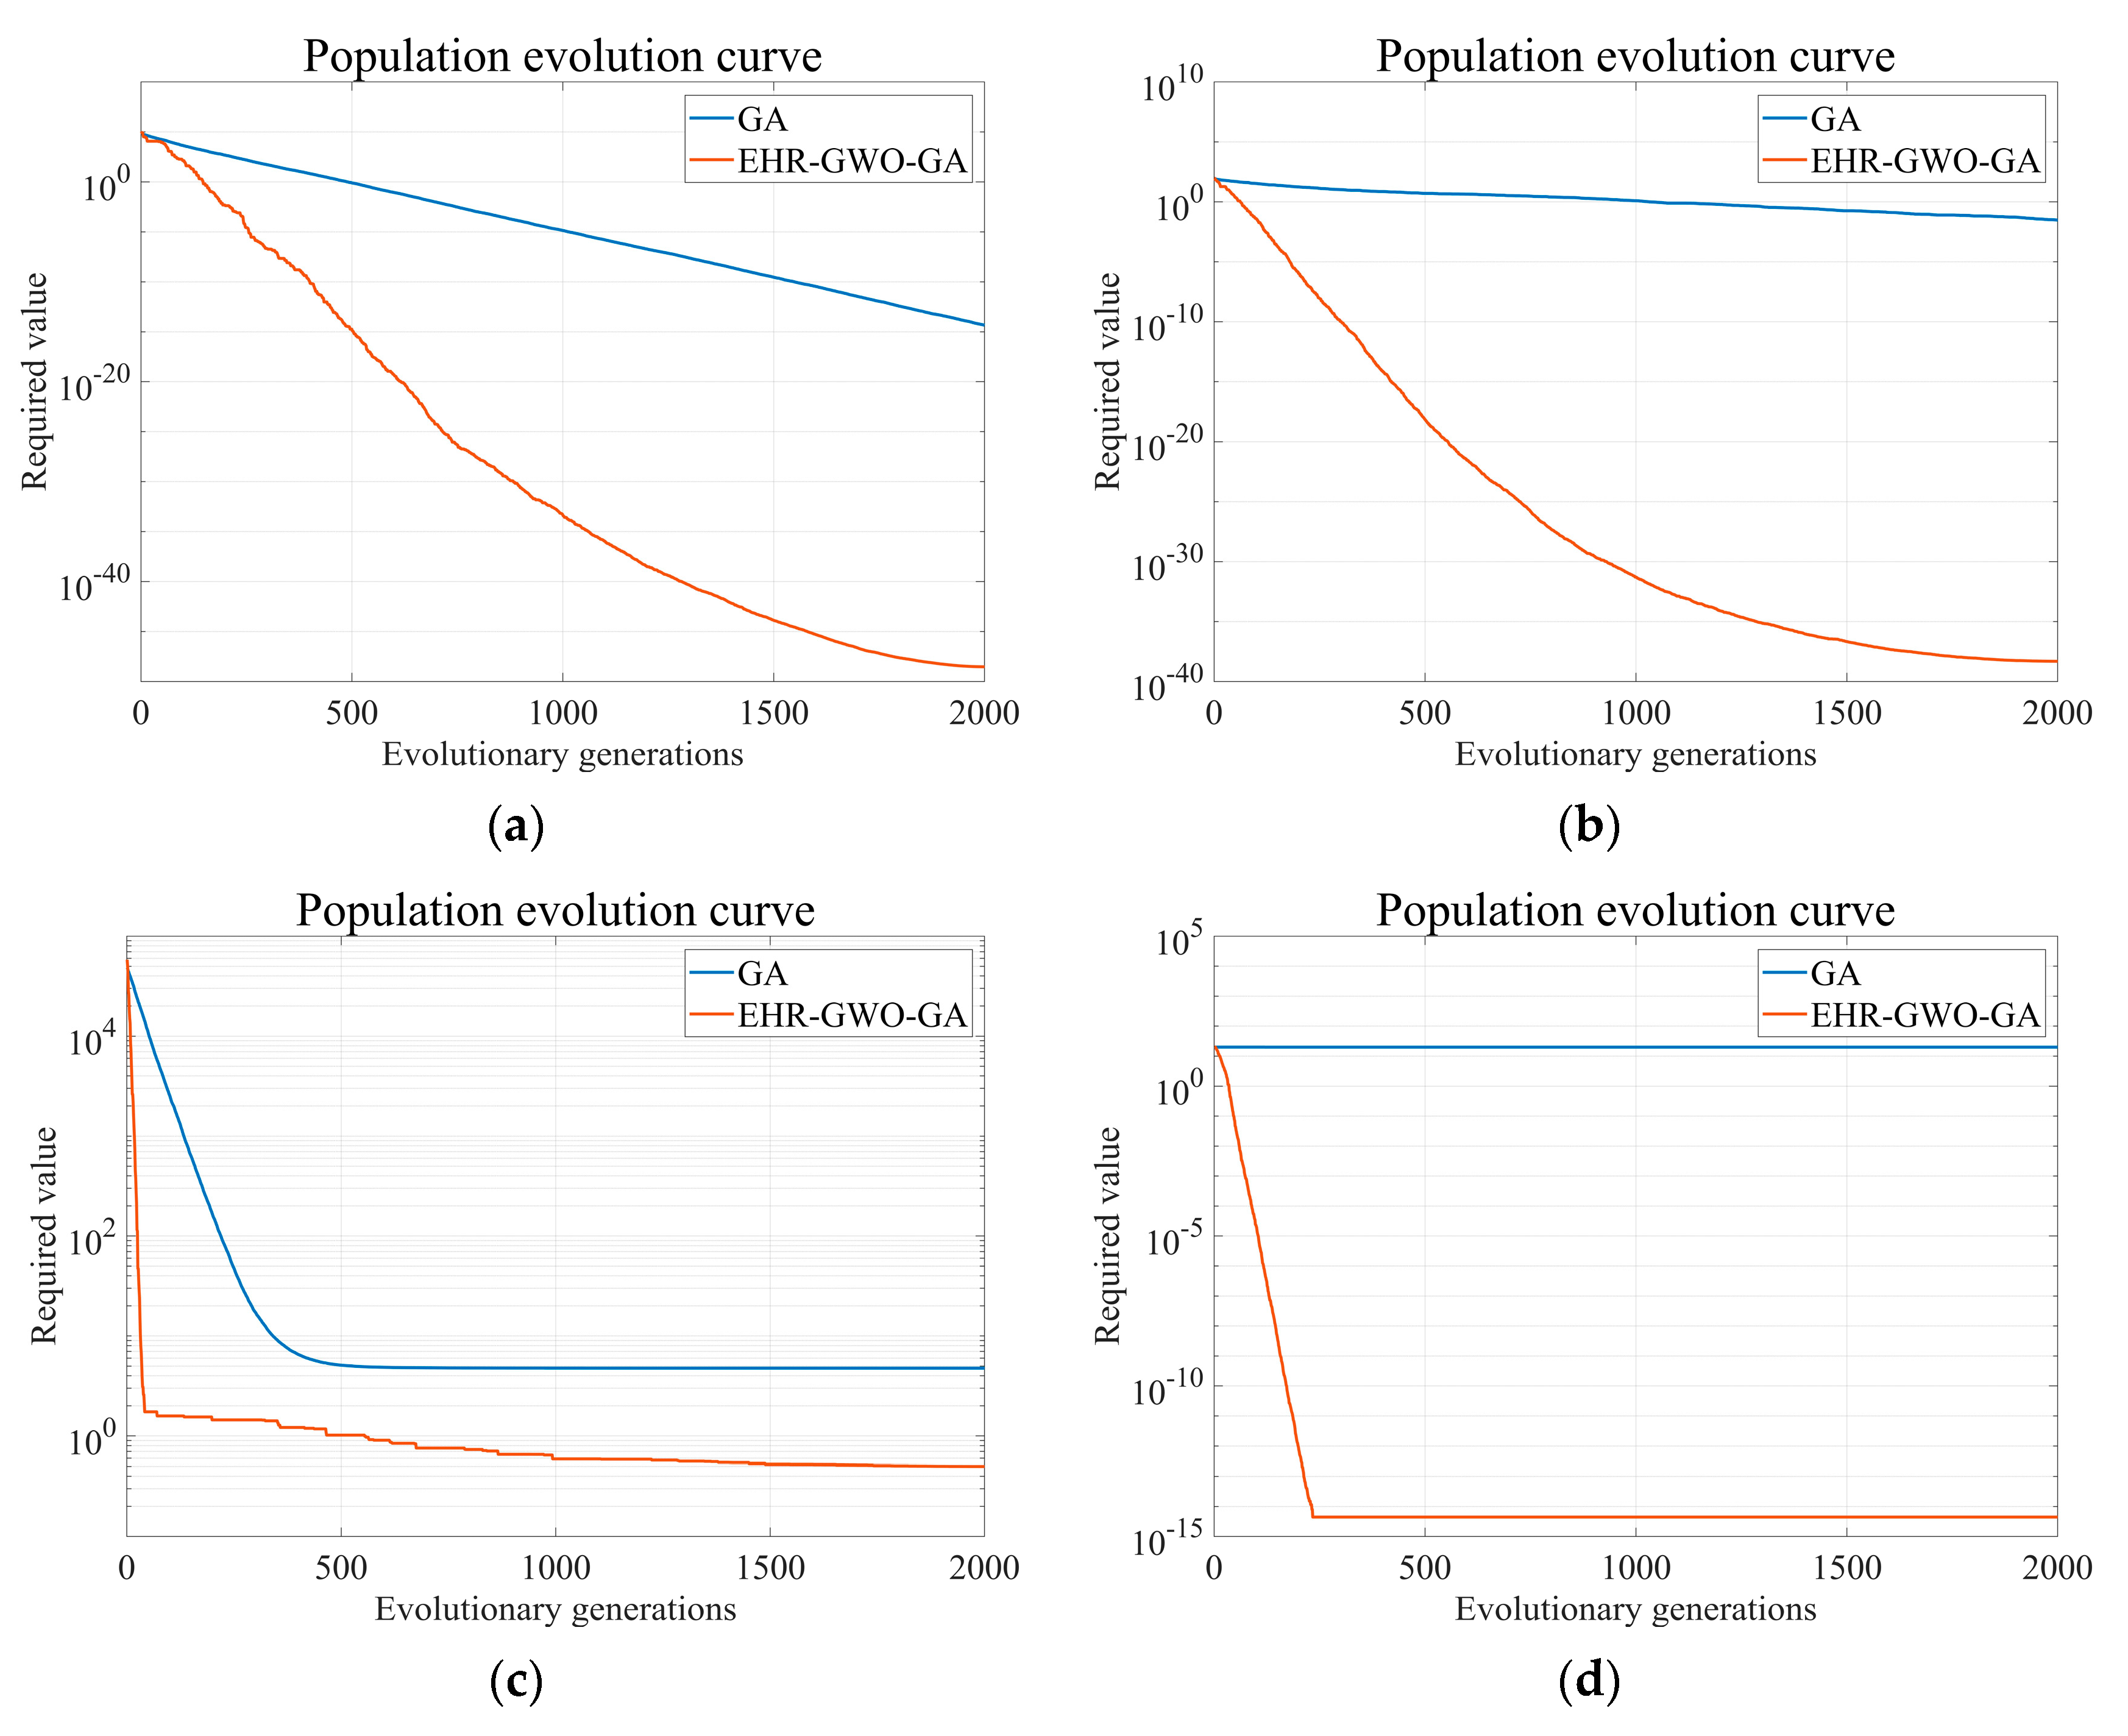
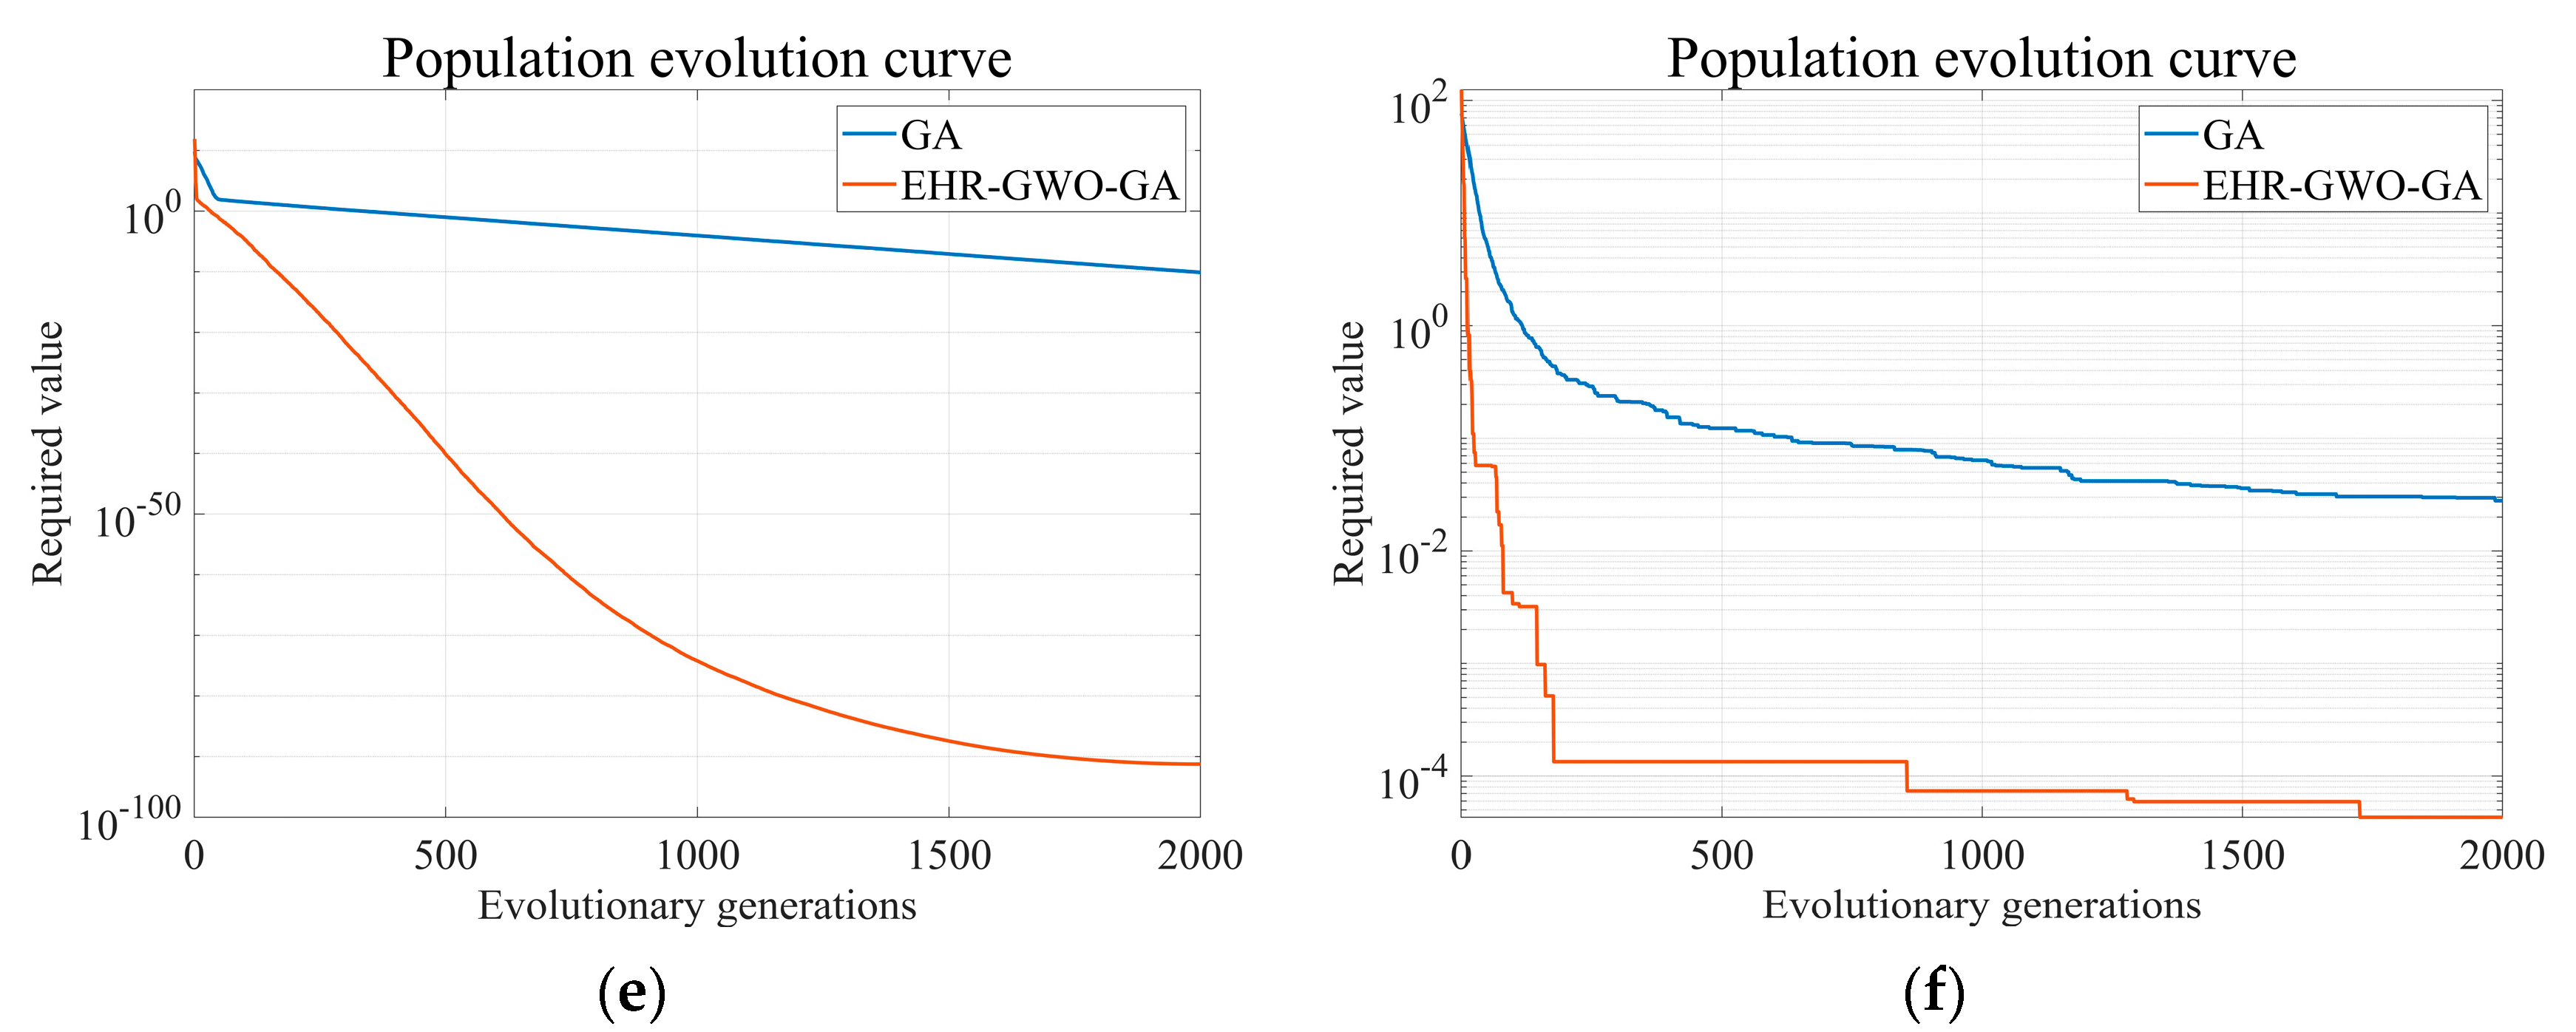
x). The test function diagram and related parameters are shown in Figure 5a–f and Table 2, and the convergence curve is shown in Figure 6a–f.
According to the test results, in the application of f1(x), f2(x), and f5(x), the performance of EHR-GWO-GA is better than that of GA in terms of the accuracy of the optimal solution and the convergence speed. In the application of f3(x), f4(x), and f6(x), EHR-GWO-GA avoids the problem of locally optimal solutions in the process of using GA.
From the convergence curve of each test function, it can be seen that the convergence speed and avoiding falling into local optimal solutions of EHR-GWO-GA have been greatly improved compared with GA.

4. Process Optimization

In this paper, there are three optimization objectives, which are the maximum amount of liquefaction amount, the minimum value of unit energy consumption, and the minimum of exergy loss. The corresponding optimization objective functions are as follows.
The objective function 1 (OF1) is the maximum amount of liquefaction. Since the most direct product of the liquefaction process is LNG, most of the current research focuses more on increasing the amount of liquefaction and also takes increasing the amount of liquefaction as the goal of process optimization. The OF1 is shown in Equation (16):
M a x   O F 1 X = M LNG
where MLNG refers to the molar flow rate of LNG produced.
The objective function 2 (OF2) is the minimum value of unit energy consumption. Unit energy consumption is the ratio of the total energy consumption in the process to the molar flow rate of LNG under normal conditions. Unit energy consumption is the main index for evaluating a liquefaction process, which is usually treated as the objective of process optimization. The OF2 is shown in Equation (17):
M i n   O F 2 X = W net M LNG
where Wnet refers to the net energy consumption in the process. Wnet is shown in Equation (18):
W net = W compressor
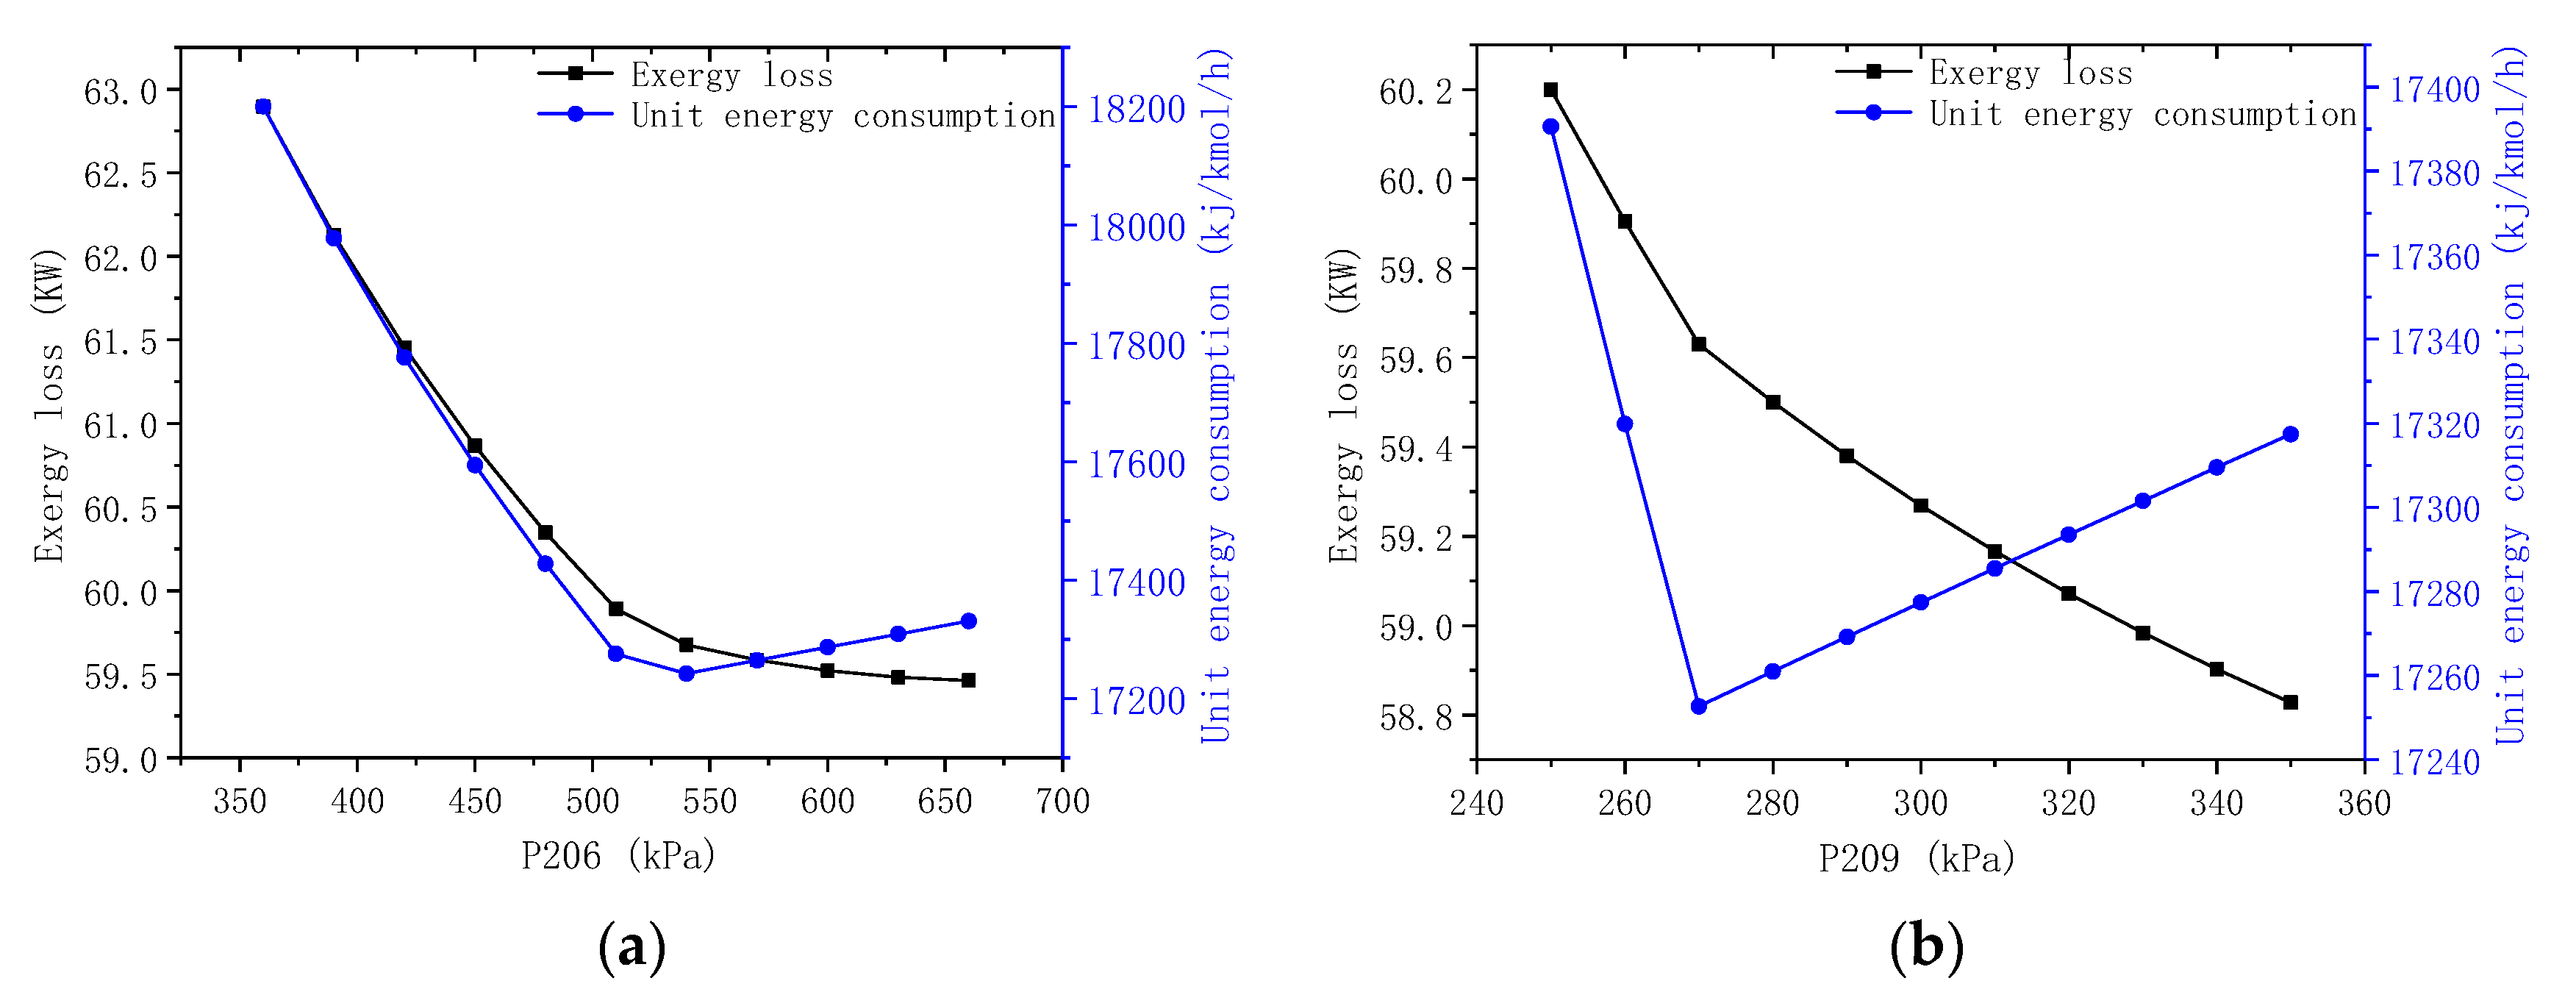
The objective function 3 (OF3) is the minimum of exergy loss. Exergy is a measure of the maximum effective energy that can be extracted when the process flow is balanced with the surrounding environment in a hypothetical reversible process. Reducing the exergy loss in a system is one of the main objectives of liquefaction process optimization. The OF3 is shown in Equation (19):
M i n   O F 3 X = E x e r g y   l o s s e s
where X is shown in Equation (20):
X = P FG , T FG , P 203 , P 206 , P 209 , P 212 , M C 3 , M MR
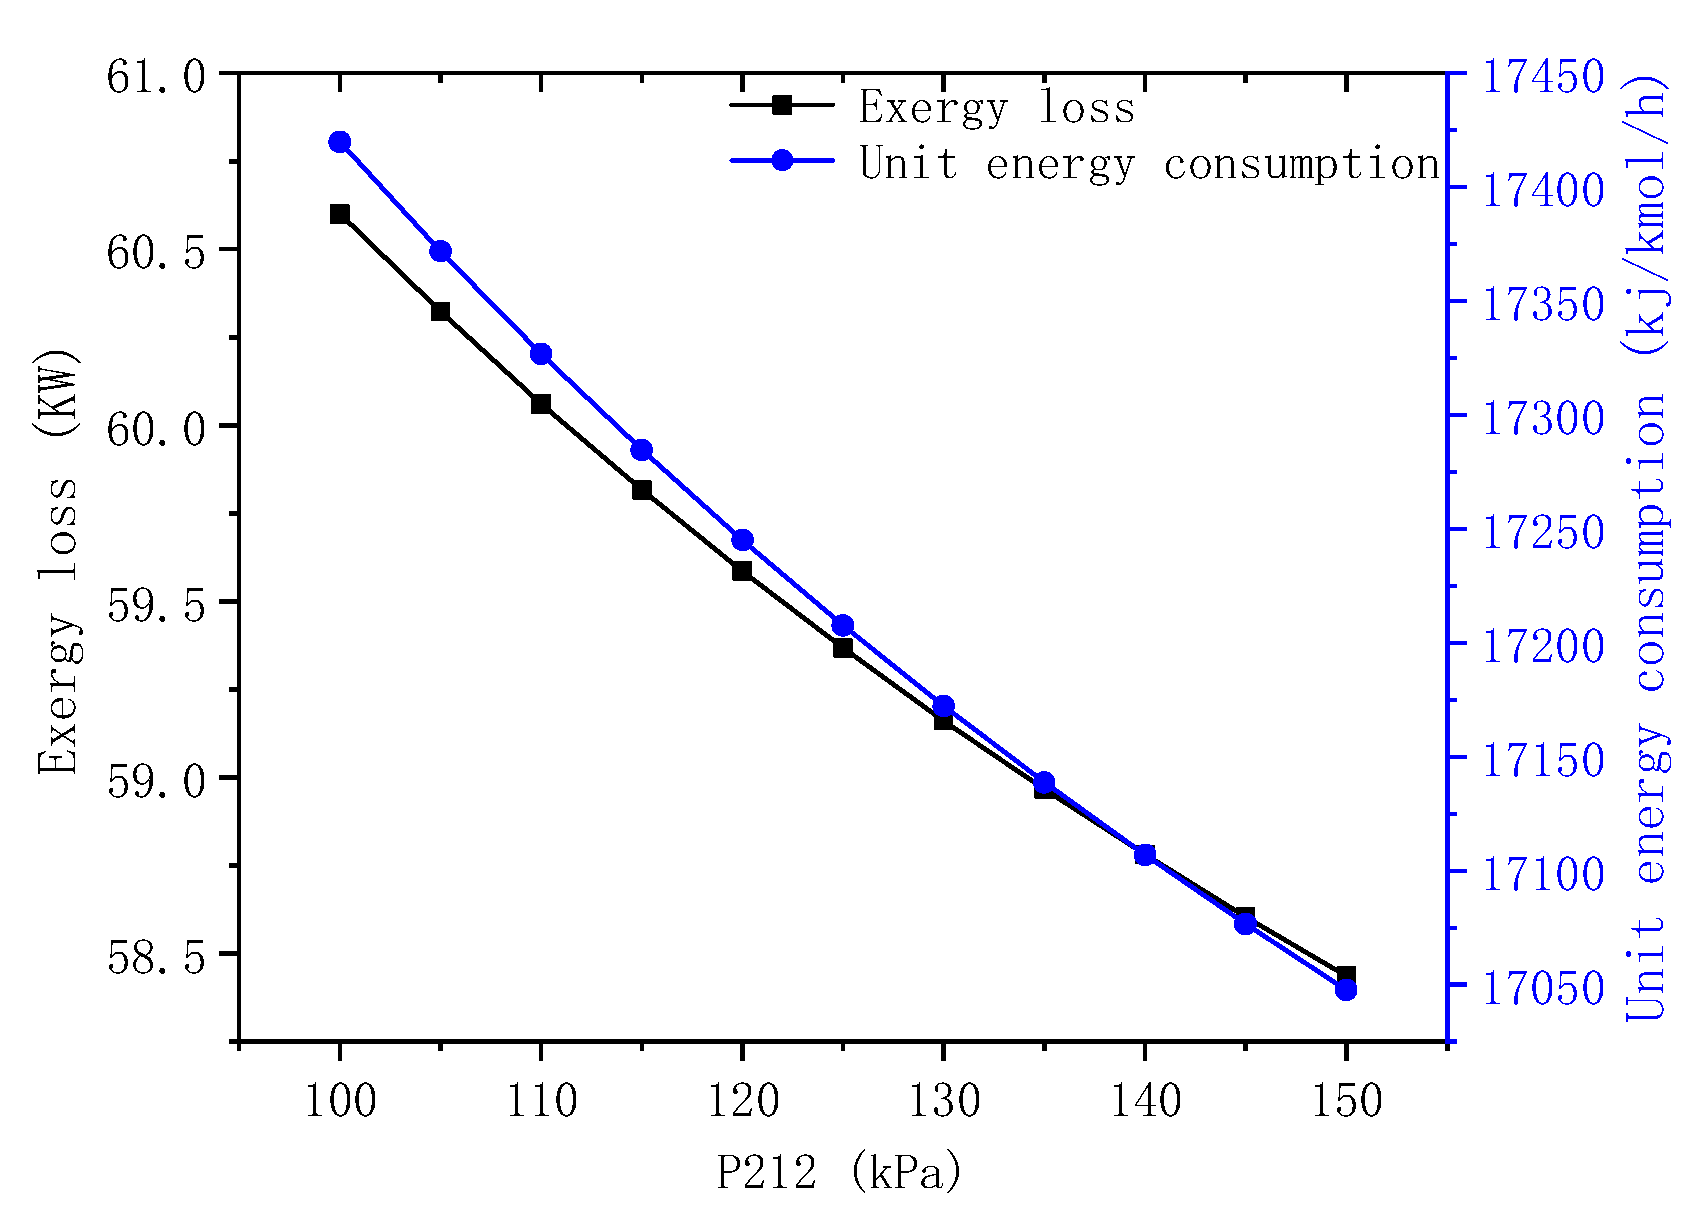
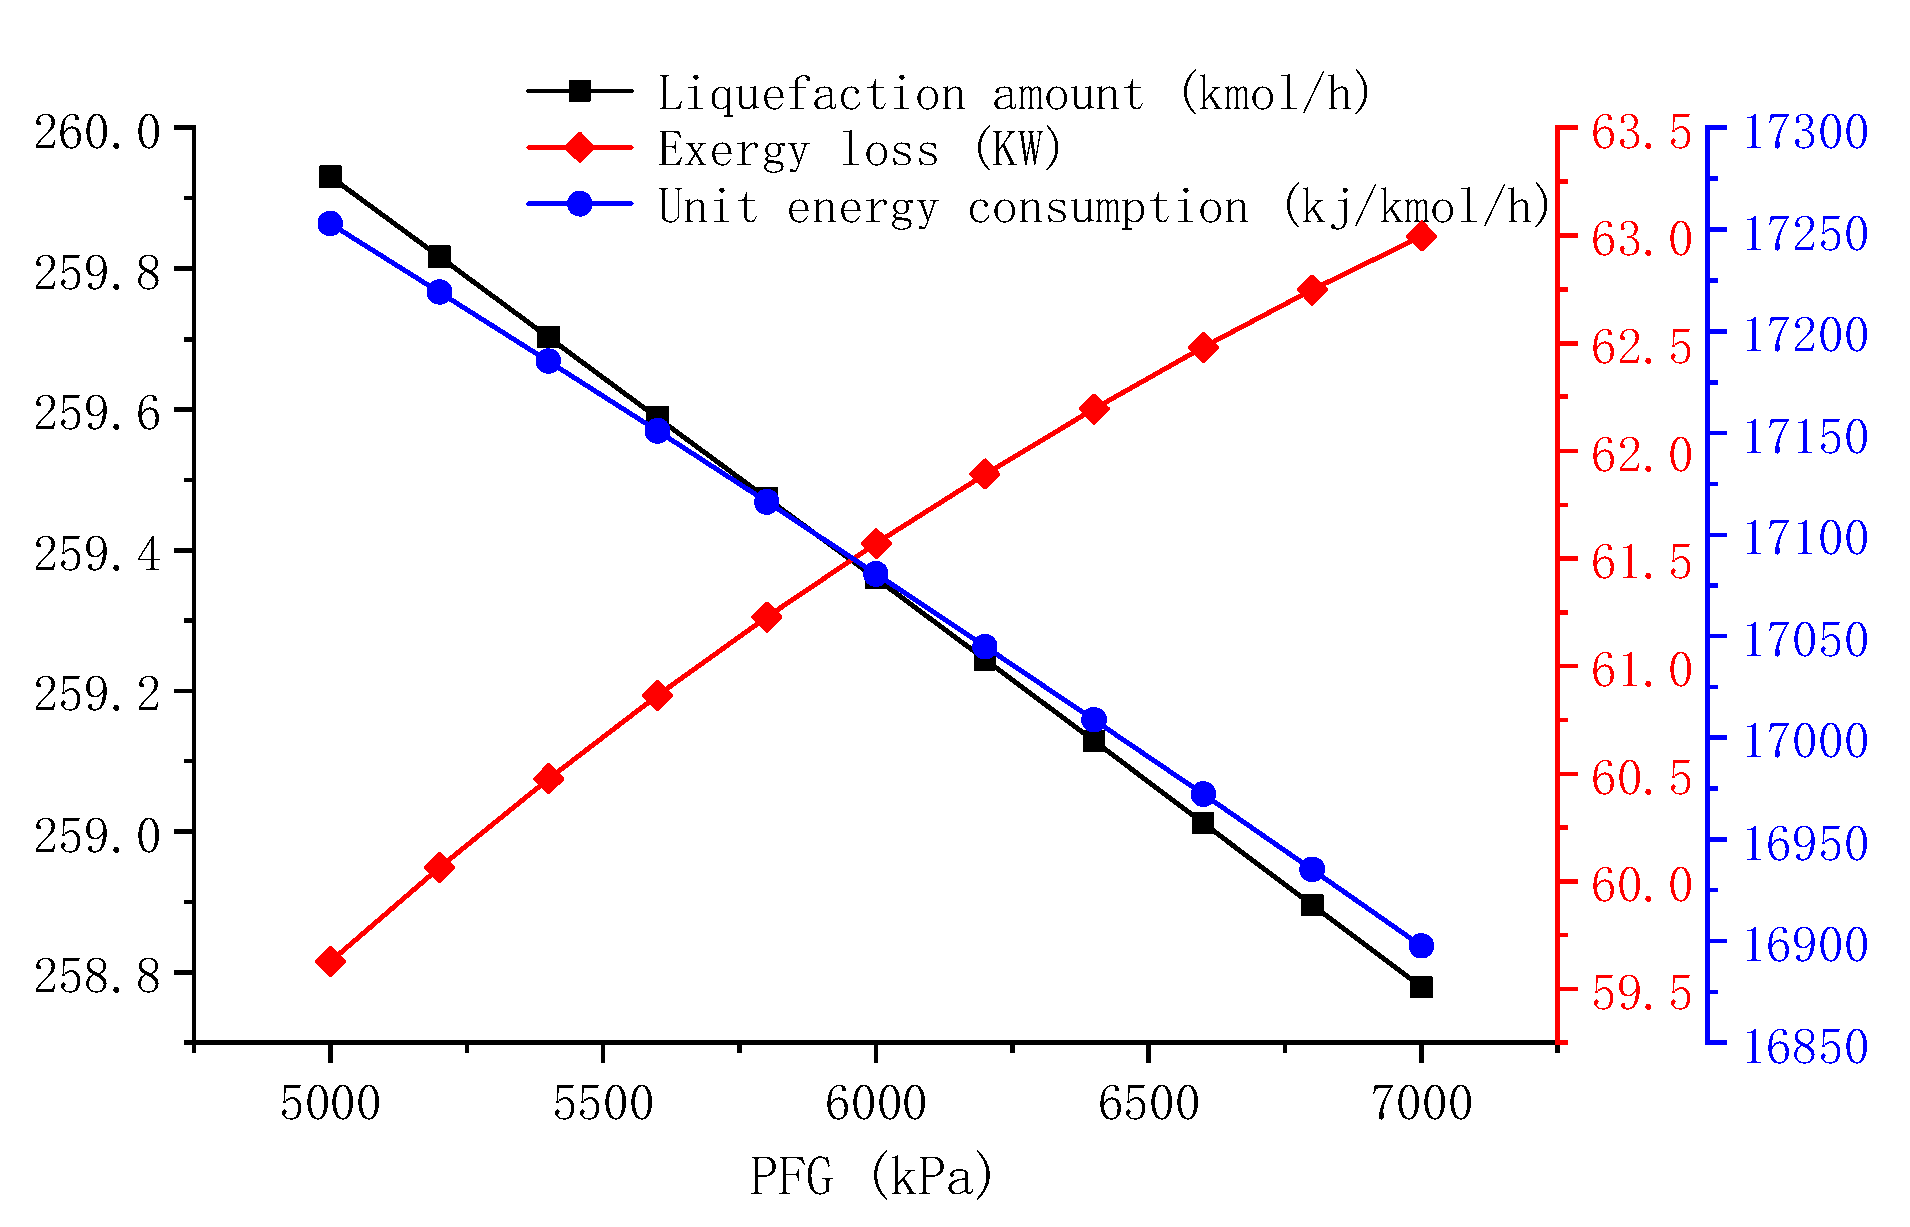
X is the key parameter vector in the liquefaction process; P203, P206, P209 and P212 refer to the main-pressure level, high-pressure level, medium-pressure level and low-pressure level in the liquefaction process, respectively; MC3 and MMR are the mass flow rates of propane and mixed refrigerant, respectively.
The following equipment constraints were established:
(1)
The isentropic efficiency was kept constant at 75%;
(2)
The valve inlet/outlet stream must be liquid;
(3)
Compressor inlet/outlet streams should be vapor;
(4)
The minimum temperature difference must not exceed 2 °C [40].

5. Results and Discussions

5.1. System Description

In this section, I-C3MR with EHR-GWO-GA is optimized by MATLAB, and the process model was constructed by Aspen HYSYS V11 [41]. In addition to Aspen HYSYS, the tools commonly used by chemical engineers include Aspen Plus. In addition to MATLAB, Microsoft Excel (VBA), Python, and Unity (C#) can also exchange data with HYSYS. At present, relevant personnel have done similar research [42].
Aspen HYSYS was used in this paper because it is more mainstream and widely used than Aspen Plus. MATLAB was chosen as the main programming language because it is more mainstream and widely used than other programming languages.
The flow diagram of the improved C3MR is shown in Figure 1, the given parameters are shown in Table 1 and Table 3, and the calculation flow of the EHR-GWO-GA is shown in Figure 7.
The boundaries of the decision variables given in Table 3 are obtained by combining the engineering application and some references [10,11,13,14,15] given in this paper, and the margin is appropriately increased according to the previous experience to ensure the safe operation of the process.
The initial value provided in Table 3 for each variable is only one set of data that the I-C3MR liquefaction process can run and does not mean that this set of data must be used as the starting point of the process. The determination of this set of data has both the requirements of the system on the input parameters and the constraints on the boundary of the system. This initial value is not unique, and the values can be selected in a variety of boundary requirements.

5.2. Optimal Results

5.2.1. Key Node Parameters

The node parameters of the optimal operating environment obtained by the three objective functions of liquefaction amount, unit energy consumption and exergy loss together with E-C3MR are summarized in Table 4.
In addition to the values of the three objective functions, the optimal operating environment node parameters in Table 4 mainly include the input pressure(PFG) and input temperature(TFG), and the main-pressure level(P203), high-pressure level(P206), medium-pressure level(P209) and low-pressure level(P212) in the liquefaction process, and the mass flow rates of propane(MC3) and mixed refrigerant(MMR), and the power consumed by K100-105. All values except the objective function value and the compressor power are the values of the decision variables in the optimization process.

5.2.2. Heat Transfer

Figure 8 illustrates the heat flow and UA of LNG-104 and LNG-105 for E-C3MR. LNG-104 and LNG-105 heat exchangers are the key heat exchange devices of the process. The relationship between heat flow and temperature of the hot composite side is similar to that of the cold composite side, and the correlation between UA and temperature is the same. The thermal composite curve matches well with the cold curve, which could have a relatively low exergy loss.

5.3. Sensitivity Analysis

5.3.1. Effect of the Pressure Level

This section does not involve analyzing the liquefaction amount, and only the impact on unit energy consumption and exergy loss are analyzed.
How the changes in the main-pressure level P203 affect the thermodynamic properties of the system is shown in Figure 9. With the increase of P203, the unit energy consumption increases continuously, while the exergy loss first decreases significantly and then tends to be gentle. The reason is that the increase of P203 makes the cooling capacity stronger, thus sharing the cooling pressure of the remaining streams of the heat exchanger. As P203 continues to increase, it will make the heat exchanger uneven between the flow strands so that the exergy loss tends to decrease first and then level off. However, the compressor associated with P203 is located at the end of the compressor system, and as P203 increases, the pressure difference between the outlet and inlet of the compressor will be further increased, increasing the power required by the compressor system.
How changes in the high-pressure level P206 (a) and the medium-pressure level P209 (b) affect the thermodynamic properties of the system are shown in Figure 10. The compressor associated with P206 and P209 are located at the third and second stages of the compressor system in the C3 cycle. With the increase of P206 and P209, the pressure ratio of the compressor system in the C3 cycle changes. Therefore, the compression system tends to be balanced first, and then the balance is destroyed. The power required for the compression system decreases first and then increases, so the unit energy consumption decreases first and then increases. With the increase of P206, the unit energy consumption decreased significantly at first and then slowly increased. At the same time, the exergy loss reduced considerably at first and then slowly tended to be gentle. The increase of P209 leads to a significant decrease and then an increase in unit energy consumption, while the exergy loss maintains a steady downward trend. This is due to the increase in P206 and P209 directly strengthening the cooling capacity, which in turn shares the cooling pressure of the remaining streams in the heat exchanger, so the exergy loss maintains a downward trend.
How changes in the low-pressure level P212 affect the thermodynamic properties of the system is shown in Figure 11. As P212 increases, both the unit energy consumption and exergy loss decrease significantly. This is mainly due to the enhanced cooling capacity with the increase in P212. Because of the sharing of the cooling pressure of the heat exchangers’ residual flow, the exergy loss maintains a downward trend. Additionally, the compressor associated with P212 is located at the first stage of the compressor system in the C3 cycle; as P212 increases, the compression system tends to balance, and this leads to a reduction in the power required by the compressor system. Therefore, unit energy consumption is reduced.

5.3.2. Effect of Feed Gas Parameters

How the changes in PFG affect the thermodynamic properties of the system is shown in Figure 12. With the increase of PFG, the exergy loss increases, and the liquefaction capacity and unit energy consumption decrease. This occurs because the pressure difference between the system output and the input becomes smaller with the increase of PFG, which reduces the cooling effect, and the result is a lower liquefied amount. From another perspective, with the increase of PFG, the cooling pressure of the residual stream in the heat exchanger decreases, and the power required for the C3 cycle and MR cycle involved in the residual stream unit is reduced. Therefore, the unit energy consumption is reduced. With the increase of PFG, the load on the heat exchanger is correspondingly higher, which increases the exergy loss.
Figure 13 shows the impact of changes in TFG on the thermodynamic properties of the system. As TFG increases, the unit energy consumption and exergy loss continue to increase. This is because the increasing TFG makes the first-stage heat exchanger require a more powerful cooling capacity to cool the NG to the planned temperature. The increase in C3 cycle load leads to a corresponding increase in unit energy consumption and exergy loss. However, the change in liquefaction amount is not depicted in the figure because the temperature of the input terminal only affects the performance of the first-stage heat exchanger and the other devices involved in the C3 cycle and does not affect subsequent devices. Therefore, the liquefaction amount remains unchanged.

5.3.3. Effect of the Mass Flow Rate of the C3MR Cycle

In Figure 14, as MC3 increases, the unit energy consumption and exergy loss increase continuously. In the case of the same pressure ratio, increasing the mass flow rate of the C3 cycle will increase the required power of the compression system, and the unit energy consumption will increase accordingly. The increase in MC3 results in the compressor and heat exchange system bearing more loads under the same working conditions, so the exergy loss also maintains an upward trend.
In Figure 15, the unit energy consumption continuously rises with the increase of MMR, while the exergy loss initially increases and then decreases. The increase in MMR leads to more load on the compressors involved in the MR cycle under the same working conditions, which causes unit energy consumption to keep increasing. The reason for the exergy loss trend is the fact that the cooling pressure of the C3 cycle will be shared with the increased MMR since the C3 cycle’s quantity is more substantial than that of the MR cycle. As MMR increases, device exergy loss involved in the MR cycle increases. However, device exergy loss involved in the C3 cycle reduces, and the exergy loss of the whole system is also reduced.
The change in the value of the decision variables involved in Section 5.3.1 and Section 5.3.3 does not affect the amount of liquefaction but only affects the unit energy consumption and exergy loss of the system. The reason is that the liquefaction amount of natural gas is simply determined by the outlet/inlet pressure and the outlet/inlet temperature. The change in the value of the intermediate variable does not affect the liquefaction amount. Therefore, when there is no change in the amount of liquefaction, there is no redundant analysis.

5.4. Comparative Analysis

The liquefaction amount, unit energy consumption of T-C3MR, I-C3MR, and E-C3MR are shown in Figure 16. Compared to T-C3MR, the liquefaction amount of I-C3MR is increased from 240.83 kmol/h to 259.90 kmol/h, and the unit energy consumption of I-C3MR is decreased from 22,263.20 kJ/kmol to 17,252.70 kJ/kmol. Compared to I-C3MR, although E-C3MR keeps the liquefaction amount unchanged, the unit energy consumption is decreased from 17,252.70 kJ/kmol to 17,086 kJ/kmol.
Figure 17 shows the exergy loss of each device in T-C3MR, I-C3MR, and E-C3MR. From Figure 1 and Figure 17, it can be seen in Table 5 that compressors and water coolers contribute to the primary proportion of total exergy loss in the E-C3MR, accounting for 32.7% and 33.8%, respectively. Therefore, the compressors and water coolers contribute to the primary proportion of total exergy loss. The results indicate that compared to T-C3MR, I-C3MR could reduce the exergy loss from 79.83 kW to 60.76 kW. Compared to I-C3MR, E-C3MR could reduce the exergy loss from 60.76 kW to 58.55 kW.
Finally, compared to T-C3MR, in E-C3MR, the liquefaction amount is increased from 240.83 kmol/h to 259.91 kmol/h, and the increase is about 8%; the unit energy consumption is decreased from 22,263.20 kJ/kmol to 17,086 kJ/kmol, and the reduction is about 23.3%; the exergy loss is reduced from 79.83 kW to 58.55 kW, and the reduction is about 26.7%.
The mainstream natural gas liquefaction processes are shown in Table 5. The T-C3MR, LNG process using pressure exergy [34], N2-CH4 cycle process (N2/CH4) [43], the new MRC proposed by Cao W. [43], and CO2 pre-cooling N2 expander cycle process (N2/CO2) [44] are compared with the process presented in this paper. Not all of the studies use the exergy loss as the objective function of the analysis process, so there is no data comparison of the exergy loss in Table 6. From Table 6, it can be seen that the process presented in this paper achieves lower energy consumption per unit and higher liquefaction rates than the mainstream process.

6. Conclusions

In this paper, an improved C3MR process is designed. Then, a new multi-objective optimization strategy, which is named EHR-GWO-GA, is applied to the optimization of the natural gas liquefaction process, maximizing the liquefaction amount, minimizing unit energy consumption and minimizing exergy loss.
Based on the traditional genetic algorithm, this paper proposed a new optimization algorithm called EHR-GWO-GA. This optimization method can be applied to other optimization problems. Therefore, it is highly adaptable to other liquefied natural gas systems. Based on the improvement of the process, the BOG that should be discarded is refluxed to the heat exchanger so that its excellent low-temperature performance can be reused. This idea can be applied to various liquefaction processes.
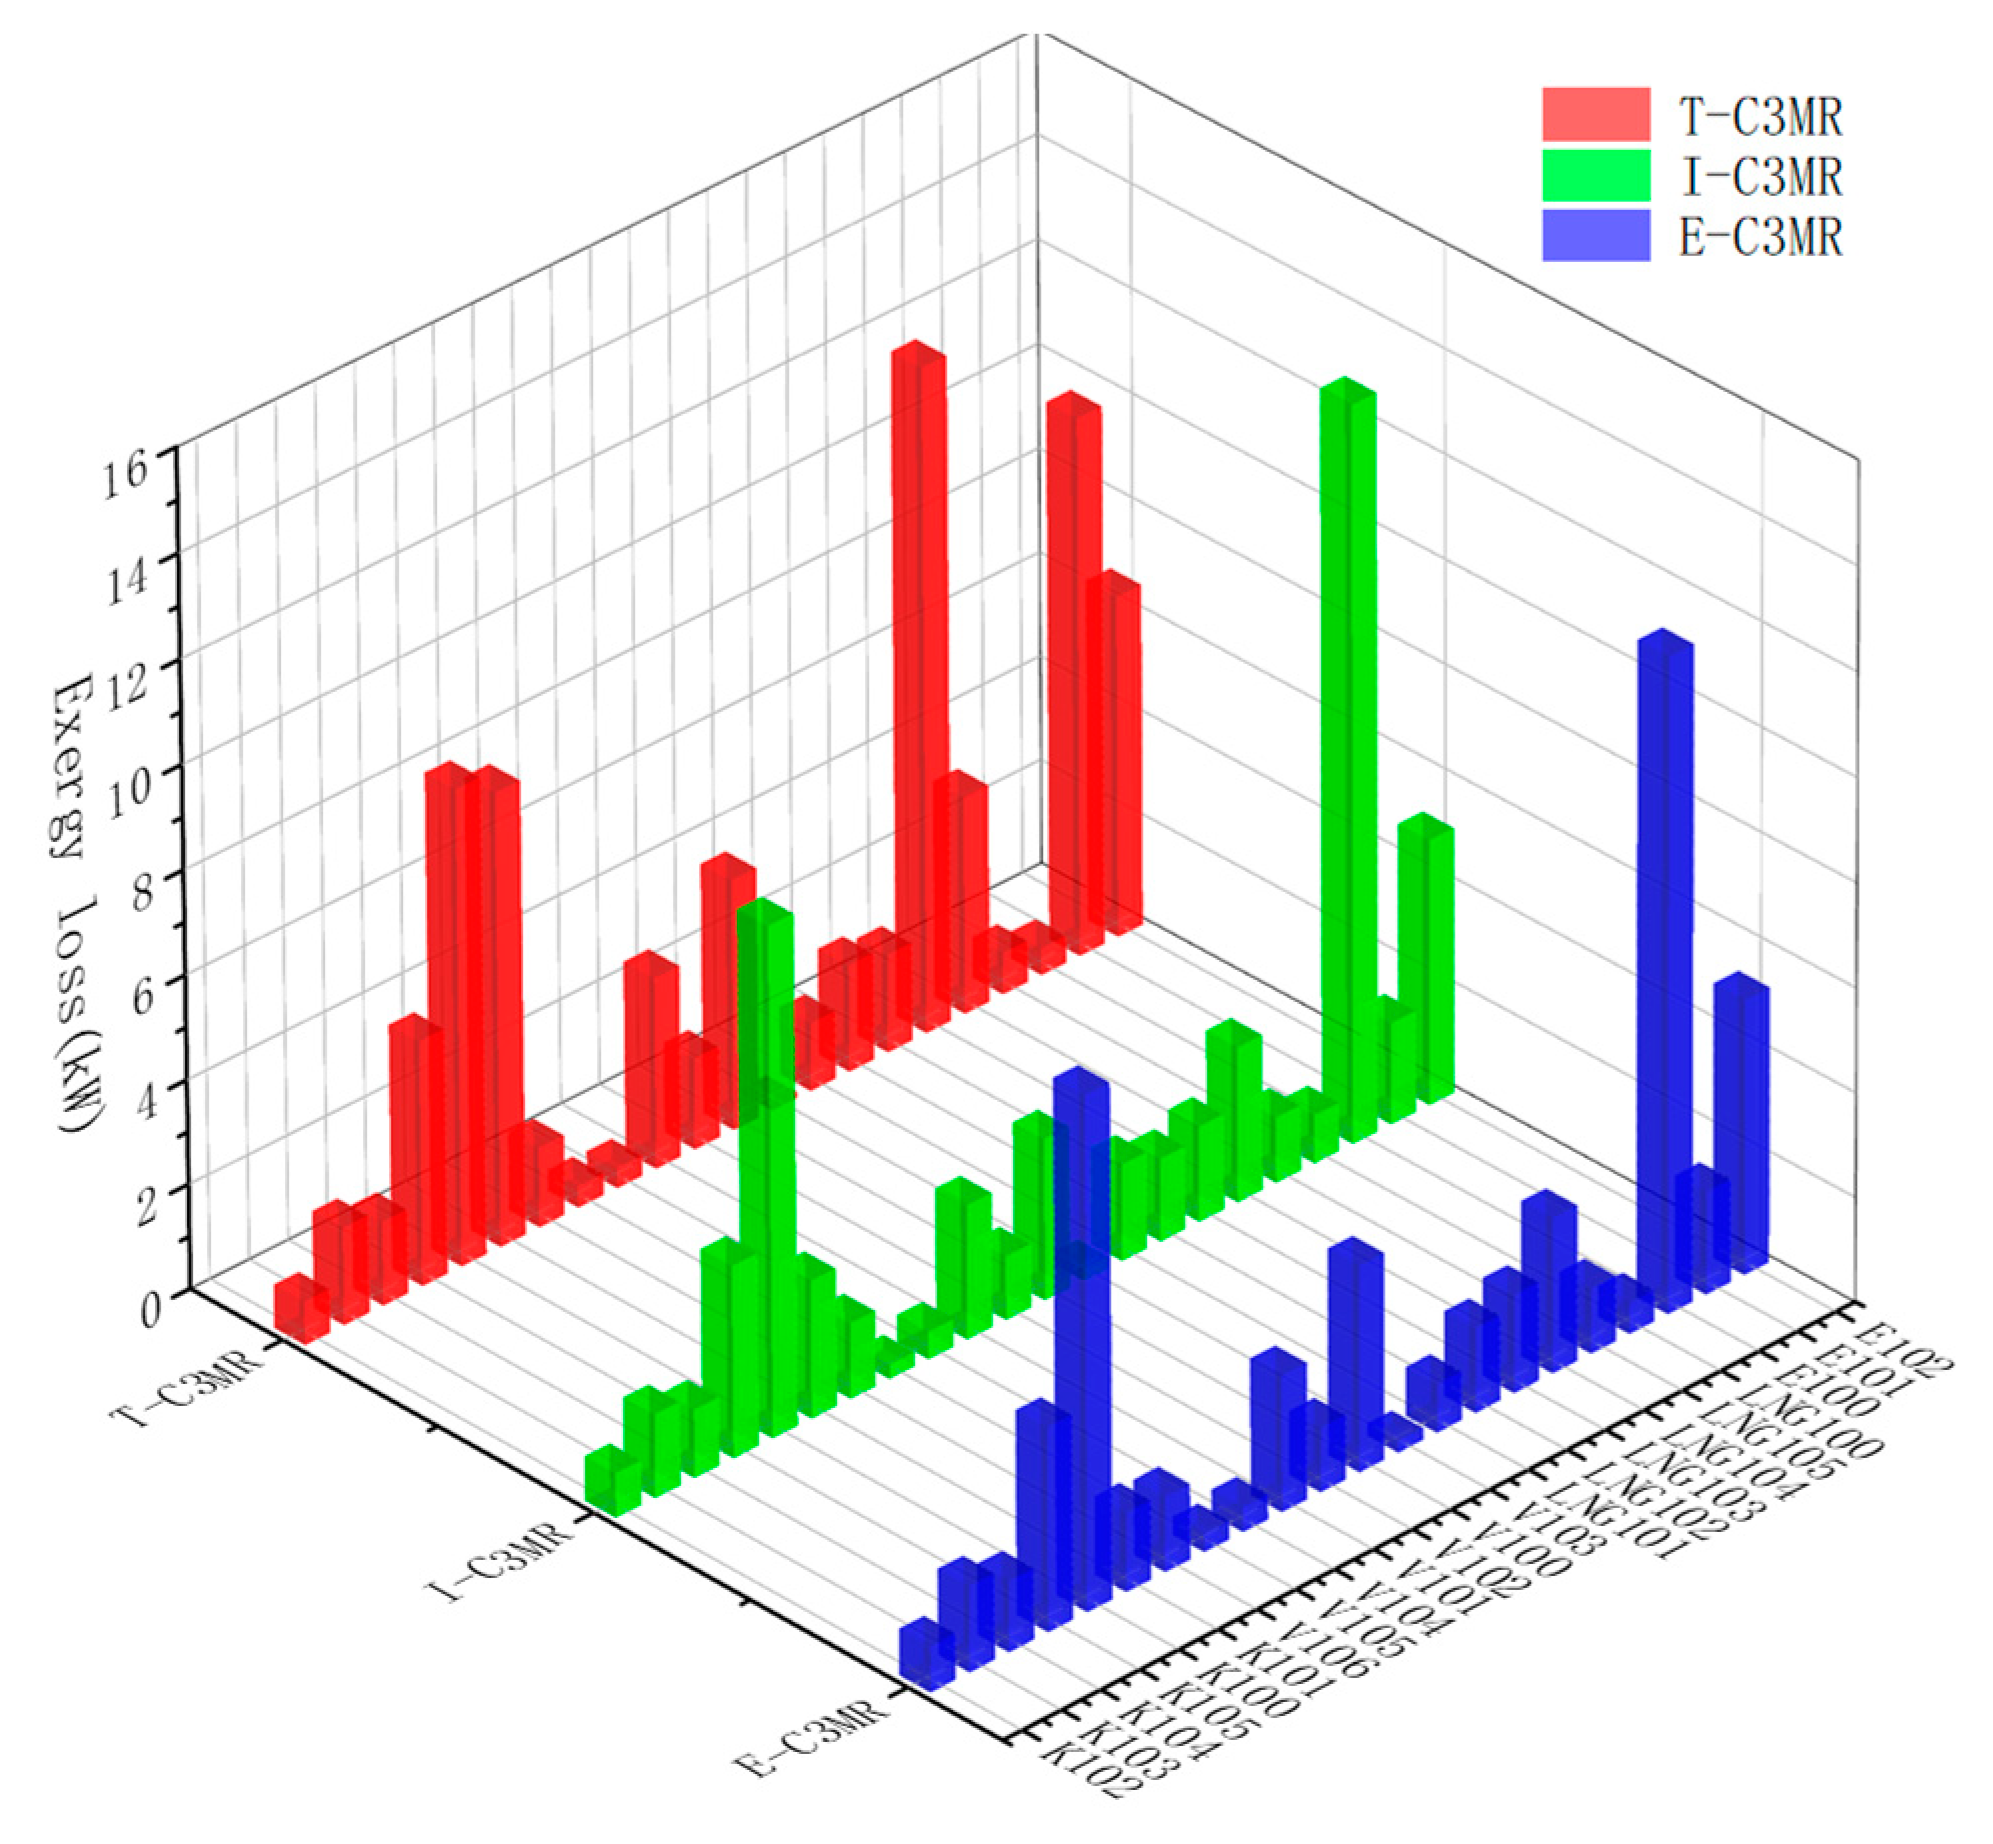
Based on the optimization results, the impact of key variables on unit energy consumption, exergy loss, and liquefaction amount were further investigated. Then, the paper presents an exergy analysis of the system, and compressors and water coolers contribute to the primary proportion of total exergy loss.
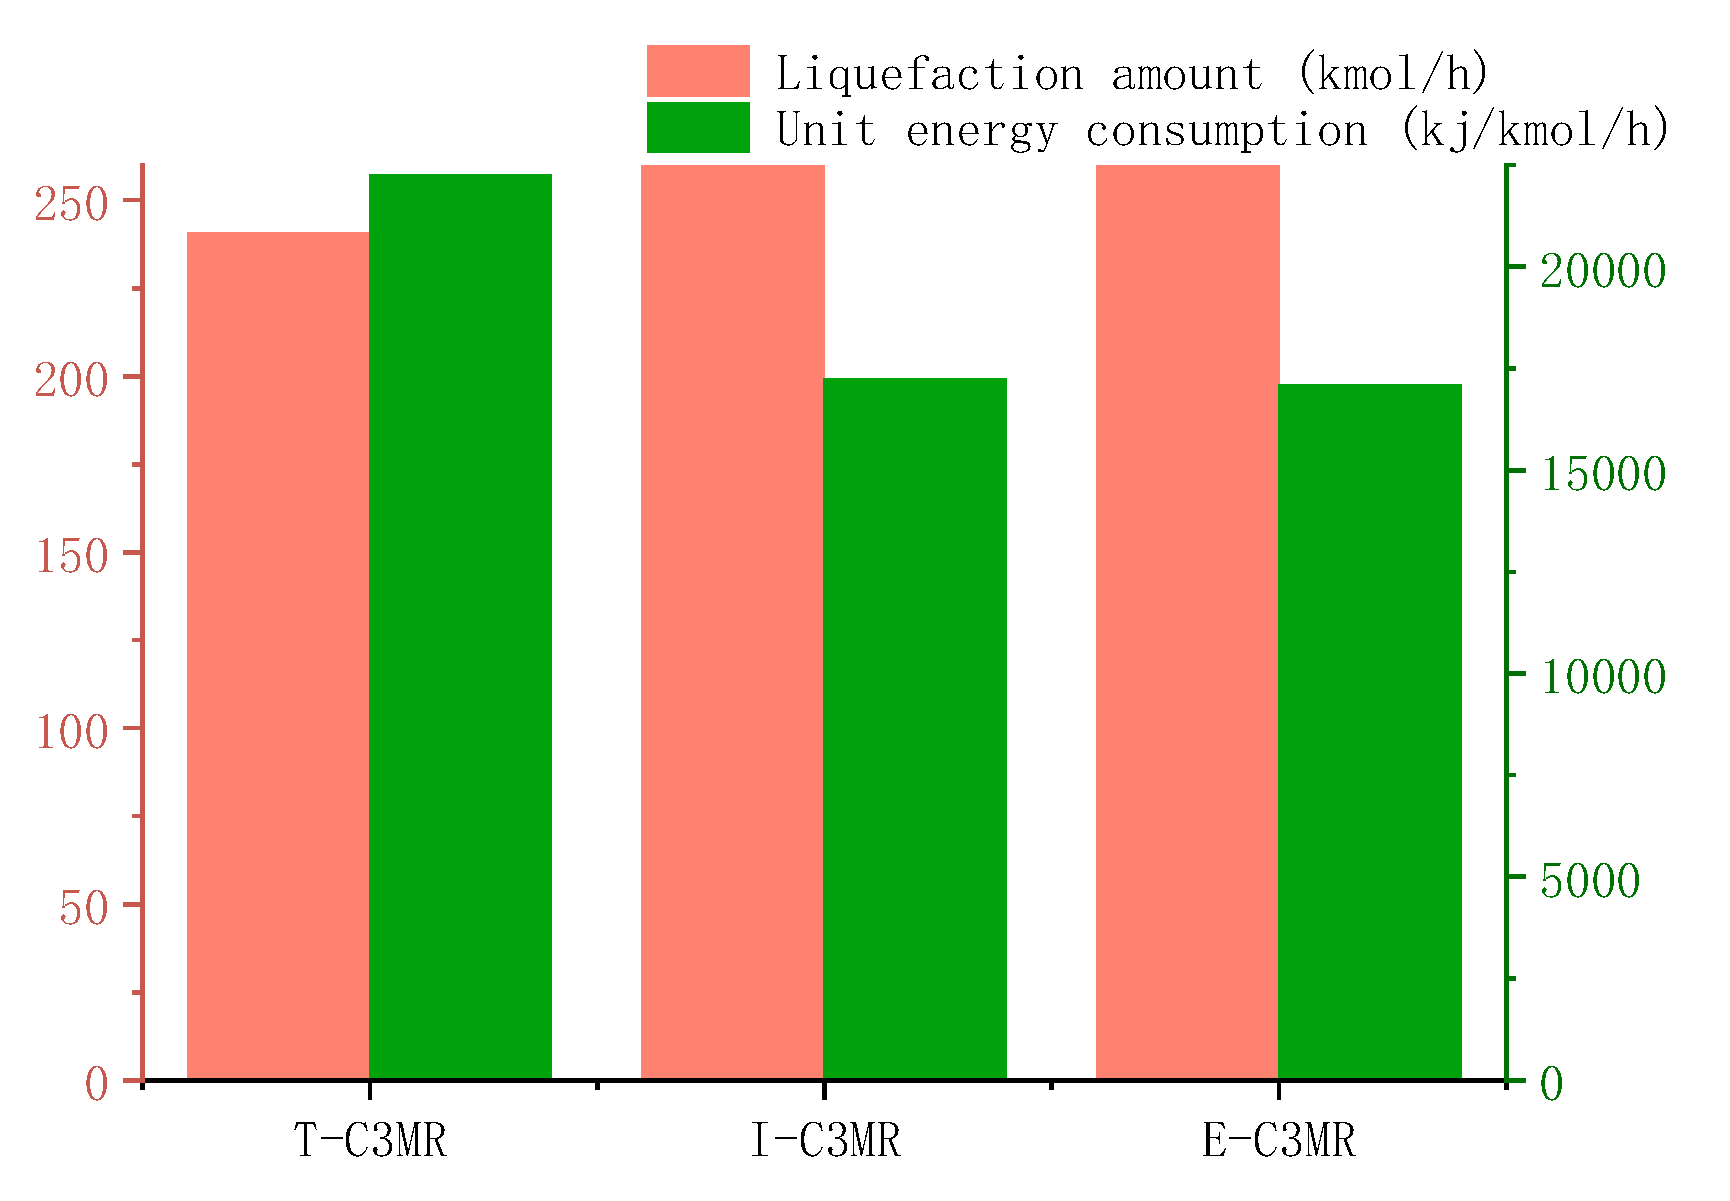
The results show that compared to traditional C3MR (T-C3MR), in improved C3MR based on EHR-GWO-GA (E-C3MR), the liquefaction amount is increased from 240.83 kmol/h to 259.91 kmol/h, and increased the liquefaction amount by about 8%; the unit energy consumption is decreased from 22,263.20 kJ/kmol to 17,086 kJ/kmol, and reduced the unit energy consumption by about 23.3%. The exergy loss is reduced from 79.83 kW to 58.55 kW, which reduces the exergy loss by almost 26.7%.

Supplementary Materials

The following supporting information can be downloaded at: https://www.mdpi.com/article/10.3390/pr12030542/s1.

Author Contributions

Conceptualization, F.C. and L.P.; methodology, F.C. and F.S.; software, J.C.; formal analysis, Y.P. and L.P.; investigation, F.C. and Y.P.; resources, F.C. and L.P.; data curation, Y.L.; writing—original draft preparation, F.C.; writing—review and editing, F.C. and L.P.; supervision, L.P. and Y.L. All authors have read and agreed to the published version of the manuscript.

Funding

This research received no external funding.

Data Availability Statement

The data are contained within the article or Supplementary Material. The original contributions proposed in the study include the process parameters of the improved liquefaction process and the new optimization algorithm. Some parameters of the process and the idea of algorithm improvement are introduced in detail in the article, and the optimization algorithm code is in the Supplementary Material. Further inquiries can be directed to the corresponding author.

Conflicts of Interest

The authors declare no conflicts of interest.

References

  1. Son, H.; Austbø, B.; Gundersen, T.; Hwang, J.; Lim, Y. Techno-economic versus energy optimization of natural gas liquefaction processes with different heat exchanger technologies. Energy 2022, 245, 123232. [Google Scholar] [CrossRef]
  2. Qyyum, M.A.; Yasin, M.; Nawaz, A.; He, T.; Ali, W.; Haider, J.; Qadeer, K.; Nizami, A.-S.; Moustakas, K.; Lee, M. Single-solution-based vortex search strategy for optimal design of offshore and onshore natural gas liquefaction processes. Energies 2020, 13, 1732. [Google Scholar] [CrossRef]
  3. Furda, P.; Variny, M.; Labovska, Z. Towards time-effective optimization: Enviro-economic study of the C3MR LNG process. Energy Convers. Manag. 2022, 260, 115602. [Google Scholar] [CrossRef]
  4. Wang, Z.; Han, F.; Ji, Y.; Li, W. Combined Analysis of Parameter Sensitivity and Exergy for Natural Gas Liquefaction in Cryogenic Fuel Production Process. Processes 2020, 8, 561. [Google Scholar] [CrossRef]
  5. Lee, I.; Moon, I. Total cost optimization of a single mixed refrigerant process based on equipment cost and life expectancy. Ind. Eng. Chem. Res. 2016, 55, 10336–10343. [Google Scholar] [CrossRef]
  6. Lee, I.; Moon, I. Economic optimization of dual mixed refrigerant liquefied natural gas plant considering natural gas extraction rate. Ind. Eng. Chem. Res. 2017, 56, 2804–2814. [Google Scholar] [CrossRef]
  7. Lee, I.; Moon, I. Strategies for process and size selection of natural gas liquefaction processes: Specific profit portfolio approach by economic based optimization. Ind. Eng. Chem. Res. 2017, 57, 5845–5857. [Google Scholar] [CrossRef]
  8. Jin, C.; Son, H.; Lim, Y. Optimization and economic analysis of liquefaction processes for offshore units. Appl. Therm. Eng. 2019, 163, 114334. [Google Scholar] [CrossRef]
  9. He, T.; Lin, W. Energy saving and production increase of mixed refrigerant natural gas liquefaction plants by taking advantage of natural cold sources in winter. J. Clean. Prod. 2021, 299, 126884. [Google Scholar] [CrossRef]
  10. Park, J.; Mun, H.; Kim, J.; Lee, I. Advanced natural gas liquefaction process on LNG supply chain with liquid air: From design to thermodynamic and techno-economic analyses. Energy Convers. Manag. 2022, 252, 115107. [Google Scholar] [CrossRef]
  11. Hajji, A.; Chahartaghi, M.; Kahani, M. Thermodynamic analysis of natural gas liquefaction process with propane pre-cooled mixed refrigerant process (C3MR). Cryogenics 2019, 103, 102978. [Google Scholar] [CrossRef]
  12. Ghorbani, B.; Shirmohammadi, R.; Mehrpooya, M.; Hamedi, M.H. Structural, operational and economic optimization of cryogenic natural gas plant using NSGAII two-objective genetic algorithm. Energy 2018, 159, 410–428. [Google Scholar] [CrossRef]
  13. Rao, H.N.; Nair, S.K.; Karimi, I.A. Operational optimization of processes with multistream heat exchangers using data-driven predictive modeling. Ind. Eng. Chem. Res. 2019, 58, 5838–5850. [Google Scholar] [CrossRef]
  14. Wang, X.; Li, M.; Cai, L.; Li, Y. Propane and iso-butane pre-cooled mixed refrigerant liquefaction process for small-scale skid-mounted natural gas liquefaction. Appl. Energy 2020, 275, 115333. [Google Scholar] [CrossRef]
  15. Primabudi, E.; Morosuk, T.; Tsatsaronis, G. Multi-objective optimization of propane pre-cooled mixed refrigerant (C3MR) LNG process. Energy 2019, 185, 492–504. [Google Scholar] [CrossRef]
  16. Sabbagh, O.; Fanaei, M.A.; Arjomand, A. Optimal design of a novel NGL/LNG integrated scheme: Economic and exergetic evaluation. J. Therm. Anal. Calorim. 2021, 145, 851–866. [Google Scholar] [CrossRef]
  17. Ali, W.; Khan, M.S.; Qyyum, M.A.; Lee, M. Surrogate-assisted modeling and optimization of a natural-gas liquefaction plant. Comput. Chem. Eng. 2018, 118, 132–142. [Google Scholar] [CrossRef]
  18. Sabbagh, O.; Fanaei, M.A.; Arjomand, A.; Ahmadi, M.H. Multi-objective optimization assessment of a new integrated scheme for co-production of natural gas liquids and liquefied natural gas. Sustain. Energy Technol. Assess. 2021, 47, 101493. [Google Scholar] [CrossRef]
  19. Geng, J.; Sun, H. A novel integrated hydrogen and natural gas liquefaction process utilizing a modified double mixed refrigerant process pre-cooling system. Appl. Therm. Eng. 2023, 224, 120085. [Google Scholar] [CrossRef]
  20. Jin, C.; Yuan, Y.; Son, H.; Lim, Y. Novel propane-free mixed refrigerant integrated with nitrogen expansion natural gas liquefaction process for offshore units. Energy 2022, 238, 121765. [Google Scholar] [CrossRef]
  21. Li, S.; Zhao, Z.; Chen, Z.; Zeng, W.; Gong, H. Optimization and analysis of thermodynamic performance of boil-off gas reliquefication system with multiple refrigerant combinations. Sustain. Energy Technol. Assess. 2021, 47, 101408. [Google Scholar] [CrossRef]
  22. Awad, P.; Kimura, N.; Inoue, G.; Tsuge, Y. Energetic Minimization of Liquefied Natural Gas Single Nitrogen Expander Process Using Real Coded Genetic Algorithm. J. Chem. Eng. Jpn. 2019, 52, 130–137. [Google Scholar] [CrossRef]
  23. He, T.; Lin, W. Energy saving research of natural gas liquefaction plant based on waste heat utilization of gas turbine exhaust. Energy Convers. Manag. 2020, 225, 113468. [Google Scholar] [CrossRef]
  24. Park, J.; You, F.; Mun, H.; Lee, I. Liquefied natural gas supply chain using liquid air as a cold carrier: Novel method for energy recovery. Energy Convers. Manag. 2020, 227, 113611. [Google Scholar] [CrossRef]
  25. Nadimi-Shahraki, M.H.; Taghian, S.; Mirjalili, S. An improved grey wolf optimizer for solving engineering problems. Expert Syst. Appl. 2020, 166, 113917. [Google Scholar] [CrossRef]
  26. Sankaranarayanan, S.; Swaminathan, G.; Sivakumaran, N.; Radhakrishnan, T.K. A novel hybridized grey wolf optimzation for a cost optimal design of water distribution network. In Proceedings of the 2017 Computing Conference, London, UK, 18–20 July 2017. [Google Scholar] [CrossRef]
  27. Asaithambi, S.; Rajappa, M.; Ravi, L. Optimization and control of CMOS analog integrated circuits for cyber-physical systems using hybrid grey wolf optimization algorithm. J. Intell. Fuzzy Syst. 2019, 36, 4235–4245. [Google Scholar] [CrossRef]
  28. Mjahed, S.; Bouzaachane, K.; Taher Azar, A.; El Hadaj, S.; Raghay, S. Hybridization of fuzzy and hard semi-supervised clustering algorithms tuned with ant lion optimizer applied to higgs boson search. Comput. Model. Eng. Sci. 2020, 125, 459–494. [Google Scholar] [CrossRef]
  29. Khan, A.R.; Khan, S.; Harouni, M.; Abbasi, R.; Iqbal, S.; Mehmood, Z. Brain tumor segmentation using k-means clustering and deep learning with synthetic data augmentation for classification. Microsc. Res. Tech. 2021, 84, 1389–1399. [Google Scholar] [CrossRef]
  30. Khan, Z.; Koubaa, A.; Fang, S.; Lee, M.Y.; Muhammad, K. A connectivity-based clustering scheme for intelligent vehicles. Appl. Sci. 2021, 11, 2413. [Google Scholar] [CrossRef]
  31. Chrz, V. Cryogenic Mixed Refrigerant Processes. Int. J. Refrig. 2010, 33, 648–649. [Google Scholar] [CrossRef]
  32. Peng, D.Y.; Robinson, D.B. A new two-constant equation of state. Ind. Eng. Chem. Fundam. 1976, 15, 59–64. [Google Scholar] [CrossRef]
  33. Mansour, E.; Desouky, S.; Batanoni, M.; Mahmoud, M.; Farag, A.; El-Dars, F. Modification proposed for SRK equation of state. Oil Gas J. 2012, 110, 78–91. [Google Scholar]
  34. Guo, H.; Tang, Q.; Gong, M.; Cheng, K. Optimization of a novel liquefaction process based on Joule–Thomson cycle utilizing high-pressure natural gas exergy by genetic algorithm. Energy 2018, 151, 696–706. [Google Scholar] [CrossRef]
  35. Zakaria, N.F.; Zulkifley, M.A.; Mustafa, M.M. Genetic algorithm. In Encyclopedic Reference of Genomics and Proteomics in Molecular Medicine; Springer: Berlin/Heidelberg, Germany, 2002. [Google Scholar] [CrossRef]
  36. Deb, K.; Pratap, A.; Agarwal, S.; Meyarivan, T. A fast and elitist multiobjective genetic algorithm: NSGA-II. IEEE Trans. Evol. Comput. 2002, 6, 182–197. [Google Scholar] [CrossRef]
  37. Farhy, L.S. Modeling of oscillations in endocrine networks with feedback. In Methods in Enzymology; Academic Press: Cambridge, MA, USA, 2004; Volume 384, pp. 54–81. [Google Scholar] [CrossRef]
  38. Mirjalili, S.; Mirjalili, S.M.; Lewis, A. Grey wolf optimizer. Adv. Eng. Softw. 2014, 69, 46–61. [Google Scholar] [CrossRef]
  39. Abualigah, L.; Diabat, A.; Mirjalili, S.; Elaziz, M.A.; Gandomi, A.H. The arithmetic optimization algorithm. Comput. Methods Appl. Mech. Eng. 2021, 376, 113609. [Google Scholar] [CrossRef]
  40. Popov, D.; Fikiin, K.; Stankov, B.; Alvarez, G.; Youbi-Idrissi, M.; Damas, A.; Evans, J.; Brown, T. Cryogenic heat exchangers for process cooling and renewable energy storage: A review. Appl. Therm. Eng. 2019, 153, 275–290. [Google Scholar] [CrossRef]
  41. Aspen Technology, Inc. Aspen and Hysys Software. 2020. Available online: www.aspentech.com (accessed on 18 January 2024).
  42. Bartolome, P.S.; Gerven, T.V. A comparative study on Aspen Hysys interconnection methodologies. Comput. Chem. Eng. 2022, 162, 107785. [Google Scholar] [CrossRef]
  43. Wensheng, C. Natural Gas Liquefaction Process for Small-scale LNG Project. In Proceedings of the 2012 International Conference on Computer Distributed Control and Intelligent Environmental Monitoring, Zhangjiajie, China, 5–6 March 2012. [Google Scholar] [CrossRef]
  44. Yuan, Z.; Cui, M.; Xie, Y.; Li, C. Design and analysis of a small-scale natural gas liquefaction process adopting single nitrogen expansion with carbon dioxide pre-cooling. Appl. Therm. Eng. 2014, 64, 139–146. [Google Scholar] [CrossRef]
Figure 1. Improved C3MR liquefaction process.
Processes 12 00542 g001
Figure 2. The Hill function: (a) rising figure; (b) falling figure.
Processes 12 00542 g002
Figure 3. The directional mechanism of EHR-GA with GWO.
Processes 12 00542 g003
Figure 4. Calculation flow of EHR-GWO-GA.
Processes 12 00542 g004
Figure 5. Three-dimensional graph of test function: (a) f1(x); (b) f2(x); (c) f3(x); (d) f4(x); (e) f5(x); and (f) f6(x).
Processes 12 00542 g005aProcesses 12 00542 g005b
Figure 6. Optimization convergence curve: (a) f1(x); (b) f2(x); (c) f3(x); (d) f4(x); (e) f5(x); and (f) f6(x).
Processes 12 00542 g006aProcesses 12 00542 g006b
Figure 7. The calculation process of the optimization process is based on EHR-GWO-GA.
Processes 12 00542 g007
Figure 8. (a,b) Composite curve of heat exchangers.
Processes 12 00542 g008
Figure 9. Effect of the main-pressure level on thermodynamic properties.
Processes 12 00542 g009
Figure 10. (a,b) Effect on the thermodynamic properties.
Processes 12 00542 g010
Figure 11. Effect of the low-pressure level on thermodynamic properties.
Processes 12 00542 g011
Figure 12. Effect of input pressure of NG on thermodynamic properties.
Processes 12 00542 g012
Figure 13. Effect of input temperature of NG on thermodynamic properties.
Processes 12 00542 g013
Figure 14. Effect of the cycle mass flow rate of C3 on thermodynamic properties.
Processes 12 00542 g014
Figure 15. Effect of the mass flow rate of MR on thermodynamic properties.
Processes 12 00542 g015
Figure 16. Comparison of the objective of processes.
Processes 12 00542 g016
Figure 17. The exergy losses of devices.
Processes 12 00542 g017
Table 1. Process parameters [9,10,11,12,13,14,15].
ParameterValue
Feed natural gas pressure6500 kPa
Feed natural gas temperature25 °C
Feed natural gas mass flow rate5000 kg/h
Feed natural gas mole fraction compositionCH40.8748
C2H60.0550
C3H80.0212
i-C4H100.0089
N20.0401
C3 mass flow rate17,000 kg/h
MR mass flow rate10,000 kg/h
MR mole fraction compositionCH40.42
C2H60.3
C3H80.21
N20.07
LNG storage pressure110 kPa
Pressure drops of heat exchangers and water coolers20 kPa
Ambient temperature25 °C
Insulation efficiency of the compressor75%
The lowest approaching temperature of the heat exchanger2 °C
Table 2. Test function.
Test FunctionnHunting ZoneOptimal
f 1 x = i = 1 n j = 1 i x j 2 30[–100, 100]0
f 2 x = m a x i x i , 1 i n 30[–100, 100]0
f 3 x = i = 1 n x i 2 30[–100, 100]0
f 4 x = 20 exp 0.2 1 n i = 1 n x i 2 exp 1 n i n cos 2 π x i + 20 + e 30[–20, 20]0
f 5 x = i = 1 n x i + i = 1 n x i 30[–100, 100]0
f 6 x = i = 1 n i x i 4 + r a n d o m [ 0 , 1 ) 30[–1.28, 1.28]0
Table 3. Bounds of main variables.
VariableLower BoundUpper BoundInitialization Value
Main-Pressure Level (kPa)5901000800
High-pressure level (kPa)370650520
Medium-pressure level (kPa)250350270
Low-pressure level (kPa)100150130
C3 Mass flow rate (kg/h)15,00020,00017,000
MR Mass flow rate (kg/h)700013,00010,000
Input pressure (kPa)500070006500
Input temperature (°C)103525
Table 4. Optimal nodal parameters and objective function values under E-C3MR.
Key ParameterE-C3MR
Input pressure (kPa)6440
Input temperature (°C)19
Main-Pressure Level (kPa)790
High-pressure level (kPa)533
Medium-pressure level (kPa)270
Low-pressure level (kPa)120
C3 Mass flow rate (kg/h)16,300
MR Mass flow rate (kg/h)7020
W100 (kW)710.74
W101 (kW)151.02
W102 (kW)35.90
W103 (kW)71.94
W104 (kW)62.13
W105 (kW)198.03
Liquefaction amount (kmol/h)259.91
Unit energy consumption (kJ/kmol)17,086.29
Exergy loss (kW)58.55
Table 5. The exergy losses of the E-C3MR.
Types of EquipmentValue of the Exergy Loss (kW) Percentage (%)
Compactors19.13332.7
Water coolers19.77833.8
Heat exchangers9.30415.8
Valve10.33817.7
Table 6. Comparison of the thermodynamic properties of the process in this paper with those of conventional processes.
Process ParametersT-C3MRN2/CH4Pressure ExergyMEW/MRCN2/CO2E-C3MR
Liquefaction rate(%)879036907794
Unit energy consumption(kJ/kmol)22,24863,64897229,34035,64017,086
Number of key equipmentCompressor625246
Expander010010
Heat exchanger635336
Separator421424
Valve725427
Disclaimer/Publisher’s Note: The statements, opinions and data contained in all publications are solely those of the individual author(s) and contributor(s) and not of MDPI and/or the editor(s). MDPI and/or the editor(s) disclaim responsibility for any injury to people or property resulting from any ideas, methods, instructions or products referred to in the content.

