Article

An Experimental Study on Nodular Iron Machined Surfaces Utilizing a Capable 2D Finite Element Model for Precise Surface Roughness Estimation

1
Department of Mechanical Engineering, Faculty of Engineering, Haliç University, Istanbul 34060, Turkey
2
Department of Mechanical Engineering, Faculty of Engineering & Natural Sciences, Bursa Technical University, Bursa 16330, Turkey
*
Author to whom correspondence should be addressed.
Processes 2024, 12(3), 549; https://doi.org/10.3390/pr12030549
Submission received: 12 February 2024 / Revised: 5 March 2024 / Accepted: 9 March 2024 / Published: 11 March 2024

Abstract

:
Nodular iron plays a crucial role in various industries, especially in large-scale applications such as gearboxes. Ensuring that nodular iron remains free from oil leakage and that contact surfaces are properly aligned is essential, given its operational requirements. Achieving flat contact faces through precise machining is therefore of utmost importance. As surface roughness and flatness are closely linked, it is vital to investigate the machining process parameters involved. This study focuses on addressing surface quality issues with EN-GJS-600-3 cast iron by optimizing machining parameters. CMM measurements were utilized to analyze the relationship between surface roughness and flatness, with a surface profile used to assess flatness. Furthermore, a new 2D surface roughness estimation method (2D-SRET) was created and tested with experimental data in order to improve the precision of assessing the discrete flat surface machining procedure.

1. Introduction

The machining of materials is an ageless issue. Its quality is very dependent on machining parameters. Calculating surface roughness becomes critical at contact faces to avoid leakage and alignment problems, which are the result of inexact flatness and paralellism. The machining process not only requires a high-quality material but also the determination of proper machining parameters.
A new technique called the 2D-SRETM (Two-Dimensional Surface Roughness Determination Method), which is based on the finite element method and was written in Fortran, has been used to validate the surface roughness experiments for the considered cast part. The method generates 2D surface profile changes and calculates Ra average roughness.
There are many studies in the literature about predicting surface roughness with respect to milling process parameters. Machining and neural-network-based surface prediction of Al-6061 aluminum alloy have been conducted by Simunovic et al. [1] with a root mean square error of approximately 4%. With the addition of the step-over parameter to the statistical model, surface quality prediction has become more precise, with a 13.4 percentage of error in Ozcelik and Bayramoglu’s [2] study. SKD 61 hard steel has been used to create a prediction model for surface quality, and it has good agreement with the experiment that has been conducted by Hoang et al. [3]. It is stated that cutting forces increase with an increase in feed rate and depth of cut. An increase in cutting force has resulted in an increase in surface roughness. A coolant-based analysis of machining to achieve better surface quality is one of the methods studied by Raza et al. [4]. Tool wear and tool vibration may be included in the prediction models to improve accuracy, as in Saini et al.’s [5] work. Bharathi Raja and Baskar [6] have used the particle swarm optimization technique to create a model from experiments. The predictions of the model have a 15% deviation from the actual results. The Taguchi method is another statistical model for prediction, and Yadav et al. [7] have used the method in their experiments. In the machining process, cutting temperature also importantly affects the material’s surface quality and should be considered when it reaches the point of being a problem, as Yalcin et al. [8] have proposed in their study. Alharthi et al. [9] have performed optimization of cutting conditions and obtained regression-analysis-based and neural-network-based prediction models from the experiments. Aluminum 7075-T6 material machining parameter optimization has been carried out, and a model for surface roughness prediction with a genetic algorithm has been created by Oktem et al. [10]. It has errors of less than 5.34% in prediction. Erzurumlu and Oktem [11] have investigated machining parameter optimization along with computational cost, cutting forces, tool life, and dimensional accuracy. A discussion and a review about neural networks for the prediction of surface quality have been conducted by Zain et al. [12]. Another neural-network-based estimation method with an approximate 8% average error can be found in the reference study by Lela et al. [13]. The individual error results have a range that changes from 0.79 to 21.46 percent. With a range of 0.088 to 14.31 percentage of individual error, neural-network-based estimation has been carried out with the use of a harmony search algorithm to obtain the optimum parameters in Razfar et al.’s [14] experiment. A very small error percentage of surface roughness estimations has been achieved by optimizing the machining parameters. Two different optimized parameters have given 2.18% and 3.56% errors of percentage with the prediction model. However, the low errors in these results are acceptable for machining parameters and material quality optimization. Feed rate is the most important parameter in determining surface roughness, and very small values of feed rate have been used in the study carried out by Razfar et al. [15]. It can be concluded that a lower feed rate gives better prediction possibilities for the methods and models created.
As new materials are used, machining parameters have to be determined. The (statistical) optimization of a metal matrix composite material’s machining parameter has been applied with cryogenic coolant to increase cutting forces by Ghoreishi et al. [16]. Arizmendi and Jiménez [17] have developed a simulation algorithm based on acceleration signals in high-speed end milling to simulate surface roughness. Surface profile generation considering the geometry of the cutting tool has been carried out and resulted in surface roughness profiles. In Parhad et al.’s [18] study, prediction has been made more precise by considering the runout of cutting tools. With respect to cutting speed and different austempering times, ADI material has been investigated by Akdemir et al. [19], and results indicate that as the material treatment changes, surface roughness after machining becomes higher at the same cutting speed. Also, the relationship between surface roughness and cutting speed deviates. Again, Rao and Shin [20] have conducted ADI machining parameter optimization with respect to surface roughness in relation to the depth of cut and cutting speed to ensure proper surface quality. Residual stresses after machining have also been taken into consideration in addition to the optimization of the machining parameters with regard to surface roughness, and an increase in feed rate has produced larger residual stresses than a corresponding increase in cutting speed or depth of cut in tests carried out by Rao et al. [21]. Another study that has considered residual stresses can be found in the reference study of Wang et al. [22]. From a different perspective, Wang et al. have established a relationship between fatigue life and surface quality by considering cutting speed and feed rate.
The 2D-SRET method proposed in this study aims to make specific contributions to the literature by providing stable estimation of the average roughness value by surface profile generation. It is able to solve discrete flat surface machining issues and improve surface quality and can be applied to various materials with force adaptation fitting surface roughness estimations to experiments using the thermal modulus approach. Enumerated surface quality estimation models in the literature are limited to their respective processes. The use of the 2D-SRETM aims to address material costs and time-dependency problems (long-term tests).

2. Materials and Methods

The initial step in the proposed procedure involves the selection of the workpiece for the machining study. This workpiece comprises a 2D test piece that accurately represents the geometry required for flat face milling. The real geometry of the chosen test piece is depicted in Figure 1, showcasing the tool (Figure 1a,b), insert geometry (Figure 1c), and a sample of the workpiece along with its section used in the 2D static finite element analysis (FEA) in Figure 1d. The workpiece’s coordinate system serves as the global coordinate system.
The cutting tool (Figure 1a) initiates its movement along the y-axis in a positive direction relative to its cutting diameter (equation 5). The tool utilized in this study is equipped with six carbide inserts (equation 3 and n = 1, 2, 3, 4, 5, 6) as shown in Figure 1b, illustrating the positions of the inserts and the forces applied to the 2D sections. Meshing and 2D domain CAD geometry, which can be identified as one of the numbered sections in Figure 1d, and the geometry of the 2D area may vary as they pertain to the primary study involving discrete flat surfaces of the considered part. The part’s CAD data and mold designand these discrete flat surfaces’ 2D dimensions are shown in Figure 2 and Figure 3, respectively.
The modeling process involved the use of the Gmsh program [23] for meshing and 2D domain CAD geometry. The 4-node quadrilateral mesh element was selected due to its superior deformability, compliance, and ability to generate a uniform mesh pattern. Surface roughness evaluation was conducted by applying forces step by step and making deformations permanent on the surface. This evaluation was based on static analysis (a 2D analysis written in Fortran), with the mesh being updated for the next step as it is deformed in the previous step. The main focus was on the application points, which are the insert positions (Equations (6) and (7)) and were calculated accordingly.
θn is the nth insert’s initial angle of position.
θ 1 = 30 ° ,   θ 2 = 90 ° ,   θ 3 = 150 ° ,   θ 4 = 210 ° ,   θ 5 = 270 ° ,   θ 6 = 330 °
The rotation and translation of the tool were divided by a “sampling time” to ensure a smaller change in deformation to reach the target profile.
x p   r e p r e s e n t s   t h e   p o s i t i o n   o f   t o o l   i n s e r t   i n   x a x i s . y p   r e p r e s e n t s   t h e   p o s i t i o n   o f   t o o l   i n s e r t   i n   y a x i s . x i   a n d   y i   a r e   i n i t i a l   p o s i t i o n s .
Since there is only a change in the y position of the tool,
s t e p y = t a b l e   f e e d   ( m m s e c ) s a m p l i n g   t i m e   ( s e c )
s t e p r o t a t i o n   d e g r e e = r o t a t i o n   d e g r e e s a m p l i n g   t i m e   s e c
θ n = θ n + s t e p r o t a t i o n
Δ x = 0
Δ y = Δ y + s t e p y
r represents the cutting diameter of the tool.
x p = R cos θ n x I + Δ x
y p = R sin θ n y I + Δ y
β = 90 ° + θ n
f d o f = F sin β + N
The sinus component of the F is required in the calculation of surface roughness (2D profile), which is in the feed direction. On the target region (Figure 1b), calculated forces were incrementally applied. A force matrix was created to be a step-by-step application on the surface, just like a real tool’s movement. These processes, which resemble movements, are used to establish the degrees of freedom for force application. The number of nodes that are taken into consideration and a parameter that finds nodes around the tool’s path are both increased by sampling time.
The aforementioned formulations and justifications are part of Algorithm A1 (Appendix A), which calculates the force matrix. It begins by reading the connectivity matrix and node positions from a text file.

2.1. Explanation of the Force Matrix Algorithm

2.1.1. 1st–24th Rows of the Algorithm

The algorithm starts with machining parameter definition, tool geometry, and starting position implementation (1st–24th rows). The “teta” matrix includes the initial angles of tool inserts or cutting points; its dimensions change with the number of cutting points (8th–13th rows). “delta_y” and “delta_x” start with zero values (15th–16th rows). The first movement of the tool is given as Equation (5), as it is in the 18th row of the algorithm. The 19th row has the definition of the cutting radius of the tool, “r.” “depth_of_cut” represents and calculates the objective height of the final geometry (20th row). It determines the target nodes that are going to be touched by the cutting edges by means of the height of the workpiece. From the 21st to the 24th of rows, calculations of positions are made at every step (2nd row) until the “bat” value (1st row) differs from “1”.

2.1.2. 25th to 41st Rows of the Algorithm

The 25th to 41st rows include the determination of force application nodes. There are two main counters (25th and 26th rows) to detect the right angle of the tool inserts and the right degree of freedom, accordingly. The do loop that starts from the 27th row has “count_2” for the detection of the angle of tool inserts. The following do loop works under the aforementioned do loop (27th row) and determines the target (force application) nodes by if statements. At the 30th row, a query to the 2D domain occurs for the purpose of determining the target area by the if statement. The target area’s height is the measure and position of the tool with respect to the y-axis, which has to be greater than zero. At the 31st row, a measure to break the loop is stated as the position of the tool with respect to the y-axis (x(jj,2)) being greater than or equal to a certain value. jj represents the number of nodes, and “nn” (do = 1,nn) expresses the total number of nodes. If the condition is satisfied, “bat” is equal to “2”, and the “do while” loop (whole code) stops working. If it is not satisfied, the other if statement at the 34th row begins to proceed. To detect the position of the tool with respect to the z-axis (which is shown in Figure 1b, according to the 2D domain coordinate system), x(jj,1) is scanned through all nodes’ positions. In the if statement at the 34th row, the detection area of scanned nodes is determined as 2 mm before and 2 mm after the current x(jj,1) position. Inside the if statement, “count_1” takes its values and counts the number of application forces. The mak(count_1) = jj expression at the 36th row creates a matrix that stores the force application node numbers. The sak(count_1) = count_2 statement at the 37th row stores the angle of insert with respect to the application force node number. There are two main counters (25th and 26th rows) to detect the right angle of the tool inserts and the right degree of freedom accordingly. The do loop that starts from the 27th row has “count_2” for the detection of the angle of tool inserts. The following do loop works under the aforementioned do loop (27th row) and determines the target (force application) nodes by if statements. At the 30th row, a filtration to the 2D domain occurs for the purpose of determining the target area by the if statement. The target area’s height is the measure and position of the tool with respect to the y-axis, which has to be greater than zero. At the 31st row, a measure to break the loop is stated as the position of the tool with respect to the y-axis (x(jj,2)) being greater or equal to a certain value. jj represents the number of nodes, and “nn” (do = 1,nn) expresses the total number of nodes. If the condition is satisfied, “bat” is equal to “2”, and the “do while” loop (whole code) stops working. If it is not satisfied, the other if statement at the 34th row begins to proceed. To detect the position of the tool with respect to the z-axis (which is shown in Figure 1b, according to the 2D domain coordinate system), x(jj,1) was scanned through all nodes’ positions. In the if statement at the 34th row, the detection area of scanned nodes is determined as 2 mm before and 2 mm after the current x(jj,1) position. Inside the if statement, “count_1” takes its values and counts the number of application forces. The mak(count_1) = jj expression at the 36th row creates a matrix that stores the force application node numbers. The sak(count_1) = count_2 statement at the 37th row stores the angle of insert with respect to the application force node number.

2.1.3. 42nd to 53rd Rows of the Algorithm

Another counter, “count_3,” gives the number of degrees of freedom. The connectivity matrix is scanned with the “if (connectivity(xz,iu).eq.mak(jg))” statement to create “dof(count_3)” degrees of freedom that are subjected to cutting forces.

2.1.4. 54th to 66th Rows of the Algorithm

This section of the algorithm calculates the forces with respect to their angles and places the force values into the force matrix with respect to degrees of freedom. “f(dof)” can be a general representation.

2.1.5. 67th to 69th Rows of the Algorithm
The angle of tool inserts is updated in this part for the next step. It proceeds to the point where the tool exceeds the limit that is given in the “if (y_p(j).ge.300) then” statement. At every step, force values are written to a text file. As a conclusion, this process creates the force matrix. A similar approach to other boundary conditions is applied and written to the text file.
The force matrix contains a raw value of forces, and they require a multiplier constant to reach the objective surface profile, in this case, deformations along the y-axis. The formula for the force multiplier constant is calculated as follows:
vari = (number_of_forces_at_adaptation_analysis/number_of_forces_at_current_analysis)
constant = process_adaptation_constant*(((new_doc/old_doc)**(new_doc/old_doc))**0.5)*vari*(new_feed/old_feed)**(0.5)
As it is stated above, “vari” is a ratio of the number of forces, which is adaptation analysis over current analysis. The constant calculation contains the current analysis’s depth of cut, which is the target area’s y-axis dimension (new_doc), adaptation analysis’s depth of cut (old_doc), current analysis’s feed per tooth (new_feed), and adaptation analysis’s feed per tooth (old_feed). The most important parameter is “process_adaptation_constant.” This parameter adapts the force values to one of the real-life experiments, and further calculations are dependent on it. Only other parameters, which are in the formulation as machining parameters, are changed. After scaling the forces by the constant, the solver starts to apply forces to the 2D domain and statically solves the deformations. The mesh was deformed step by step, and the final surface profile takes shape. Usually, in machining processes, uniform materials are used. However, sometimes it is inevitable that materials are not uniform, and this results in different surface quality (for the same machining parameters) on different surfaces that have different thicknesses. Estimations may deviate from the experiment in this case. The configuration of the machining parameters has to be changed, and material inspection is a necessity at the first step. A non-uniform material’s surface quality could be corrected by the thermal modulus of the portion of the part that is considered. In Figure 2, it is demonstrated as a multiplier. Two-dimensional SRET is a type of semi-empirical finite element model to evaluate further surface roughness analysis. After the first experiment, it was possible to estimate the roughness of the machined surface. The mechanical component under consideration is made of EN-GJS-600-3. Table 1 displays the material’s chemical composition, and Table 2 gives the casting conditions and inoculation information.
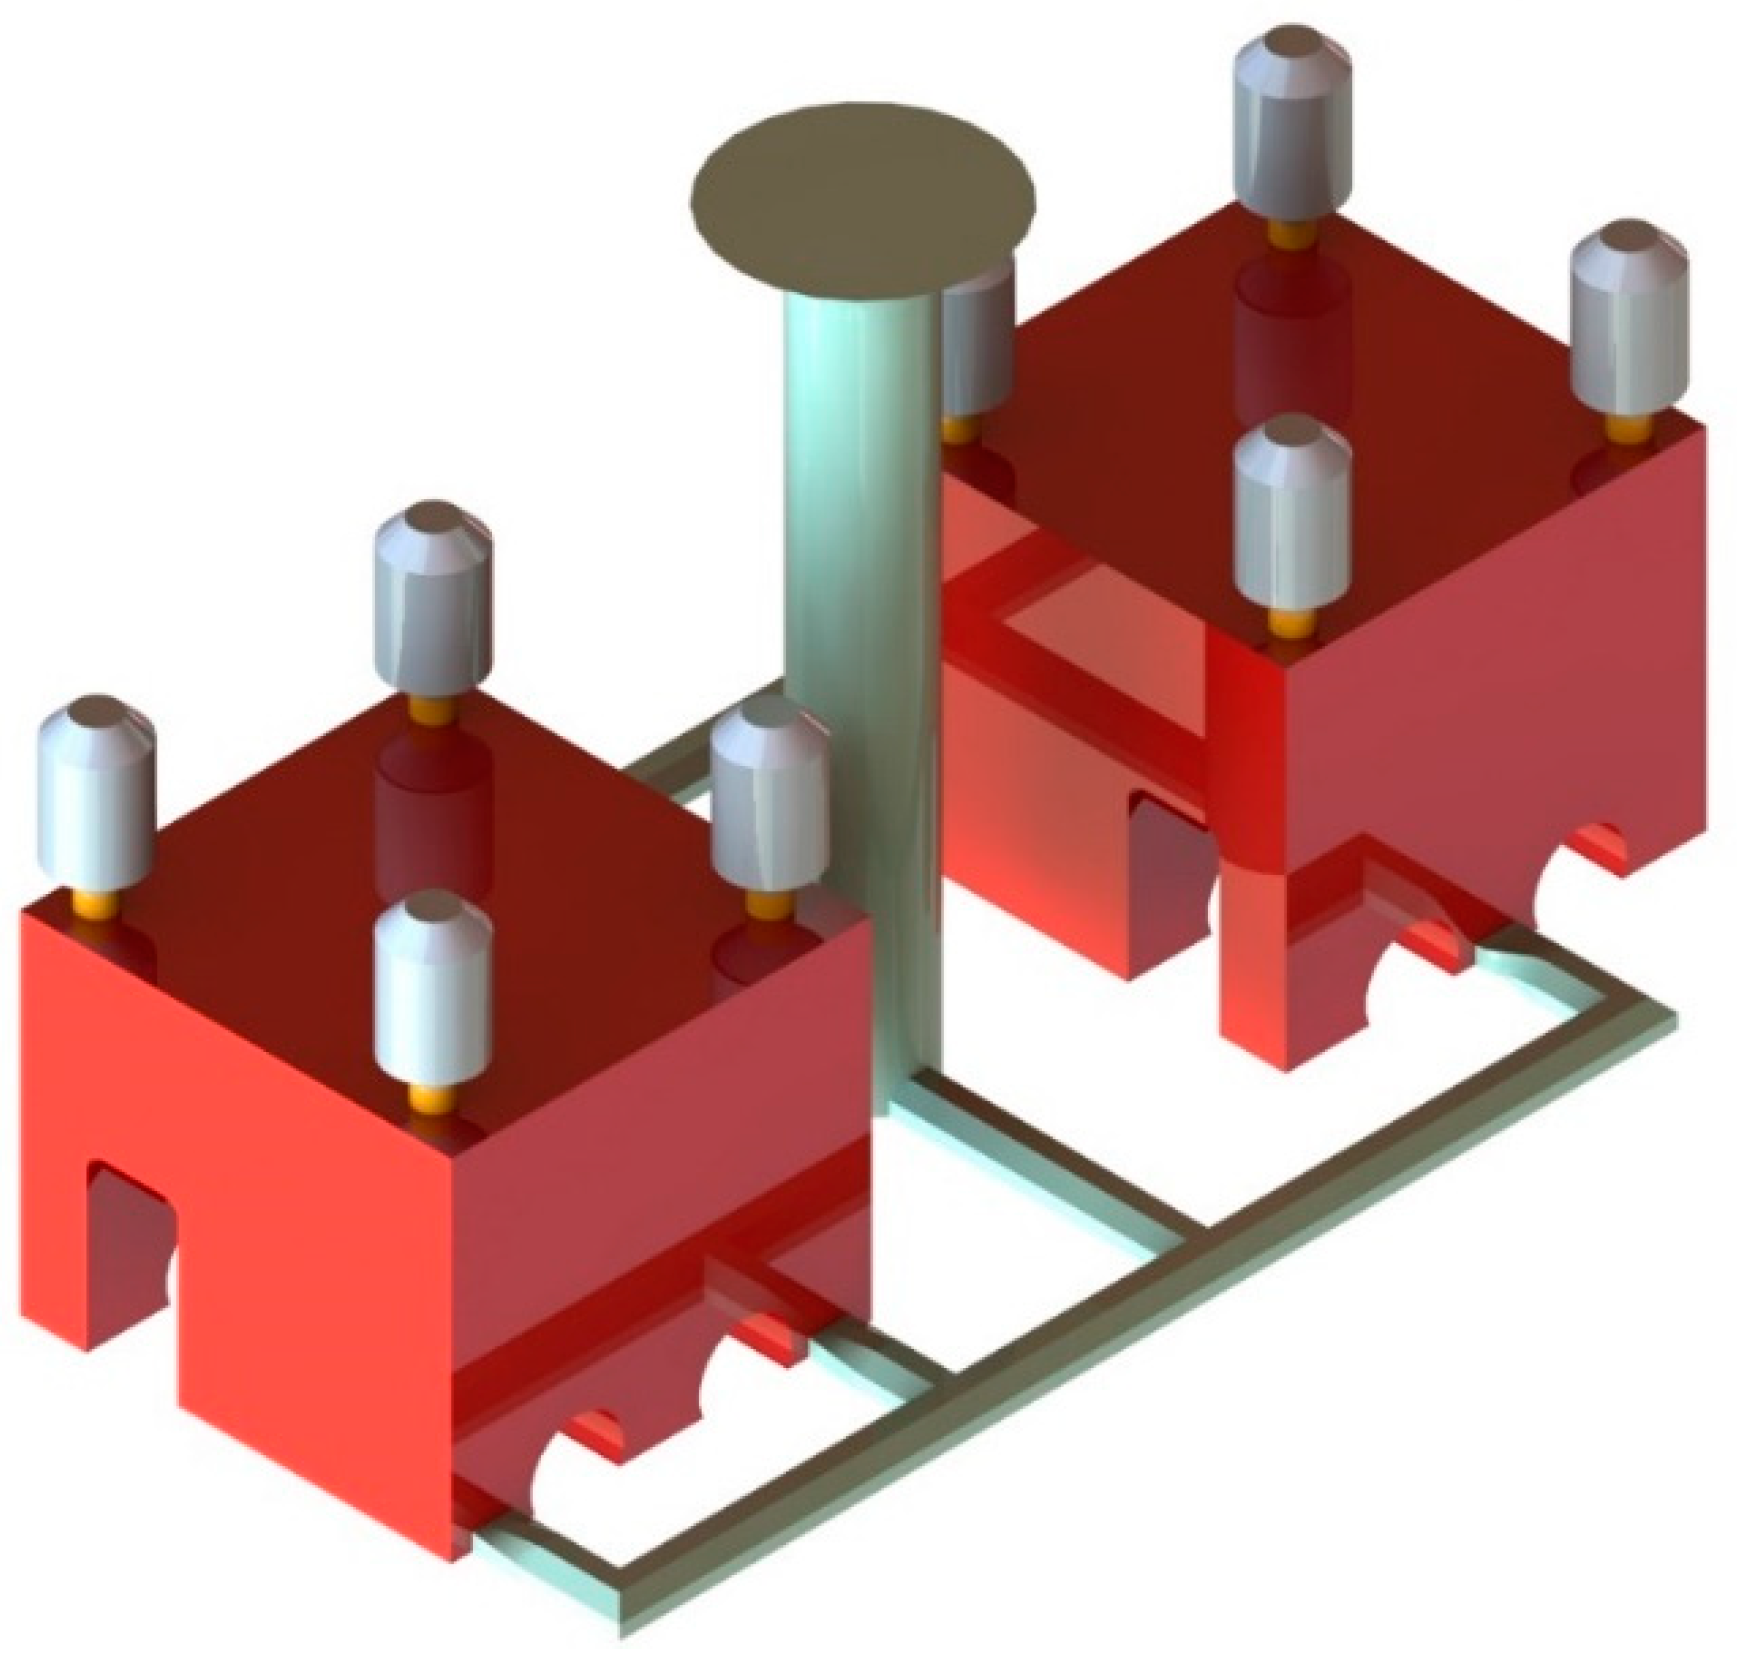
The mold is presented in Figure 2. Due to its thick structure, feeders were placed at the corners of the parts. These two parts are in the same mold and are each other’s halves to form a gearbox. The problem lies within the discrete masses with respect to discrete surfaces on the part in terms of solidification and cooling time. The cutting tool (Figure 1a) has a 100 mm cutting diameter and six flutes (Table 3).
Figure 2. The mold’s view.
Processes 12 00549 g002
Surface roughness measurements were taken after the operation using different machining parameters. The parameters were applied to these parts (Figure 2), but they resulted in different surface qualities. The components’ thermal modulus is the primary cause. Since these two components were created using the same sand mold, their cooling interactions may have an impact. Additionally, the surface quality may be impacted by ambient temperature in addition to the thermal modulus of the components (portion shape and heat sources in the mold).
The problem must be modeled differently and have a specific target area because there are distinct surfaces and various thicknesses of these surfaces. In order to assess surface roughness using the 2D-SRPET approach, two distinct target areas were developed.
Figure 3a depicts the first target domain of areas 1 and 6, as well as 2 and 7. Figure 3b shows the second target domain of areas 3, 4, and 5. This model is the work area for the 2D-SRPET throughout the development of the force matrix, which yields an accurate surface roughness computation. Since a mold contains two parts, the other components, the gating and runner, must be considered additional nearby hot zones. The sections that have a lower thermal modulus do not have these additional heat effects.
Figure 3. (a) Target domain models for 1-6 and 2-7 surfaces, (b) 3-4-5 surfaces.
Processes 12 00549 g003
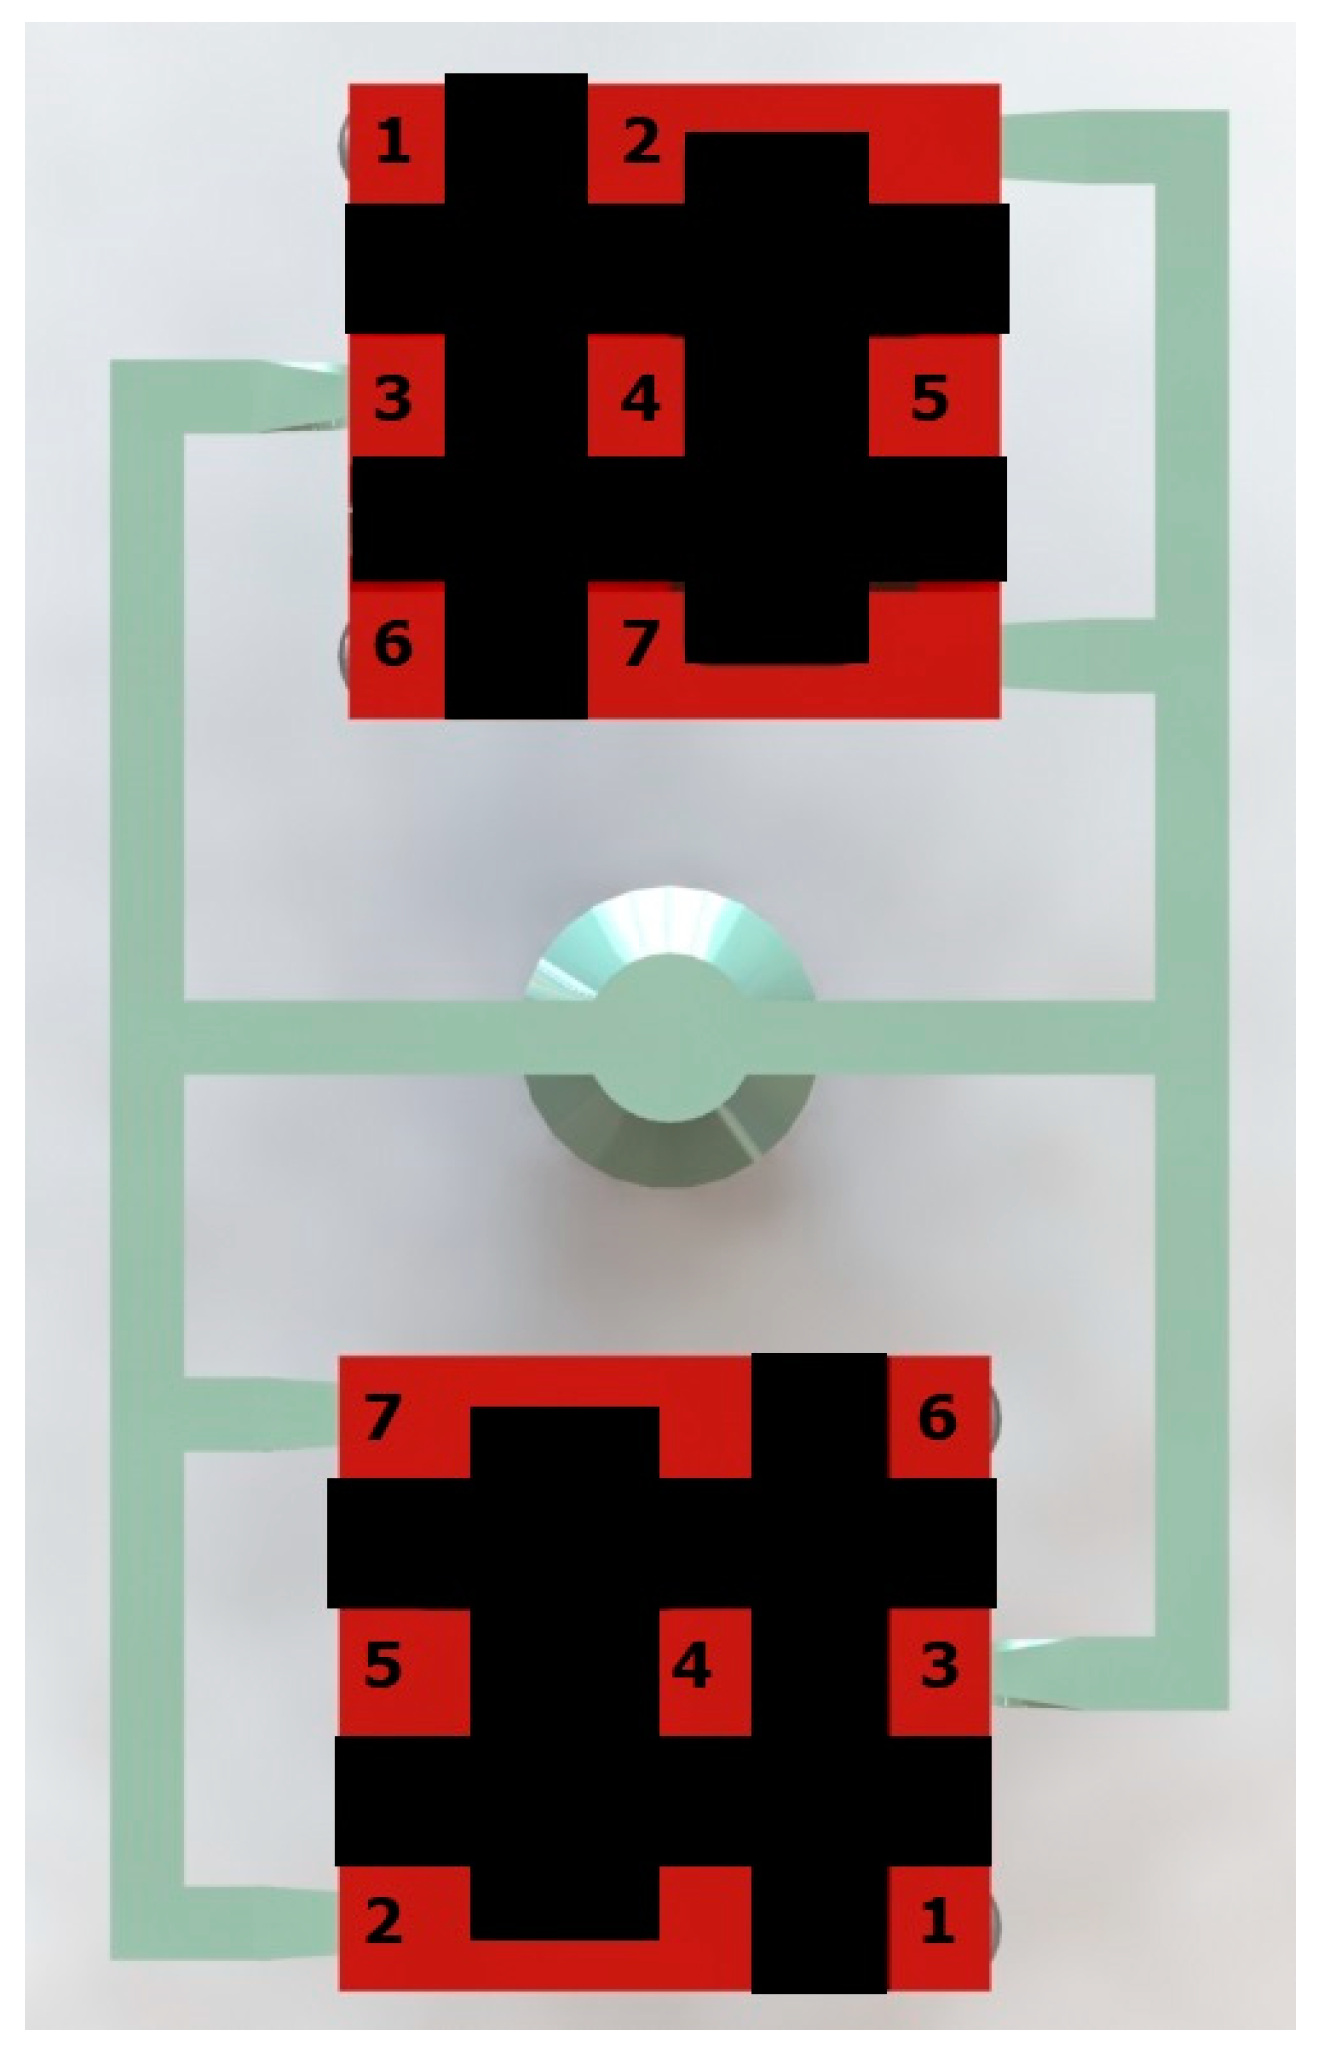
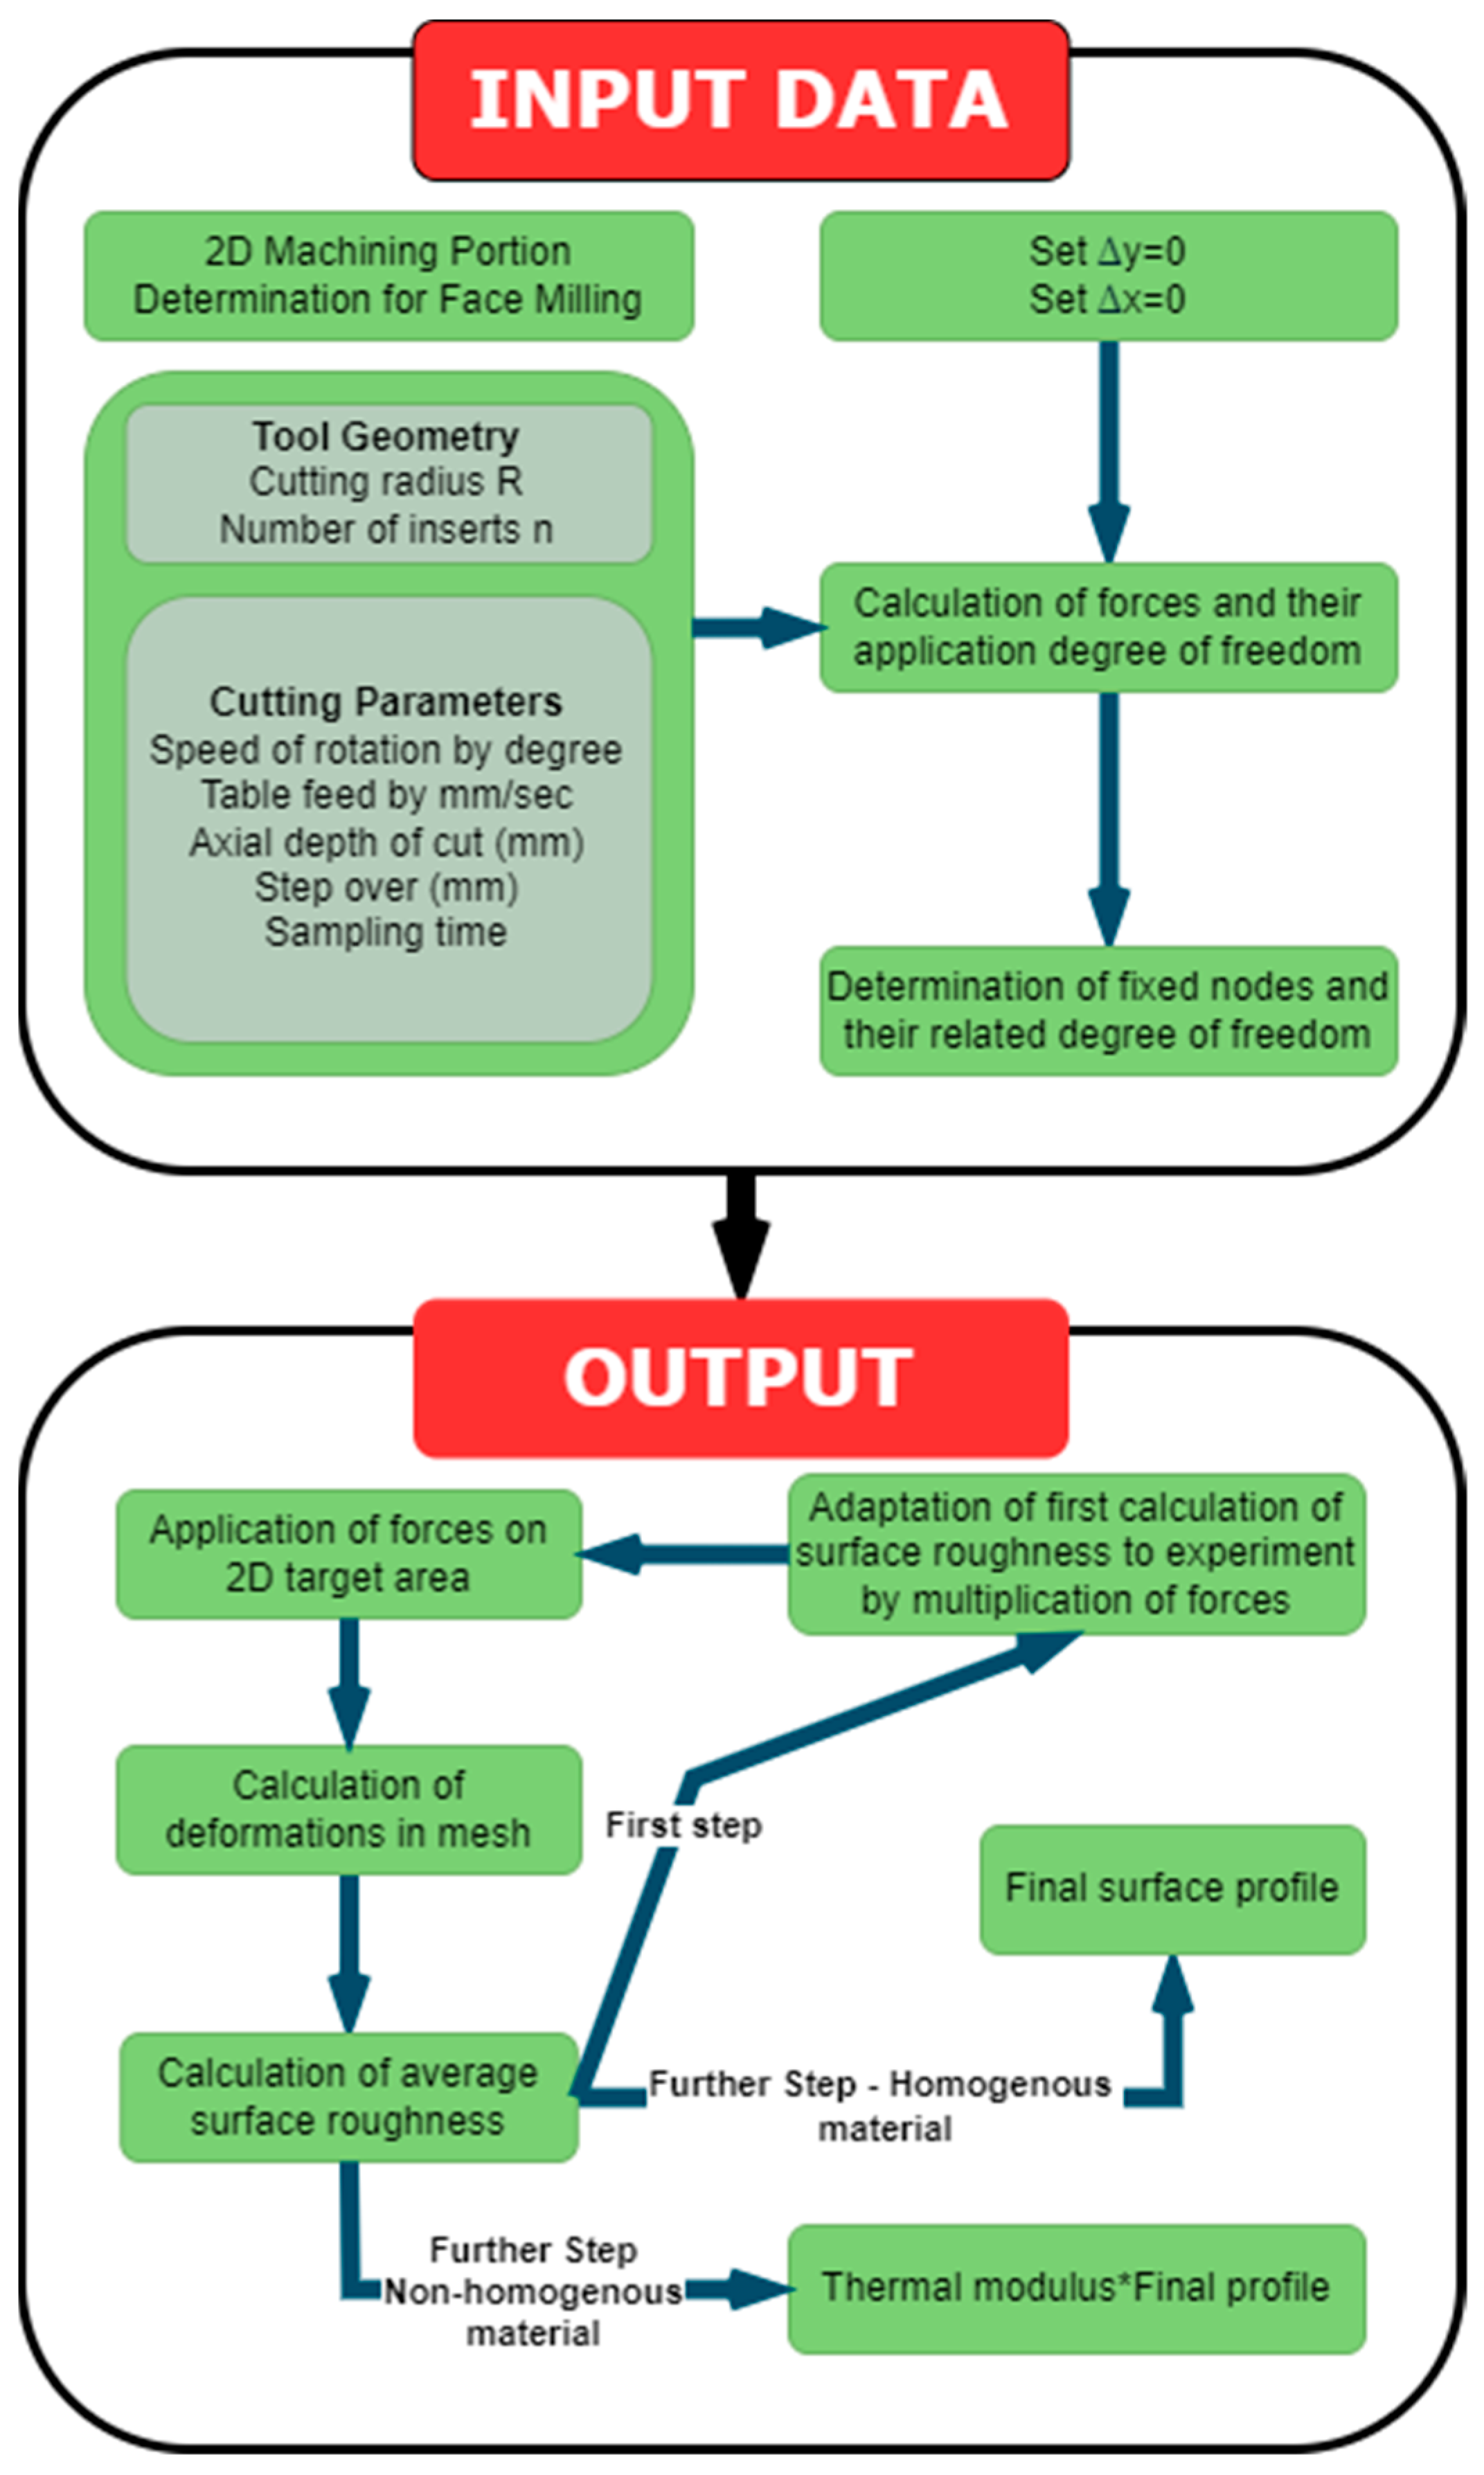
In Table 4, the impact of non-cooled areas is shown based on the placement of gating and feeders (Figure 4: areas marked in black to avoid copyright issues). Additionally, the interaction between different parts was taken into consideration. The thermal modulus was calculated using a specialized program designed for determining sand mold casting parameters. This program utilizes the dimensions of specific sections of the part to calculate the modulus (volume/surface area) and incorporates the percentage of non-cooled areas (such as gating, feeders, and parts themselves) to refine it into a thermal modulus. The dimensions provided in Table 4 represent discrete volumes used for modulus calculation, treated as cubes and multiplied by ((volume/surface area) × 1.2) × (1 + non-cooled area effect%). The multiplier “1.2” serves as a safety factor for nodular cast iron (nodular iron may experience unpredictable cooling conditions, necessitating precautionary measures for safety, and it is essential to adhere to specified values to ensure structural integrity and performance), while the non-cooled area effect is an assumption due to the presence of gating and feeders. The 2nd and 7th surfaces contain feeders and gating; the 3rd surface has gating and is positioned centrally as a heat source; and the 5th surface is close to gating and centrally located as a heat source. The 1st and 6th surfaces only have feeders. The non-cooled area effect percentage was determined based on the 6th surface as a reference for Part 4, resulting in a 10% fit with the experiment. Other non-cooled area effect percentages were then calculated accordingly. It is important to note that the modulus relies on certain assumptions and is utilized to align surface roughness estimations in the 2D-SRET method, showing good agreement with experimental results. Figure 5 illustrates the entire process from input data to output.

2.2. Method Validation

In this section, the 2D-SRET method, which is grounded in finite element analysis (FEA), is rigorously evaluated using case studies from existing literature to assess its efficacy in predicting surface roughness. These studies encompass a diverse range of materials, tools, and process parameters. The method’s versatility across different materials stems from its ability to adapt to machining process parameters and a process adaptation factor. The resulting surface profile represents the most recent surface condition, achieved through the incremental application of forces that induce minimal deformation on the workpiece. Consequently, the method aims to maintain validity across varying scenarios. The validation of this method is crucial in establishing its credibility for estimating surface roughness on a wide array of materials.

2.2.1. First Application

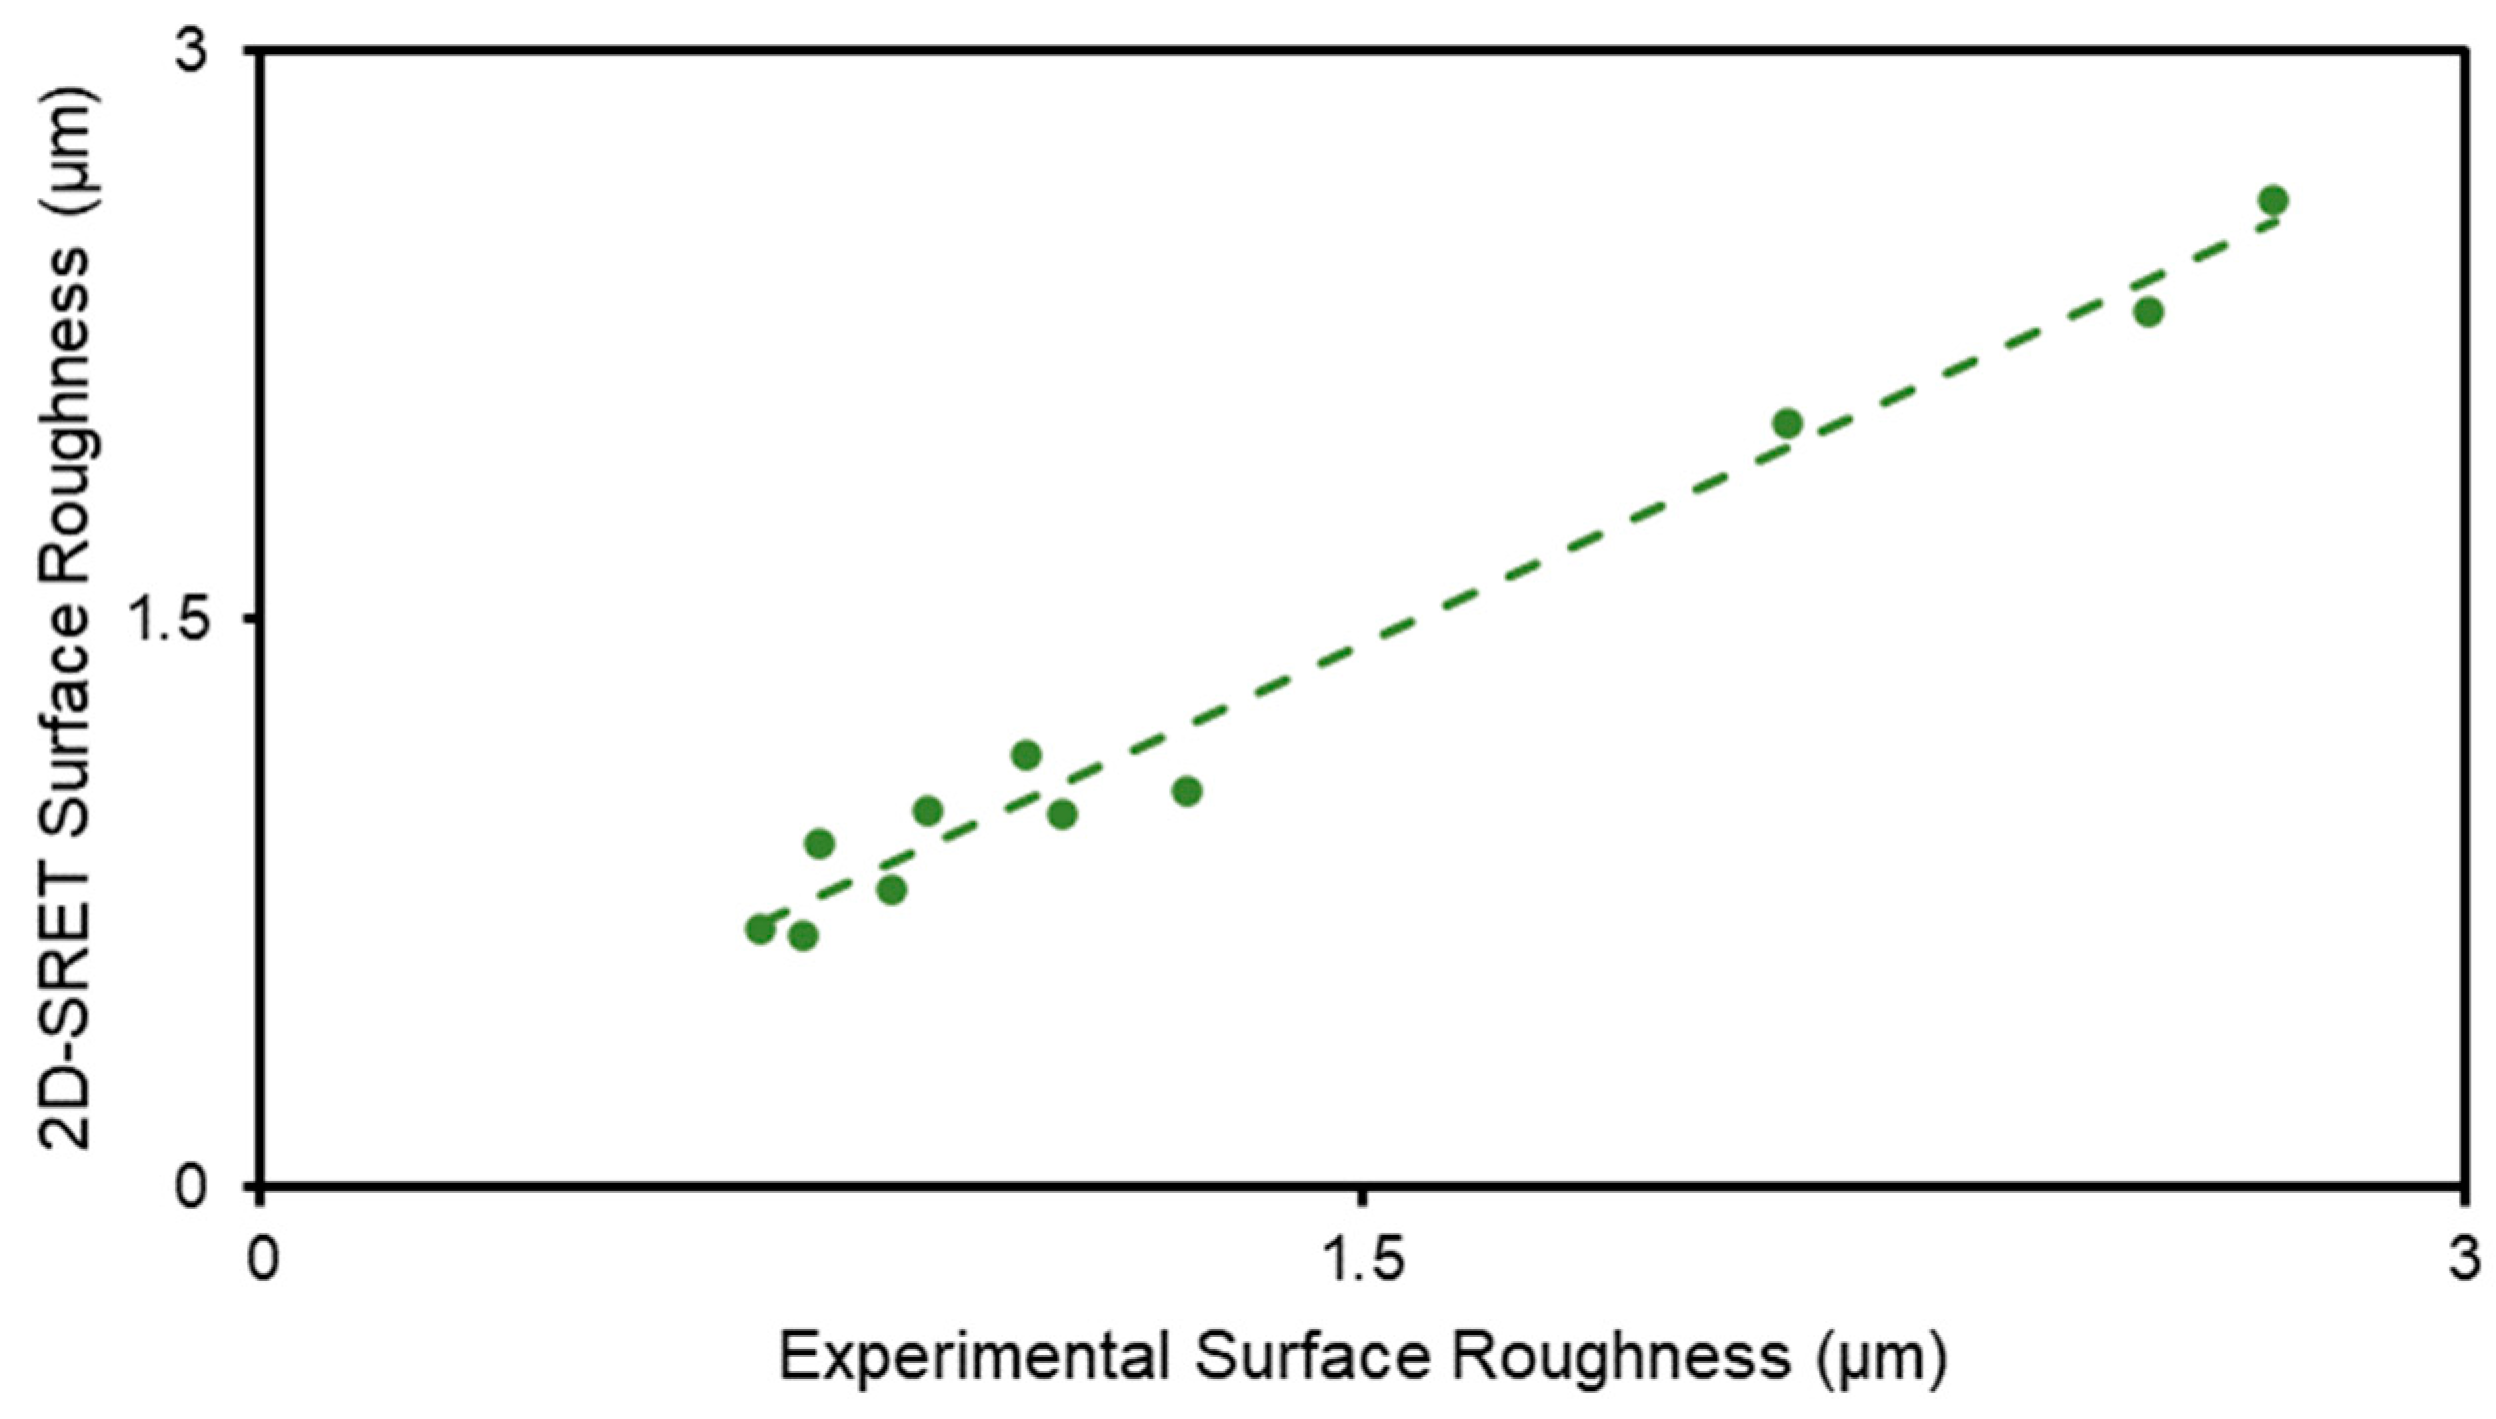
In the first reference study [2], a workpiece that has 60 × 60 × 40 mm dimensions, which is AISI 1040 steel, has been investigated to estimate surface roughness after machining, and a tool that has a 10 mm diameter and 4 flutes has been used in the process. The validation of the proposed (present) method, 2D-SRET, includes the tool’s (only 10 mm in diameter and 4 nozzles) properties (to determine force application position and nodes) and the whole domain, which is a 60 × 60 mm2 2D area. The process adaptation parameter has been determined by force multiplication, aligning the prediction of surface roughness to only one of the measurements. Further estimations have been conducted with varying speeds, feed rates, and depths of cut, which were employed as validation criteria, as shown in Table 5. The surface roughness results from the 2D-SRET approach are consistent with experimental values, as shown in Table 5 and Figure 6.

2.2.2. Second Application

In the second reference study [9], a workpiece with dimensions of 40 × 100 × 60 mm made of the AZ61 alloy has been examined to determine the surface roughness. A tool with five flutes and a 63 mm diameter has been used to remove material. In the present study, experimental results from the reference research [9] were estimated by adapting one of the surface roughness results, and 2D-SRET roughly calculated the values. Also, 2D-SRET was compared with the model that was established in the work of [9]. As it is depicted in Table 6 and Figure 7, 2D-SRET has a similar trend to regression and the ANN model [9] in terms of estimation capability.

2.2.3. Third Application

Here, a workpiece that has 70 × 50 × 15 mm dimensions and is made of SKD61 material in the reference study [3] was investigated. The number of flutes on the cutting tool is N = 2, and the tool diameter is 20 mm. Experiment no. 27 was taken as the adaptation value (Table 7). Two-dimensional SRET’s estimations have good agreement with the experiments. The material may have a more homogenous and linear behavior, which should be the reason for this increased accuracy with the same method. Also, 2D-SRET has a stable estimate of surface roughness as it has a steady increase or decrease in value (Figure 8).

3. Results

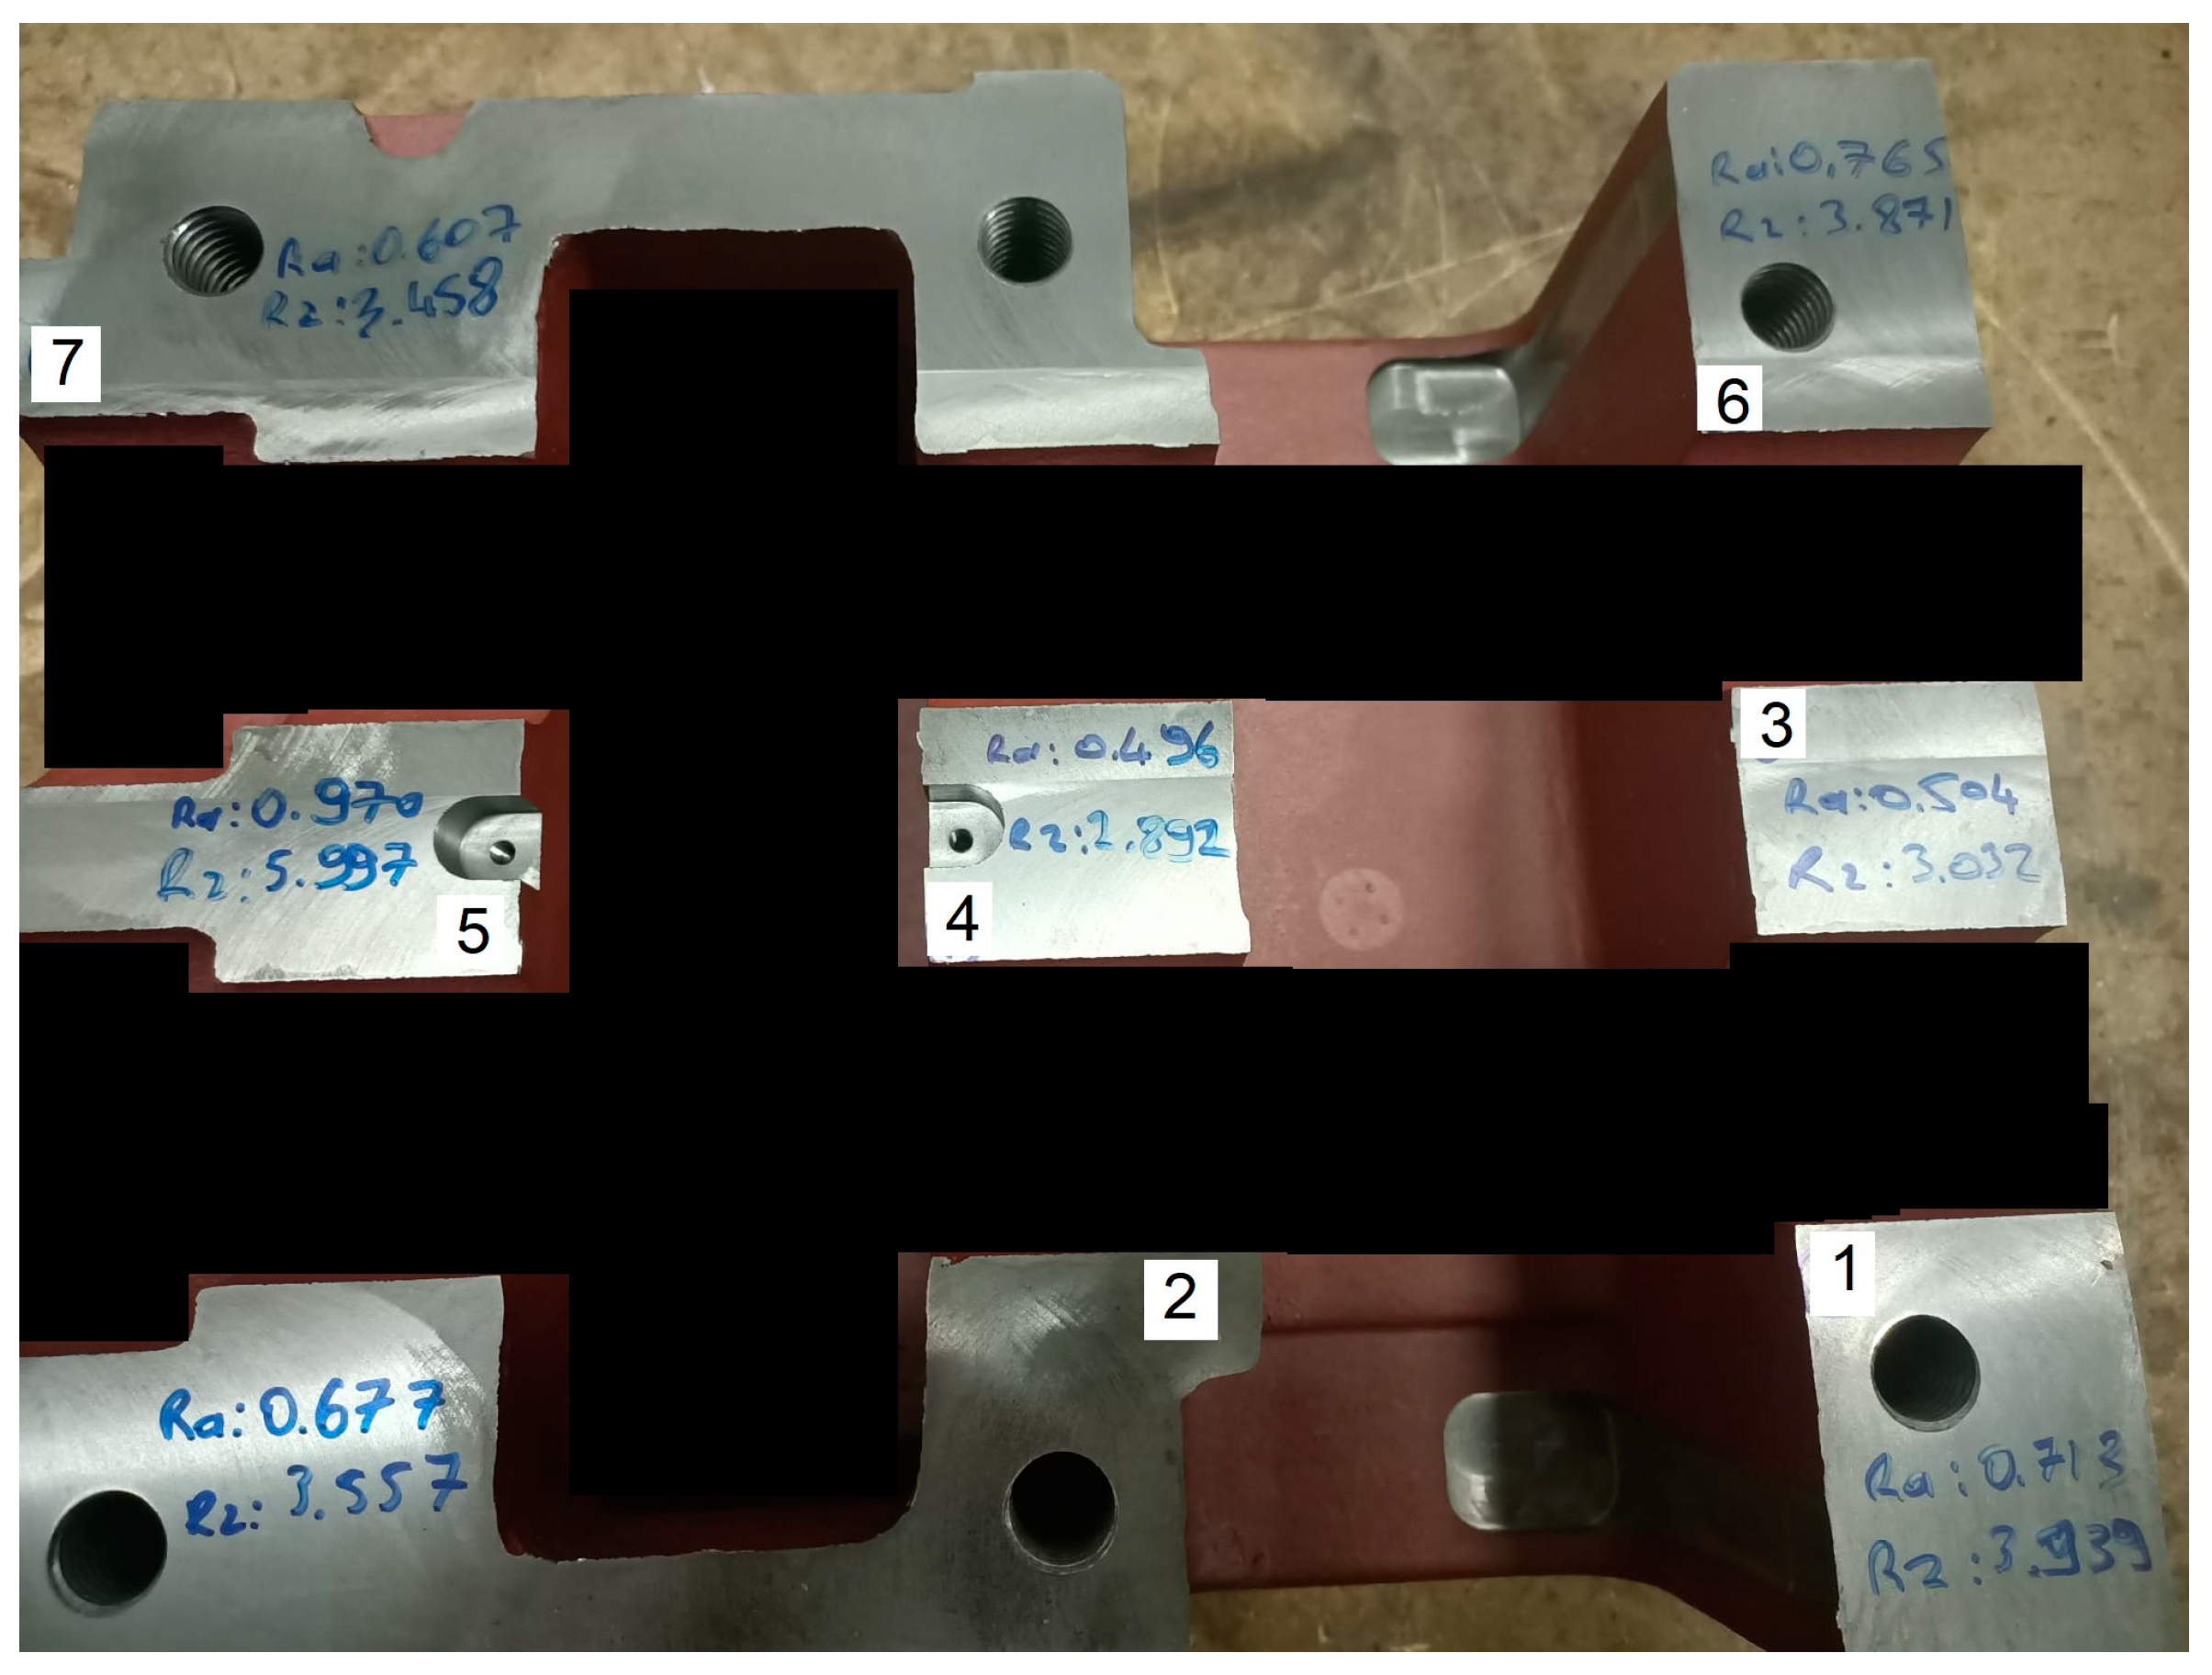
The 2D-SRET solutions are shown in Table 8 and Part 1 in Figure 9. Firstly, raw estimations of the method and thermal modulus are given separately. Next, experimental measurements of the average surface roughness of seven surfaces of the parts are shown. And multiplied raw estimations by the thermal modulus are depicted. Finally, the separate flatness of surfaces, which is measured via a CMM (coordinate measuring machine), is given to be considered and connected to the average surface roughness.
The four parts’ machining parameters differ from each other in terms of spindle speed (rpm), feed rate (mm/min), and depth of cut (mm). Raw estimations are the result of the direct solution of 2D-SRET before multiplication by the thermal modulus. After multiplication, the final estimation is the actual solution of 2D-SRET. The depictions of the results are related to seven discrete surfaces on the same part for each. Experimental measurements of average surface roughness and estimated ones seem to be very close in most cases. There should be a different investigation of flatness to determine the relationship with surface roughness since a direct connection might not be very accurate as increasing surface roughness results in the same or similar flatness.

4. Discussion

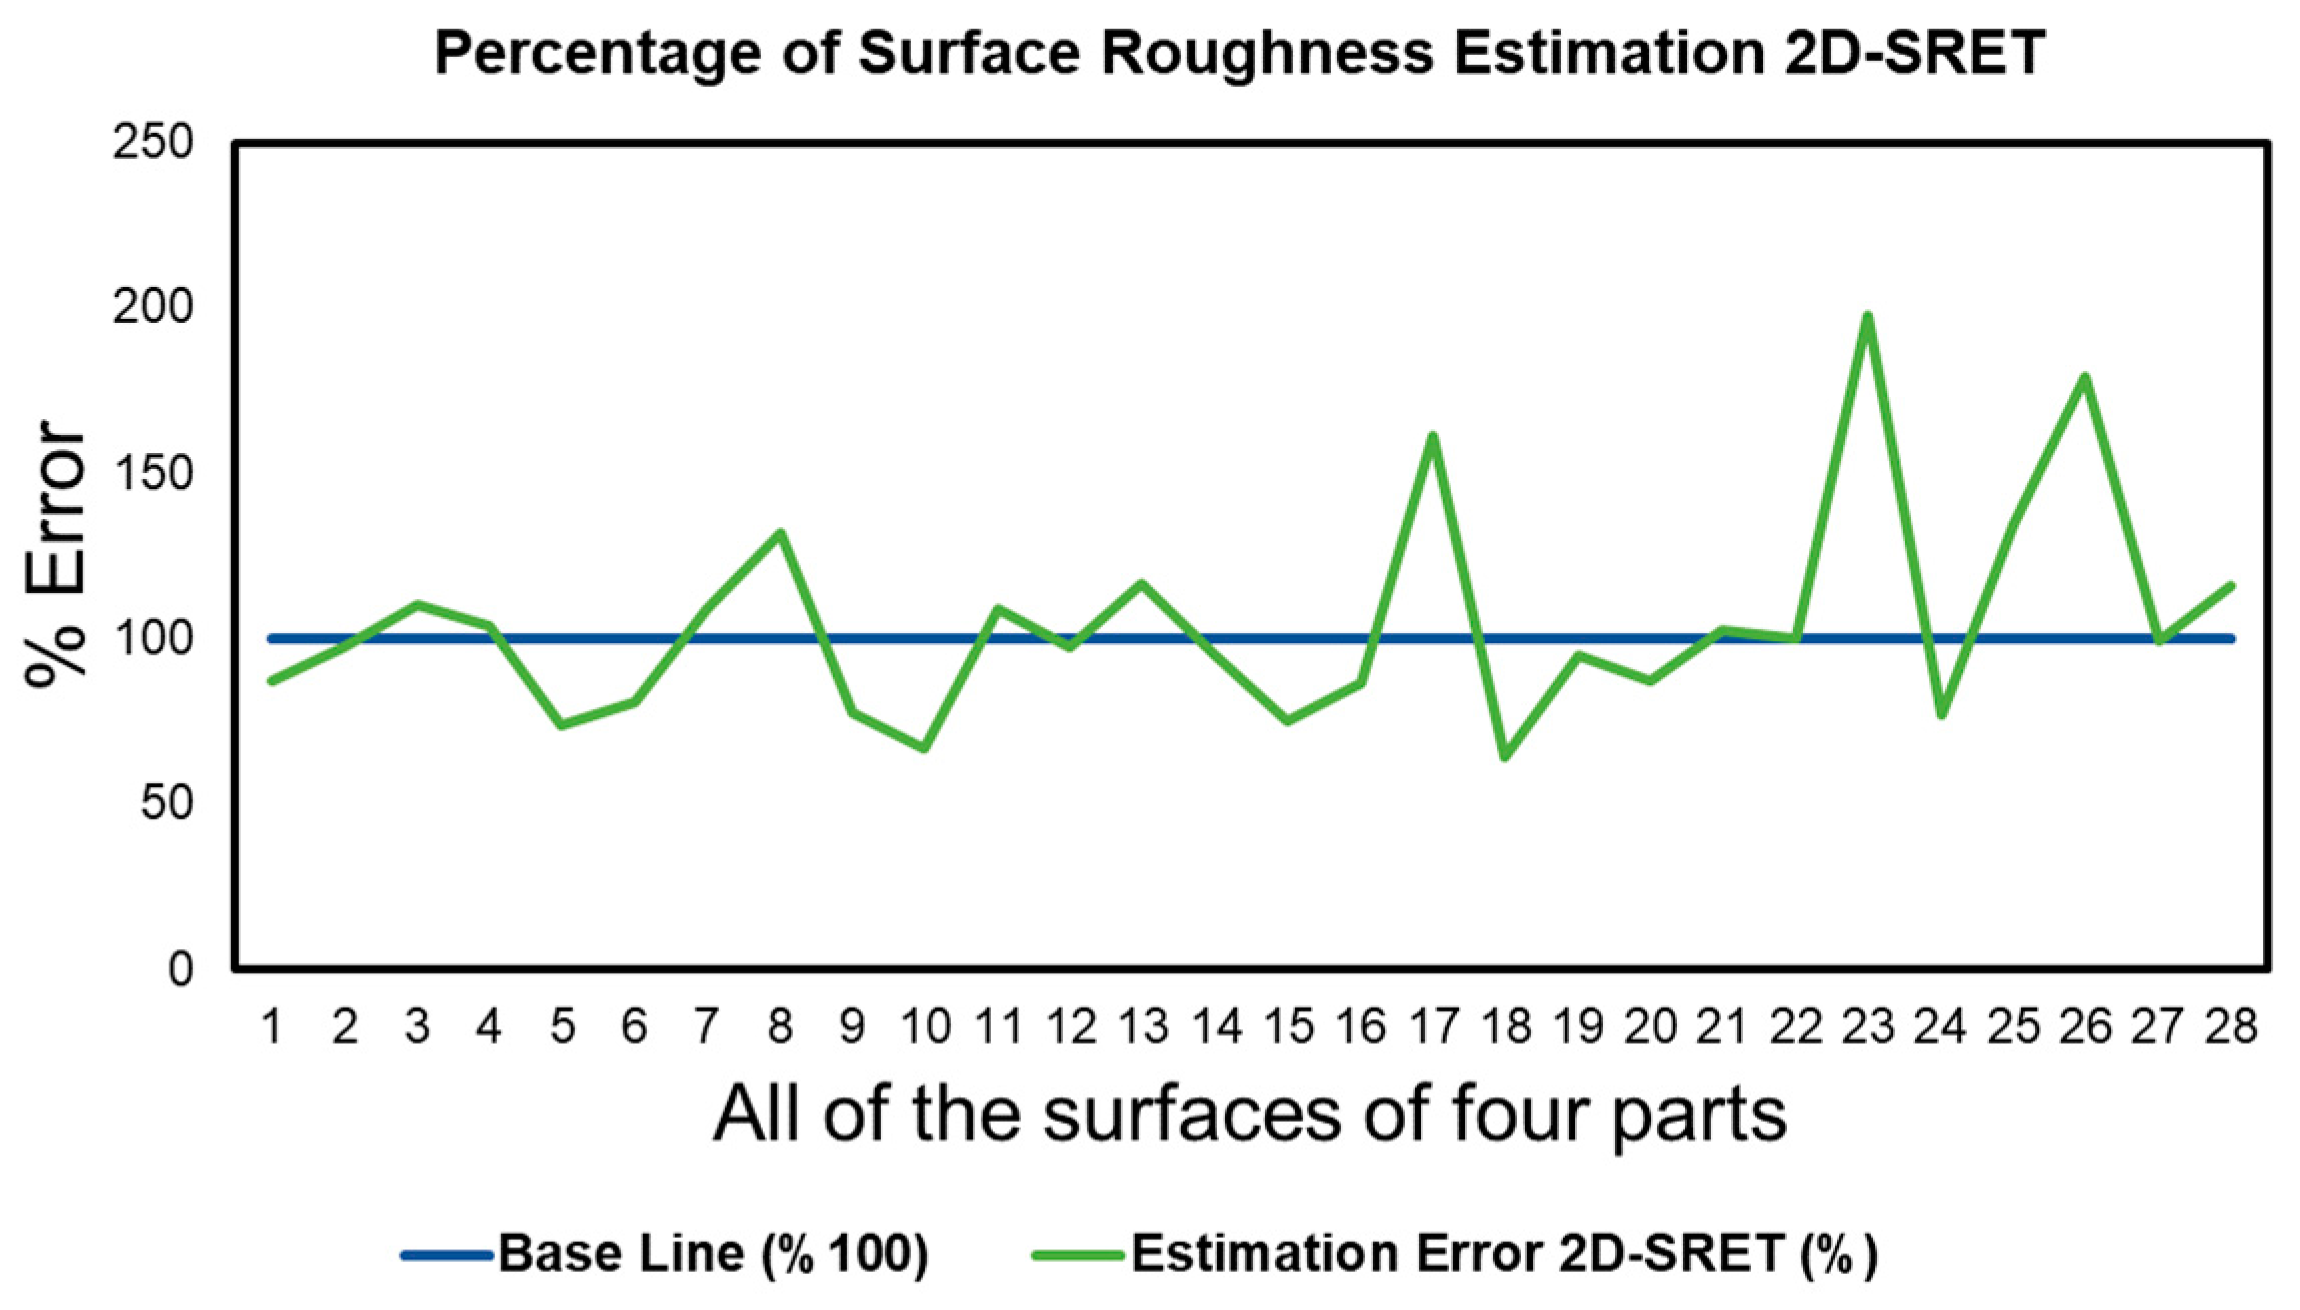
The 2D-SRET’s surface roughness prediction capability on a non-homogenous material, a cast nodular iron, is more visible in Figure 10. Average surface roughness value deviation was inevitable since there are discrete (but whole) masses on the part. And as a result, these portions of the part have little connection to each other in the cooling process after casting. Different cooling times can affect the prediction of average surface roughness. In the Section 2.2, predictions of billet materials are presented, and they have shown good agreement with the experiments. However, in the main application (Figure 9), prediction is turbulent because of this non-homogeneity. To fit surface roughness values to the experiment, the thermal modulus was used as a multiplier. Most of the deviations are acceptable, except for the three estimations colored gray in Table 8 and the 17, 23, and 26 numbered faces in Figure 10.
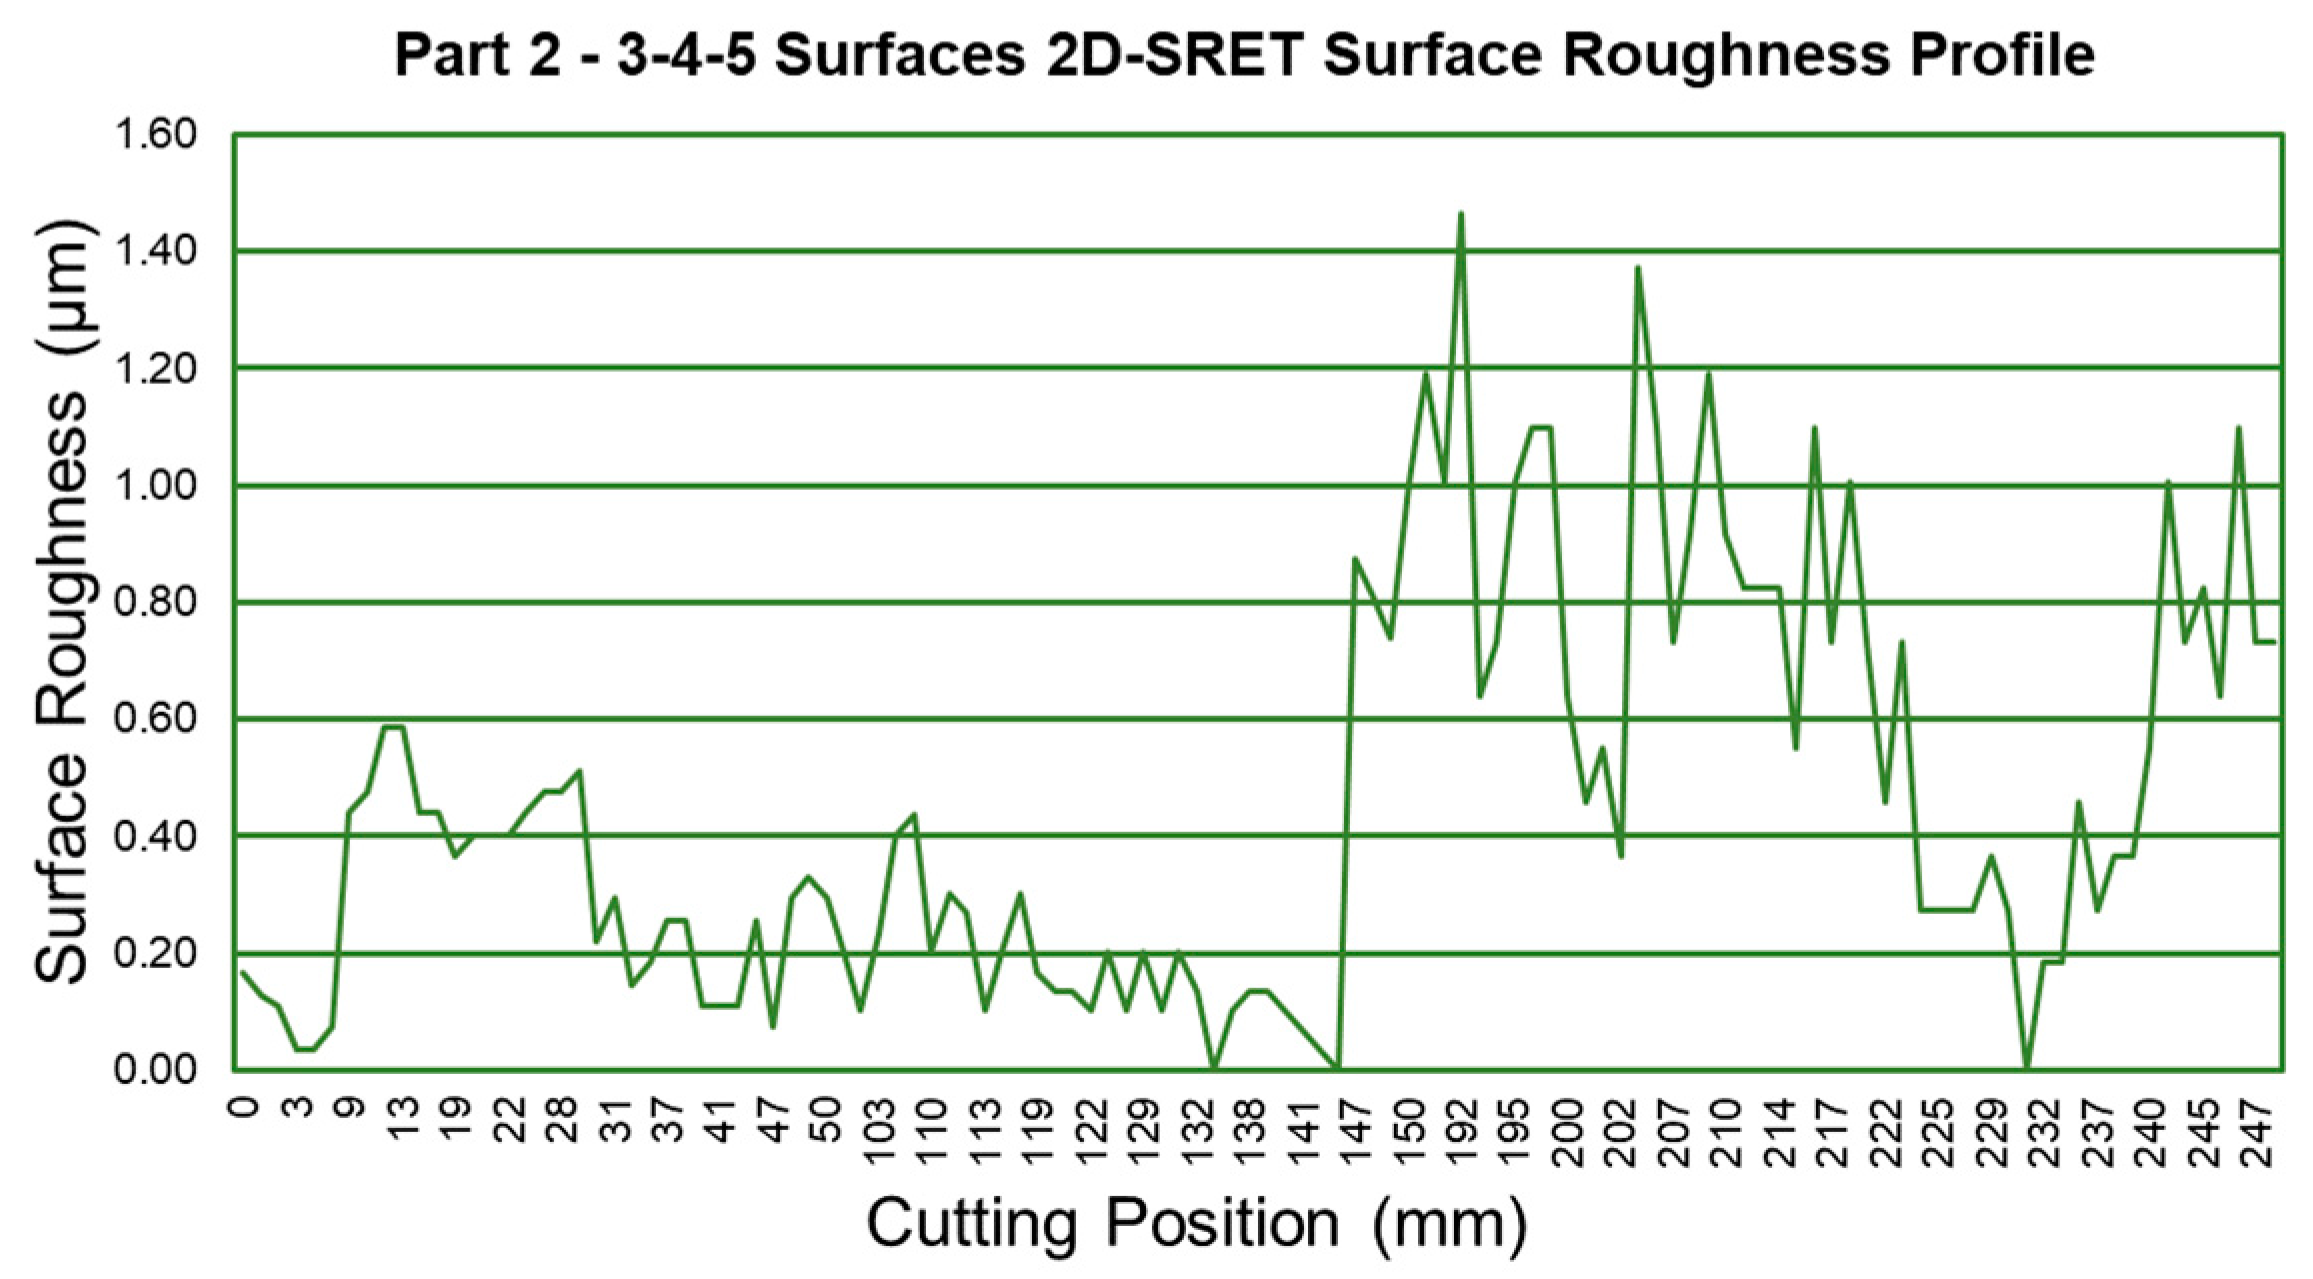
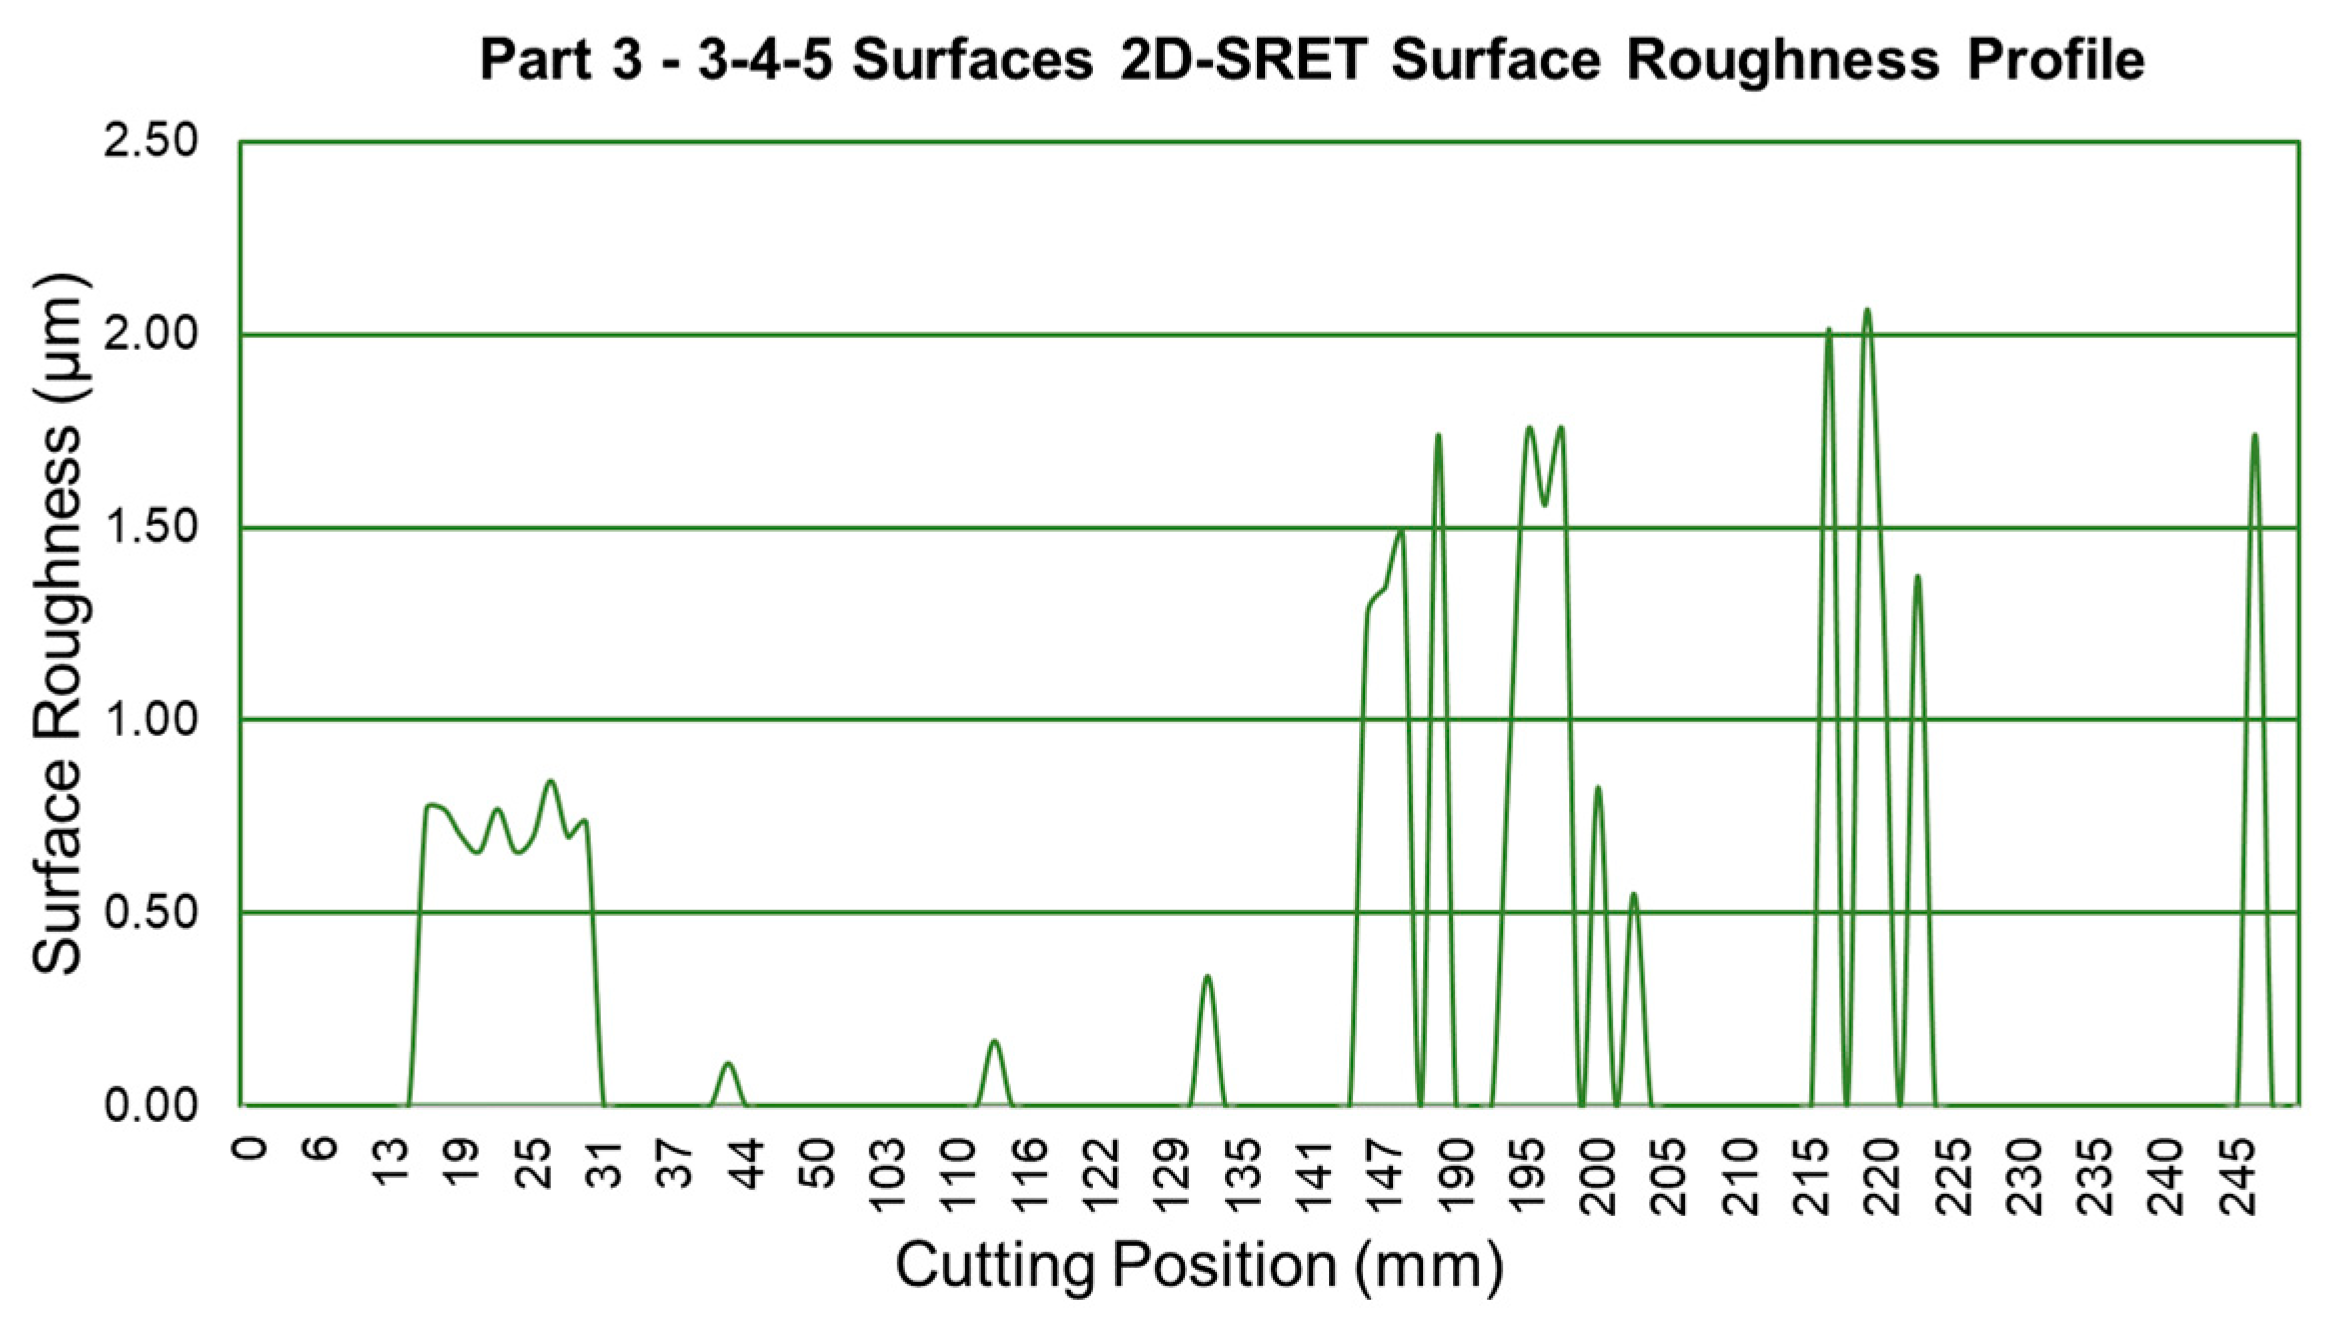
The CMM measurement of flatness is based on the second surface of the parts (datum). Because of that, the second surface has a zero value for flatness. Part 2’s 3-4-5 machined surfaces’ simulated surface roughness profiles are depicted in Figure 11, and the surface roughness profile shows that an increased difference between maximum and minimum local surface roughness values may give a higher flatness value. The fifth has large changes in the profile. The third and fourth surfaces have little change in profile compared to the fifth surfaces and accordingly lower flatness values.
Part 3’s fourth surface profile has almost zero changes, and it has good agreement with flatness measurement (zero flatness). To compare Part 2 and Part 3’s surface profiles in terms of flatness measurement, Figure 11 and Figure 12 should be considered together. There are also hard changes in Part 3’s fifth surface as in Part 2, and they have resulted in the same flatness value.
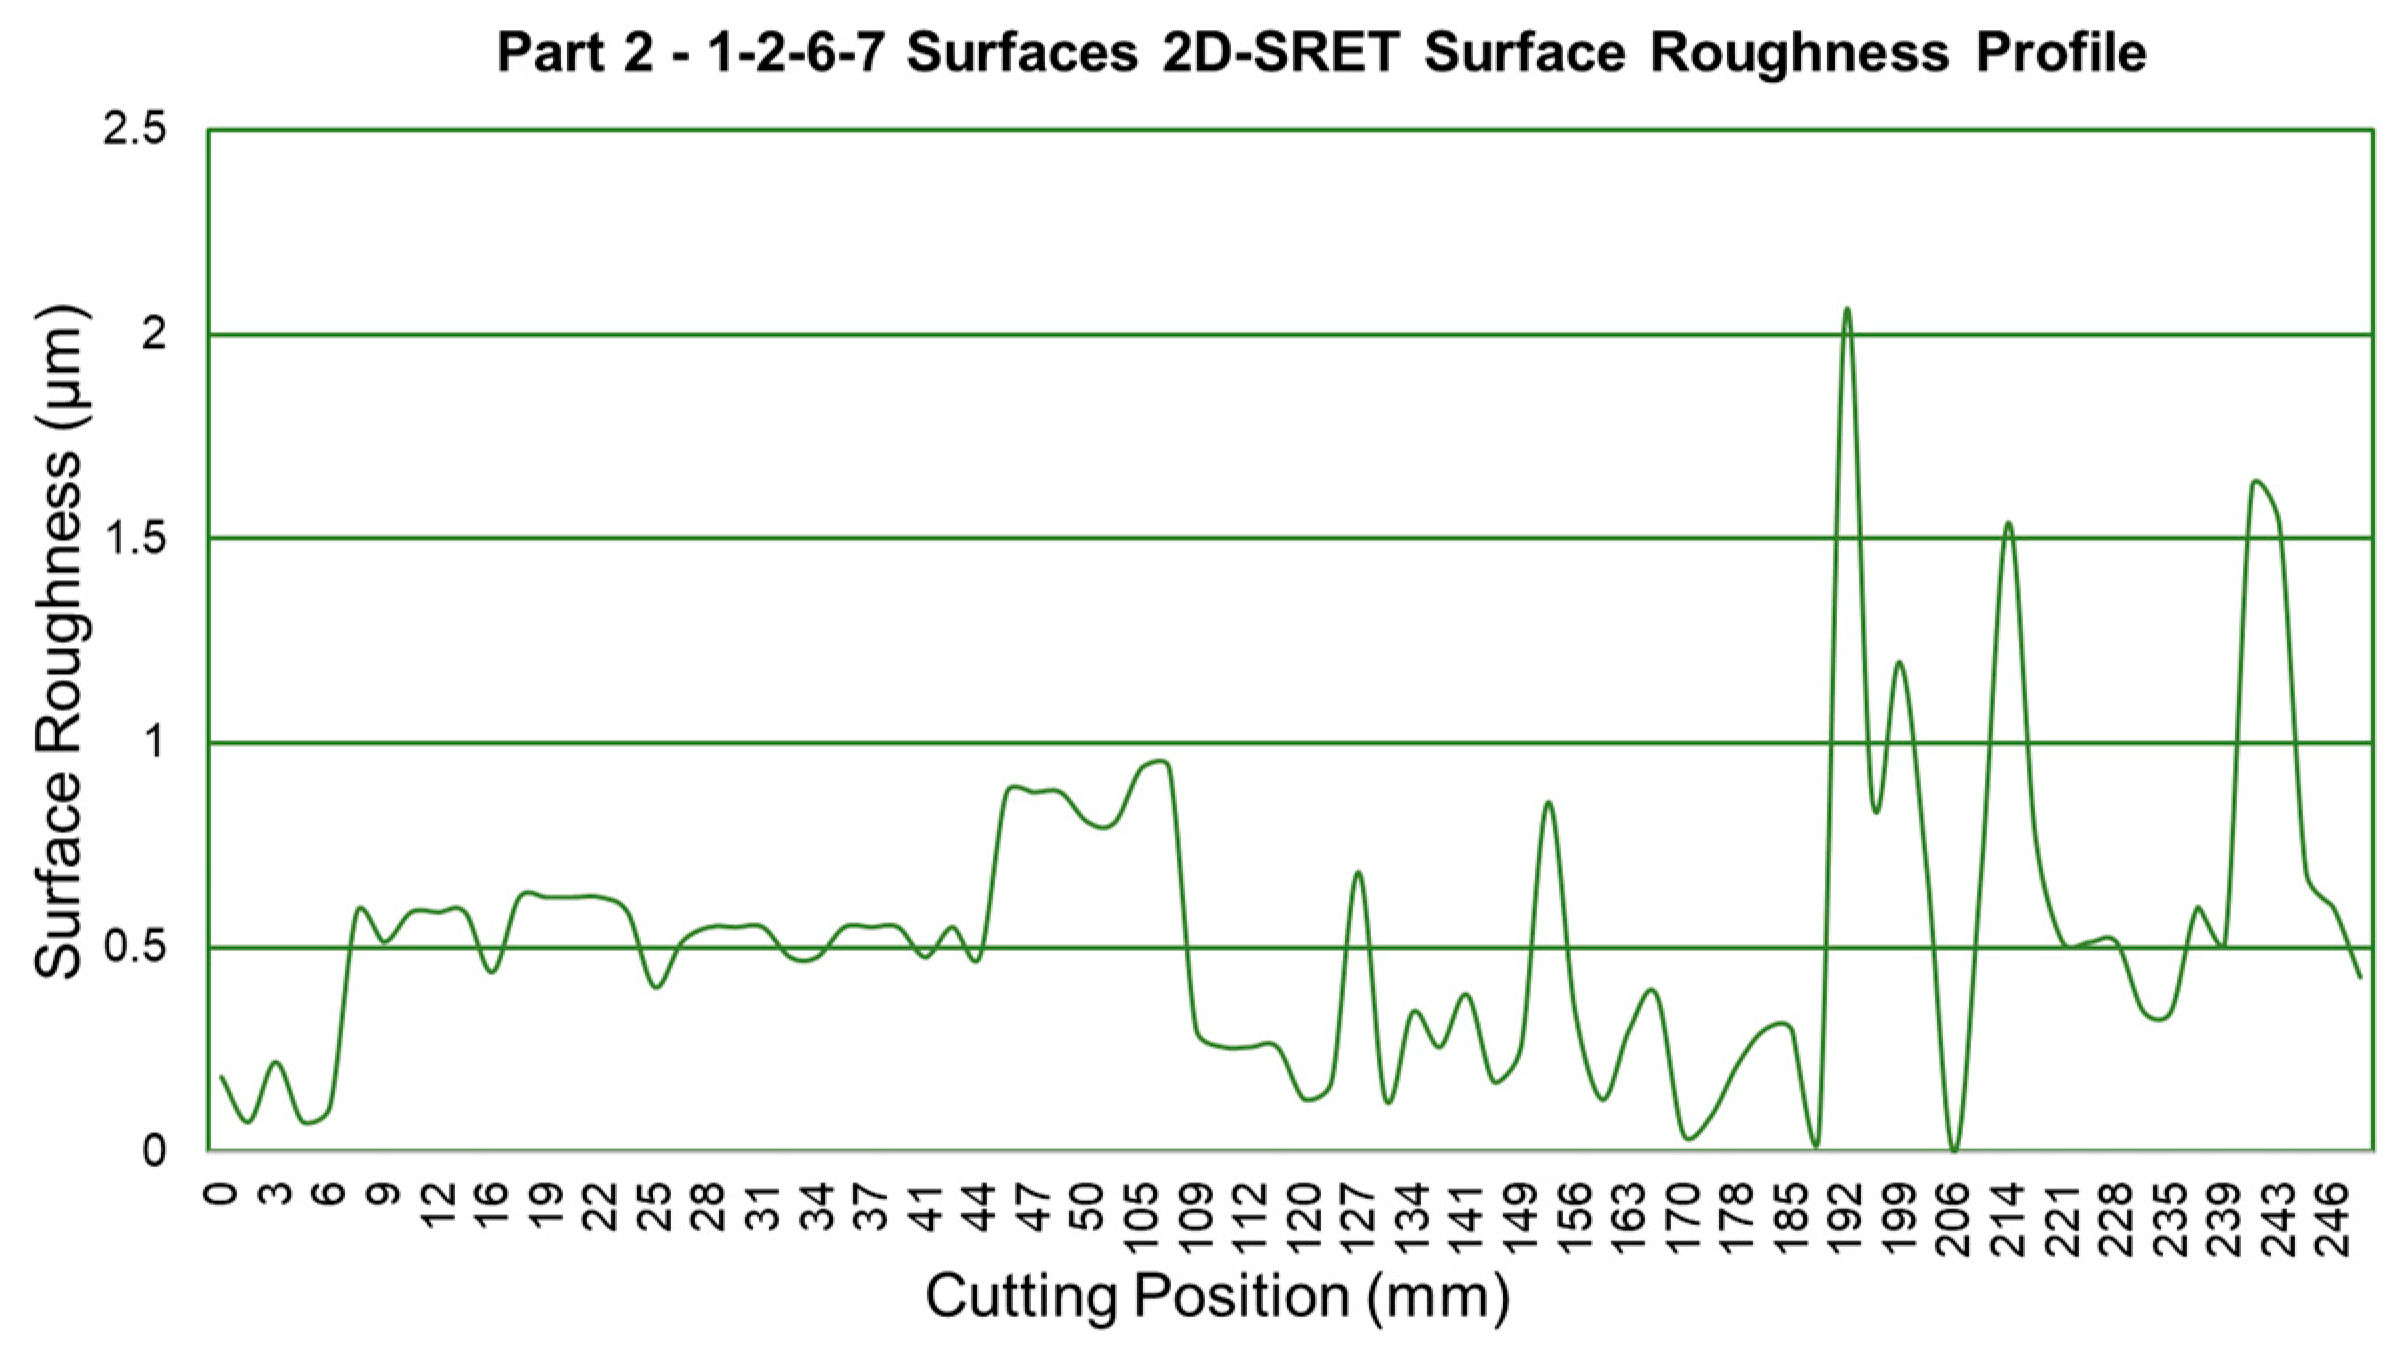
However, Part 3 shows harder changes on the fifth surface. This is related to the datum plane, which is the second surface and has its own different surface quality. Hence, evaluation of Figure 13 and Figure 14 is another point to understand. The second surface has much more deviation in Part 3 than in Part 2, and it is reasonable to have the same flatness value since the datum plane has more deviation than the other datum with an increase in deviations in the fifth surface.
The first and sixth surfaces and the second and seventh surfaces have the same profile in the same part’s simulation (with an assumption of the same dimensions). Part 2’s 1–2 surfaces have lower roughness values than Part 3. Also, the flatness value of Part 2’s first face is lower than Part 3’s first face. It should be understood that this is again very related to the datum plane’s surface profile and the measured surface’s profile differences. The sixth surface of Part 2 has a zero flatness value. It is the result of a CMM measurement that is taken from a region on the sixth surface that has very little change in roughness. It is in the cutting position of between 12 and 40 mm.

5. Conclusions

The present study introduces the 2D-SRET method, a novel approach that has been developed and validated for estimating surface quality issues. As shown in Figure 6, Figure 7 and Figure 8 (in the Section 2.2), this approach has proven to be reliable by producing accurate solutions that closely match experimental results.
The thermal modulus (cooling) and the machining parameters are the two main factors that affect surface quality issues in the casting and machining processes. By incorporating the numerical analysis results of surface roughness with the 2D-SRET method, new values are generated that exhibit good agreement with experimental data. This highlights the potential of 2D-SRET for enhancing surface quality evaluations. The selected target area or segment consistently yields specific answers, as observed in the main study.
The relationship between surface roughness and flatness has been shown by CMM measurements. Given the variable depth of cut, spindle speed, and feed rate, it is evident that the profile of surface roughness directly influences flatness, with sharp changes in profile leading to an increase in flatness.
To reduce variations, the numerical validation experiments use blocks with nearly homogeneous materials and uniform geometry. Nonetheless, the main investigation shows that discrete surface exploration can also be accomplished with 2D-SRET. Conversely, certain methods like artificial neural networks (ANNs) and regression modeling are specific to certain situations and necessitate repeated testing. The 2D-SRET process is highly adaptable, requiring only a single adjustment; in contrast, surface quality control may require additional controls and measurements.
In scenarios involving discrete surfaces, tool path optimization coupled with surface roughness estimation could mitigate potential impacts on neighboring surfaces. Addressing cooling-related material non-homogeneity through variable speeds within the same operation, along with optimizing toolpath, speeds, and surface roughness profile, can lead to the attainment of desired quality standards.

Author Contributions

Conceptualization, I.T.T. and A.H.E.; methodology, I.T.T.; software, I.T.T.; validation, I.T.T. and A.H.E.; formal analysis, I.T.T.; investigation, I.T.T.; resources, I.T.T.; data curation, I.T.T.; writing—original draft preparation, I.T.T.; writing—review and editing, A.H.E.; visualization, I.T.T.; supervision, A.H.E.; project administration, I.T.T.; funding acquisition, I.T.T. All authors have read and agreed to the published version of the manuscript.

Funding

This research received no external funding.

Data Availability Statement

Data are contained within the article.

Acknowledgments

The experiments are a part of ENTİL Endüstri Yatırımları Tic. A.Ş. company’s project. All tests have were conducted in their casting plant. We kindly appreciate the efforts of Efe Tasci in providing tests and of Mehmet Oktay.

Conflicts of Interest

The authors declare no competing interests.

Appendix A

Algorithm A1. Calculation of force matrix f(dof)
1 :
2 :
3 :
4 :
5 :
6 :
7 :
8 :
9 :
10 :
11 :
12 :
13 :
14 :
15 :
16 :
17 :
18 :
19 :
20 :
21 :
22 :
23 :
24 :
25 :
26 :
27 :
28 :
29 :
30 :
31 :
32 :
33 :
34 :
35 :
36 :
37 :
38 :
39 :
40 :
41 :
42 :
43 :
44 :
45 :
46 :
47 :
48 :
49 :
50 :
51 :
52 :
53 :
54 :
55 :
56 :
57 :
58 :
59 :
60 :
61 :
62 :
63 :
64 :
65 :
66 :
67 :
68 :
69 :
70 :
    Do while (bat.eq.1)
    step = step + 1
    sampling_time = 60
    table_feed = 7.5
    spindle_speed = 3900*degreetoradian
    step_y = table_feed / sampling_time
    step_rotation = spindle_speed/sampling_time
     if (step.eq. 1)
       teta(1) = 30*d2rd
       teta(2) = 90*d2rd
       teta(3) = 150*d2rd
       teta(4) = 210*d2rd
       teta(5) = 270*d2rd
       teta(6) = 330*d2rd
       delta_x = 0
       delta_y = 0
    endif
    delta_y = delta_y + step_y
    r = 50
    depth_of_cut = 250 − 0.3
    do i = 1,6
      posx(i) = raga*cos(teta(i)) + 0+deltx
      posy(i) = raga*sin(teta(i)) − 50 + delty
     enddo
    count_1 = 0
    count_2 = 0
    do j = 1,6
      count_2 = count_2 + 1
      do jj = 1,nn
        if (y_p(j) .ge. 0 .and. x(jj,2) .ge. depth_of_cut)
           if (y_p(j).ge.300) then
            bat = 2
           endif
          if (x(jj,1) .le. y_p(j) + 2 .and. x(jj,1) .ge. y_p(j) − 2)
          count_1 = count_1 + 1
          mak (count_1) = jj
          sak(count_1) = count_2
         endif
        endif
       enddo
       enddo
      count_3 = 0
    do xz = 1,ne
      do iu = 1,4
         in = 2*(connectivity(xz, iu) − 1)
         do jg = 1,count_1
          if (connectivity(xz,iu).eq.mak(jg))
          count_3 = count_3 + 1
          dof(count_3) = in + 1
          endif
            enddo
        enddo
       enddo
    zteta = −90*degreetoradian
    do mm = 1,nara
      beta = ztet + teta(sak(mm))
       do cc = 1,count_1
         if (dof(mm) .eq. dof(cc))
          f(dof(mm)) = F*sin(beta) + N
          f(dof(cc)) = F*sin(beta) + N
          f(dof(mm)) = f(dof(mm))+ f(dof(cc))
         else
          f(dof(mm)) = F*sin(beta) + N
         endif
         enddo
       enddo
        do gg = 1,6
         teta(gg) = teta(gg) + stepsp
        enddo
enddowhile

References

  1. Simunovic, G.; Simunovic, K.; Saric, T. Modelling and Simulation of Surface Roughness in Face Milling. Int. J. Simul. Model. 2013, 12, 141–153. [Google Scholar] [CrossRef]
  2. Ozcelik, B.; Bayramoglu, M. The Statistical Modeling of Surface Roughness in High-Speed Flat End Milling. Int. J. Mach. Tools Manuf. 2006, 46, 1395–1402. [Google Scholar] [CrossRef]
  3. Hoang, D.T.; Nguyen, N.-T.; Tran, Q.D.; Nguyen, T. Van Cutting Forces and Surface Roughness in Face-Milling of SKD61 Hard Steel. Stroj. Vestn.-J. Mech. Eng. 2019, 65, 375–385. [Google Scholar] [CrossRef]
  4. Raza, M.H.; Hafeez, F.; Zhong, R.Y.; Imran, A. Investigation of Surface Roughness in Face Milling Processes. Int. J. Adv. Manuf. Technol. 2020, 111, 2589–2599. [Google Scholar] [CrossRef]
  5. Saini, A.; Chauhan, P.; Pabla, B.; Dhami, S. Multi-Process Parameter Optimization in Face Milling of Ti6Al4V Alloy Using Response Surface Methodology. Proc. Inst. Mech. Eng. B J. Eng. Manuf. 2018, 232, 1590–1602. [Google Scholar] [CrossRef]
  6. Bharathi Raja, S.; Baskar, N. Application of Particle Swarm Optimization Technique for Achieving Desired Milled Surface Roughness in Minimum Machining Time. Expert. Syst. Appl. 2012, 39, 5982–5989. [Google Scholar] [CrossRef]
  7. Yadav, D.K.; Dixit, N.K.; Agarwal, D.; Khare, S.K. Optimization of Surface Roughness by Design of Experiment Techniques during CNC Milling Machining. Mater. Today Proc. 2022, 52, 1919–1923. [Google Scholar] [CrossRef]
  8. Yalcin, U.; Karaoglan, A.D.; Korkut, I. Optimization of Cutting Parameters in Face Milling with Neural Networks and Taguchi Based on Cutting Force, Surface Roughness and Temperatures. Int. J. Prod. Res. 2013, 51, 3404–3414. [Google Scholar] [CrossRef]
  9. Alharthi, N.H.; Bingol, S.; Abbas, A.T.; Ragab, A.E.; El-Danaf, E.A.; Alharbi, H.F. Optimizing Cutting Conditions and Prediction of Surface Roughness in Face Milling of AZ61 Using Regression Analysis and Artificial Neural Network. Adv. Mater. Sci. Eng. 2017, 2017, 7560468. [Google Scholar] [CrossRef]
  10. Oktem, H.; Erzurumlu, T.; Erzincanli, F. Prediction of Minimum Surface Roughness in End Milling Mold Parts Using Neural Network and Genetic Algorithm. Mater. Des. 2006, 27, 735–744. [Google Scholar] [CrossRef]
  11. Erzurumlu, T.; Oktem, H. Comparison of Response Surface Model with Neural Network in Determining the Surface Quality of Moulded Parts. Mater. Des. 2007, 28, 459–465. [Google Scholar] [CrossRef]
  12. Zain, A.M.; Haron, H.; Sharif, S. Prediction of Surface Roughness in the End Milling Machining Using Artificial Neural Network. Expert. Syst. Appl. 2010, 37, 1755–1768. [Google Scholar] [CrossRef]
  13. Lela, B.; Bajić, D.; Jozić, S. Regression Analysis, Support Vector Machines, and Bayesian Neural Network Approaches to Modeling Surface Roughness in Face Milling. Int. J. Adv. Manuf. Technol. 2009, 42, 1082–1088. [Google Scholar] [CrossRef]
  14. Razfar, M.R.; Farshbaf Zinati, R.; Haghshenas, M. Optimum Surface Roughness Prediction in Face Milling by Using Neural Network and Harmony Search Algorithm. Int. J. Adv. Manuf. Technol. 2011, 52, 487–495. [Google Scholar] [CrossRef]
  15. Razfar, M.R.; Asadnia, M.; Haghshenas, M.; Farahnakian, M. Optimum Surface Roughness Prediction in Face Milling X20Cr13 Using Particle Swarm Optimization Algorithm. Proc. Inst. Mech. Eng. B J. Eng. Manuf. 2010, 224, 1645–1653. [Google Scholar] [CrossRef]
  16. Ghoreishi, R.; Roohi, A.H.; Dehghan Ghadikolaei, A. Analysis of the Influence of Cutting Parameters on Surface Roughness and Cutting Forces in High Speed Face Milling of Al/SiC MMC. Mater. Res. Express 2018, 5, 086521. [Google Scholar] [CrossRef]
  17. Arizmendi, M.; Jiménez, A. Modelling and Analysis of Surface Topography Generated in Face Milling Operations. Int. J. Mech. Sci. 2019, 163, 105061. [Google Scholar] [CrossRef]
  18. Parhad, P.; Likhite, A.; Bhatt, J.; Peshwe, D. The Effect of Cutting Speed and Depth of Cut on Surface Roughness During Machining of Austempered Ductile Iron. Trans. Indian Inst. Met. 2015, 68, 99–108. [Google Scholar] [CrossRef]
  19. Akdemir, A.; Yazman, Ş.; Saglam, H.; Uyaner, M. The Effects of Cutting Speed and Depth of Cut on Machinability Characteristics of Austempered Ductile Iron. J. Manuf. Sci. Eng. 2012, 134, 021013. [Google Scholar] [CrossRef]
  20. Rao, B.; Shin, Y.C. Analysis on High-Speed Face-Milling of 7075-T6 Aluminum Using Carbide and Diamond Cutters. Int. J. Mach. Tools Manuf. 2001, 41, 1763–1781. [Google Scholar] [CrossRef]
  21. Rao, B.; Dandekar, C.R.; Shin, Y.C. An Experimental and Numerical Study on the Face Milling of Ti–6Al–4V Alloy: Tool Performance and Surface Integrity. J. Mater. Process Technol. 2011, 211, 294–304. [Google Scholar] [CrossRef]
  22. Wang, X.; Huang, C.; Zou, B.; Liu, G.; Zhu, H.; Wang, J. Experimental Study of Surface Integrity and Fatigue Life in the Face Milling of Inconel 718. Front. Mech. Eng. 2018, 13, 243–250. [Google Scholar] [CrossRef]
  23. Geuzaine, C.; Remacle, J.-F. Gmsh: A 3-D Finite Element Mesh Generator with Built-in Pre- and Post-Processing Facilities. Int. J. Numer. Methods Eng. 2009, 79, 1309–1331. [Google Scholar] [CrossRef]
  24. Seco Tools. Available online: https://www.secotools.com/article/p_00005693?language=en (accessed on 4 February 2024).
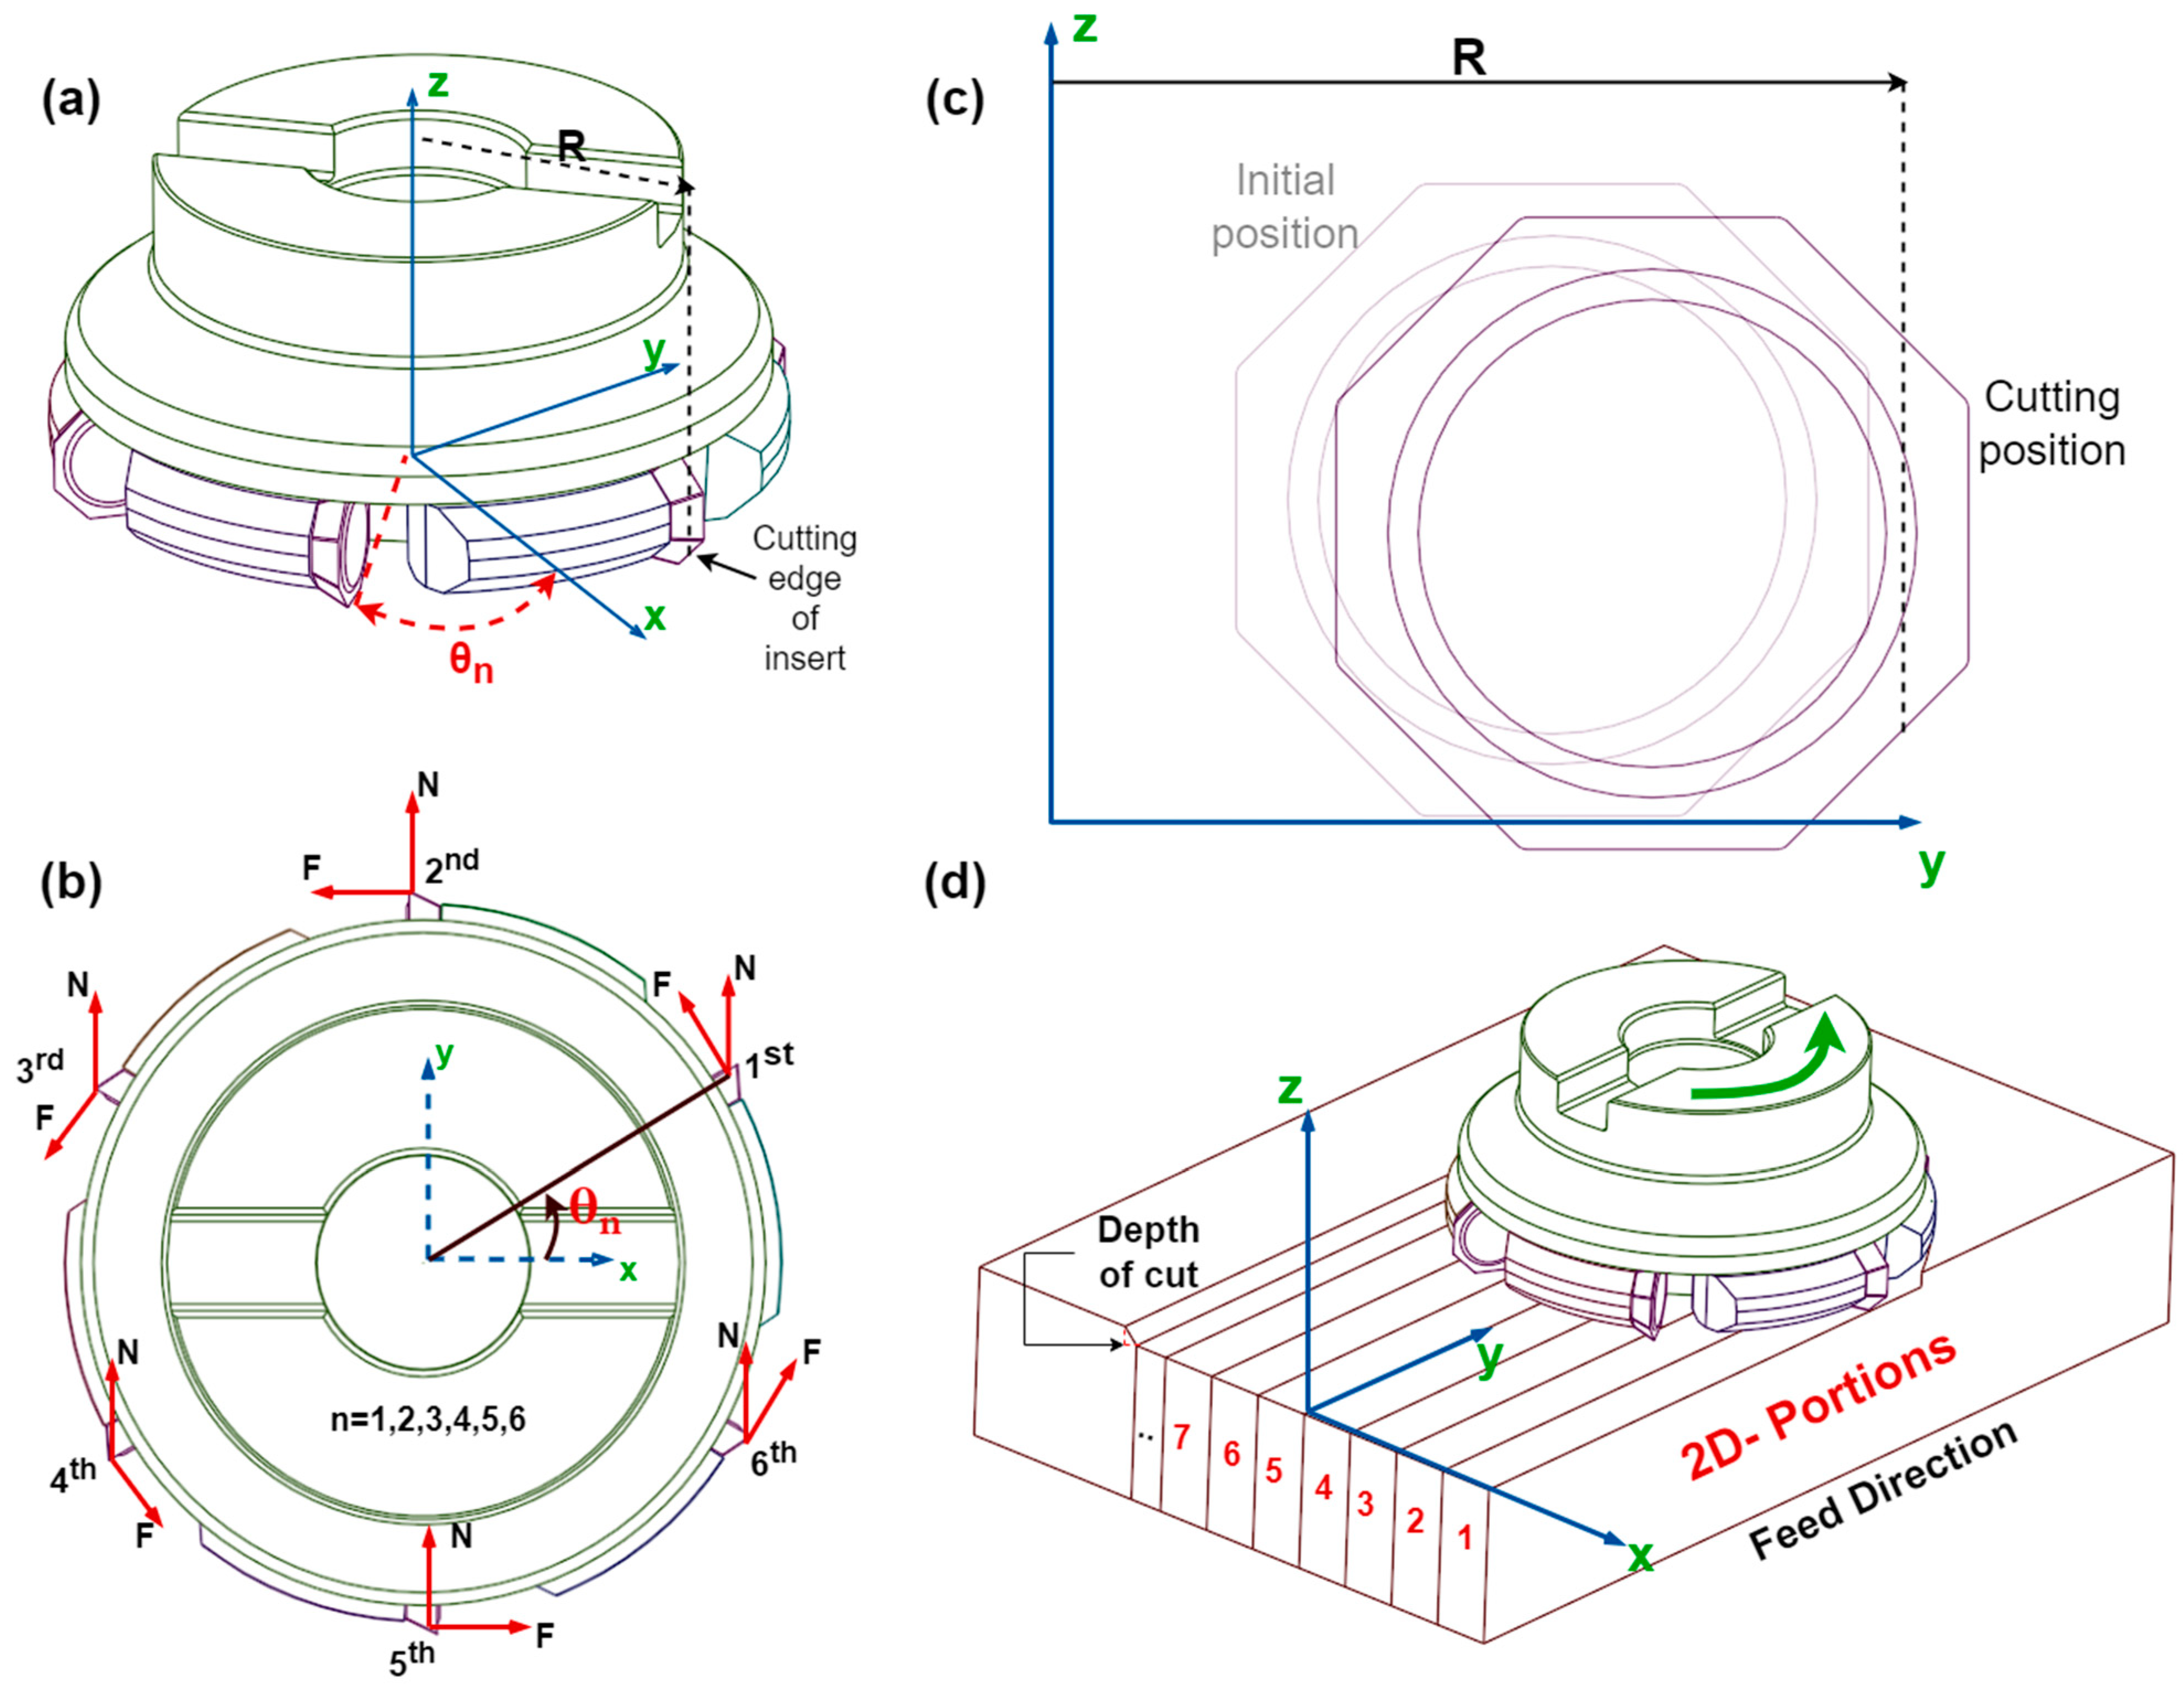
Figure 1. (a) Cutting tool, (b) cutting forces and angle of inserts, (c) insert, (d) 2D-portions for analysis.
Processes 12 00549 g001
Figure 4. Placement of gating system.
Processes 12 00549 g004
Figure 5. Schematic view of 2D-SRET algorithm.
Processes 12 00549 g005
Figure 6. Comparison of experimental [2] and numerical results (present 2D-SRET).
Processes 12 00549 g006
Figure 7. Comparison of reference study’s [9] experiments, regression [9], and ANN model [9] against 2D-SRET (present study) estimations.
Processes 12 00549 g007
Figure 8. Comparison of experiment [3] and 2D-SRET (present study) estimation.
Processes 12 00549 g008
Figure 9. Part 1 machined surfaces.
Processes 12 00549 g009
Figure 10. Percentage of surface roughness estimation error.
Processes 12 00549 g010
Figure 11. Simulated surface roughness profile on 3-4-5 faces of Part 2.
Processes 12 00549 g011
Figure 12. Simulated surface roughness profile on 3-4-5 faces of Part 3.
Processes 12 00549 g012
Figure 13. Simulated surface roughness profile on 1–2 and 6–7 faces of Part 2.
Processes 12 00549 g013
Figure 14. Simulated surface roughness profile on 1–2 and 6–7 faces of Part 3.
Processes 12 00549 g014
Table 1. Chemical composition of cast iron with grade EN-GJS-600-3.
ElementCSiMnPSCuMg
Percentage3.47%2.24%0.31%0.012%0.01%0.59%0.061%
Table 2. Treatment weight, pouring time, and used inoculation agents in the casting preparation of the cast iron.
Melting Pot No.Treatment Weight (kg)Fe-Si-Mg Usage Ladle InoculationLate InoculationCasting Temperature (°C)
P112001.5%0.4%0.1%1428
Pouring Time (s)Waiting Time at Production Line (hours)
18.26
Table 3. Cutting diameter and number of carbide inserts of the tool used in machining process.
Tool NameCutting Diameter (mm)Number of Inserts
Seco Tools [24]—R220.43-0100-07W1006
Table 4. Thermal modulus calculations.
Portion No.1234567
Thermal Modulus (cm)1.21.41.21.11.51.21.4
Dimensions (mm)45 × 45 × 100125 × 35 × 5045 × 30 × 10040 × 25 × 10045 × 60 × 5045 × 45 × 100125 × 35 × 50
Non-Cooled Area Effect10%30%30%30%30%10%30%
Table 5. First numerical validation parameters [2] and present study’s (2D-SRET) results.
No.Spindle Speed (rpm)Feed Rate (mm/min)Depth of Cut (mm)Step Over
(mm)
Experimental Surf. Rough. [2] (µm) 2D-SRET Surf. Rough.
(µm)
1850013200.740.760.904
2550013200.340.860.789
3700022400.531.261.048
4550034000.742.572.31
5550013200.721.090.987
8850034000.720.680.68 (adaptation)
10850034000.341.041.138
11550034000.722.742.61
2210,00022400.530.910.997
26700022400.130.740.665
28400022400.532.082.02
Table 6. Second numerical validation parameters [9] and present study’s (2D-SRET) results.
Spindle Speed (rpm)Depth of Cut (mm)Feed Rate (mm/min)Experimental Surf. Rough. [9] (µm) Regression Surf. Rough. [9] (µm)ANN-Surf. Rough. [9]
(µm)
2D-SRET Surf. Rough.
(µm)
5000.51500.3320.3010.3160.339
50012000.370.3270.3560.208
10000.51000.1840.1930.1580.153
100011500.2070.2240.2080.177
150011000.1810.1640.1620.155
15001.51500.2170.2000.1990.208
20001.51000.1550.1880.1690.173
200021500.2550.2300.2660.241
Table 7. Third numerical validation parameters [3] and present study’s (2D-SRET) results.
No.Vc
(m/min)
Depth of Cut
(mm)
Feed Rate (mm/Flute)Experimental
Surf. Rough. [3]
(µm)
2D-SRET Surf. Rough.
(µm)
1800.10.050.1660.180
4800.30.050.2150.180
7800.50.050.1850.182
111400.10.100.3590.292
141400.30.100.2870.292
171400.50.100.3720.350
192000.10.050.1920.194
212000.10.150.4130.429
222000.30.050.2000.196
242000.30.150.4440.429
252000.50.050.3050.234
272000.50.150.4920.492
Table 8. Experimental and numerical (2D-SRPET) surface roughness (µm) comparison and CMM measurement of flatness (mm).
Surface No.Spindle Speed
(rpm)
Feed Rate
(mm/min)
Depth of Cut (mm)1234567
Part 1
Raw Est
8002000.70.5170.4720.4620.4690.4780.5170.472
Final Est.8002000.70.620.6610.5540.5160.7170.6200.661
Experimental8002000.70.7130.6770.5040.4960.9700.7650.607
CMM
Flatness
8002000.70.0040.0000.0020.0010.0040.0030.003
Part 2
Raw Est.
7502500.50.5030.4330.2260.3870.3820.5030.433
Final Est.7502500.50.6030.6060.320.4250.5730.6040.606
Experimental7502500.50.4580.7790.4780.3890.5880.5180.637
CMM
Flatness
7502500.50.0010.0000.0010.0030.0050.0000.004
Part 3
Raw Est.
8001500.60.6260.6850.9640.6560.7580.6260.685
Final Est.8001500.60.7510.9591.1570.7231.1370.7510.959
Experimental8001500.60.9971.1040.7181.1281.2020.8610.935
CMM
Flatness
8001500.60.0070.0000.0030.0000.0050.0040.009
Part 4
Raw Est.
6001000.550.8911.050.8600.9241.210.8911.05
Final Est.6001000.551.0691.471.0321.0161.8151.0691.47
Experimental6001000.551.0690.7431.3360.7571.0131.0791.266
CMM
Flatness
6001000.550.0040.0000.0040.0000.0020.0030.007
Thermal Modulus (cm)1.21.41.21.11.51.21.4
Disclaimer/Publisher’s Note: The statements, opinions and data contained in all publications are solely those of the individual author(s) and contributor(s) and not of MDPI and/or the editor(s). MDPI and/or the editor(s) disclaim responsibility for any injury to people or property resulting from any ideas, methods, instructions or products referred to in the content.