Article

Performance Comparison of High-Temperature Heat Pumps with Different Vapor Refrigerant Injection Techniques

1
State Grid Zhejiang Electric Power Co., Ltd., Hangzhou 310007, China
2
State Grid Electric Power Research Institute Wuhan Efficiency Evaluation Company Limited, Wuhan 430074, China
3
Nari Group Corporation State Grid Electric Power Research Institute, Nanjing 210000, China
4
Shaoxing Power Supply Company, State Grid Zhejiang Electric Power Co., Ltd., Shaoxing 312000, China
5
Guangzhou Institute of Energy Conversion, Chinese Academy of Sciences, Guangzhou 510640, China
*
Authors to whom correspondence should be addressed.
Processes 2024, 12(3), 566; https://doi.org/10.3390/pr12030566
Submission received: 6 February 2024 / Revised: 6 March 2024 / Accepted: 7 March 2024 / Published: 13 March 2024
(This article belongs to the Special Issue Smart Wearable Technology: Thermal Management and Energy Applications)

Abstract

:
In order to develop a highly efficient and stable high-temperature heat pump to realize high-efficient electrification in the industrial sector, performance of high-temperature heat pumps with a flash tank vapor injection and sub-cooler vapor injection are compared under different evaporation temperatures, condensation temperatures, compressor suction superheat degrees, subcooling degrees and compressor isentropic efficiencies. The results show that the COP, injection mass flow ratio and VHC of the FTVC are higher than those of the SVIC-0, SVIC-5, SVIC-10 and SVIC-20 under the same working conditions, while the discharge temperature of the FTVC is approximately equal to that of the SVIC-0 and lower than those of the SVIC-5, SVIC-10 and SVIC-20. When the evaporation temperature, the condensation temperature and injection pressure are 55 °C, 125 °C and 921.4 kPa, respectively, the system COP of the FTVC is 4.49, which is approximately 6.7%, 7.3%, 7.8% and 8.9% higher than those of the SVIC-0, SVIC-5, SVIC-10, and SVIC-20, respectively.

1. Introduction

To cope with global climate change and carbon emission reduction, electricity-based and low-carbon alternatives are a global development trend in the heating sector. Industrial process heating is an important direction for the development of electricity-based alternatives in the future. According to the report of the International Energy Agency, global carbon dioxide emissions were 33.267 billion tons in 2019, of which the industrial sector accounted for about 40% of carbon dioxide emissions in energy consumption [1]. In Europe, 20% of total greenhouse gas emissions are currently from industrial processes. The heat pump is an important piece of equipment used to realize efficient industrial electrification to reduce greenhouse gas emissions.
The heat pump is an energy-saving and environmentally friendly technology. It extracts low temperature heat from a heat source by refrigerant state change and then transfers the high-temperature heat to a heat sink. During the heat transfer process, high grade energy (electric power or high-temperature heat) must be input to the heat pump. Normally, the heat transferred to a heat sink is several times greater than the electric power required to input the heat pump. Therefore, compared to conventional heating technologies such as boilers or electric heaters, heat the pump is far more efficient. However, the low output temperature of the traditional heat pump is insufficient at meeting the temperature requirements for heating in industrial processes, which limits the application of the heat pump in the industrial sector [2,3].
Refrigerant injection is a technique that uses some condensed refrigerant from the condenser outlet to inject to the compressor suction line, the sealed compressor pocket, or the condenser inlet in a vapor compression heat pump system. Refrigerant injection techniques can be used to lower the temperature of an electric motor, the compressor discharge temperature, reduce the compressor power consumption, and improve the cooling/heating capacity. Liquid refrigerant injection and vapor refrigerant injection are the two main types of refrigerant injection. Vapor refrigerant injection techniques have been widely used in the refrigeration system to improve the refrigeration system COP. The earliest vapor refrigerant injection technique was applied in cold storage, freezing engineering. When the heat pump system was applied in a cold region, the high compression pressure ratio would lead to a considerably high discharge temperature and low COP. So, the vapor refrigerant injection technique is also widely used in heat pump systems applied in cold regions. Xue et al. experimentally analyzed the refrigerant vapor-injection air source heat pump system with R32 used as the working fluid. The results showed that the injection ratio, heating capacity and compressor power consumption of the system increased with the increase in intermediate pressure, while the discharge temperature decreased. The heating COP decreased with the increase in intermediate pressure when the ambient temperature was higher than −5 °C. But when the ambient temperature was below −5 °C, the COP first increased and then decreased with the increase in intermediate pressure [4]. Roh et al. found that the advantage of the refrigerant vapor-injection technique under the condition of a small pressure ratio was not significant [5,6]. Zhang et al. established the refrigerant vapor-injection air source heat pump system in Lanzhou, China. The experimental results showed that the energy efficiency of the refrigerant vapor-injection air source heat pump system increased by 4~6% compared with that of the air source heat pump system without refrigerant vapor-injection [7]. Heo et al. investigated the influence of the refrigerant vapor-injection on the performance of the two-stage heat pump system. The results showed that under the ambient temperature of −25 °C, the COP and heat capacity increased by 10% and 25% compared with the two-stage heat pump system without refrigerant vapor-injection [8,9]. Mathison et al. studied the influence of the refrigerant vapor-injection technique with multiple injection ports on the performance of heat pumps. The results showed that the performance of heat pumps improved significantly for air conditioning and refrigeration applications when an economized refrigerant was injected at an infinite number of ports to maintain saturated vapor in the compressor [10].
Different types of refrigerant injection show different effects on the heating performance of heat pumps. Wang et al. found that two-phase suction, liquid injection and two-phase injection could effectively decrease the discharge temperature of an R32 scroll compressor used in a heat pump, and the two-phase injection showed better performance than the other two methods in cooling capacity and COP [11]. Qi et al. developed a hybrid vapor injection air-source heat pump cycle with sub-cooler and flash tank using R290 as a refrigerant. The simulation results indicated that the coefficient of performance and the volumetric heating capacity of the hybrid vapor injection cycle could be 2.8–3.3% and 6.4–8.8% higher than those of the conventional sub-cooler vapor injection cycle system and 1.1–2.0% and 3.2–6.0% higher than those of the flash tank vapor injection cycle system, respectively [12]. Kim et al. established a numerical model to compare and analyze the influence of liquid, vapor and two-phase injection techniques on the performance of heat pumps with a scroll compressor using R410A. Results showed that there was an optimum injection quality that made the two-phase injection heat pump exhibit the highest COP among all injection types and the two-phase injection heat pump with optimum injection quality more effective at improving the COP and reducing the discharge temperature when the outdoor temperature decreased [13].
The high-temperature heat pump needs to solve the problems of low efficiency and high discharge temperatures brought about by the large temperature rise, and the refrigerant vapor-injection technique is an important technical means to solve these problems. Previous studies mainly focus on the effect of the refrigerant vapor-injection technique on a conventional heat pump system. There are still only a few research studies which focus on analyzing refrigerant vapor-injection techniques on performance of the HTHP system, especially on the HTHP system with output temperatures higher than 100 °C. In this paper, the performance of high-temperature heat pumps with flash tank vapor injection (FTVI) and sub-cooler vapor injection (SCVI) are compared under different evaporation temperatures, condensation temperatures, compressor suction superheat degrees, sub-cooling degrees and compressor isentropic efficiencies.

2. System Description

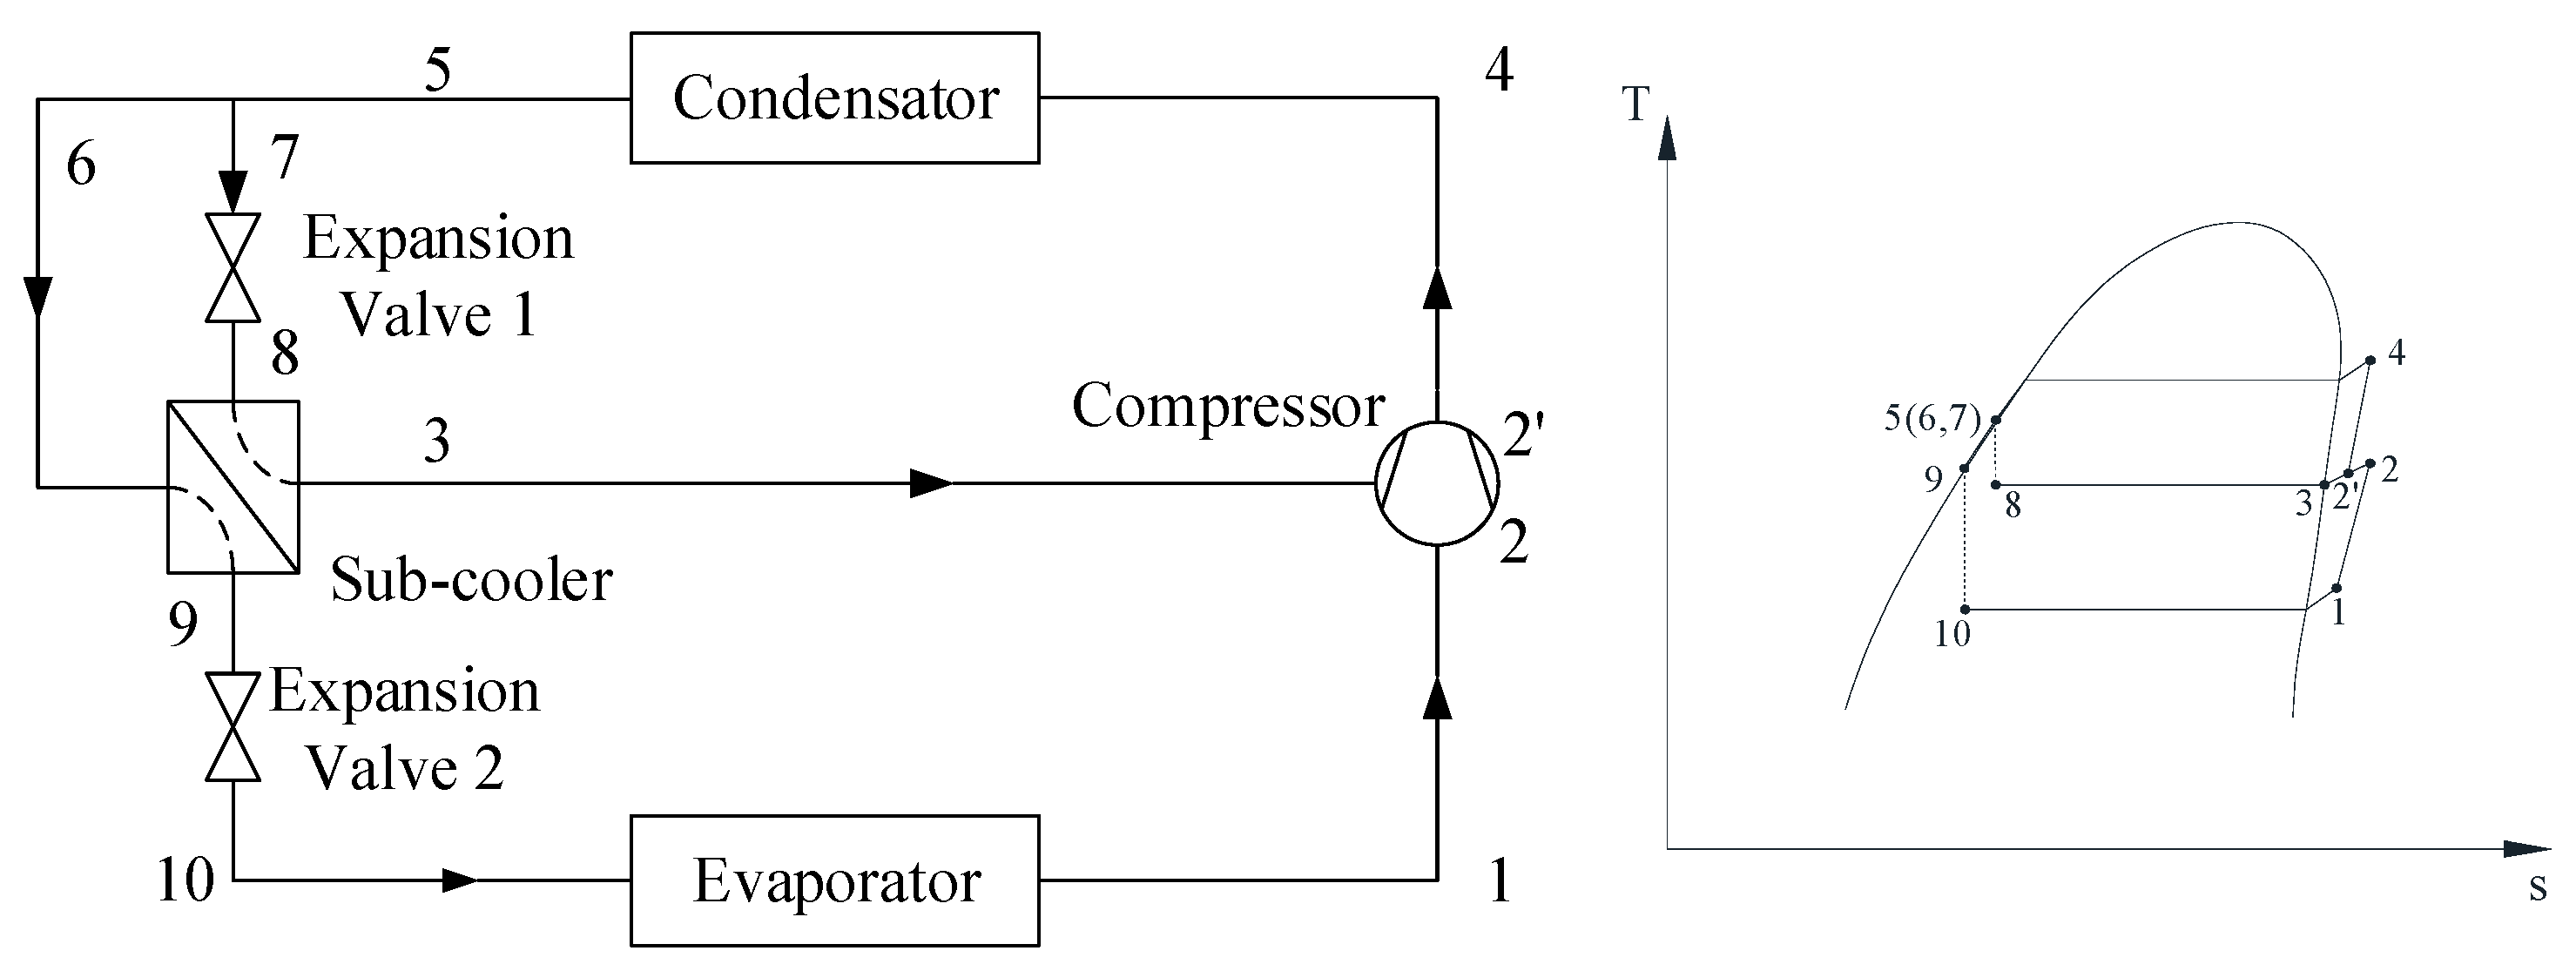
There are two types of vapor injection cycles: the flash tank vapor injection (FTVI) cycle and the sub-cooler vapor injection (SCVI) cycle. In the FTVI cycle, the injected vapor refrigerant is provided by phase separation in the flash tank. Firstly, the vapor-liquid two-phase refrigerant absorbs heat from the heat source and the liquid refrigerant evaporates and becomes vapor refrigerant in the evaporator. Then the vapor refrigerant enters the compressor suction and is compressed to the intermediate pressure. The compressed vapor refrigerant from the compressor suction mixes with vapor refrigerant from the flash tank at the intermediate pressure location in the compressor. The mixed vapor refrigerant continues to be compressed to the condensing pressure and is discharged to the condenser. The compressed high-temperature vapor refrigerant releases heat to the heat sink and condensed to liquid refrigerant in the condenser. The condensed liquid refrigerant flows through expansion valve 1 and expands to be vapor-liquid two-phase refrigerant at the intermediate pressure. Then the vapor-liquid two-phase refrigerant is separated into liquid-phase refrigerant and vapor-phase refrigerant in the flash tank. The liquid refrigerant enters expansion valve 2 and then circulates through the evaporator. The vapor-phase refrigerant is injected into the compressor pocket at the intermediate pressure, as shown in Figure 1. In the SCVI cycle, the injected vapor refrigerant is generated from the sub-cooler. The vapor-liquid two-phase refrigerant absorbs heat from the heat source and the liquid refrigerant evaporates to vapor refrigerant just like evaporation part of the FTVI cycle. Then the vapor refrigerant flows into the compressor suction and is compressed to the intermediate pressure. The compressed vapor refrigerant from the compressor suction mixes with vapor refrigerant from the sub-cooler at the intermediate pressure location in the compressor. The mixed vapor refrigerant continues to be compressed to condensing pressure and then enters the condenser. The high-pressure and high-temperature vapor refrigerant condenses to liquid refrigerant by releasing heat to the heat sink. The liquid refrigerant from the condenser is separated into two paths. One path injects the refrigerant to the compressor pocket in the intermediate pressure. In this path, the liquid refrigerant from the condenser passes through expansion valve 1 and becomes two-phase refrigerant in the intermediate pressure. The two-phase refrigerant absorbs heat from refrigerant in another path in the sub-cooler and becomes vapor which is then injected into the compressor pocket in the intermediate pressure. In another path, the liquid refrigerant from the condenser is subcooled by two-phase refrigerant injected to the compressor pocket in the intermediate pressure. Then the sub-cooled liquid enters expansion valve 2 and flows to the evaporator, as shown in Figure 2.
Refrigerant has a decisive influence on the design of HTHPs, so the selection of the refrigerant is key in the design of HTHPs. A suitable refrigerant for HTHPs should have excellent thermodynamic properties at the operating conditions of high-temperature and pressure, it should also be highly energy efficient, commercially available, have low global warming potential (GWP), a zero or negligible Ozone Depletion Potential (ODP) and other factors. The critical temperature of refrigerant is an important property when selecting working fluids for HTHPs. The upper temperature limit of subcritical heat pump cycles is determined by the critical temperature of the refrigerant. A temperature gap of about 10 to 15 K from the desired condensation temperature has to be maintained to ensure subcritical heat pump operation [14]. Additionally, the pressure level of the heat pump system is also an important property for selecting working fluid. The higher pressure should be kept below a practical value of about 25 bar, and the pressure ratio should be as low as possible [15]. HFC-245fa belongs to hydrofluorocarbon chemicals and offers zero ODP and relatively high critical temperatures of 154.0 °C at moderate pressures of 36.5 bar, which is suitable for HTHPs, so R245fa is selected as the working fluid of the high-temperature heat pump. The parameters of HFC-245fa are shown in Table 1.

3. Model Establishment

3.1. Assumptions and Boundary Conditions

To analyze the performance of high-temperature heat pumps with different vapor injection techniques, mathematical models are developed based on assumptions as follows:
(1)
The working fluid in the heat pump system is steady state;
(2)
The heat loss and pressure loss in heat exchangers and pipelines are ignored;
(3)
The compressor efficiencies in heat pumps are constant;
(4)
The expansion valve process is considered isenthalpic.
The reference values and the boundary conditions are shown in Table 2.

3.2. Model Establishment

Thermodynamics models of high-temperature heat pumps with flash tank vapor injection and sub-cooler vapor injection are established based on the energy conservation equation and the mass conservation equation.
In the condenser, heat transfers from the working fluid to the heat sink and the enthalpy of the working fluid decreases while the pressure loss is slight. So, the condensation process can be considered as heat release process with constant pressure. Condensation heat can be calculated as Equation (1) with the product of working fluid mass flow rate and the inlet and outlet condenser enthalpy difference.
Q cond = ( 1 + A ) × m ˙ ref × ( h cond , in h cond , out )
The expansion valve throttling process is considered as the isenthalpic process, so
h th , in = h th , out
For the SCVI heat pump system, heat transfer takes place in the sub-cooler, so
m ˙ ref × ( h 6 h 9 ) = m ˙ ref × A × ( h 3 h 8 )
For the flash tank in the FTVI heat pump system
m ˙ r e f × ( 1 + A ) × h 6 = m ˙ r e f × h 7 + m ˙ r e f × A × h 3
In the evaporators of the two heat pump systems, evaporation heat can be calculated as Equation (5) with the product of working fluid mass flow rate and the inlet and outlet evaporator enthalpy difference:
Q evap = m ˙ ref × ( h evap , out h evap , in )
In compression processes of the two cycles, processes 1–2 and 2’–4 are the adiabatic compression process, and process 3–2 can be treated as the mixing process with a constant pressure, so
h 2 = ( h 2 s h 1 ) / η is + h 1
h 4 = ( h 4 s h 2 ) / η is + h 2
m ˙ ref × ( 1 + A ) × h 2 = m ˙ ref × h 2 + m ˙ ref × A × h 3
W c 1 = m ˙ ref ( h 2 h 1 )
W c 2 = m ˙ ref × ( 1 + A ) × ( h 4 h 2 )
W = W c 1 + W c 2
Injection mass flow ratio A and relative injection pressure RIP are defined as follows:
A = m ˙ inj m ˙ ref
R I P = P inj P cond P evap
The compressor discharge temperature can be calculated from the condensation pressure and refrigerant enthalpy at the compressor outlet.
t disch = f ( P cond , h disch )
Most commonly, the coefficient of performance (COP) is used to evaluate the efficiency of a heat pump system. The COP is obtained from the heating capacity and the compressor power consumption, as shown in Equation (15). To compare the influence of the heating capacity and the volumetric flow rate at the suction line, the volumetric heating capacity (VHC) is calculated using Equation (16):
C O P = Q cond / ( W c 1 + W c 2 )
V H C = Q cond / m ˙ ref ν 1

4. Results and Discussion

Evaporation temperature, condensation temperature, compressor suction superheat degree, sub-cooling degree and compressor isentropic efficiency are the main factors that influence the performance of a high-temperature heat pump. So, the performance of a high-temperature heat pump with flash tank vapor injection and that with sub-cooler vapor injection are compared under these different main factors.

4.1. Performance Comparison under Different Evaporation Temperatures

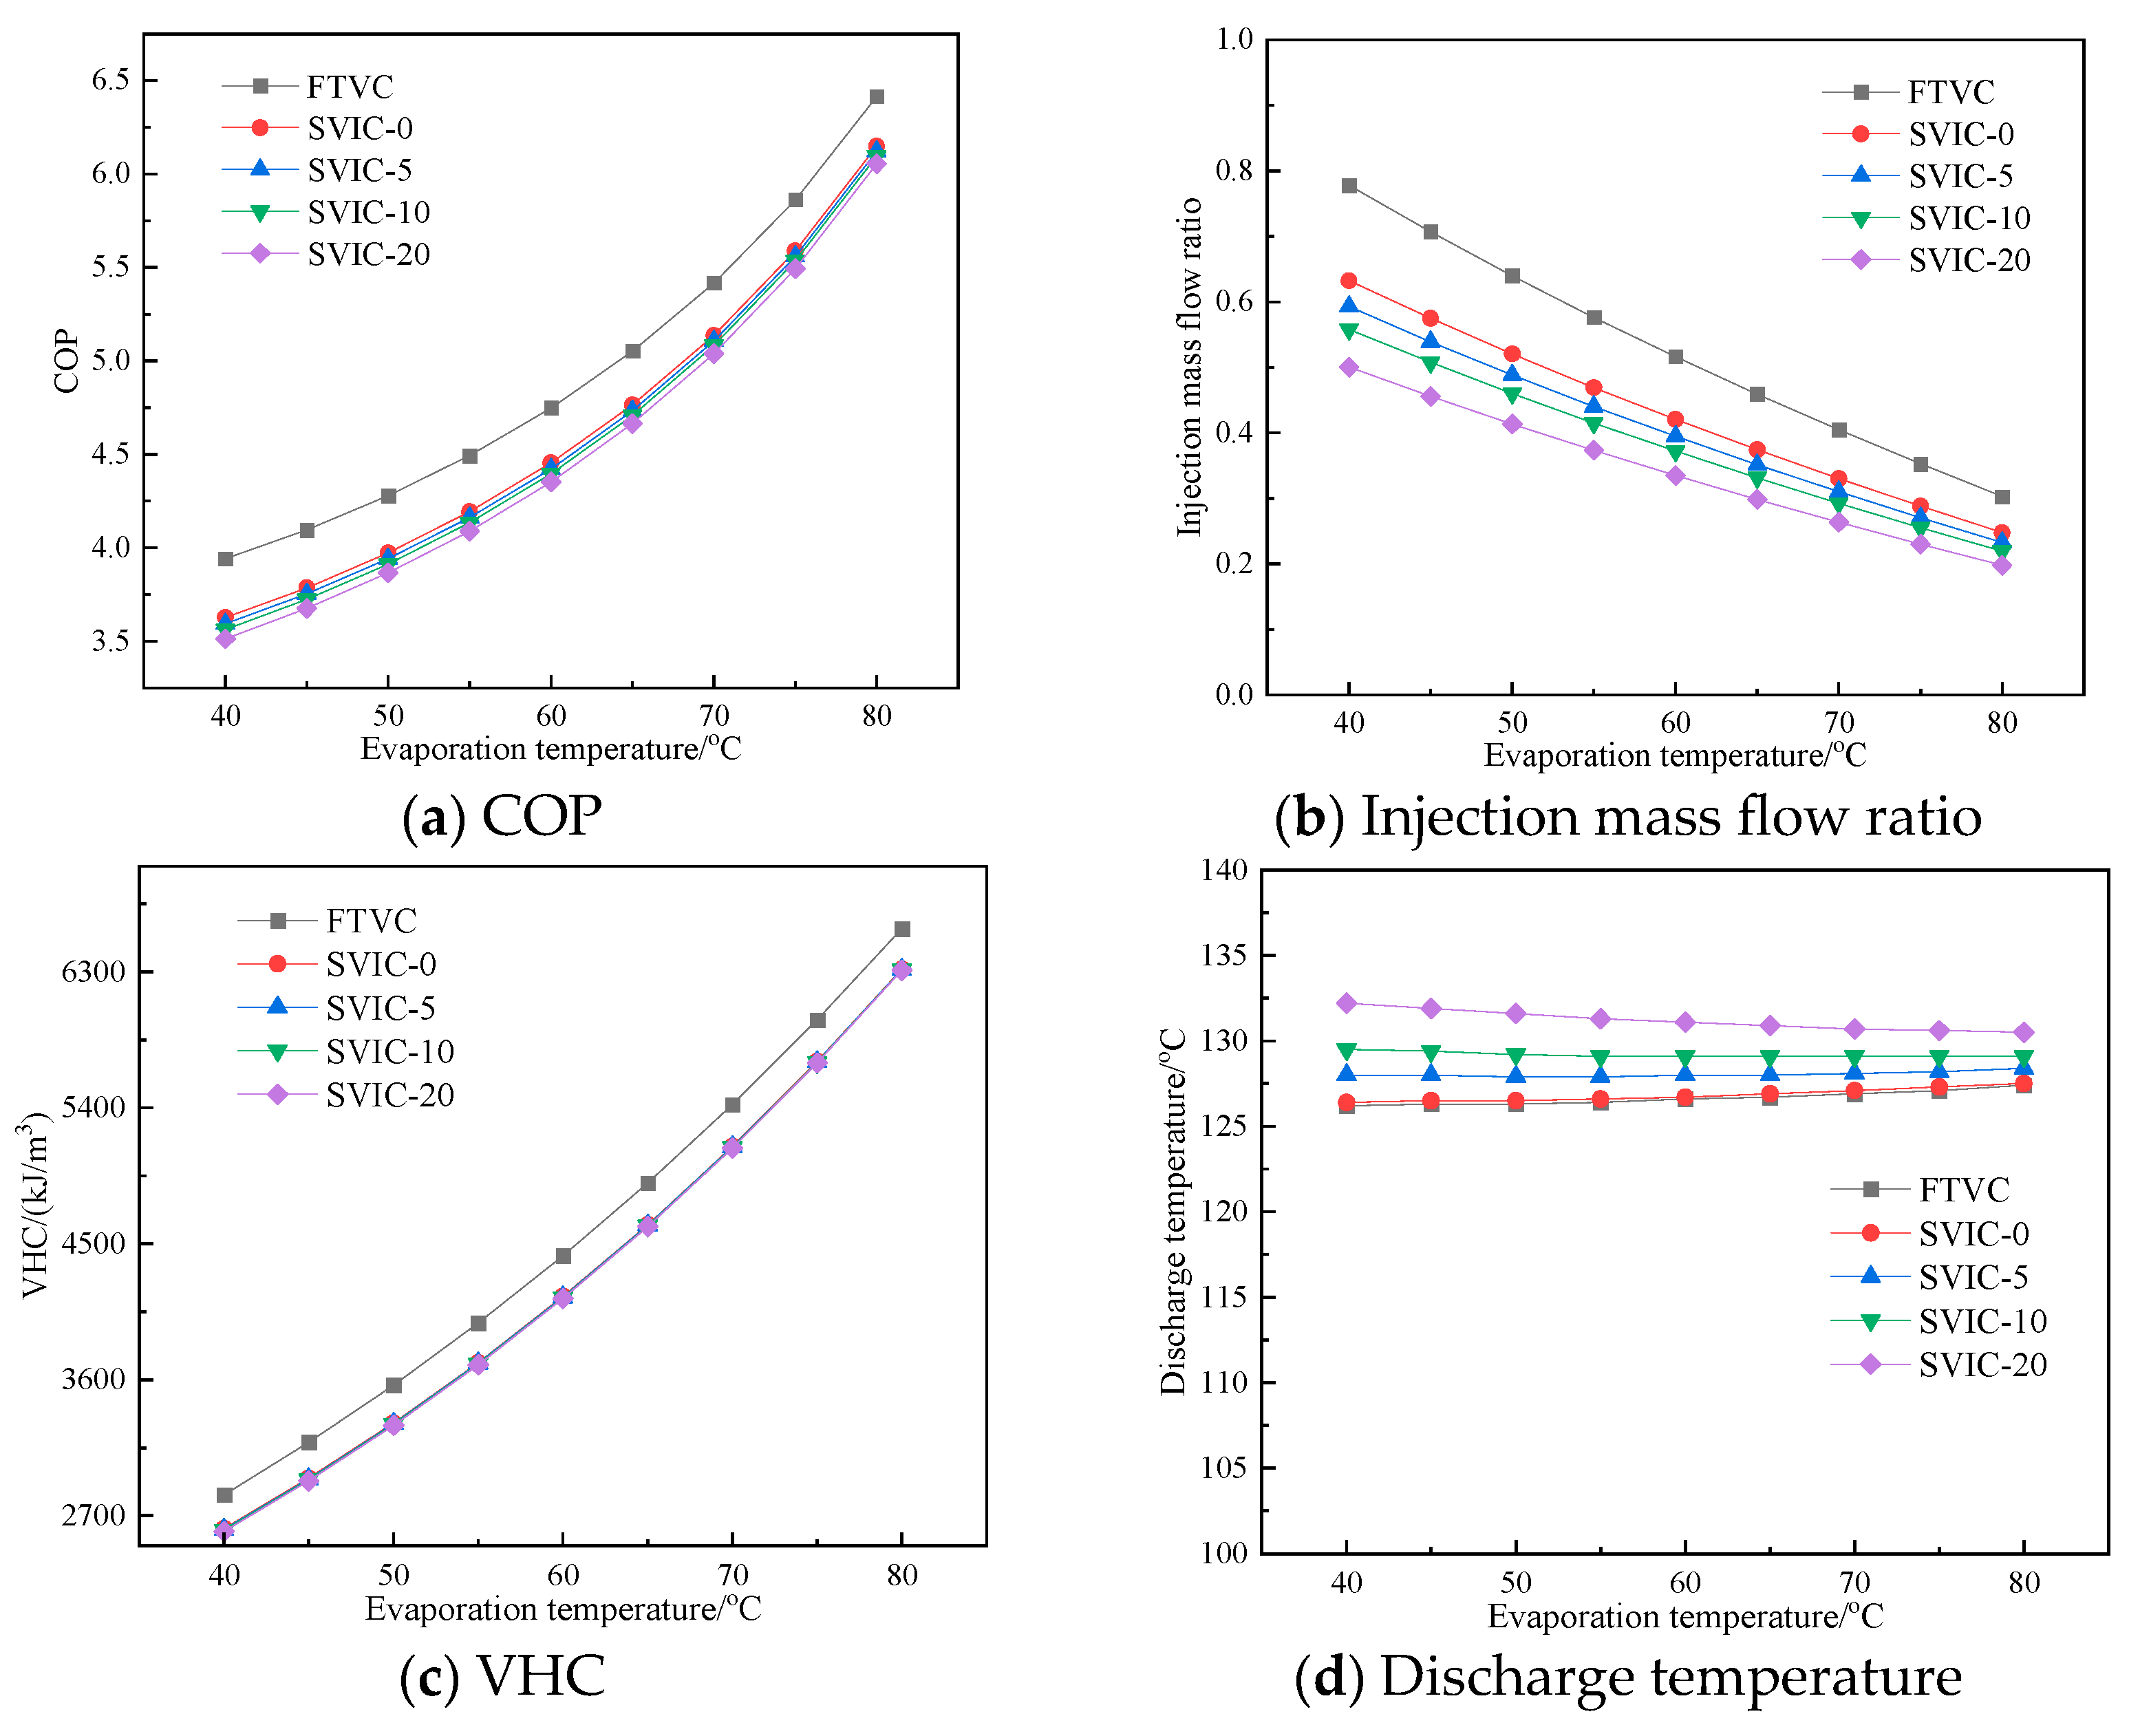
Figure 3 shows the performance comparison at different evaporation temperatures of the high-temperature heat pump cycles with flash tank vapor injection and sub-cooler vapor injection. One of the important differences between the two cycles is that the refrigerant vapor injected into the compressor of the FTVC is in a saturated state, while that of the SVIC can be in either a saturated state or superheated state. Therefore, the SVIC with different injection superheat degrees are also investigated. SVIC-0, SVIC-5, SVIC-10 and SVIC-20 represent the SVIC with the injection superheat degrees of 0 °C, 5 °C, 10 °C and 20 °C, respectively. As can be seen from Figure 3a, the COP of the FTVC system is higher than the SVIC at the same evaporation temperature. At the same time, it can be seen from Figure 3a that the COP of the SVIC heat pump system decreases as the injection superheat degree increases. When the evaporation temperature, the condensation temperature and injection pressure are 55 °C, 125 °C and 921.4 kPa, the system COPs corresponding to the FTVC, SVIC-0, SVIC-5, SVIC-10 and SVIC-20 are 4.49, 4.19, 4.16, 4.14 and 4.09, respectively, and the COPs of the FTVC are 6.7%, 7.3%, 7.8% and 8.9% higher than those of the systems of the SVIC-0, SVIC-5, SVIC-10 and SVIC-20, respectively. Figure 3b shows that the injection mass flow ratio decreases with the increase in evaporation temperature, which is explained by the fact that the increase in evaporation temperature leads to the decrease in pressure difference between the condensation pressure and injection pressure. It can also be seen from Figure 3b that the injection mass flow ratio of the FTVC is higher than those of the SVIC under different injection superheat degrees, which causes the higher COP of the FTVC than that of the SVIC under the same injection pressure. At the evaporation temperature of 55 °C, condensation temperature of 125 °C and injection pressure of 921.4 kPa, the injection mass flow ratio of the FTVC is 18.6%, 23.6%, 28.0% and 35.2% higher than the SVIC-0, SVIC-5, SVIC-10 and SVIC-20, respectively. Figure 3c shows that the volumetric heating capacity of the FTVC is also higher than those of the SVIC at different injection superheat degrees. When the evaporation temperature, the condensation temperature and injection pressure are 55 °C, 125 °C and 921.4 kPa, the VHCs of the FTVC, SVIC-0, SVIC-5, SVIC-10 and SVIC-20 are 3976, 3714, 3710, 3706 and 3699 kJ/m3, respectively. Figure 3d shows the discharge temperature of different systems at different evaporation temperatures. According to Figure 3d, the FTVC and SVIC-0 have equivalent discharge temperatures at different evaporation temperatures. When the evaporation temperature and the injection superheat degree increase, the discharge temperature increases.

4.2. Performance Comparison under Different Condensation Temperatures

Figure 4 shows the performance comparison of the FTVC and SVIC at different condensation temperatures. From Figure 4a, it can be seen that at the same injection pressure and condensation temperature, the COP of the FTVC system is always higher than those of the SVIC with different injection superheat degrees. The higher condensation temperature leads to the larger COP difference between the FTVC system and the SVIC system. At the evaporation temperature of 55 °C, condensation temperature of 100 °C, compressor suction superheat degree and condensation subcooling degree of 5 °C, COPs corresponding to the FTVC, SVIC-0, SVIC-5, SVIC-10, and SVIC-20 are 6.15, 5.93, 5.92, 5.90 and 5.88, respectively. COP of the FTVC is 3.7%, 3.9%, 4.2% and 4.6% higher than those of the SVIC-0, SVIC-5, SVIC-10, and SVIC-20, respectively. When the condensation temperature is 130 °C and the other conditions are kept the same, COP of the FTVC is 7.9%, 8.9%, 9.8% and 11.3% higher than those of the SVIC-0, SVIC-5, SVIC-10 and SVIC-20, respectively. According to Figure 4b, the injection mass flow ratio increases with the increase in condensation temperature. The main reason is that as the condensation temperature increases, the pressure difference between the condensation pressure and the injection pressure increases, causing the injection vapor mass flow rate to increase. At the evaporation temperature of 55 °C, condensation temperature of 100 °C, compressor suction superheat degree and condensation subcooling degree of 5 °C, the injection vapor mass flow ratio of the FTVC is 24.2%, 29.9%, 35.5% and 46.6% higher than those of the SVIC-0, SVIC-5, SVIC-10 and SVIC-20. When the condensation temperature is 130 °C and the other conditions are kept the same, the injection vapor mass flow ratio of the FTVC is 22.5%, 31.4%, 40% and 57% higher than those of SVIC-0, SVIC-5, SVIC-10, and SVIC-20, respectively. Figure 4c shows that the VHC of the FTVC increases with the increase in condensation temperature and the SVIC-0, SVIC-5, SVIC-10 and SVIC-20 slightly decrease with the increase in condensation temperature. At the evaporation temperature of 55 °C, condensation temperature of 130 °C, compressor suction superheat degree and condensation subcooling degree of 5 °C, the VHCs of the FTVC, SVIC-0, SVIC-5, SVIC-10 and SVIC-20 are 4015, 3723, 3717, 3712 and 3702 kJ/m3, respectively. Compared with the condensation temperature of 100 °C, the VHC of the FTVC increases by 3.5%, while the VHCs of SVIC-0, SVIC-5, SVIC-10 and SVIC-20 decrease by 0.5%, 0.7%, 0.8% and 1.1%, respectively. Figure 4d shows the discharge temperature at different condensation temperatures. When the condensation temperature and the injection superheat degree increase, the discharge temperature increases.

4.3. Performance Comparison under Different Suction Superheat Degrees

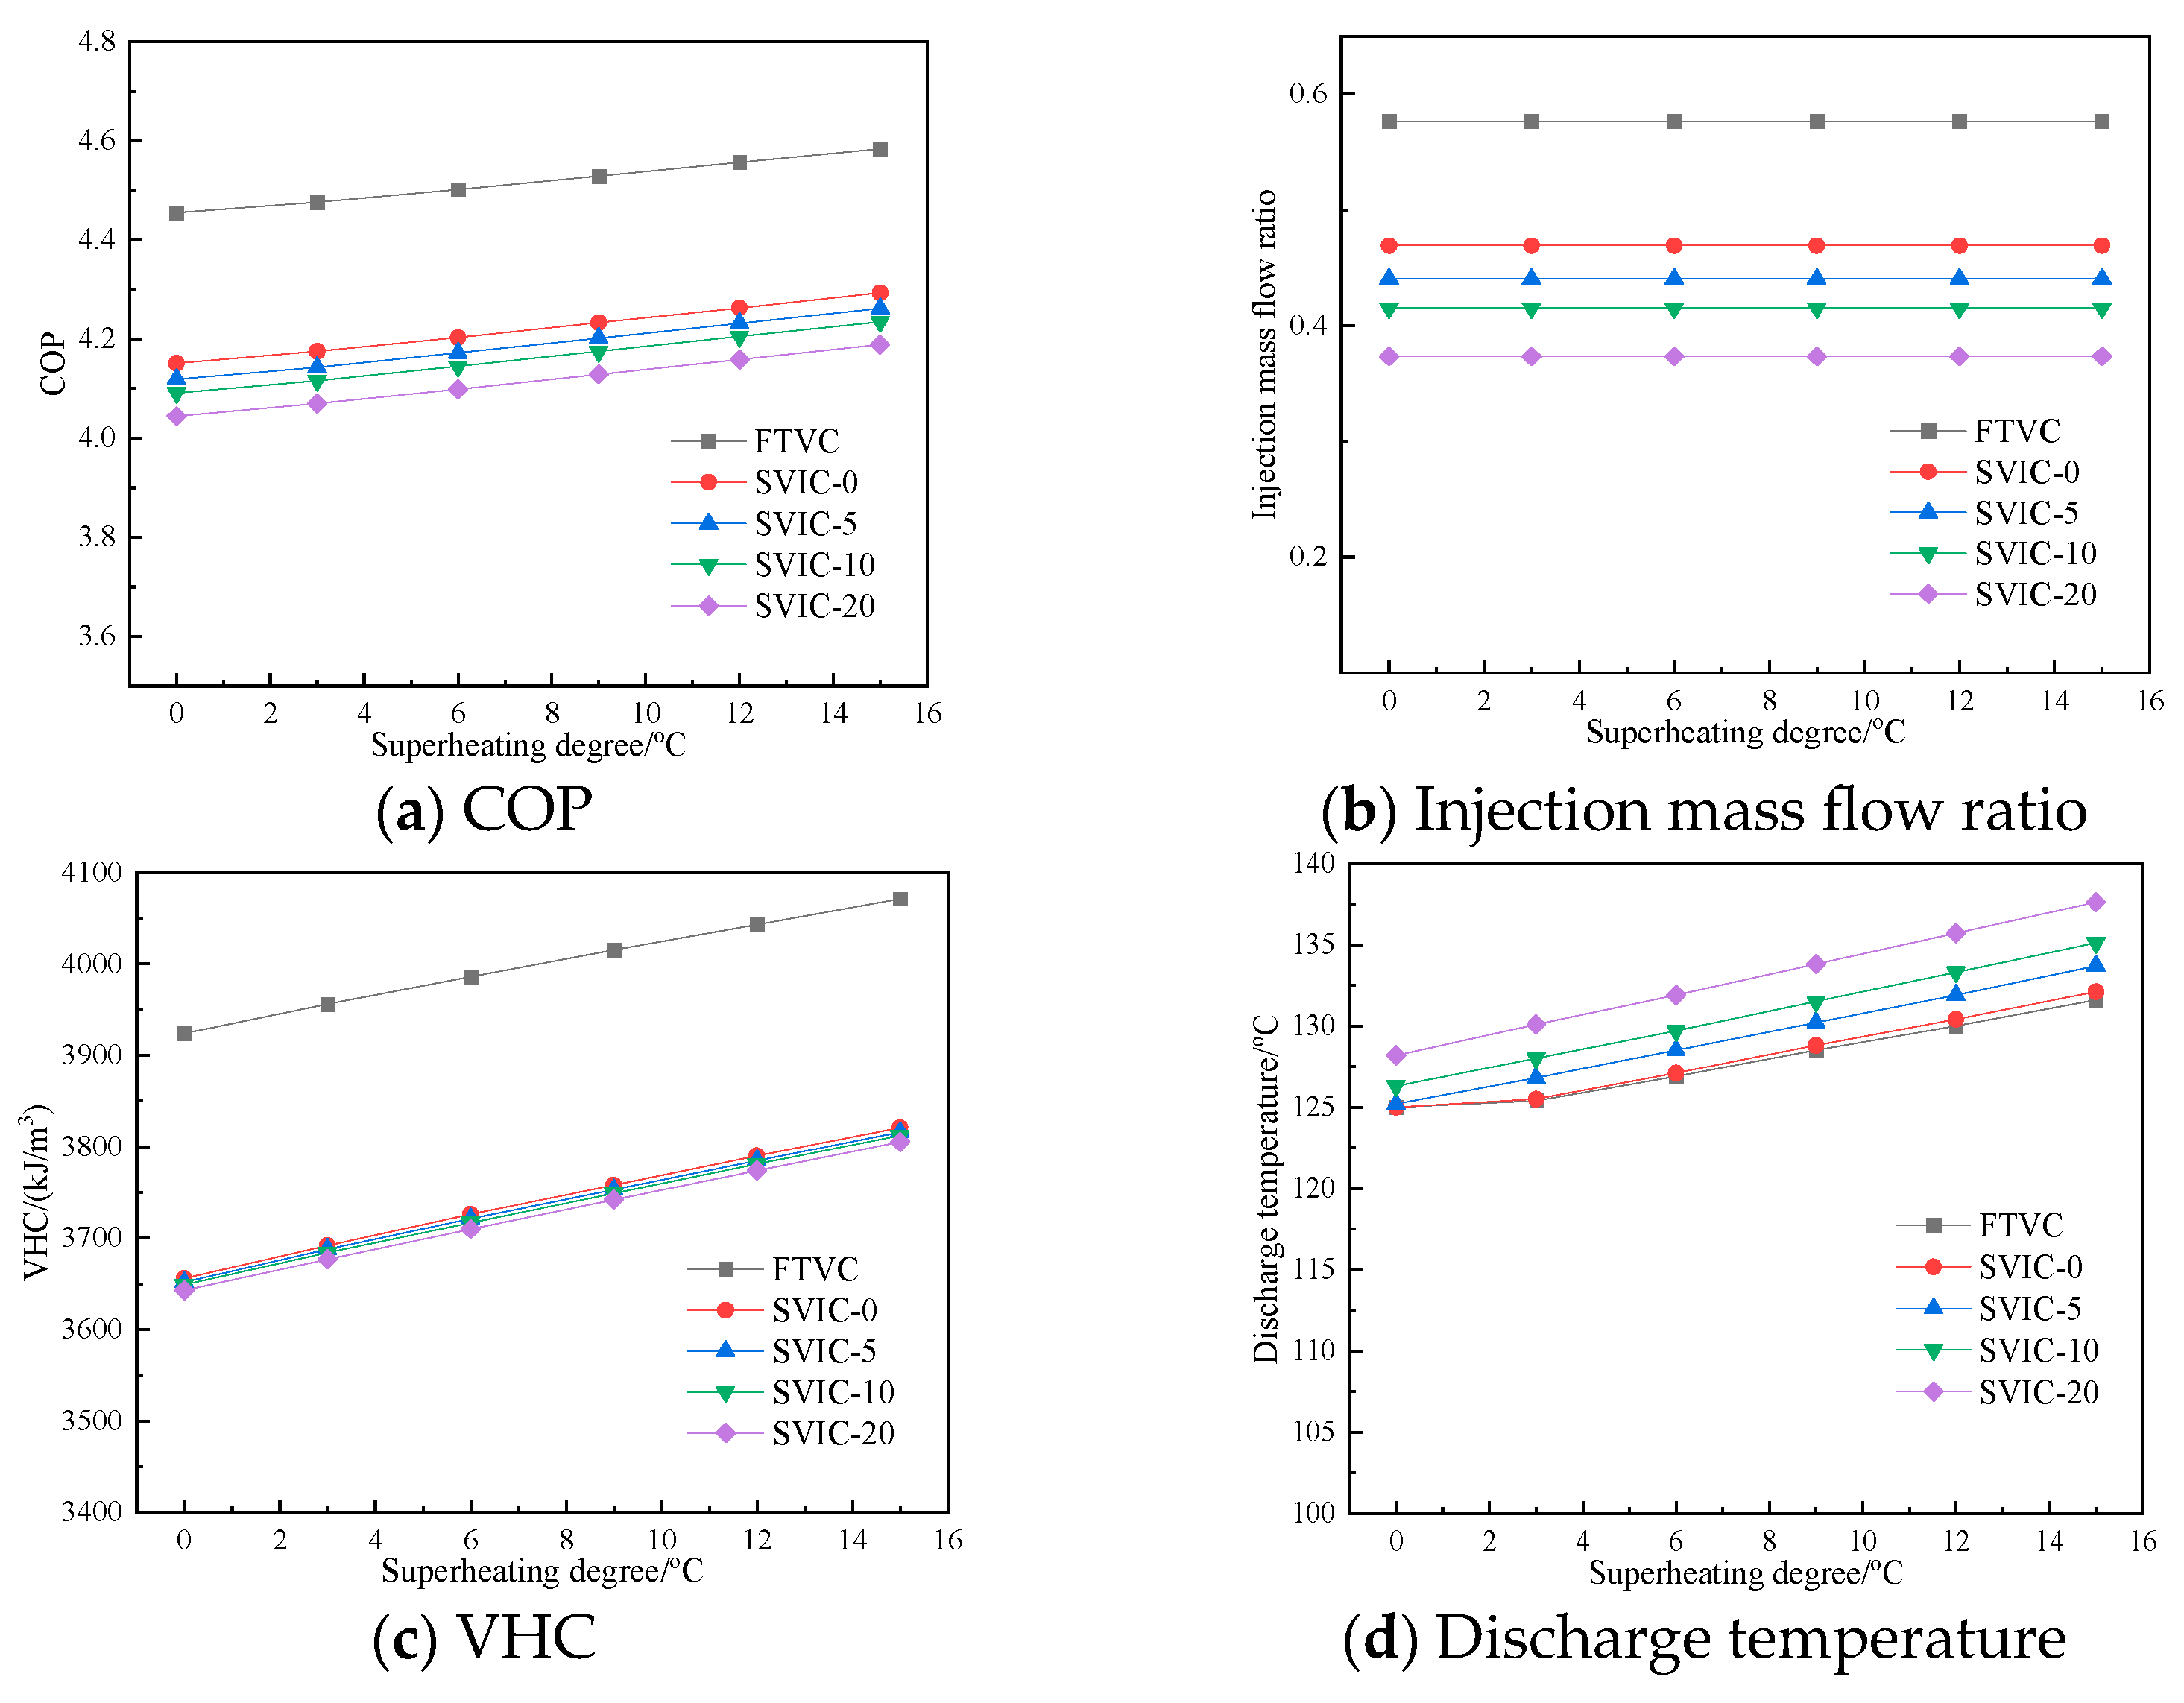
Figure 5 shows the performance comparison of the FTVC and SVIC under different compressor suction superheat degrees. According to Figure 5a, the COPs of FTVC, SVIC-0, SVIC-5, SVIC-10 and SVIC-20 all increase with the increase in compressor suction superheat degree and the COP of the FTVC is higher than those of the SVIC-0, SVIC-5, SVIC-10 and SVIC-20 at the same conditions. At the evaporation temperature of 55 °C, condensation temperature of 125 °C, subcooling degree of 5 °C and compressor suction superheat degree of 15 °C, the COPs of the FTVC, SVIC-0, SVIC-5, SVIC-10 and SVIC-20 are 4.58, 4.29, 4.26, 4.24 and 4.19, which are 2.9%, 3.4%, 3.5%, 3.5% and 3.6% higher than those of the compressor suction superheat degree of 0 °C, respectively. From Figure 5b, the injection mass flow ratio does not change with the increase in the suction superheat degree. Figure 5c shows that the VHCs of the FTVC, SVC-0, SVIC-5, SVIC-10 and SVIC-20 increase with the increase in compressor suction superheat degrees. The VHC is decided by the total heat capacity, working fluid volume flow rate and suction specific volume. When the compressor suction superheat degree increases, the working fluid volume flow rate remains the same and the suction specific volume and total heat capacity increase. Meanwhile, the increase in total heat capacity is more than the increase in suction specific volume, thus causing the increase in VHC. Figure 5d shows the comparison of the discharge temperature of the FTVC and SVIC under different compressor suction superheat degrees. As can be seen from the figure, wet compression would take place for both the FTVC and SVIC-0 when the compressor suction superheat degree is low.

4.4. Performance Comparison under Different Subcooling Degrees

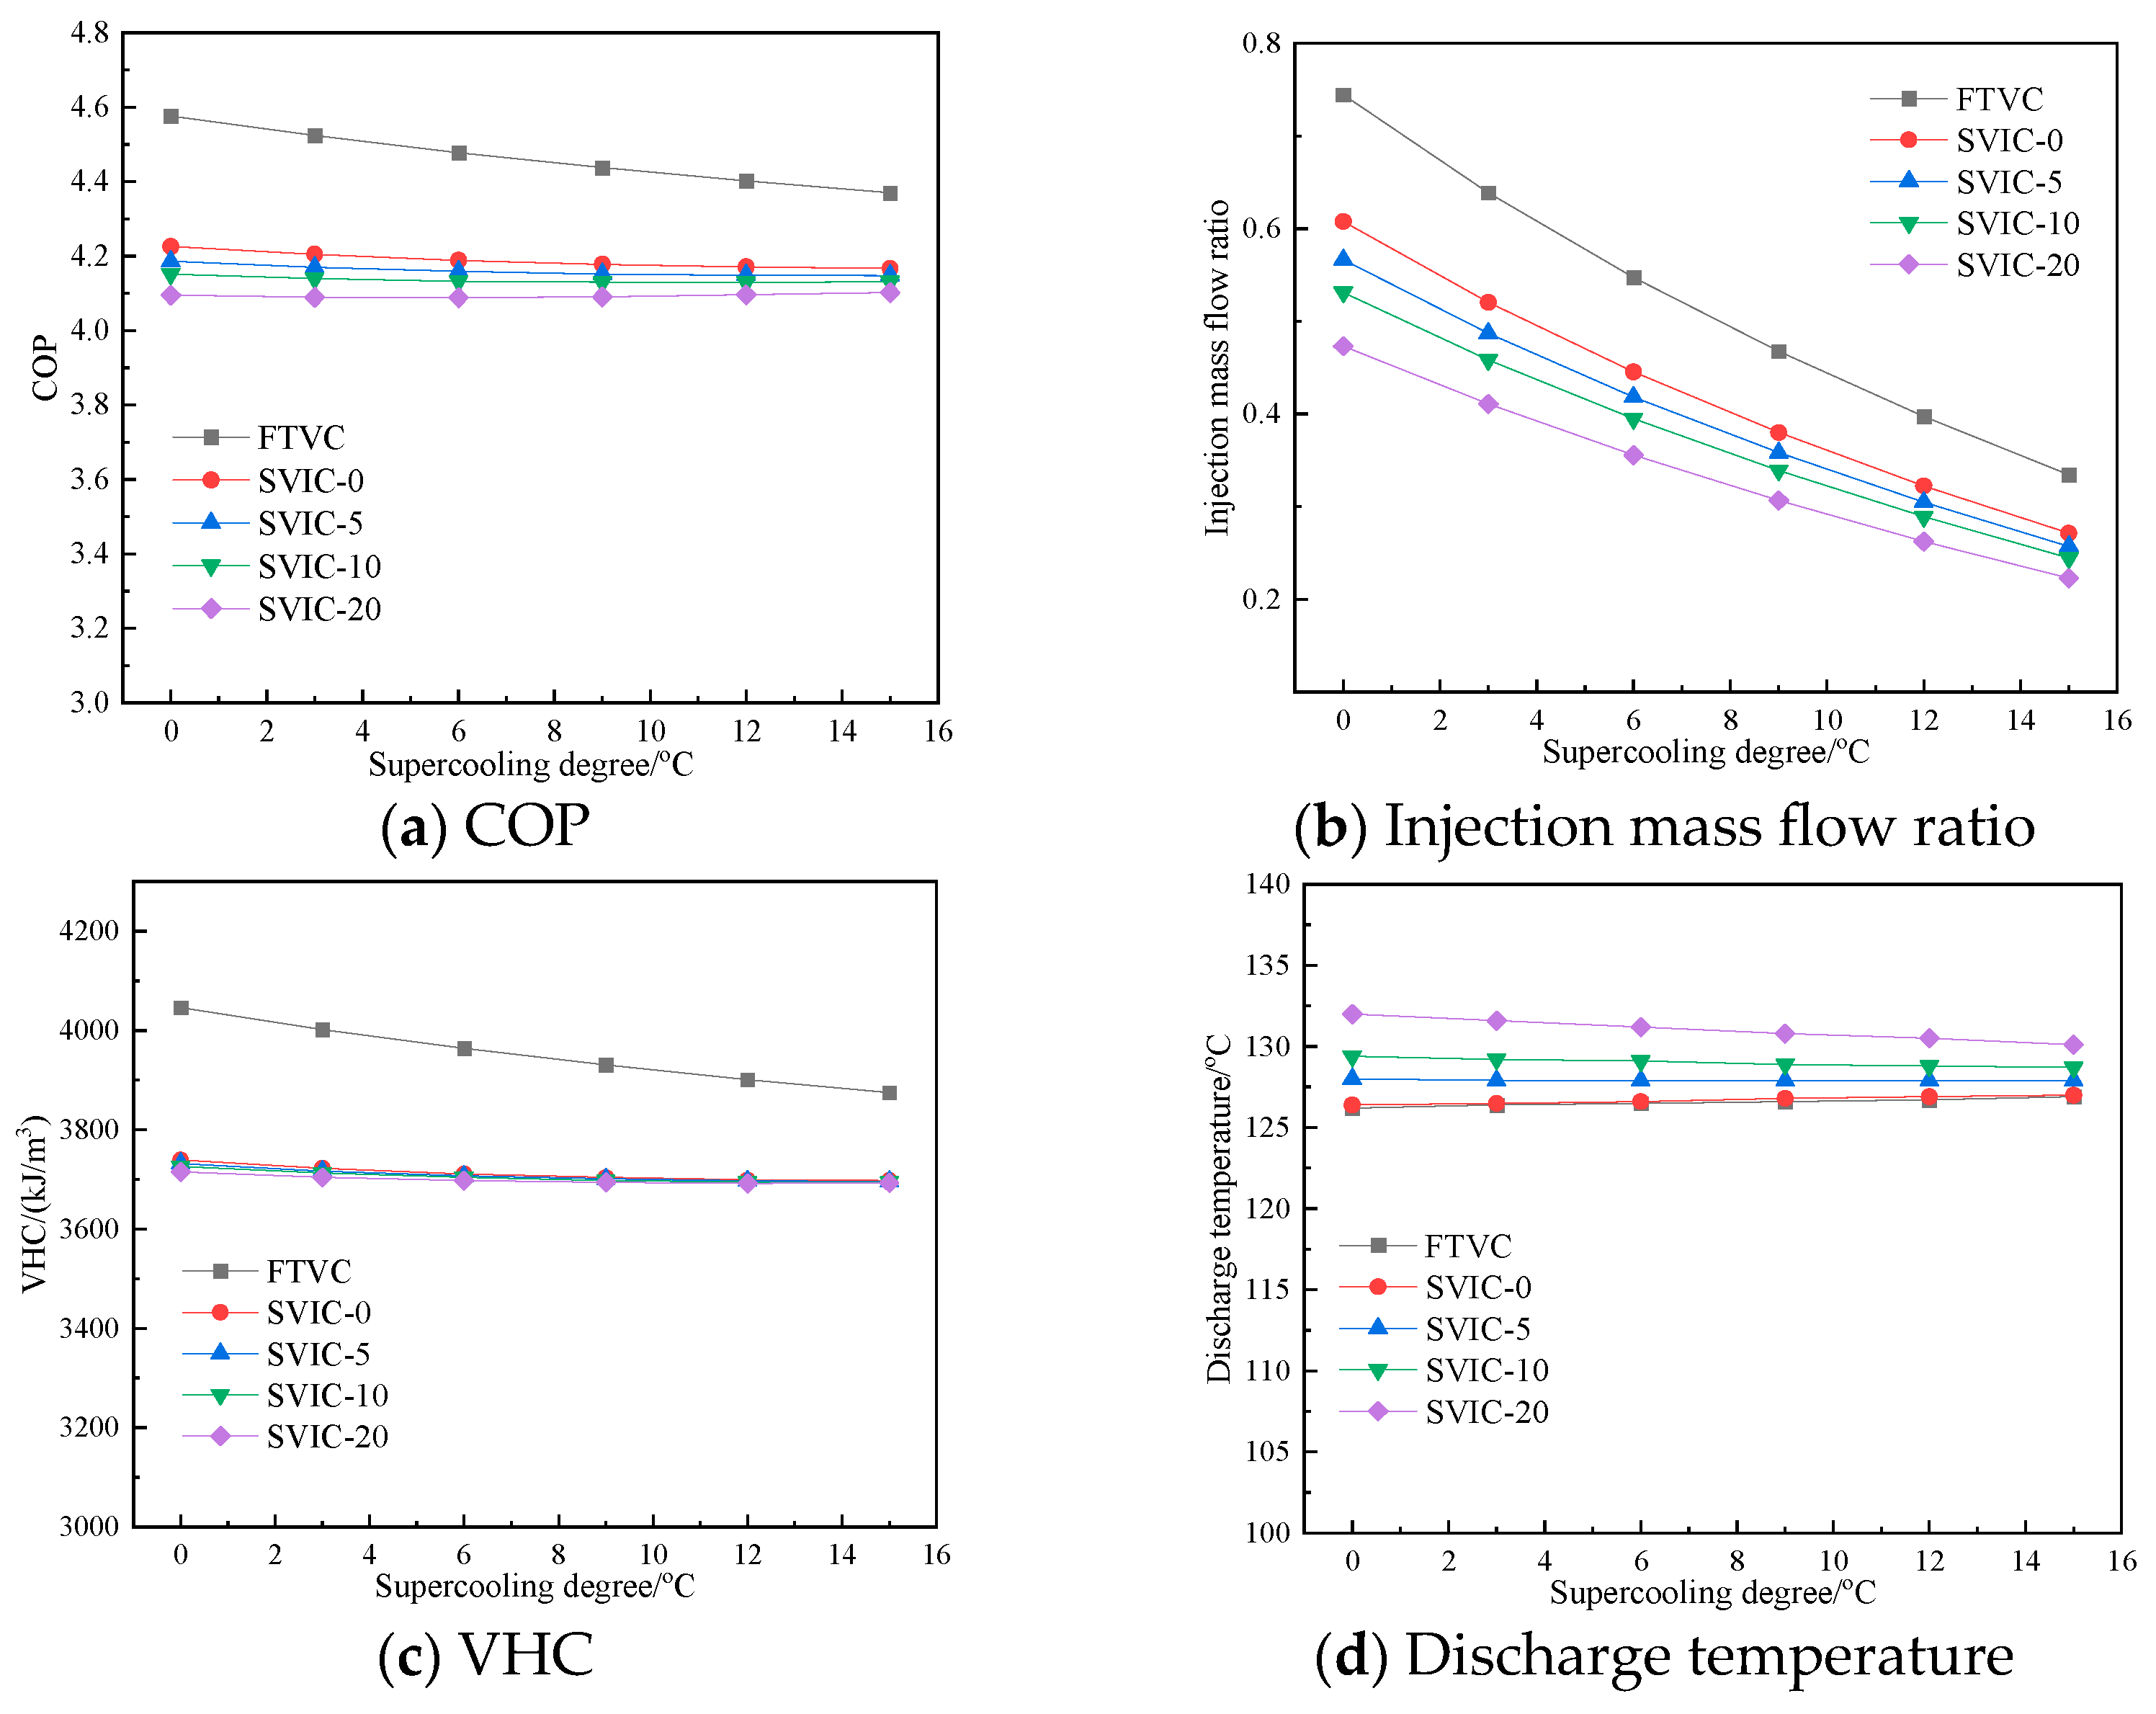
Figure 6 shows the performance comparison of the FTVC and SVIC under different condensation subcooling degrees. As shown in Figure 6a, the COPs of FTVC, SVIC-0 and SVIC-5 decrease with the increase in condensation subcooling degree; however, the COPs of SVIC-10 and SVIC-20 decrease first and then increase with the increase in condensation subcooling degree. The explanation for this phenomenon is that while the condensation subcooling degree increases, the initial temperature of refrigerant flowing into the sub-cooler or flash tank decreases, which causes the decrease in injection mass flow ratio and COP at a constant injection vapor pressure. On the other hand, the heat capacity increases with the increase in condensation subcooling degree, which leads to the increase in the COP. The joint action of two factors causes the trend in the COP. From Figure 6b, the injection mass flow ratio decreases sharply as the condensation subcooling degree increases. When the condensation subcooling degree changes from 0 to 15 °C, the injection mass flow ratios of the FTVC, SVIC-0, SVIC-5, SVIC-10 and SVIC-20 change from 0.74, 0.61, 0.57, 0.53 and 0.47 to 0.33, 0.27, 0.26, 0.24 and 0.20, decreasing by 55.4%, 55.7%, 54.4%, 54.7% and 53.2%, respectively. Figure 6c shows that the VHCs of the FTVC, SVC-0, SVC-5, SVIC-10 and SVIC-20 decrease with increasing condensation subcooling degrees. The VHC of FTVC changes more sharply than those of SVIC-0, SVIC-5, SVIC-10 and SVIC-20. Figure 6d shows the discharge temperature under different condensation subcooling degrees. According to Figure 6d, the discharge temperature of FTVC and SVIC-0 remain unchangeable with the increase of condensation subcooling degree, while those of SVIC-5, SVIC-10 and SVIC-20 decrease slightly.

4.5. Performance Comparison under Different Compressor Isentropic Efficiencies

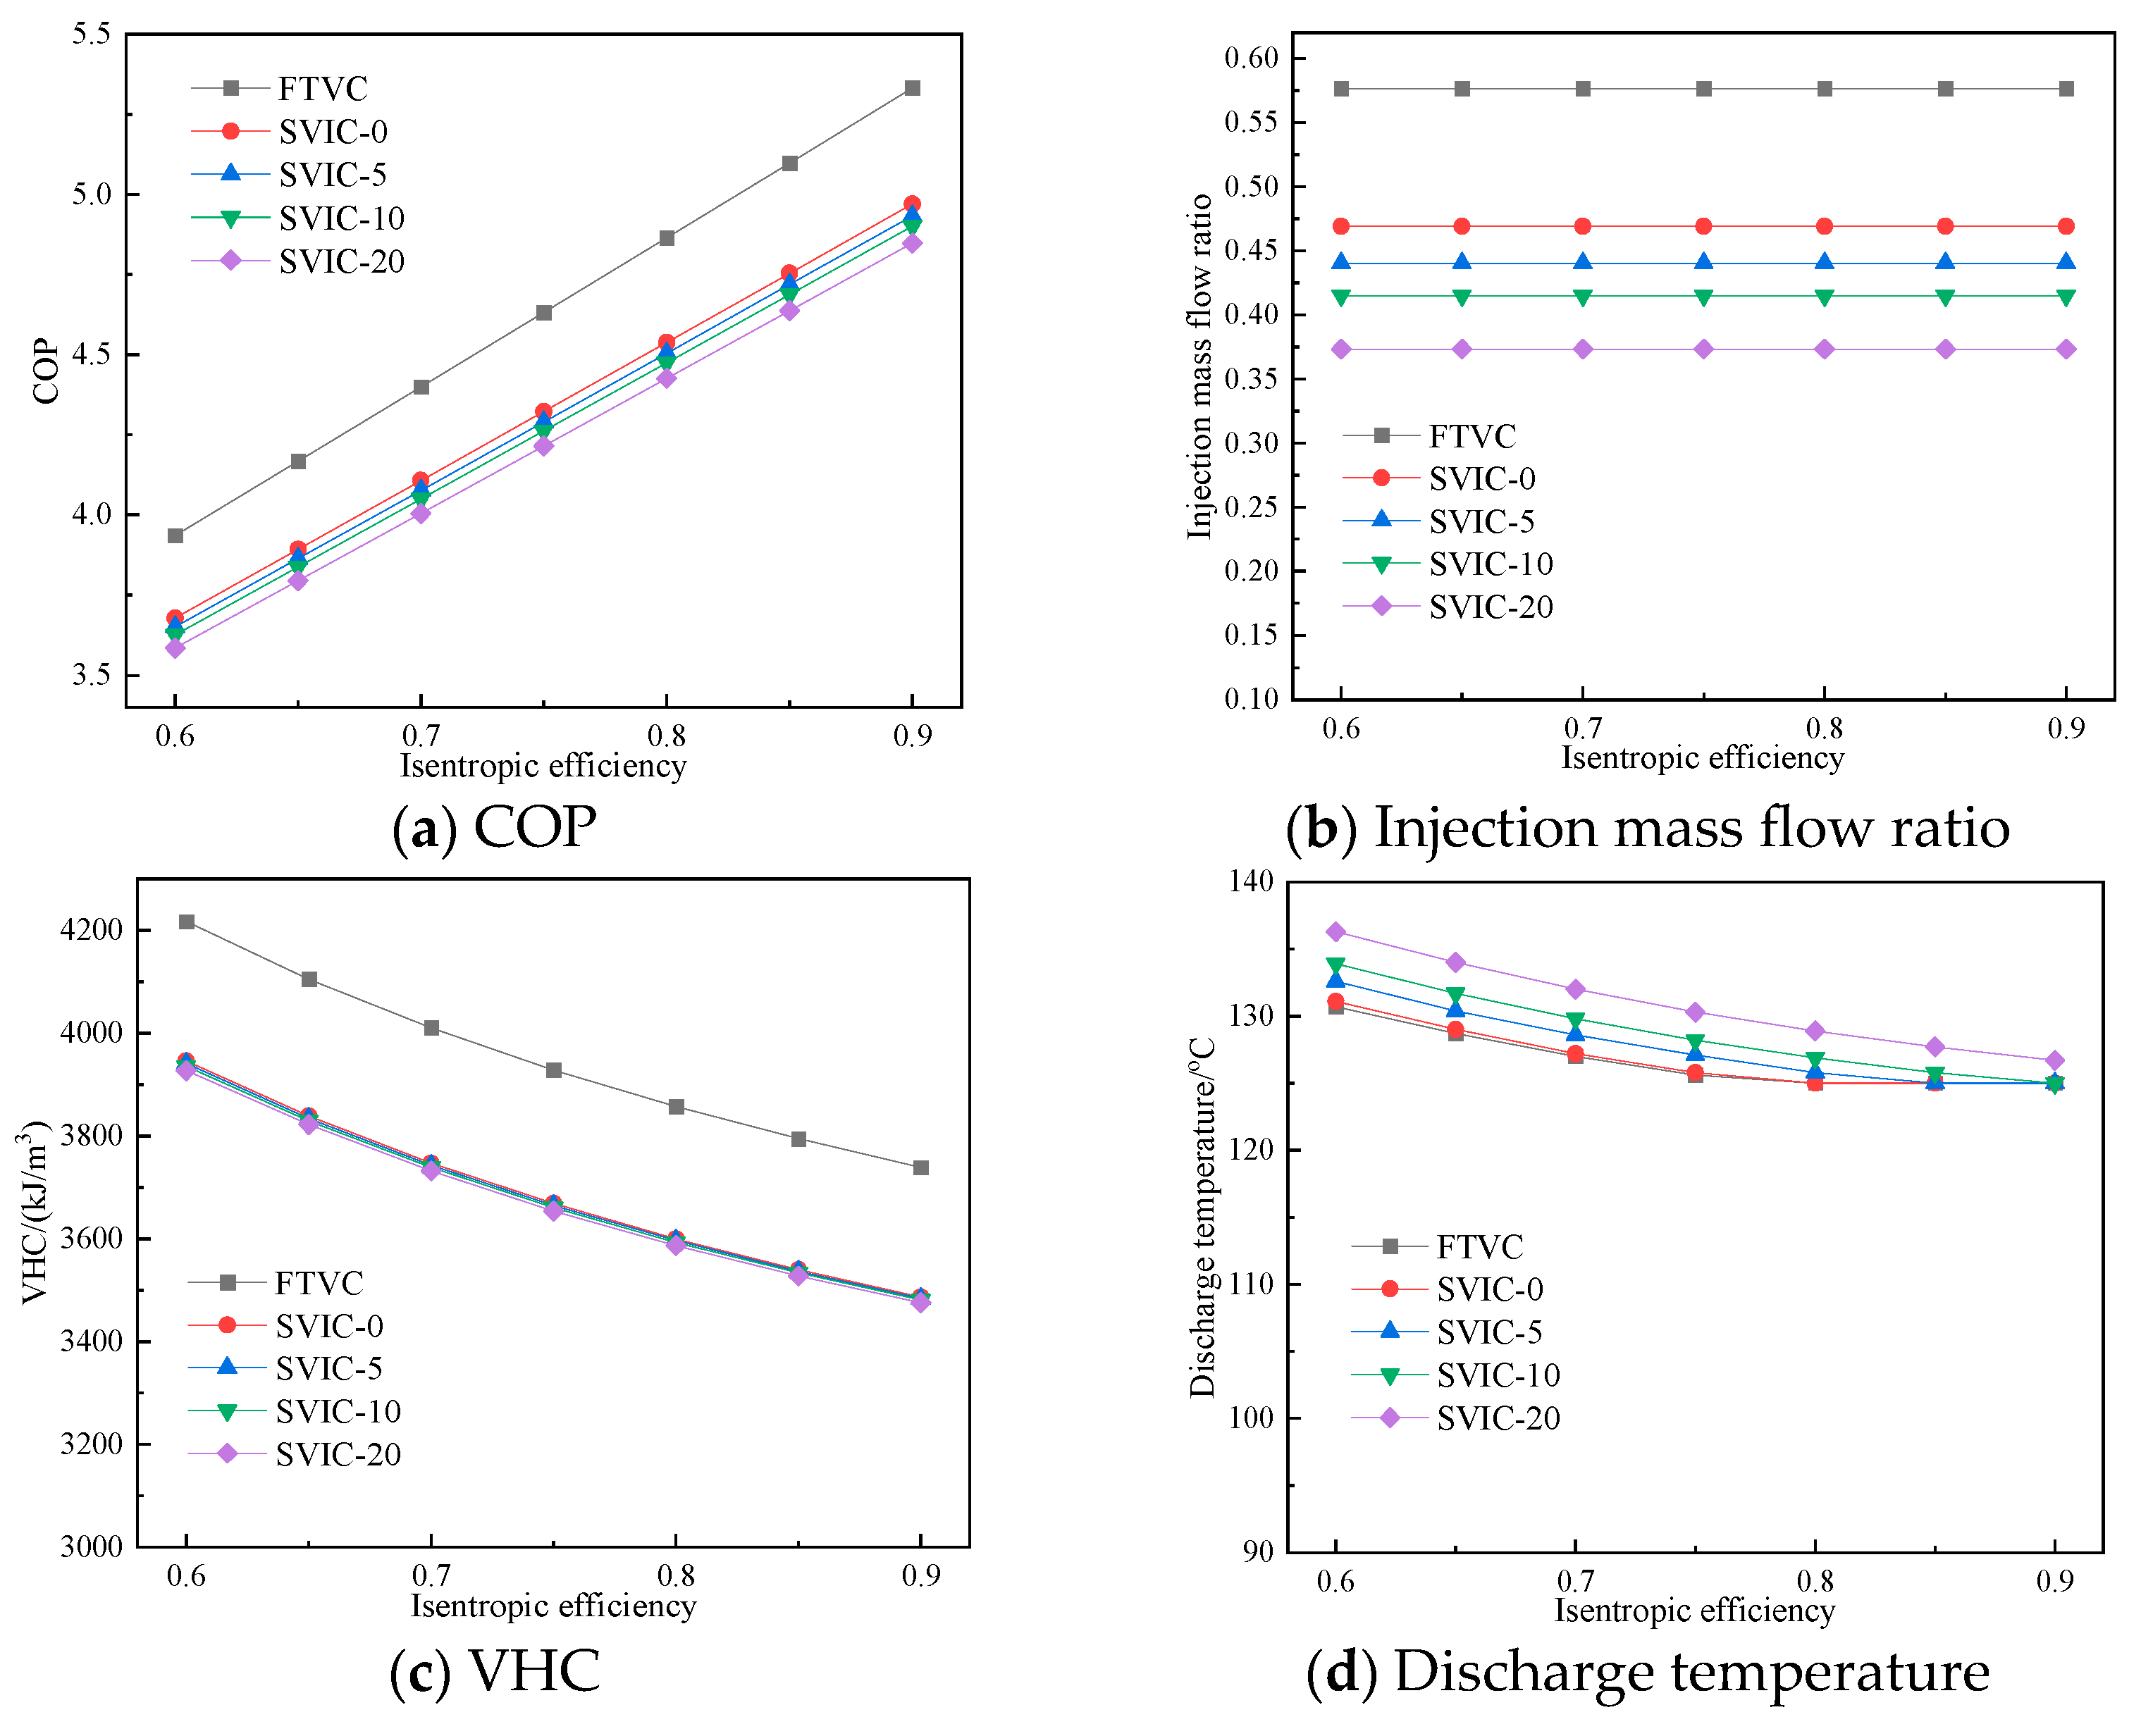
Isentropic efficiency is widely used in evaluating the performance of compressors, and the performance of compressors have great influence on the performance of heat pumps. Figure 7 shows the performance comparison of the FTVC and SVIC under different compressor isentropic efficiencies. According to Figure 7a, the COPs of the FTVC, SVIC-0, SVIC-5, SVIC-10 and SVIC-20 all increase with isentropic efficiency. Under the same isentropic efficiency, the COP of the FTVC is higher than those of the SVIC-0, SVIC-5, SVIC-10 and SVIC-20. At the evaporation temperature of 55 °C, condensation temperature of 125 °C, subcooling degree of 5 °C, compressor suction superheat degree of 15 °C and compressor isentropic efficiency of 0.75, the COPs of the FTVC, SVIC-0, SVIC-5, SVIC-10 and SVIC-20 are 4.63, 4.32, 4.29, 4.26 and 4.22, respectively. From Figure 7b, the injection mass flow ratio does not change with the increase in compressor isentropic efficiency. At the same compressor isentropic efficiency, the FTVC has the largest injection mass flow ratio. Figure 7c shows that the VHCs of the FTVC, SVC-0, SVIC-5, SVIC-10 and SVIC-20 decrease with the compressor isentropic efficiency. Figure 7d shows the comparison of the discharge temperature of the FTVC and SVIC under different isentropic efficiencies. From the figure, although the high isentropic efficiency will help to improve the performance of the system, the state of working fluid in the compressor is a two-phase state when the compressor suction superheat degree is small, which will form wet compression especially for the FTVC. So, the compressor suction superheat degree of the FTVC must remain large enough to prevent wet compression when the compressor isentropic efficiency is high. At the evaporation temperature of 55 °C, condensation temperature of 125 °C, subcooling degree of 5 °C, compressor suction superheat degree of 15 °C and compressor isentropic efficiency of 0.75, the discharge temperatures of the FTVC, SVIC-0, SVIC-5, SVIC-10, and SVIC-20 are 125.6, 125.8, 127.1, 128.2 and 130.3 °C, respectively.

5. Conclusions

The COP, injection mass flow ratio and VHC of the FTVC are higher than those of the SVIC-0, SVIC-5, SVIC-10 and SVIC-20 under the same working conditions, while the discharge temperature of the FTVC is approximately equal to the SVIC-0 but lower than the SVIC-5, SVIC-10 and SVIC-20. When the compressor suction superheat degree is low and the compressor isentropic efficiency is high, wet compression may happen for the FTVC system and the SVIC-0 system, which would lower the performance and even be harmful to the running safety of the HTHP system. Therefore, enough compressor suction superheat degree should be designed to avoid wet compression in the compressor. The COP of the SVIC heat pump system decreases as the injection superheat degree increases. The isentropic efficiency of the compressor, the evaporation and condensation temperatures have greater effects on the COP than the suction superheat degree and subcooling degree. Therefore, to achieve a higher COP, the isentropic efficiency of the compressor and the evaporation temperature should be increased, and the condensation temperature should be decreased. When the evaporation temperature, the condensation temperature and injection pressure are 55 °C, 125 °C and 921.4 kPa, the system COPs corresponding to the FTVC, SVIC-0, SVIC-5, SVIC-10, and SVIC-20 are 4.49, 4.19, 4.16, 4.14 and 4.09, respectively.

Author Contributions

Conceptualization, Y.Y.; methodology, Y.W.; investigation, Z.X.; resources, Z.L.; project administration, Y.G.; validation, B.X.; writing—original draft preparation, Y.H. and Y.C.; writing—review and editing, J.Y. and T.Z. All authors have read and agreed to the published version of the manuscript.

Funding

This research was funded by Science and Technology Projects of the State Grid Corporation of China, funding number 5400-202140401A-0-0-00.

Data Availability Statement

Data are contained within the article.

Conflicts of Interest

Author Yuqiang Yang was employed by the company State grid Zhejiang Electric Power Co., Ltd. Authors Yu Wang and Zhaoyang Xu were employed by the company State Grid Electric Power Research Institute Wuhan Efficiency Evaluation Company Limited and Nari Group Corporation State Grid Electric Power Research Institute. Authors Baojiang Xie, Yong Hu, Jiatao Yu, Yehong Chen, Ting Zhang were employed by the company Shaoxing Power Supply Company, State Grid Zhejiang Electric Power Co., Ltd. The remaining authors declare that the research was conducted in the absence of any commercial or financial relationships that could be construed as a potential conflict of interest.

Nomenclatures

1,2, …, 10thermodynamic state points
Ainjection mass flow ratio
henthalpy, kJ/kg
m · mass flow rate, kg/s
Mmolecular mass, g/mol
Ppressure, kPa
Qheat capacity, kW
RIPrelative injection pressure
ttemperature, °C
VHCvolumetric heating capacity, kJ/m3
W · mechanical power, kW
Abbreviations
COPcoefficient of performance
FTVCflash tank vapor injection cycle
GWPglobal warming potential
HTHPhigh-temperature heat pump
HTCHPhigh-temperature cascade heat pump
LMTDlogarithmic mean temperature difference
NBPnormal boiling point
ODPozone depression potential
SGsafety grade
SVICsub-cooler vapor injection cycle
Subscripts
ccompressor
condcondensator
dischdischarge temperature
evapevaporator
ininput
injinjection
isisentropic
outoutput
subsubcooling
supsuperheat
refrefrigerant
ththrottle
Greek Symbols
ηefficiency
vspecific volume, m3/kg

References

  1. IEA. Net Zero by 2050-a Roadmap for the Global Energy Sector; IEA: Paris, France, 2021; Available online: https://www.iea.org/reports/net-zero-by-2050 (accessed on 12 December 2023).
  2. Yan, H.Z.; Zhang, C.; Shao, Z.; Kraft, M.; Wang, R.Z. The underestimated role of the heat pump in achieving china’s goal of carbon neutrality by 2060. Engineering 2023, 23, 13–18. [Google Scholar] [CrossRef]
  3. Jiang, J.T.; Hu, B.; Wang, R.Z.; Deng, N.; Cao, F.; Wang, C.C. A review and perspective on industry high-temperature heat pumps. Renew. Sust. Energ. Rev. 2022, 161, 112106. [Google Scholar] [CrossRef]
  4. Xue, J.; Guo, X.M.; Xue, L.P. Experimental study on performance of air-source heat pump system using refrigerant R32 with flash-tank vapor injection. Cryog. Supercond. 2018, 4, 88–91+96. (In Chinese) [Google Scholar] [CrossRef]
  5. Roh, C.W.; Kim, M.S. Effects of intermediate pressure on the heating performance of a heat pump system using R410A vapor-injection technique. Int. J. Refrig. 2011, 34, 1911–1921. [Google Scholar] [CrossRef]
  6. Roh, C.W.; Kim, M.S. Effect of vapor-injection technique on the performance of a cascade heat pump water heater. Int. J. Refrig. 2014, 38, 168–177. [Google Scholar] [CrossRef]
  7. Zhang, D.; Li, J.P.; Nan, J.H.; Wang, L.H. Thermal performance prediction and analysis on the economized vapor injection air-source heat pump in cold climate region of China. Sustain. Energy Techn. 2016, 18, 127–133. [Google Scholar] [CrossRef]
  8. Heo, J.Y.; Jeong, M.W.; Kim, Y.C. Effects of flash tank vapor injection on the heating performance of an inverter-driven heat pump for cold regions. Int. J. Refrig. 2010, 33, 848–855. [Google Scholar] [CrossRef]
  9. Heo, J.Y.; Jeong, M.W.; Baek, C.H.; Kim, Y.C. Comparison of the heating performance of air-source heat pumps using various types of refrigerant injection. Int. J. Refrig. 2011, 34, 444–453. [Google Scholar] [CrossRef]
  10. Mathison, M.M.; Braun, J.E.; Groll, E.A. Performance limit for economized cycles with continuous refrigerant injection. Int. J. Refrig. 2011, 34, 234–242. [Google Scholar] [CrossRef]
  11. Yang, M.H.; Wang, B.L.; Li, X.T.; Shi, W.X.; Zhang, L.P. Evaluation of two-phase suction, liquid injection and two-phase injection for decreasing the discharge temperature of the R32 scroll compressor. Int. J. Refrig. 2015, 59, 269–280. [Google Scholar] [CrossRef]
  12. Qi, H.J.; Liu, F.Y.; Yu, J.L. Performance analysis of a novel hybrid vapor injection cycle with subcooler and flash tank for air-source heat pumps. Int. J. Refrig. 2017, 74, 540–549. [Google Scholar] [CrossRef]
  13. Kim, D.W.; Jeon, Y.S.; Jang, D.S.; Kim, Y.C. Performance comparison among two-phase, liquid, and vapor injection heat pumps with a scroll compressor using R410A. Appl. Therm. Eng. 2018, 137, 193–202. [Google Scholar] [CrossRef]
  14. Arpagaus, C.; Bless, F.; Uhlmann, M.; Schiffmann, J.; Bertsch, S.S. High temperature heat pumps: Market overview, state of the art, research status, refrigerants, and application potentials. Energy 2018, 152, 985–1010. [Google Scholar] [CrossRef]
  15. Kontomaris, K. Zero-ODP, low-GWP, non-flammable working fluids for high temperature heat pumps. In Proceedings of the ASHRAE Annual Conference, Seattle, WA, USA, 1 July 2014; pp. 1–40. [Google Scholar]
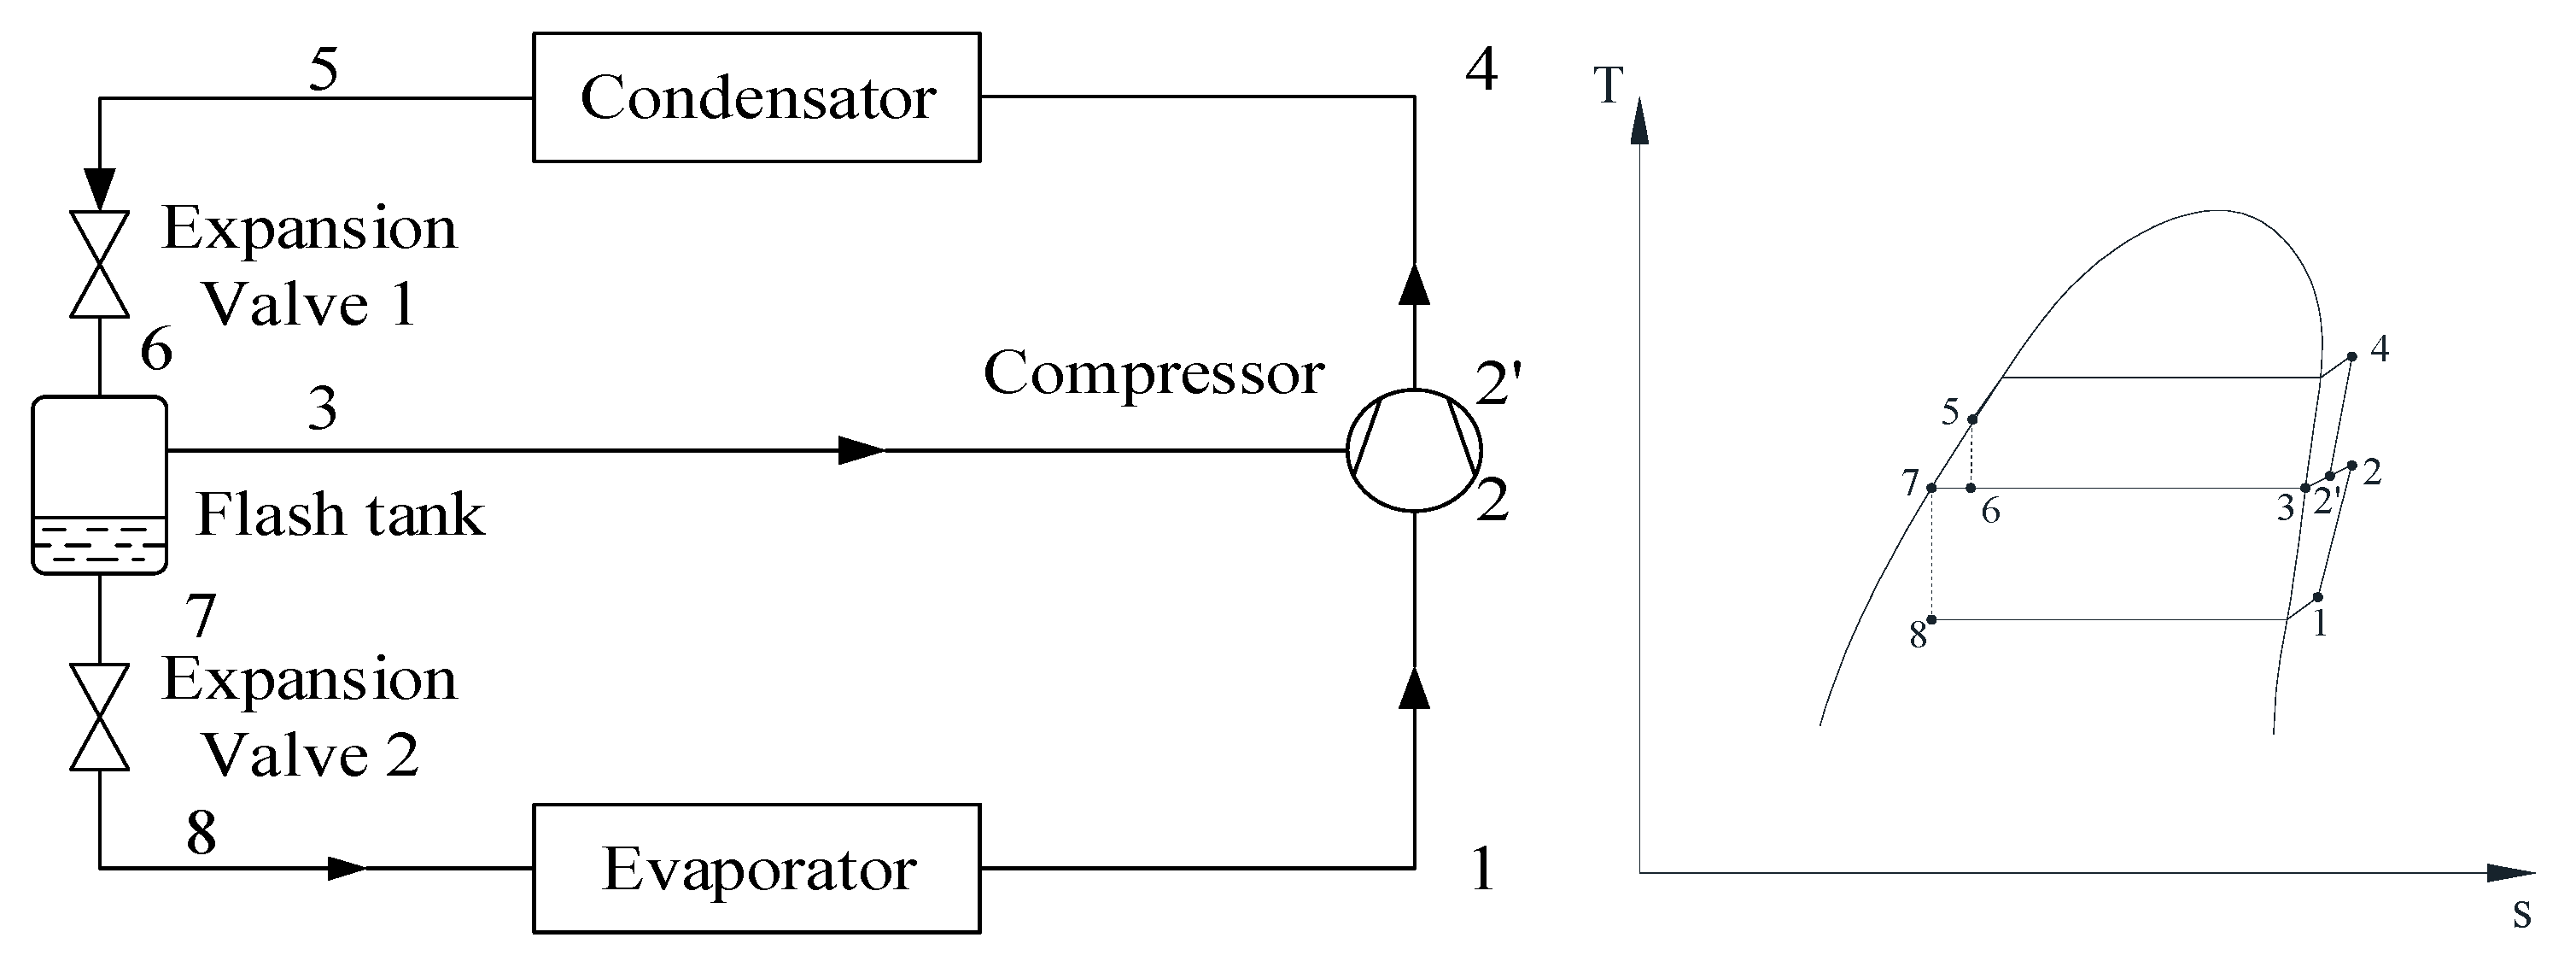
Figure 1. Principle diagram of the vapor injection heat pump with flash tank.
Processes 12 00566 g001
Figure 2. Principle diagram of the vapor injection heat pump with sub-cooler.
Processes 12 00566 g002
Figure 3. Performance comparison under different evaporation temperatures.
Processes 12 00566 g003
Figure 4. Performance comparison under different condensation temperatures.
Processes 12 00566 g004
Figure 5. Performance comparison under different suction superheat degrees.
Processes 12 00566 g005
Figure 6. Performance comparison under different subcooling degrees.
Processes 12 00566 g006
Figure 7. Performance comparison under different isentropic efficiencies.
Processes 12 00566 g007
Table 1. Parameters of HFC-245.
Working FluidChemical FormulaGroupM [g/mol]tcr [°C]Pcr [bar]NBP [°C]GWPODPSG
R245faCHF2CH2CF3HFC134.0515436.515.38580B1
Table 2. The reference values and the boundary conditions.
ParametersReference ValuesBoundary Conditions
Refrigerant mass flow rate m ˙ ref/(kg/s)1-
Evaporation temperature te/°C5540~80
Superheat degree tsup/°C100~15
Condensation temperature tc/°C125100~130
Subcooling degree tsub/°C50~15
Injection mass flow ratio A0.3-
Relative injection pressure RIP1-
Injection superheat degree tsup,inj/°C50~20
Compressor isentropic efficiency ηis0.720~0.9
Disclaimer/Publisher’s Note: The statements, opinions and data contained in all publications are solely those of the individual author(s) and contributor(s) and not of MDPI and/or the editor(s). MDPI and/or the editor(s) disclaim responsibility for any injury to people or property resulting from any ideas, methods, instructions or products referred to in the content.