Article

Adhesion Behavior of Underground Coal Dust with Fused Silica: Effects of Relative Humidity and Particle Size

1
School of Mechanical and Electrical Engineering, China University of Mining and Technology (Beijing), Beijing 100083, China
2
Key Laboratory of Intelligent Mining and Robotics, Ministry of Emergency Management, Beijing 100083, China
3
State Key Laboratory of Tribology in Advanced Equipment, Tsinghua University, Beijing 100084, China
*
Author to whom correspondence should be addressed.
Processes 2024, 12(4), 735; https://doi.org/10.3390/pr12040735
Submission received: 8 March 2024 / Revised: 30 March 2024 / Accepted: 2 April 2024 / Published: 4 April 2024
(This article belongs to the Section Chemical Processes and Systems)

Abstract

:
Coal dust particles adhering to a camera lens reduce its light transmittance, which deteriorates the performance of the camera and may lead to serious problems with mining equipment that requires visual ability. Aiming at improving coal dust removal and cleaning technologies, the adhesion behavior of coal dust with fused silica is studied here. Experiments were conducted from microscopic and statistical points of view. The adhesion force between a single coal dust particle and fused silica is tested using atomic force microscopy (AFM), and the number and size distribution of large amounts of coal dust particles on fused silica are tested using a home-made adhesion experimental platform and image processing method. The results show that the adhesion force increases at high relative humidity (RH); it is dominated by van der Waals forces at low RH and capillary forces at high RH. The fused silica glass surface is predominantly covered by small-sized coal dust particles, and the total number of particles as well as the proportion of large-sized particles increases with RH. The theoretical values of van der Waals and capillary forces are significantly larger than the experimental values, owing to the irregular shape and roughness of the surface of the coal dust.

1. Introduction

Coal has been one of the most important energy sources used by humans since the 18th century. Though direct burning of coal leads to pollution and influences the climate, it is difficult to completely replace coal with clean energy in a short period of time. Even today, coal still plays a leading role in the energy structure of many countries [1,2,3] and is very important in ensuring the security of the world’s energy resources. To address the issues of pollution and carbon emissions, the clean utilization of coal has been proposed [4]. It is foreseeable that coal will continue to be used as an important energy source or chemical raw material for a certain period of time.
During underground processes of coal production such as excavation and transportation, a large amount of coal dust is produced. Coal dust deteriorates the environment in coal mines, poses a potential threat of deflagration, and seriously affects not only the health of the miners’ lungs but also the operation of the mining equipment [5,6,7,8]. With the development of intelligent mining technology, the number of underground workers has gradually decreased, and cameras are frequently used in underground coal mines either to monitor operations or as vision devices for intelligent equipment. However, the coal dust in the air easily adheres to and covers the glass of the cameras, blinding their “eyes”; this reduces the performance level, causes malfunction, affects the long-term quality of service of the equipment, and poses a threat to the safety of coal mining. Although significant efforts have been made to suppress the concentration of coal dust [6,7,8], the problem of camera-glass–coal dust adhesion remains unsolved.
The adhesion of small particles to materials exists in multiple domains, such as the photovoltaic industry [9,10], the food industry [11], the pharmaceutical industry [12], marine mining [13,14], the nuclear industry [15], and indoor air quality monitoring [16], and has been extensively studied. Moutinho et al. [9] studied the effect of surface roughness and relative humidity (RH) on the adhesion force between dust particles and solar glass using atomic force microscopy (AFM). The results showed that the adhesion force increased as the roughness of the glass surface decreased and increased with RH. Moreover, the shape of the particles had considerable influence on the adhesion by affecting the true contact area. Quan and Zhang [10] investigated the anti-dust effect of hydrophobic coatings and showed that the low surface energy and rough surface structure of hydrophobic coatings together lowered the adhesion forces. Ermis et al. [11] studied the adhesion of salt and glass particles to a crisp surface and wood-chip surface using an impact adhesion tester and centrifugal tester. The results showed that particles of medium size had greater adhesion strength than those of small and large sizes, and the material and the roughness of the surface of the substrate had an influence on the adhesion force. Petean and Aguiar [12] studied the adhesion of microcrystalline cellulose particles to a membrane of porous cellulose ester and compressed particulate microcrystalline cellulose using the centrifugal technique. The results showed that the adhesion force between the particles and the two different surfaces linearly increased with the increase in particle size, and the roughness of the surface had a significant impact, as it affected the true contact area. Ma et al. [13,14] studied the adhesion force between particles of deep-sea soil and metals using in situ AFM, and the results indicated that the 5052 aluminum alloy had better self-cleaning properties than pure titanium and titanium alloys and that there existed a critical surface roughness that corresponded to the minimum adhesion force. Sun et al. [15] studied the adhesion of graphite particles with rough walls of gas-cooled reactors. The results showed that the adhesion increased with particle size, and both surface roughness and aspherical particle morphology played important roles, which caused obvious deviations between the results of AFM measurements and theoretical models hypothesizing spherical particles and a smooth, flat plane. Tan et al. [16] studied the adhesion of common indoor dust and activated carbon particles to common indoor surfaces using colloidal probe AFM. The results showed that the adhesion forces of particles for PVC and glass were larger than those for Cu and Al, and surface roughness had a significant impact on the adhesion force because it affected the real contact area. The above studies showed that surface material properties, surface roughness, particle size, particle shape, and particle composition had notable effects on adhesion.
In recent decades, a comprehensive understanding of the mechanism of small-particle adhesion to different materials [17,18,19] has been attained. The adhesion forces between small particles and surfaces mainly include the van der Waals forces (Fvdw), electrostatic forces (Felc), and capillary forces (Fc) [10,11,12]. Van der Waals forces originate from the intermolecular forces between the particle and adhesive surface. The electrostatic force is the Coulomb force that is caused by the charging of particles or surfaces. In the case of high humidity, water vapor condenses easily on the particles and surface to form a liquid bridge, and a capillary force is generated owing to the surface tension of the liquid.
RH plays a vital role in determining the underlying mechanism of the adhesion force [20]. The extent of water adsorption on the particles is directly governed by the RH of the surrounding atmosphere. It is generally recognized that the adhesion force is principally the van der Waals force at low RH values, whereas the capillary force is predominant at higher RH due to capillary condensation and the formation of liquid bridges [9,21]. However, numerous conflicting results in the available literature indicate that the variation rule of the adhesion force with respect to RH is inconsistent [22]. It was observed that the geometry (size, shape, roughness, and tilt angle) and surface properties of the particles had a combined effect with RH on particle adhesion [23,24,25,26].
Although existing studies on particle adhesion have provided important insights, no studies on the adhesion of coal dust to material surfaces have been reported. Underground coal dust adhesion has unique and complex characteristics. Coal dust is a mixture of inorganic and organic materials [27] containing various functional groups [7] and has an irregular shape and complex surface roughness, topography, and pore structure. Moreover, the environment of underground coal mines is very complicated, particularly with regard to RH. Owing to underground water and spray dust reduction, the RH of underground coal mines is typically high, but fluctuates due to ventilation. These two aspects increase the complexity of the problem. The conclusions of existing studies on adhesion may not be applicable to the problem of underground coal dust adhesion.
The aim of this study is to quantify the adhesion behavior of coal dust to fused silica, with an emphasis on the effect of RH. The experiments were conducted from microscopic and statistical points of view. The adhesion force of a single coal dust particle to fused silica was studied using AFM, and the criterion for adhesion of a large amount of coal dust to fused silica was investigated using a home-made adhesion experimental platform and an image processing method. Adhesion mechanisms are discussed on the basis of these results. It is surmised that this study may benefit the future development of technology for improved coal dust removal and cleaning.

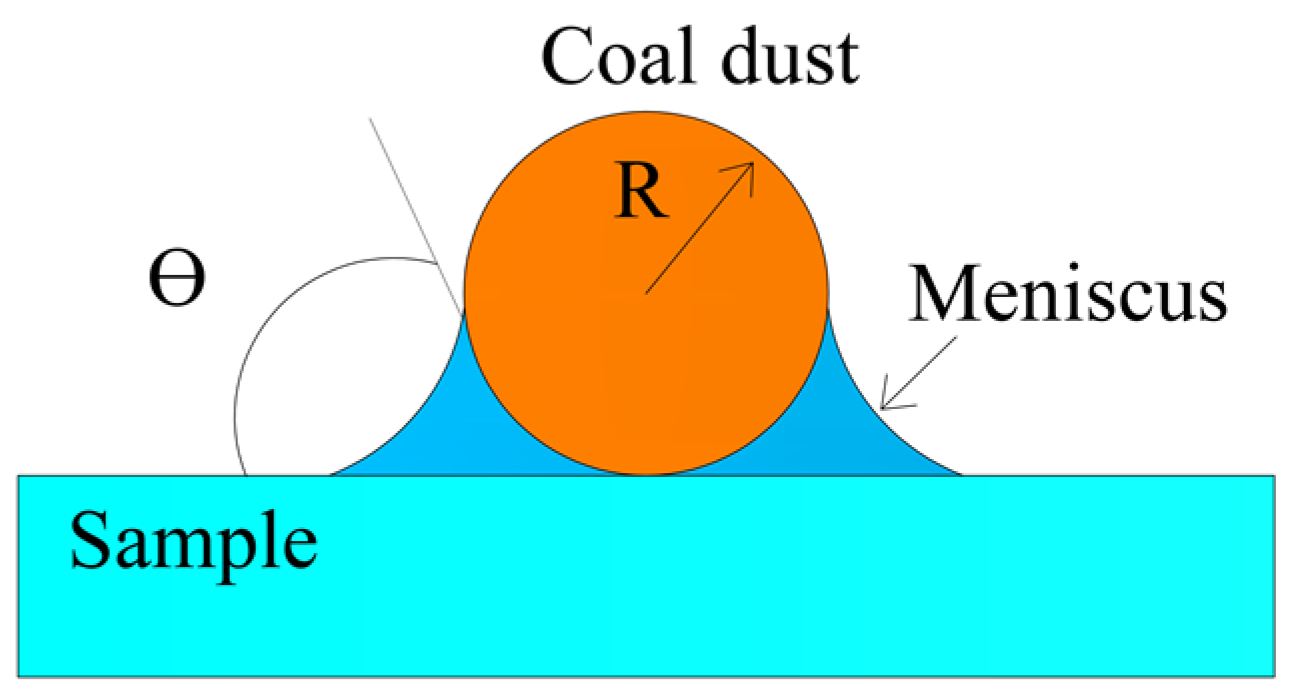
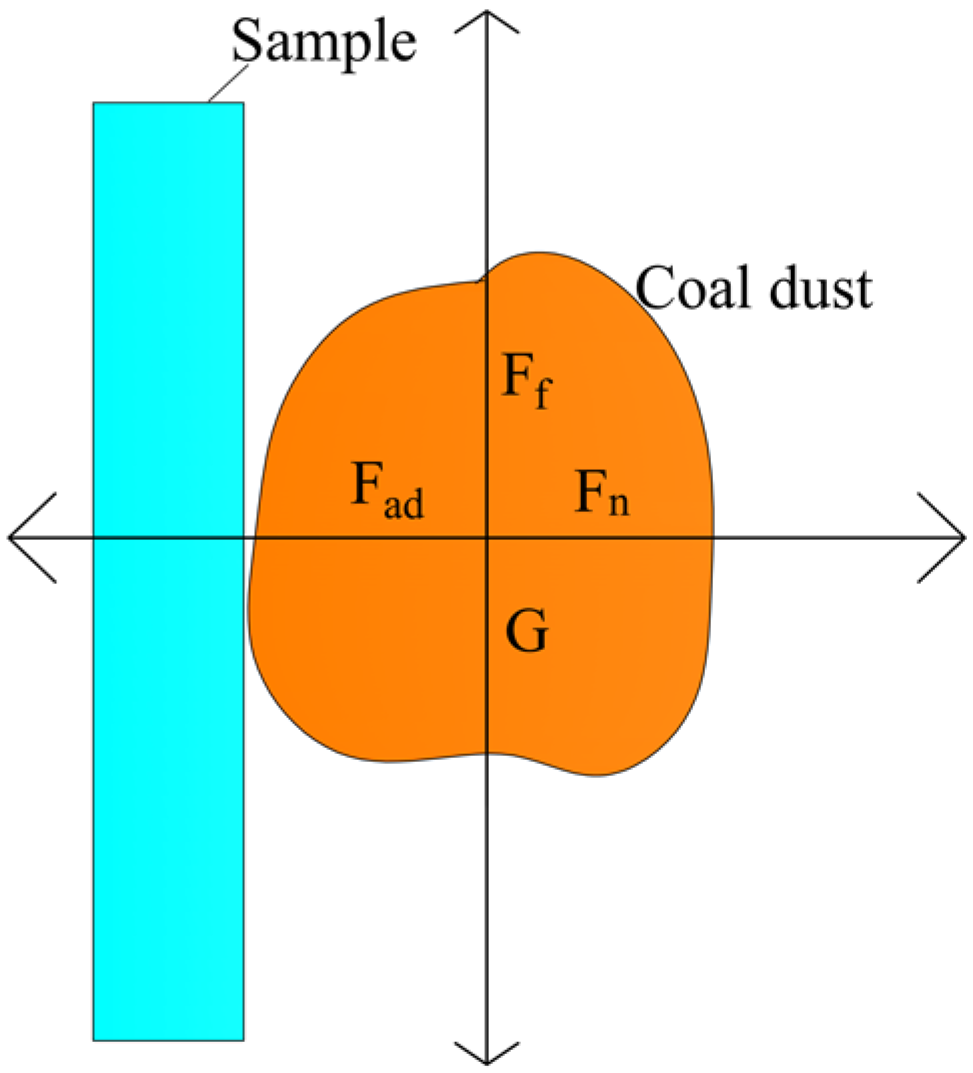
2. Theory and Background

A series of models, such as the JKR [28] and DMT theories [29], were proposed to calculate the adhesion force of particles on surfaces. Both the JKR and DMT theories are based on surface energy, the difference between them being the coefficient. The DMT theory is suitable for small, hard particles, whereas the JKR theory is appropriate for large, soft particles [30,31]. These two models have been extended by many researchers [32,33].
A more basic model involves the direct derivation from the sources of the adhesion force. The van der Waals force between a spherical particle and a flat surface is expressed below [34]:
F = A R 6 H 2
where A   is the Hamaker constant, R is the radius of the spherical particle, and H is the distance between the particle and flat surface.
When RH exceeds a certain limit, a liquid bridge is formed between the particles and surfaces. Figure 1 shows the schematic of a liquid bridge between a particle and flat surface. The capillary force of a spherical particle on a flat surface is expressed below [35]:
F = 4 π R γ cos θ [ 1 Z 2 r cos θ ]
where γ is the surface tension of the liquid, Z is the separation distance, θ is a parameter related to the contact angle, as shown in Figure 1, and r is the equilibrium radius of the meniscus given by Kelvin’s equation below [26]:
r = V γ R T ln ( P P s )
where V is the molar volume of the liquid, R is the gas constant, T is the absolute temperature, and P / P s is the RH.

3. Materials and Methods

3.1. Samples and Preparation

The fused silica glass samples used in this experiment were obtained from Donghai HaoNeng Silica Products Co., Ltd. (Lianyungang, China) and had dimensions of 20 mm × 20 mm × 3 mm. Before being used, the surface was carefully wiped with a lint-free cloth followed by ultrasonic cleaning with anhydrous ethanol for 10 min. Subsequently, the samples were carefully rinsed with deionized water, and any residual water droplets on the surface were removed using compressed air.
Lumps of coal were obtained from the Yulin coal mine located in Shanxi Province, China. To simulate the process of coal crushing and the formation of coal dust, the lumps of coal were pulverized into coal powder using a grinding machine (Chen Pai, Yichang, China), and particles below 150 mesh were sieved using an electric vibrating sieve machine. The coal powder was then subjected to electric blast drying at 120 °C for 1 h prior to the experiment to eliminate any moisture content.

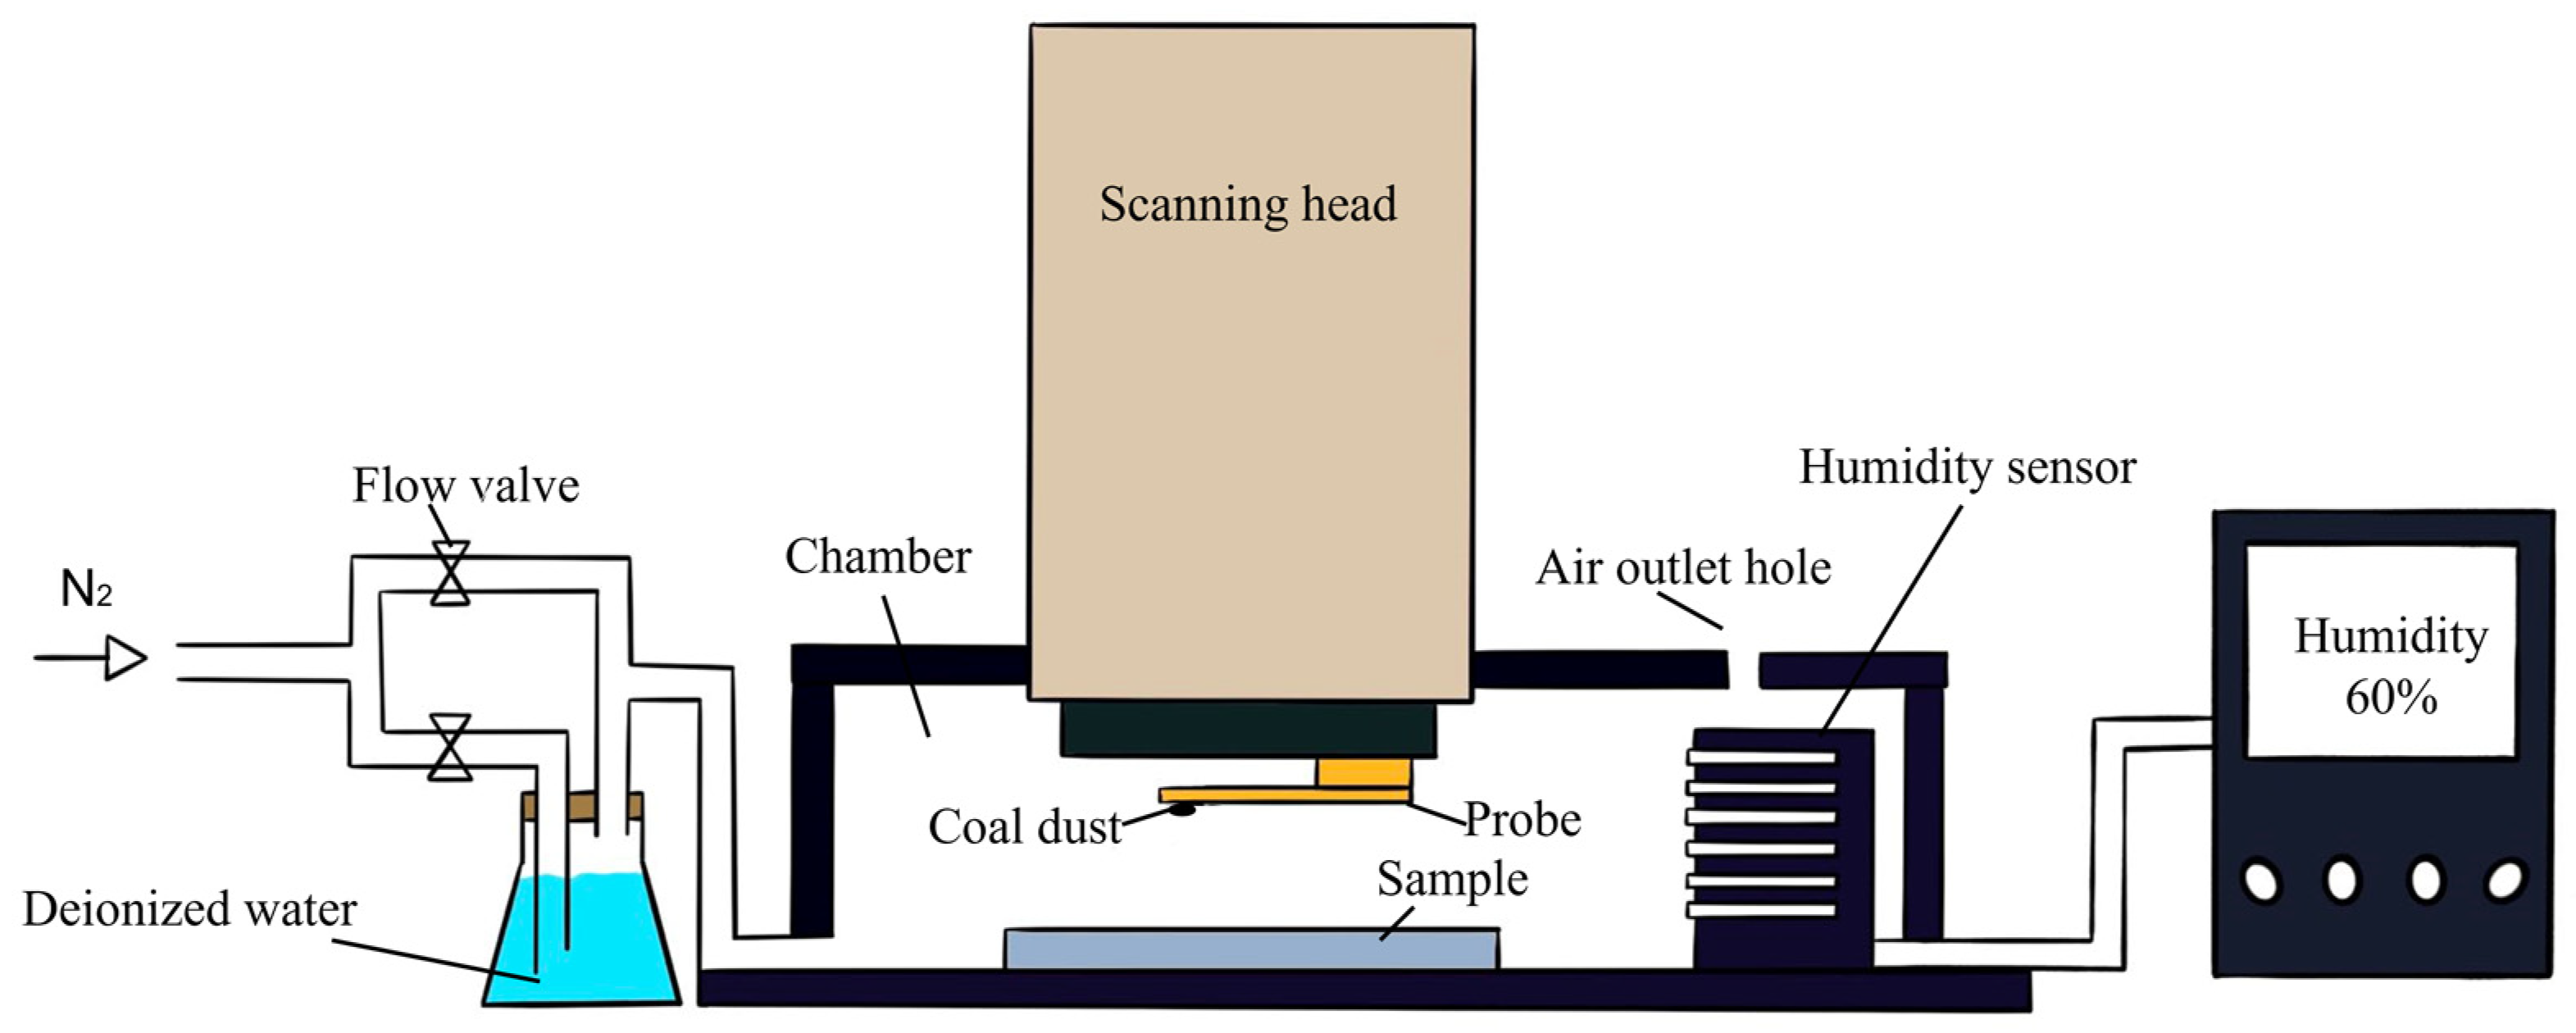
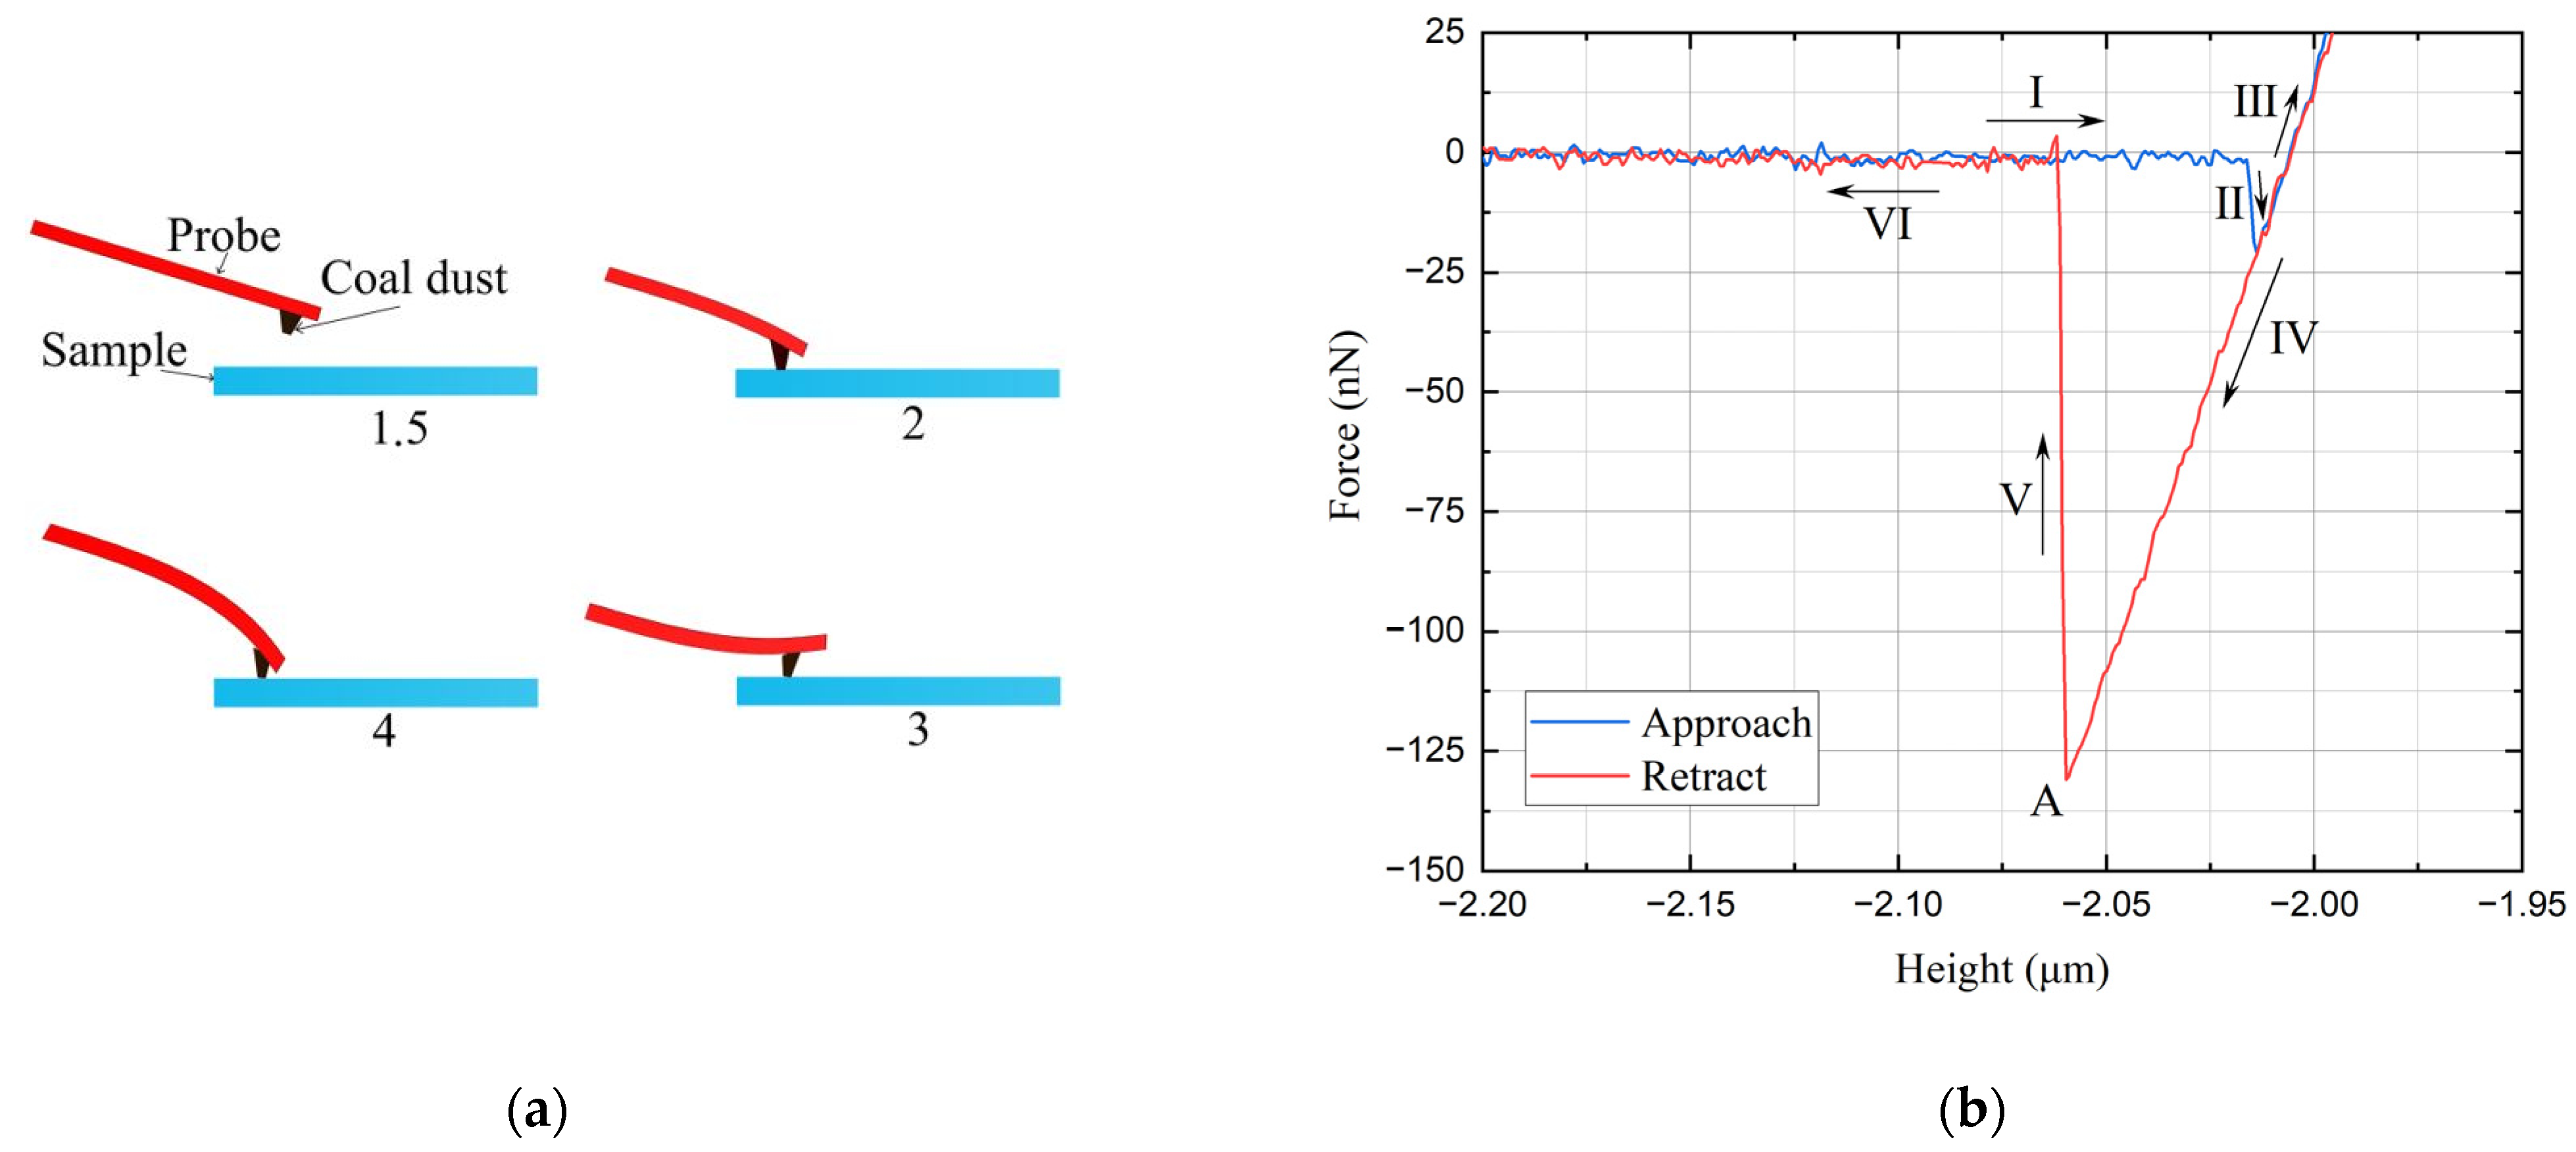
3.2. Method of Single Coal Dust Adhesion Force Test

Atomic force microscopy (AFM; Dimension ICON, Bruker, Billerica, MA, USA) was employed to investigate the adhesion force of individual coal dust particles to fused silica in situ. This experimental method has been widely adopted by other researchers [13,24]. The coal dust adhered to the tip-less cantilever probes (TL-FM-SPL, Nanosensors, Erlangen, Germany) before the adhesion force test, as illustrated in Figure 2. The detailed process of preparation of the probe is similar to that introduced in ref. [9].
Two coal dust particles of different sizes (Tip1—11.39 μ m , Tip2—44.36 μ m ) were selected for the adhesion force test. The sensitivity of deflection and spring constant of the two probes used in this experiment were calibrated using the thermal noise method, obtaining values of 127.83 nm/V, 502.05 nm/V, 3.4488 N/m, and 3.9609 N/m.
To investigate the adhesion force under different conditions of RH, a home-made in situ humidity device was set up on the atomic force microscope to establish a humidity-controlled environment. The humidity device consisted of a nitrogen bottle, gas flow meter, gas wash bottle, experimental chamber, and hygrometer (WSB-2, Haoyu, Changzhou, China) and is shown in Figure 3. The RH values of 20%, 40%, 60%, and 80% were controlled by the home-made humidity device, ensuring stability within a range of 5% for the duration of the experiment. The experiments were performed at room temperature (25 °C) in an air-conditioned room. The air pressure during the experiment was close to the standard atmospheric pressure since the airflow was relatively small during the experiment.

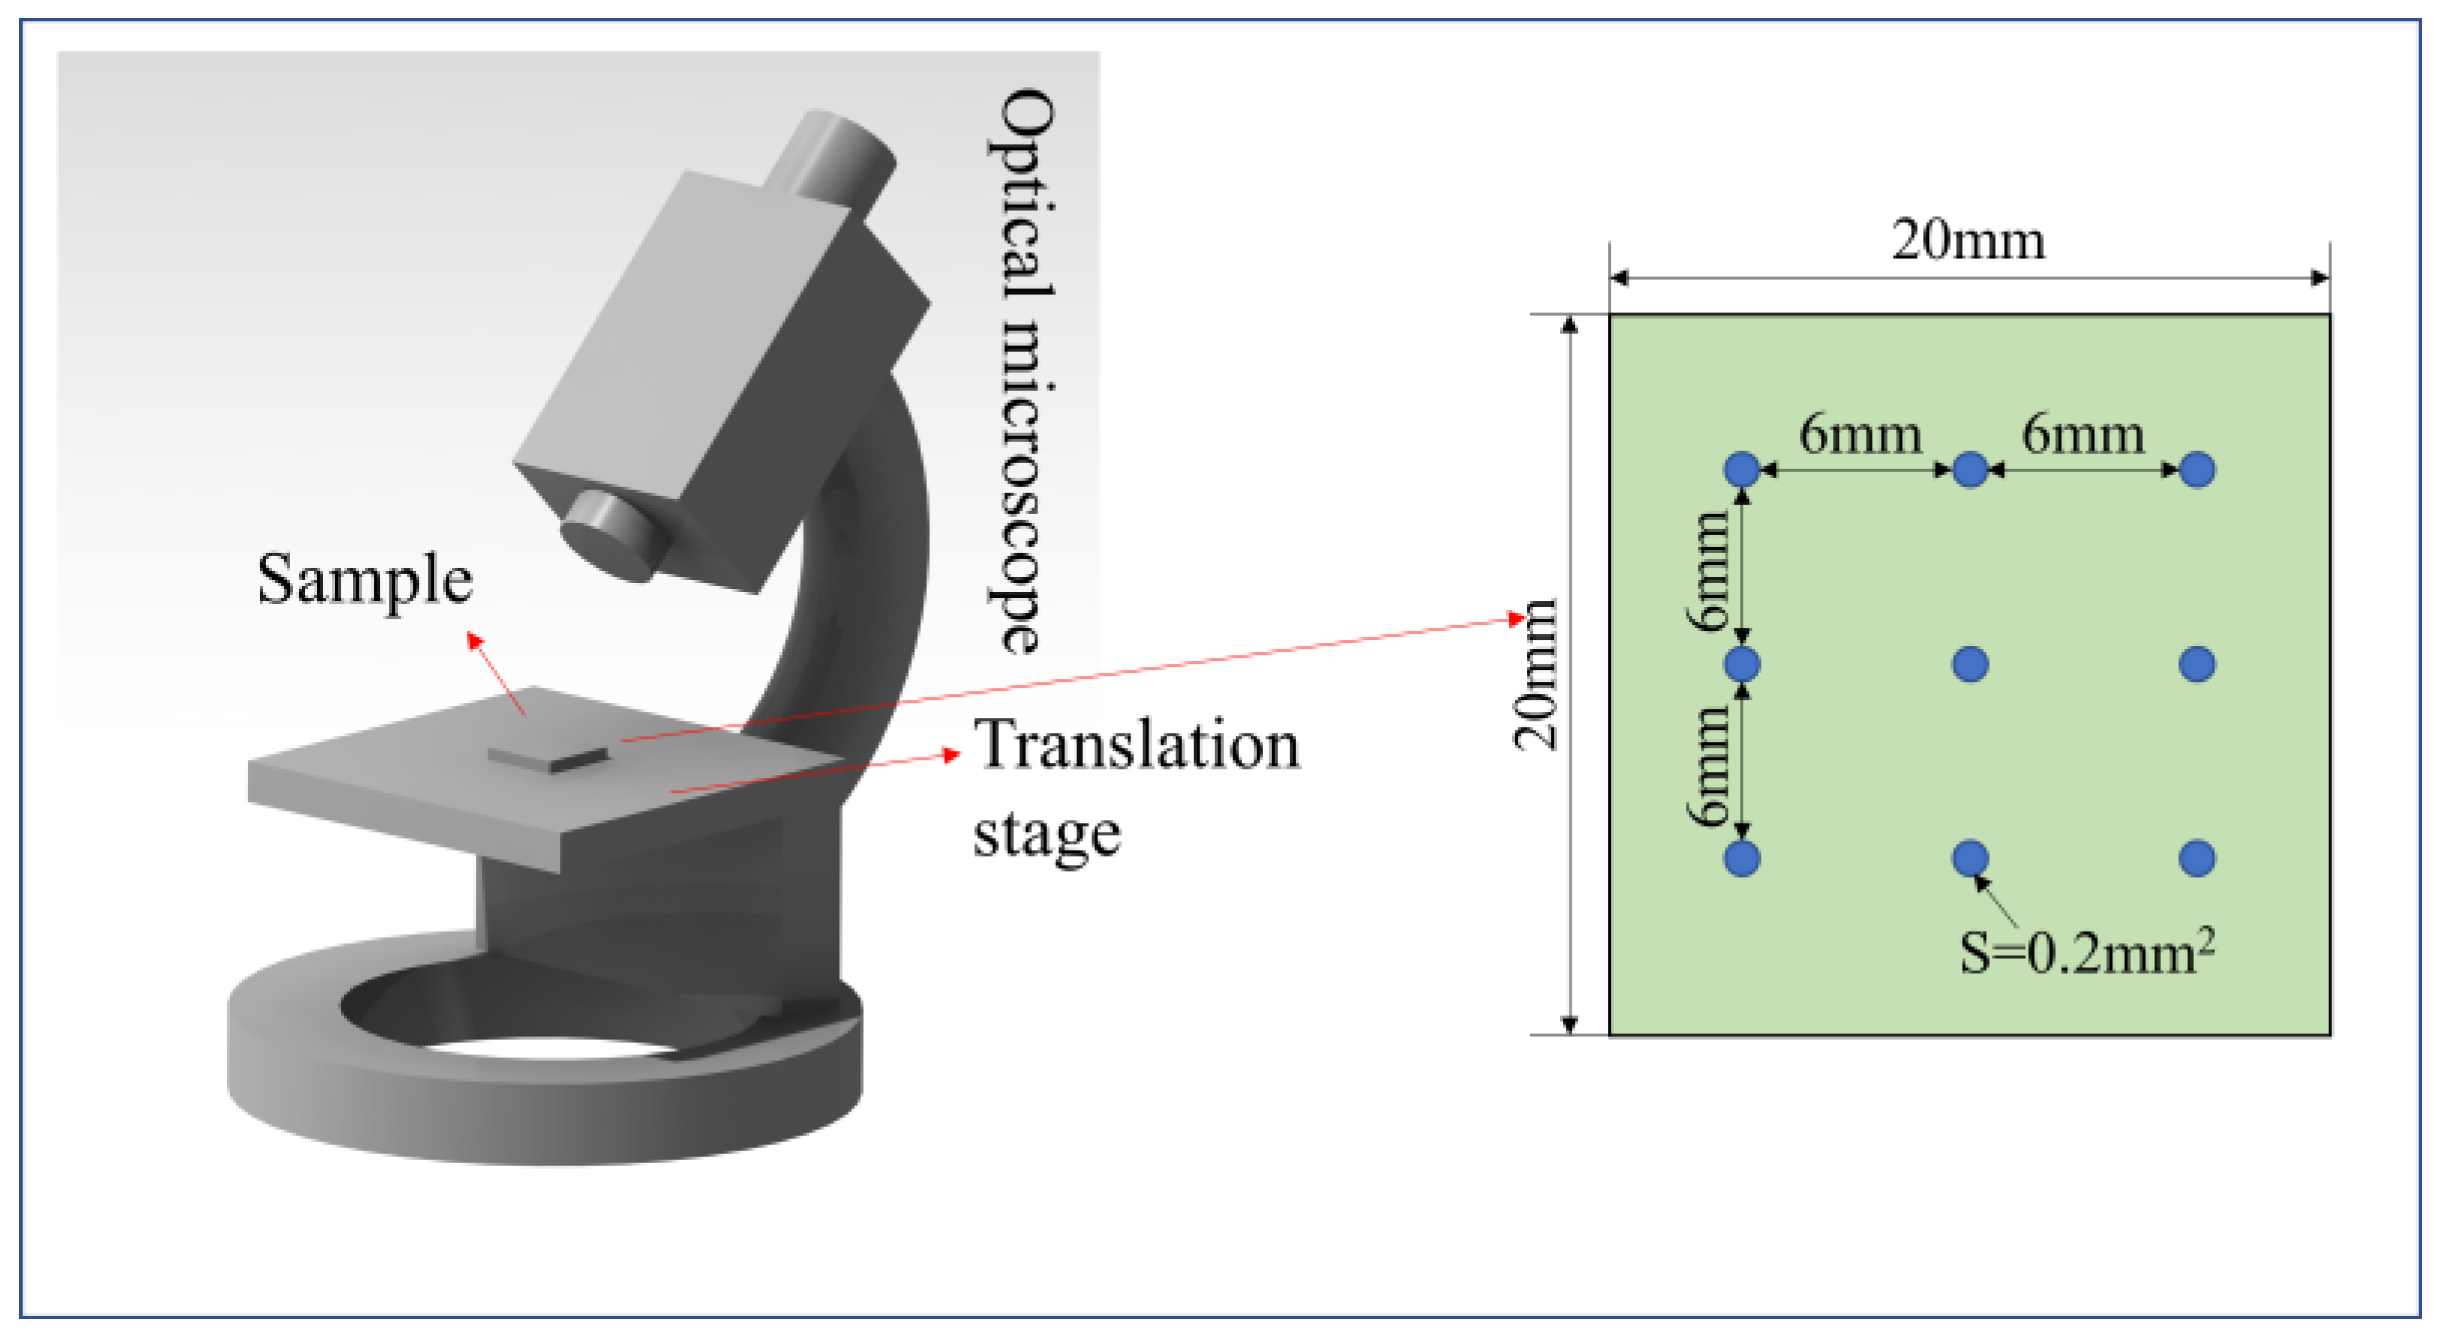
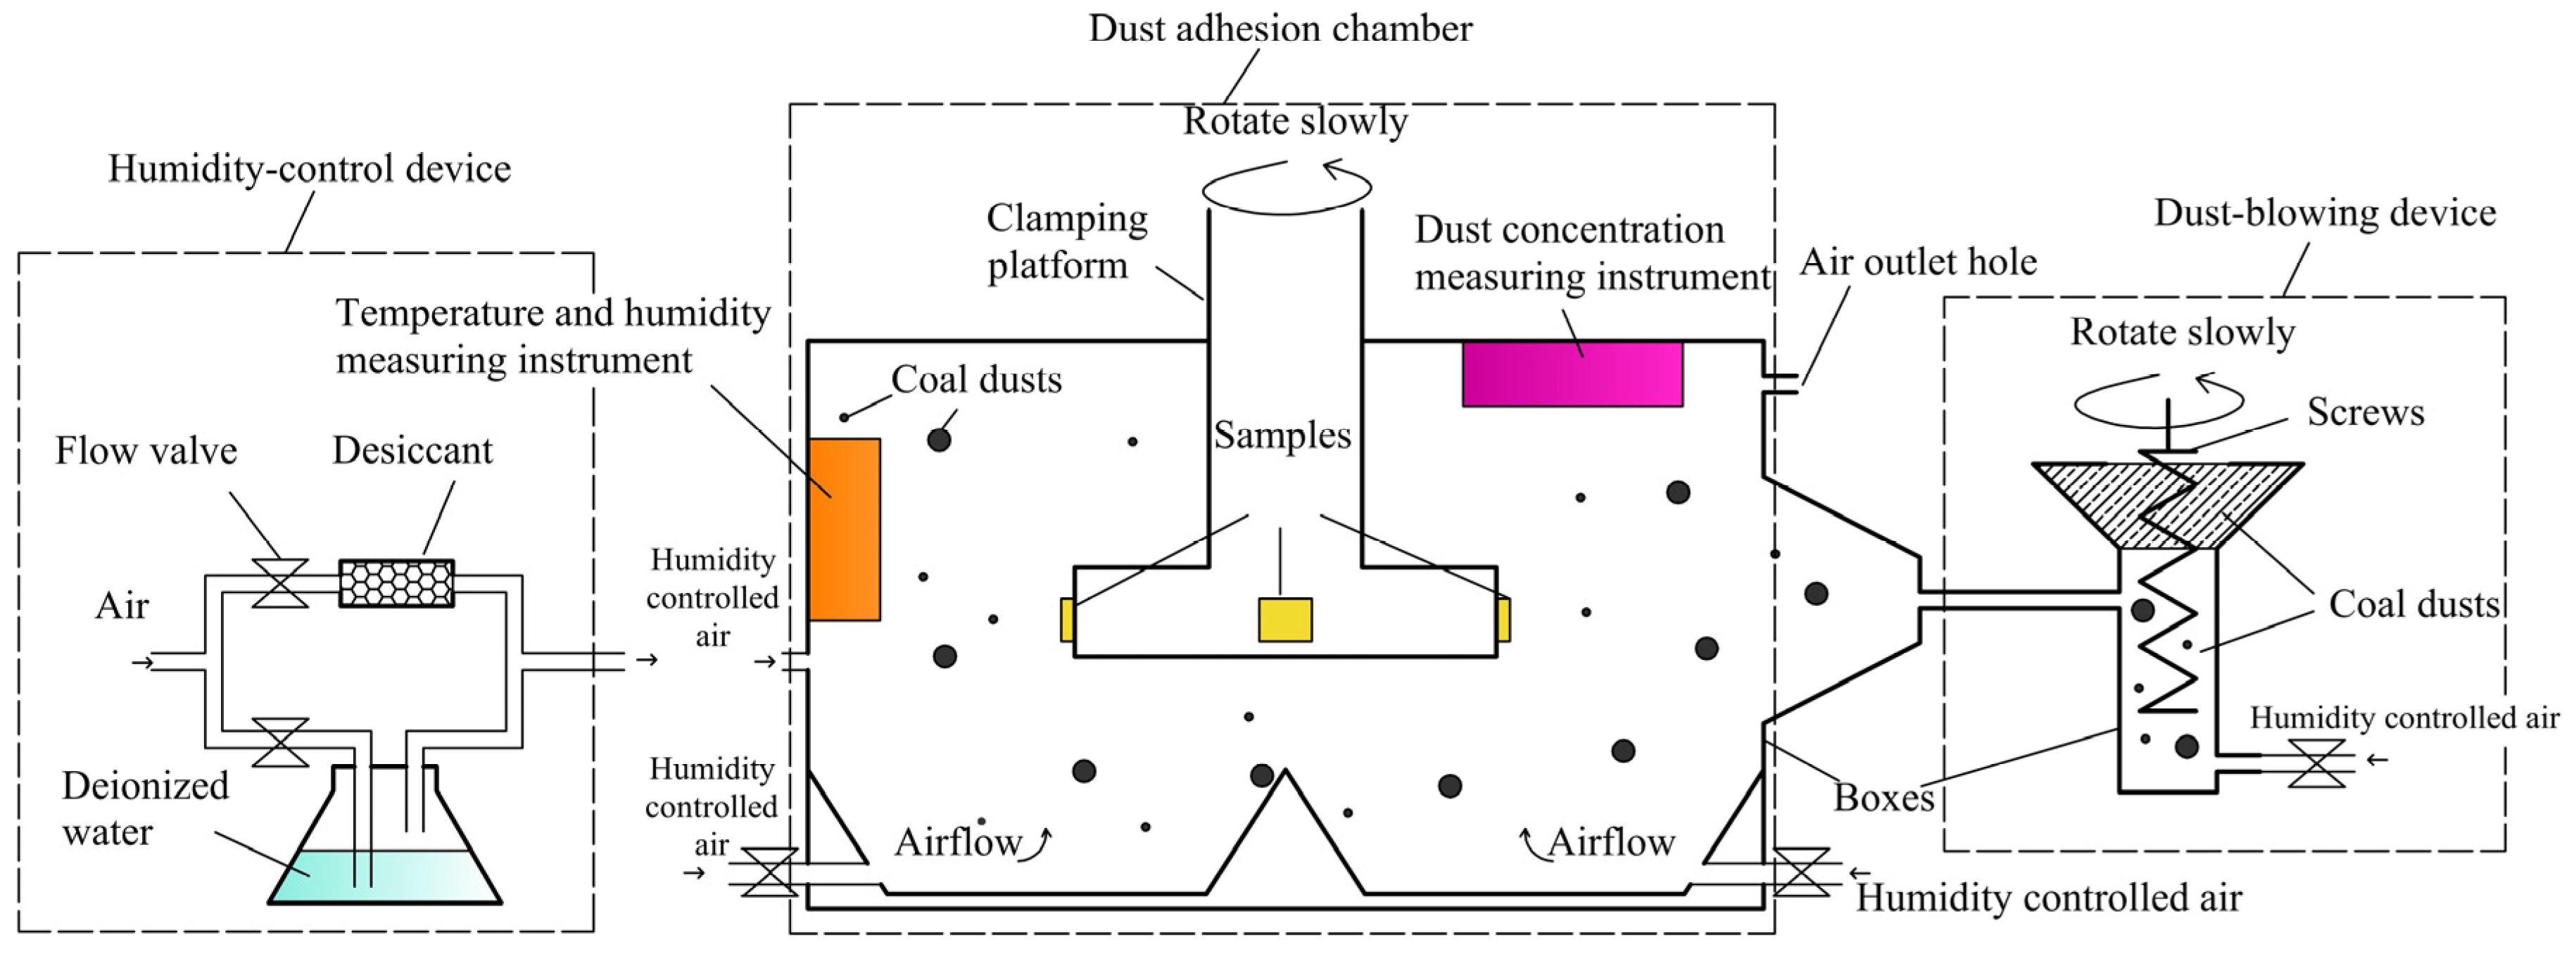
3.3. Experimental Method of Bulk Coal Dust Adhesion

To measure the amount and size of the coal dust adhering to the test samples, a coal dust adhesion experimental platform was designed and constructed. This platform consisted of a dust-blowing device, dust adhesion chamber, and humidity control device, as shown in Figure 4. The dust-blowing device facilitated the transportation and dispersion of coal dust to achieve a specific concentration within the sealed chamber. The humidity control device regulated the RH within the chamber. The samples were made to move in uniform circular motion at low speed (12 r/min) on a loading platform (with an installation radius of 75 mm) for uniform dust adhesion and to minimize the influence of centripetal forces.
The concentration of coal dust was measured by a dust concentration tester (YRF100A, Yaorui, Jinan, China) and set at 20–100 mg/m3 to simulate the real environment of underground coal mines, where the concentration of coal dust is in the range of zero to several hundred mg/m3. RH was chosen as the primary variable and was set to be 30%, 40%, 50%, 60%, 70%, and 80% during the experiments. The experiments were also performed at room temperature and near-standard atmospheric pressure. Three samples were used in each experiment. After the adhesion, the experimental fused silica samples were observed under an optical microscope (BA310Met, Motic, Xiamen, China) at 9 positions for capturing the images, each with a field of view of 0.2 mm2, as shown in Figure 5. Image processing software (OLYCIA m3) was used to count the particles within the 9 fields of view. During the image processing, the equivalent circular area diameter was used for the particles with irregular shape, which can be expressed below:
d = 4 S / π
where S is the projected area of the particle.

3.4. Characterization Techniques

The static contact angles of the fused silica glass samples were measured by using a contact-angle meter (OCA25, Dataphysics, Stuttgart, Germany). The surface area roughness (Sa) of the fused silica glass samples was determined by 3D white-light interferometric surface profiling (NexView, Zygo, Middlefield, OH, USA), and the average value was 0.8 nm. Probes with attached coal dust were characterized by field-emission scanning electron microscopy (Quanta 200FEG, FEI, Waltham, MA, USA). The main chemical composition of the coal dusts was characterized by energy-dispersive X-ray analysis (EDAX, Berwyn, IL, USA), and the results are shown in Table 1.

4. Results and Discussion

4.1. Theoretical Calculation of Adhesion Forces between Coal Dust Particles and Fused Silica

Theoretical values of the van der Waals and capillary forces for the Tip1 and Tip2 probes were determined for comparison with experimental values. Equation (1) was used to calculate the van der Waals forces acting on the coal dust particles and glass surfaces. As the carbon content is highest in coal dust, the Hamaker constant (A) between C and fused silica was used for the calculations. The value of the Hamaker constant is 13.7 × 10⁻²⁰ J and 1.71 × 10⁻²⁰ J in vacuum and water [36], respectively. In ref. [21], the Hamaker constant in water was used to calculate the van der Waals forces in the wetted case. The distance (H) between the particle and flat surface was assumed to be 0.4 nm in refs. [16,21]. The van der Waals forces calculated for dry and humid air are listed in Table 2.
Equation (3) was used to calculate the equilibrium radius of the meniscus. The molar volume V of water is 18.03 mL·mol−1, the surface tension γ is 72 × 10−3 N·m−1 at a room temperature of 25 °C, the gas constant R is 8.31 J·mol−1·K−1, T was 298 K (25 °C), and the radii of the liquid bridges were calculated to be 1.03 nm, 1.47 nm, and 2.35 nm for RHs ( P / P s ) of 60%, 70%, and 80%, respectively. The static contact angle of water with fused silica was measured to be 63° (θ1) and that with coal was 80° (θ2), taken from ref. [27]; c o s   θ was calculated to be 0.31 from Equation (5). The separation distance Z was chosen to be 0.4 nm, according to refs. [21,35]. The capillary forces at RHs of 60%, 70%, and 80% were calculated using Equation (2), and the values are listed below in Table 3:
c o s   θ = ( c o s   θ 1 + c o s   θ 2 ) 2

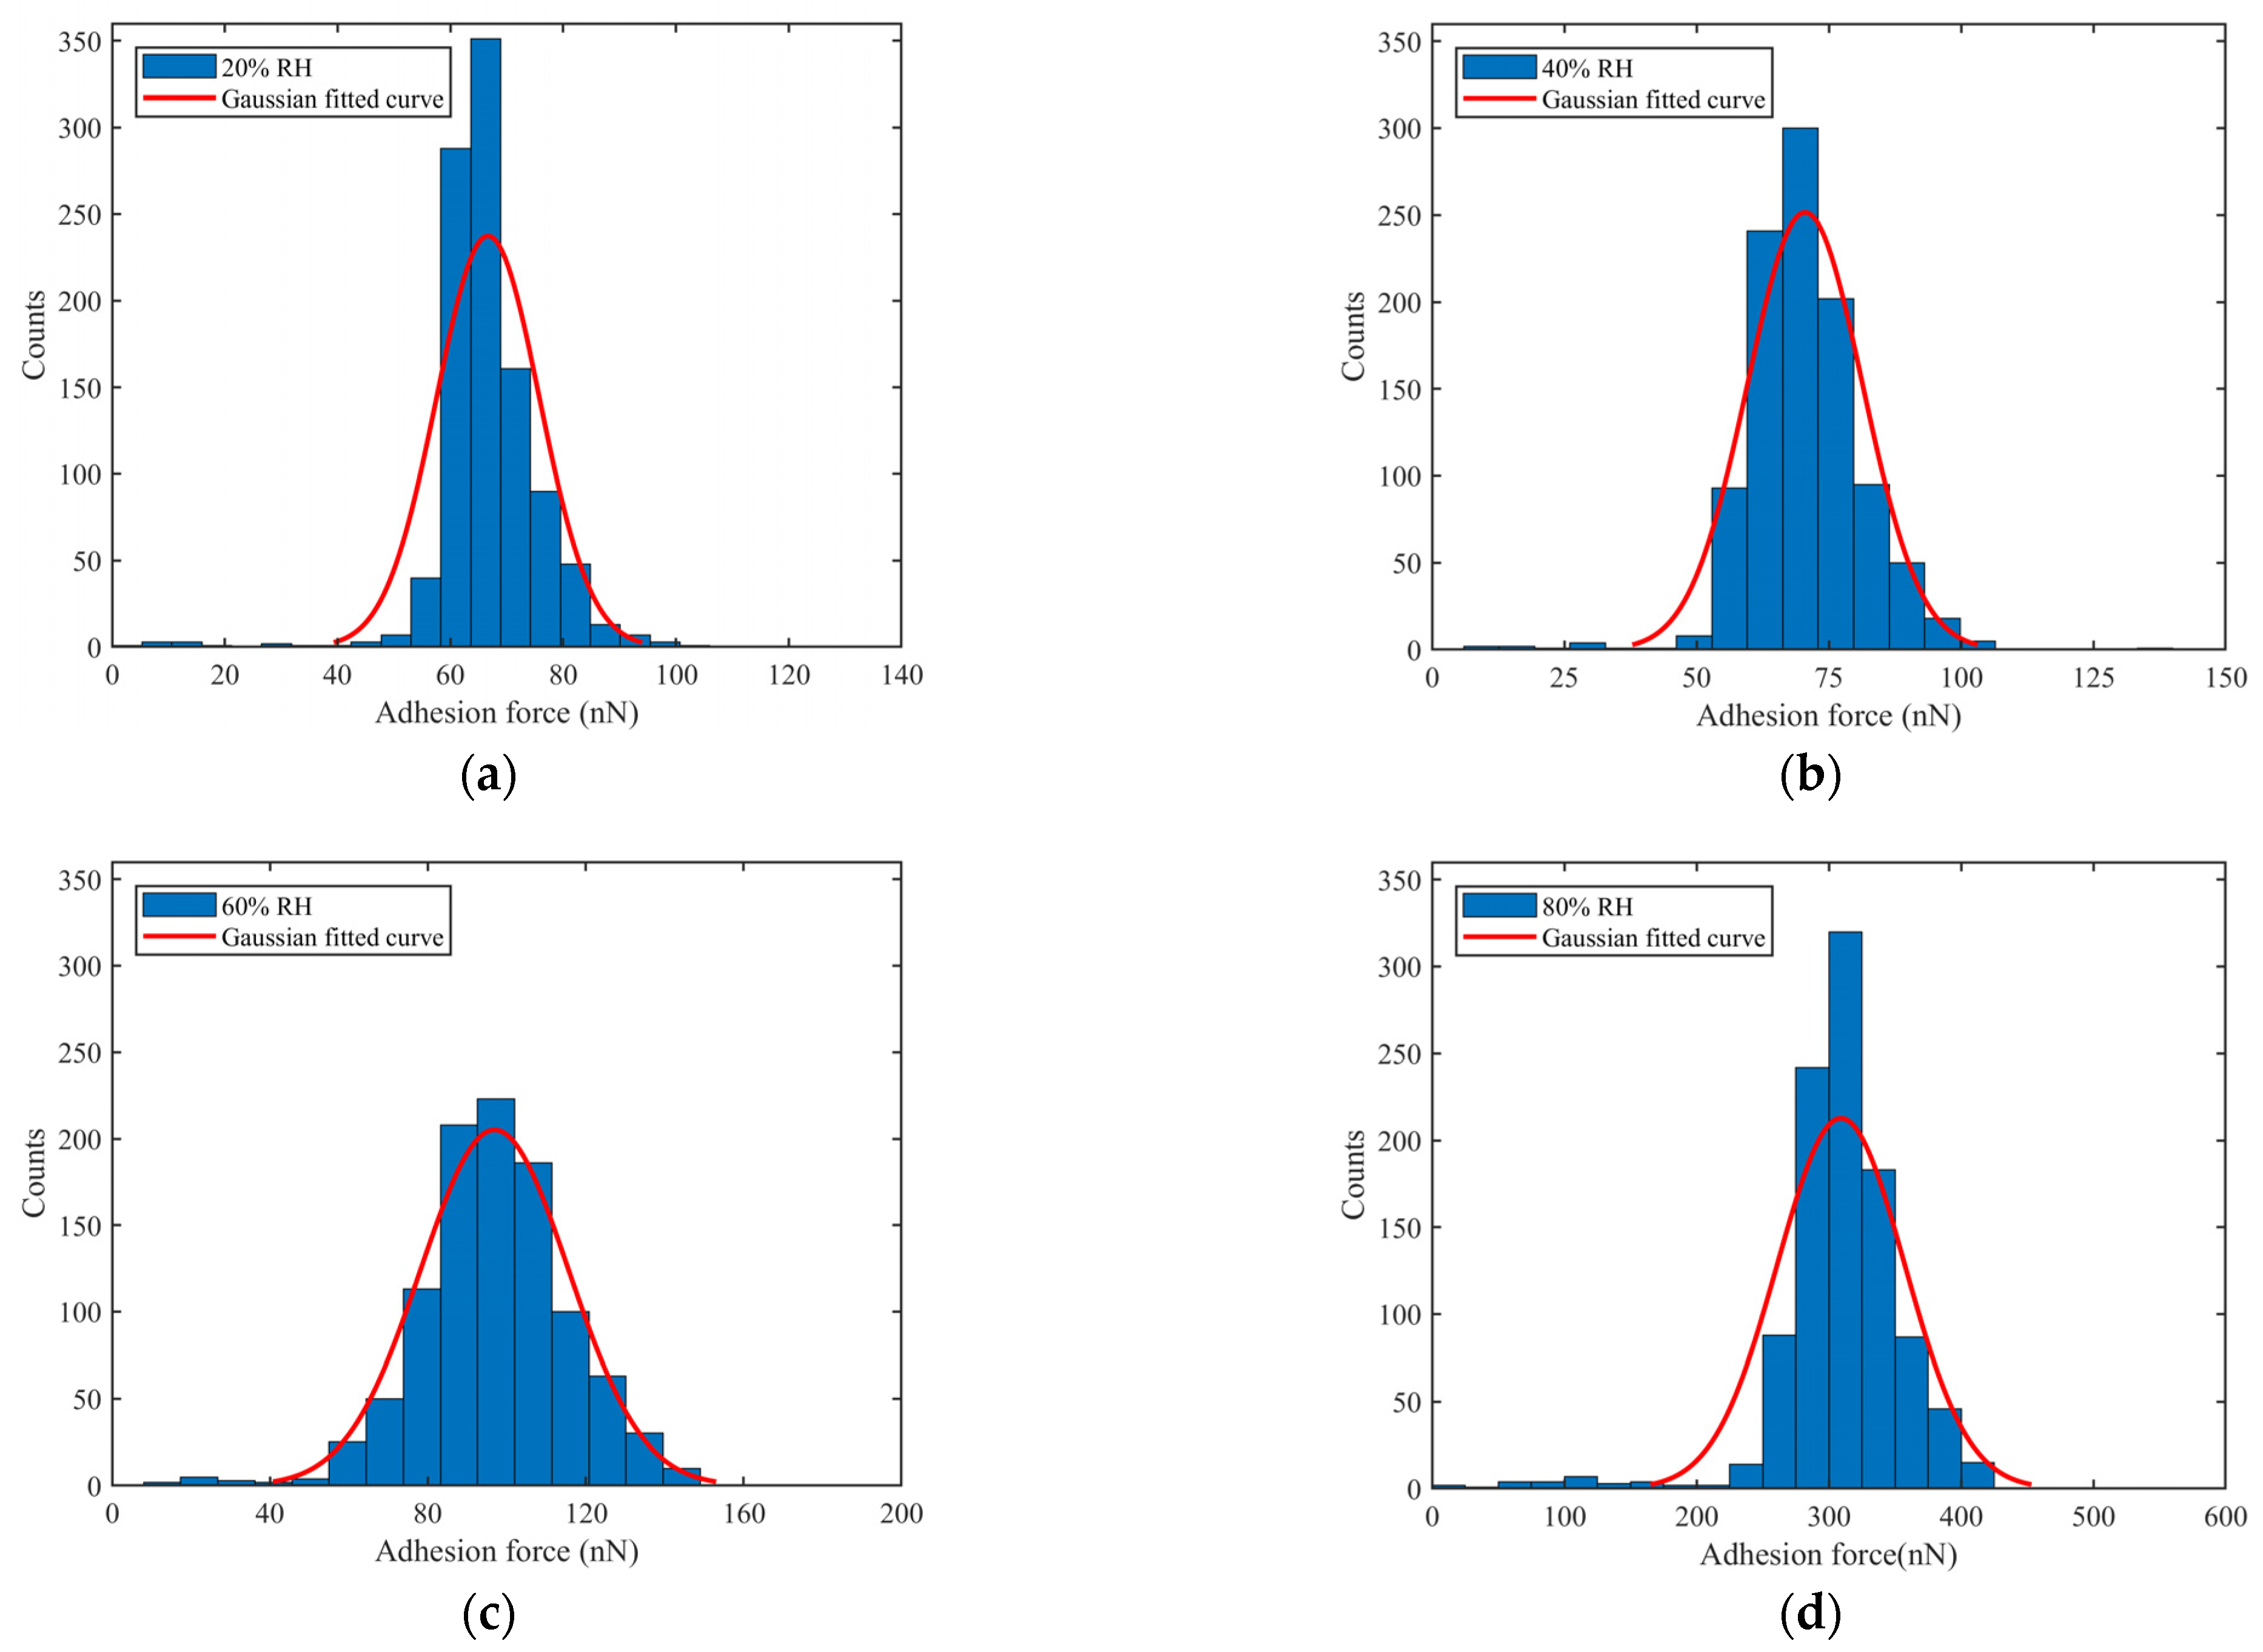
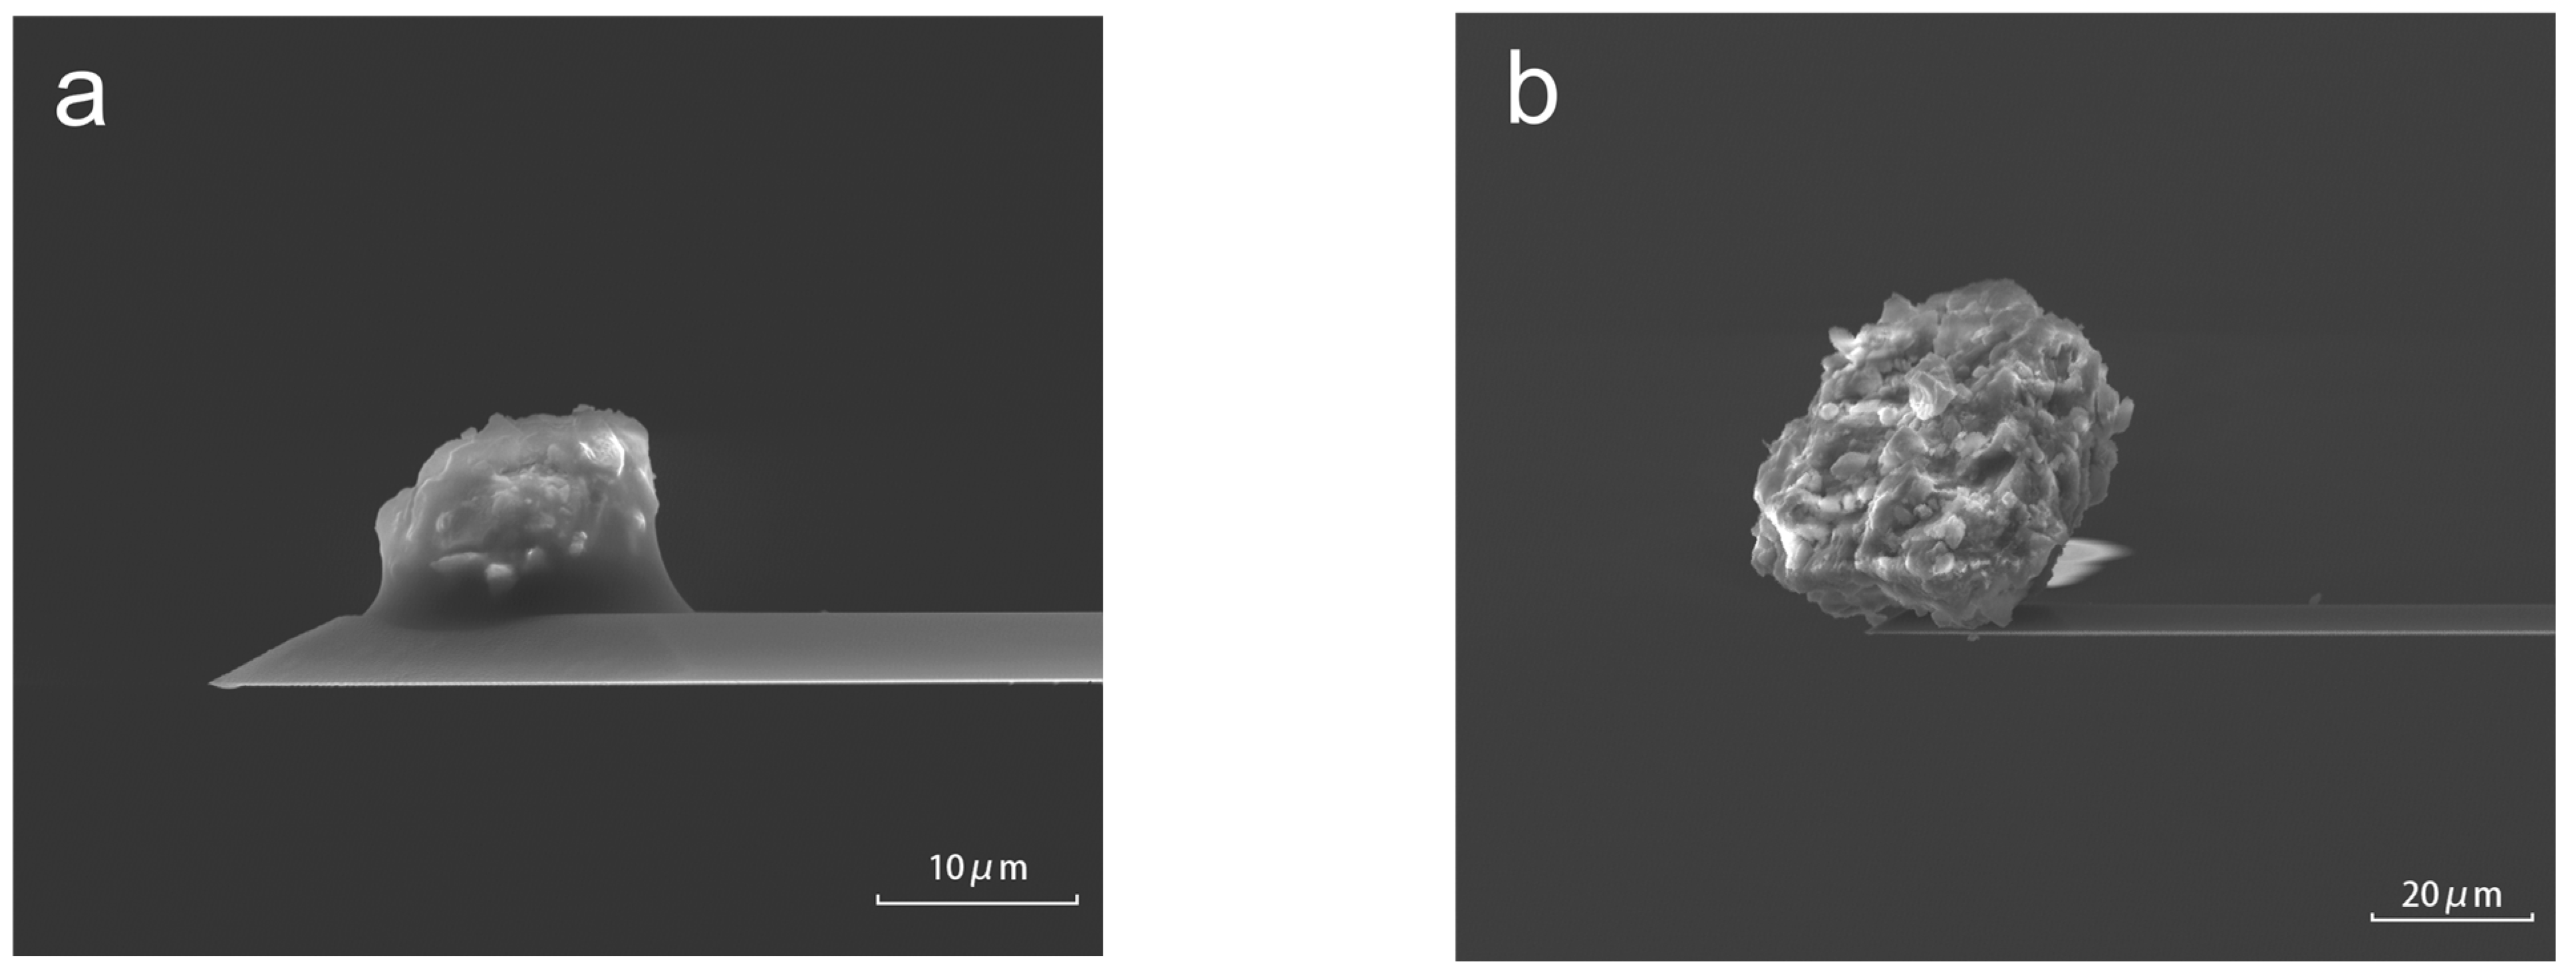
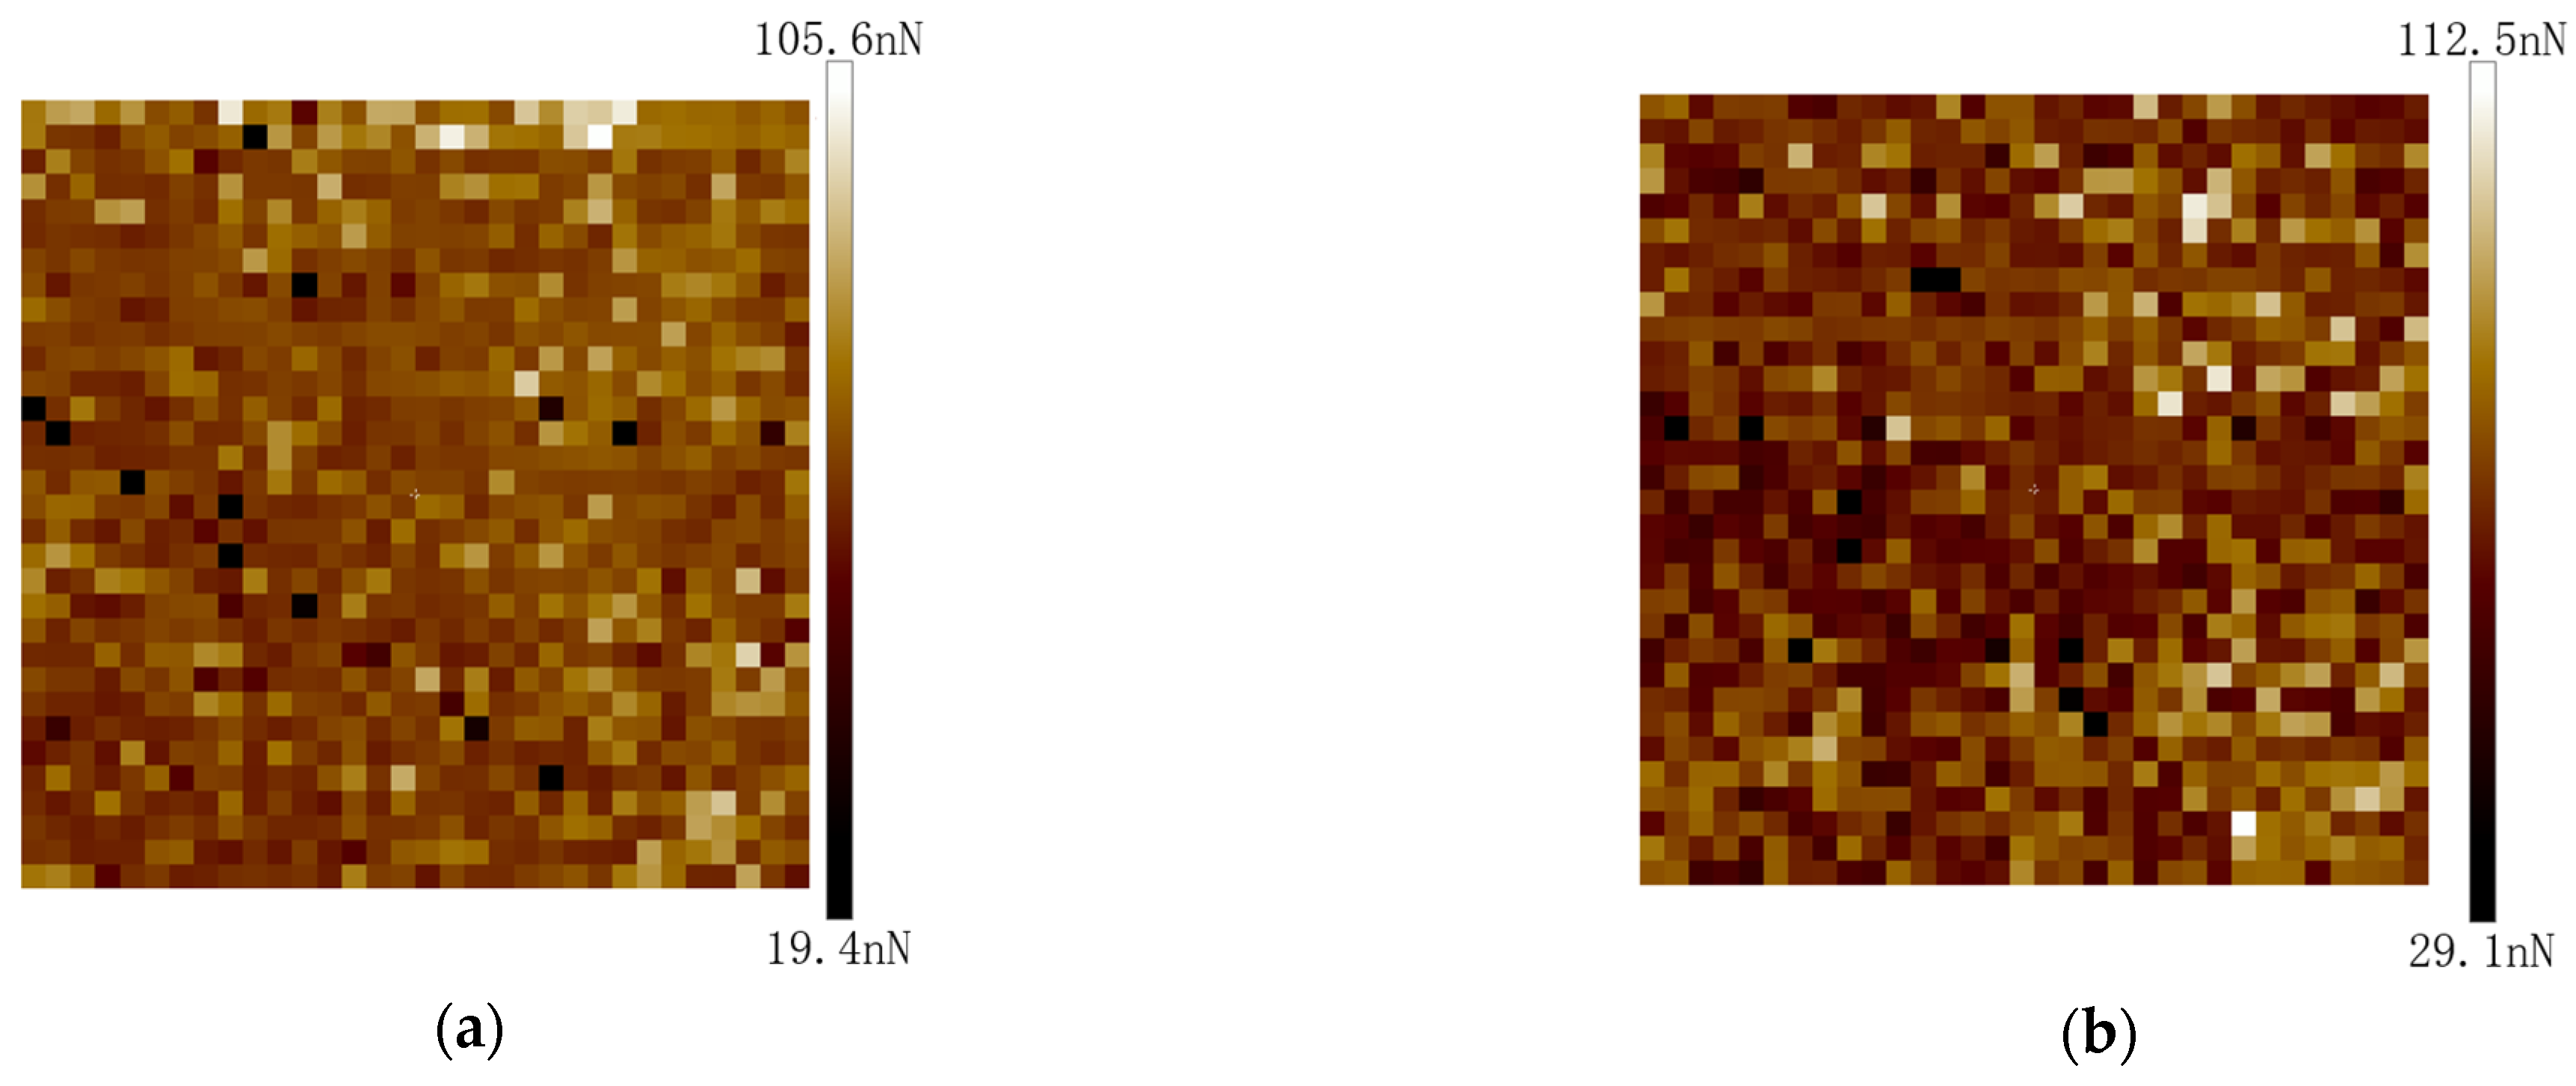
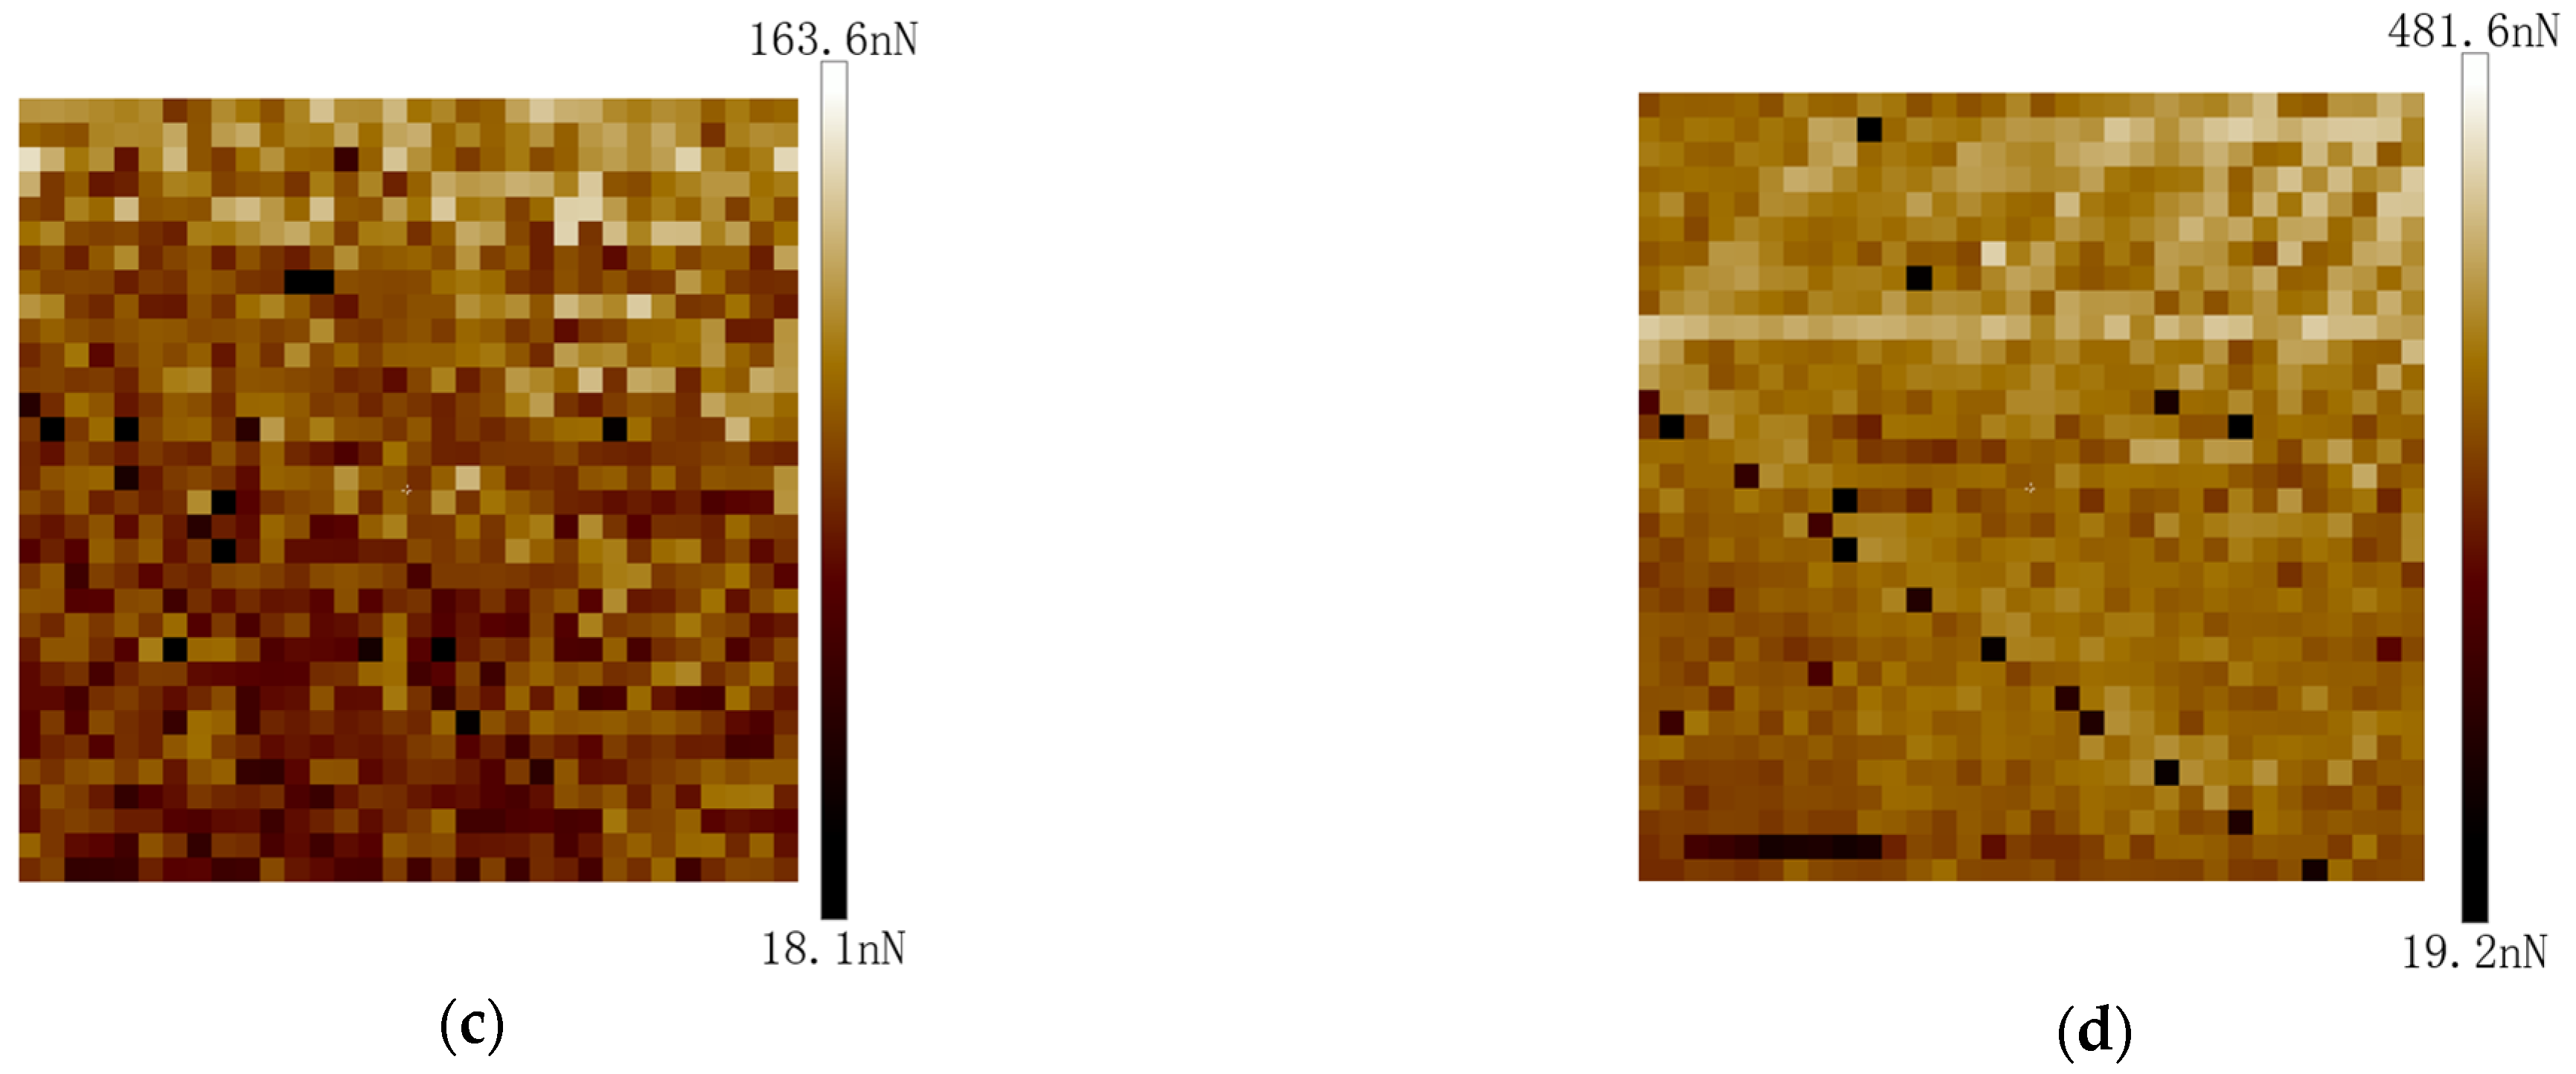
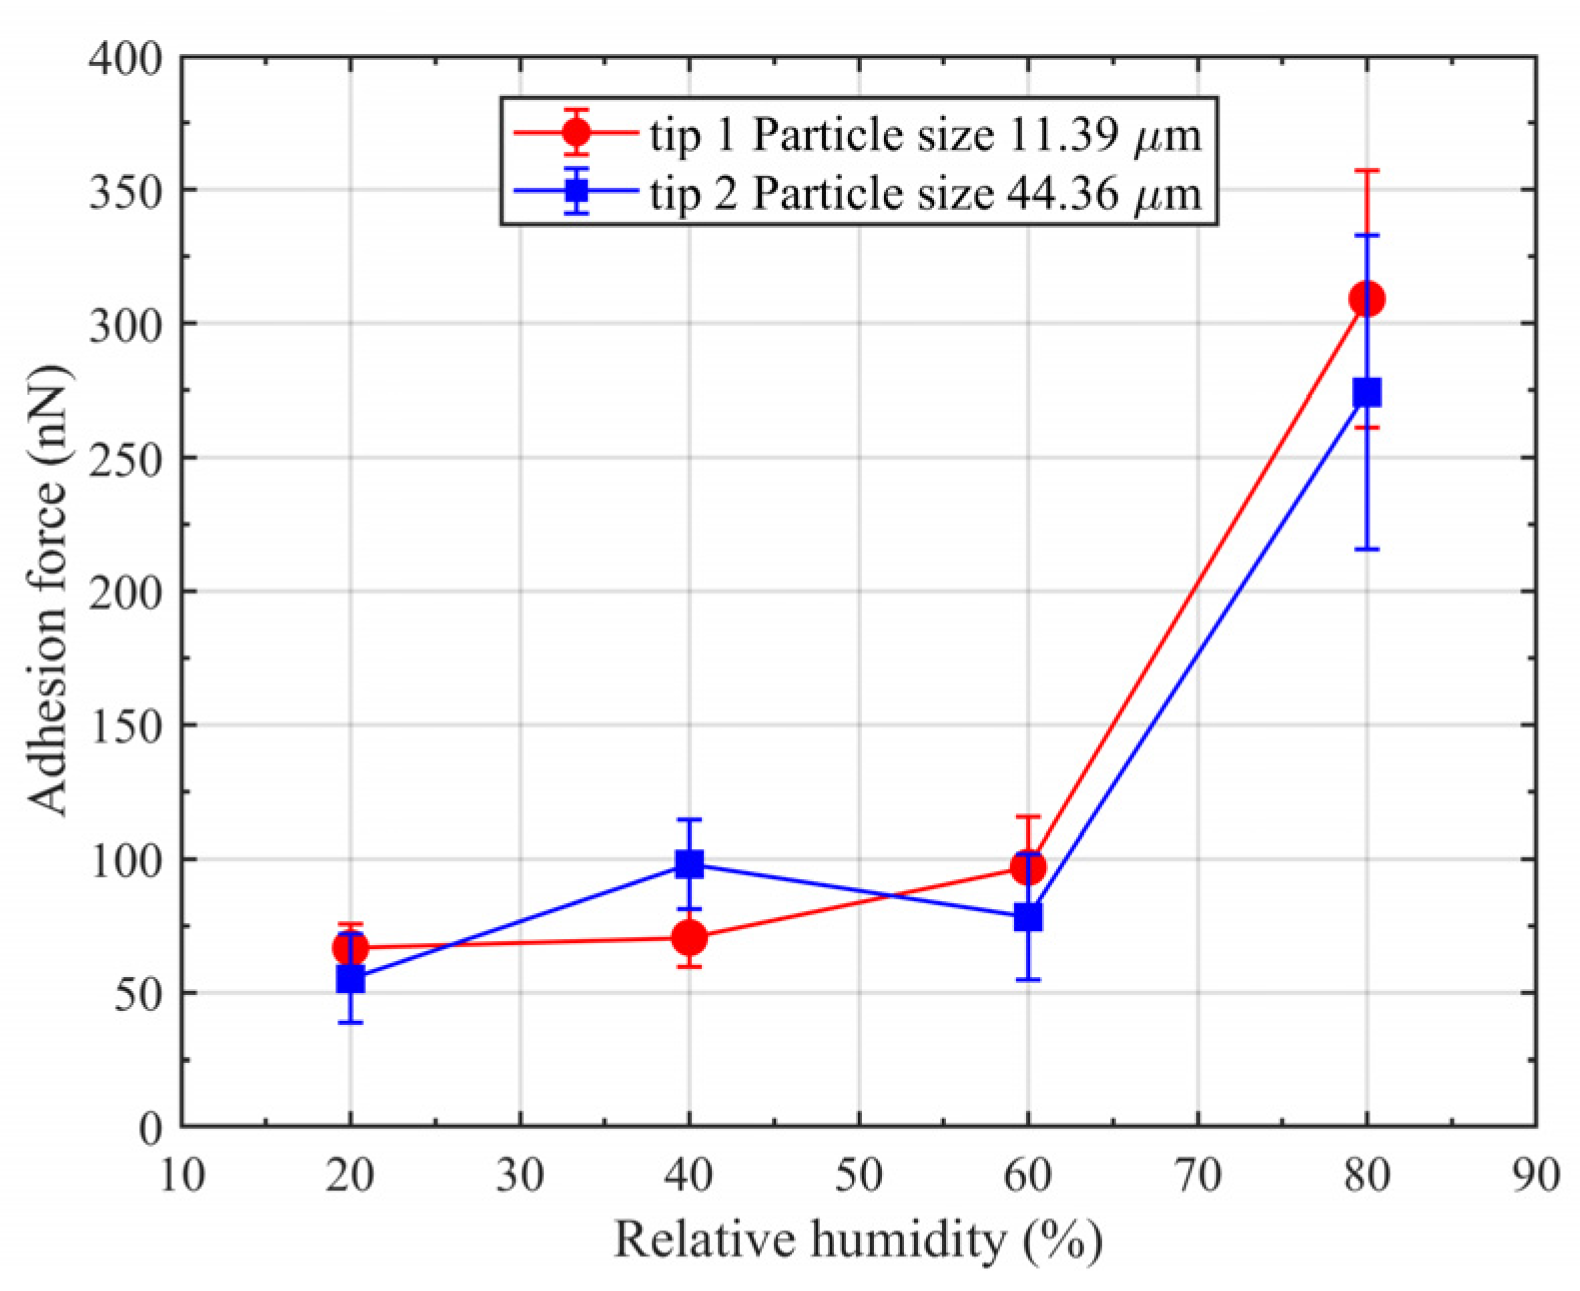
4.2. Measurement of Adhesion Force between Coal Dust Particles and Fused Silica Using AFM

The process of measuring the adhesion force between the coal dust mounted on the probe and the fused silica sample fixed on the AFM probe is shown in Figure 6a, and a typical force curve is shown in Figure 6b. As the modified probe approached the fused silica glass sample from its initial position, the coal dust is still far from the sample, no interaction has taken place, and the cantilever of the probe is not deflected (1 in Figure 6a). This stage corresponds to I in Figure 6b, where the force curve is seen to be flat. As the probe approaches the surface up to a certain distance, the attractive force bends the cantilever downward and drives the tip (coal dust) to touch the surface (2 in Figure 6a). At this point, the force curve exhibits a small bend (II in Figure 6b). The probe continues to move downward until the cantilever bends upward and the preset load between the coal dust and sample is reached (3 in Figure 6a and III in Figure 6b). The preset load is 200 nN, and no dwell time was set in this study. From this point onward, the probe starts to withdraw. The attractive force keeps the probe tip in contact with the surface when the probe is moved up (4 in Figure 6a and IV in Figure 6b). As the probe continues to move upward, the force continues to increase until at a certain point (A in Figure 6b), the tip breaks away from the surface (V in Figure 6b). The force at point A reflects the strength of the adhesion. Thereafter, the probe continues to move upward and is restored to its original state (5 in Figure 6a), as there is no interaction. During the measurement, the piezo velocity is set to be 10.2 μ m / s .
Based on the above process, the adhesion forces between the individual coal dust particles and fused silica glass samples were measured, and the results are presented in Figure 7, Figure 8 and Figure 9. Figure 7 shows the adhesion force map of the Tip1 probe on the fused silica surface. To maximally eliminate the influence of roughness of the contact surface and other uncertainties on the experimental results, adhesion forces on a 32 × 32 pixel-sized area with dimensions of 90 μm × 90 μm were measured. In all, 1024 force curves and their corresponding force values were obtained. Images of the adhesion forces corresponding to the 32 × 32 pixel-sized area at different RH values are presented in Figure 7. The colored shades reflect the magnitudes of the adhesion force. As seen in Figure 7, the adhesion force is not the same at different acquisition points.
The adhesion forces at all the points were recorded and are displayed in the histogram shown in Figure 8. It is seen that the adhesion forces at different points exhibit a Gaussian distribution. The mean value (μ) of the Gaussian fitted curve gradually shifts to the right with increasing RH, indicating that the adhesion force increases with RH.
Figure 9 shows the variation in the mean value of the adhesion force with respect to RH for the two different particles. It is seen that the adhesion force between individual coal dust particles and the fused silica surface does not vary much (increases slightly) when the RH is in the range of 20–60%; however, there is a large increase at a RH of 80% as compared to that at 60%.
As previously mentioned, the adhesion force of the particles mainly includes van der Waals forces ( F v d w ), electrostatic forces ( F e l c ), and capillary forces ( F c ). The van der Waals and capillary forces are usually observed in the nanometer range [37]. Electrostatic forces act over longer distances at the micron level and are generally stronger than the van der Waals and capillary forces [9,16]. It is seen from Figure 6b that segments I and VI of the force curve did not undergo a large deflection, which signifies that the probe was not remotely attracted to the fused silica glass even at close proximity. The action distance did not reach the micron level; therefore, electrostatic forces were not present. Thus, it was concluded that the adhesion force between the coal dust particles and fused silica surface mainly originates from van der Waals and capillary forces.
The results shown in Figure 9 are in accordance with earlier studies, namely that the adhesion force increases when the RH is high. As the adhesion force is almost stable (increases slightly) over the RH range of 20–80% and increases considerably at a RH of 80%, it is surmised that a critical RH (RHcr) exists in the range of 60–80%. When the humidity is low (20%—RHcr), there is no liquid condensation or stable liquid bridge formed between the coal dust and fused silica surface, and the adhesion is mainly dominated by dry adhesion [38], i.e., the adhesion force mainly consists of van der Waals forces. When the humidity is large (RHcr—80%), the moisture easily condenses on the surface of fused silica glass and coal dust. This results in the formation of liquid bridges, and the capillary force is predominant. The Hamaker constant (A) decreases with RH [36], leading to a decrease in the van der Waals force.
Wang et al. [38] proposed a model for predicting the critical RH. When the RH is higher than the critical value, liquid bridges are easily formed and spread along the rough surface, and capillary forces dominate the adhesion. Isaifan et al. [21] predicted a transition point at a RH of 70% in their study on adhesion between dust and a photovoltaic module surface. At this point, the deposition rate of dust on the photovoltaic surface undergoes a shift from low to high. In addition, their results showed that capillary forces accounted for 98% of the entire adhesion force under high humidity conditions. These observations and conclusions are consistent with those of the present study.
Comparisons were made between the theoretical (Table 2 and Table 3) and experimental values (Figure 9) of the van der Waals and capillary forces. The theoretical values are significantly higher than the experimental values. This discrepancy arises because the irregular shape of the particles and the surface roughness of the particles (Figure 2) as well as the adhesion surface significantly reduce the contact area during adhesion, as reported by other researchers [12,23,24].
Moreover, the discrepancy between the theoretical and experimental values of the van der Waals force (at low RH) is larger than that of the capillary force (at high RH). This is inferred to be due to the condensed water filling some of the concave points (Figure 10b) and forming a closer contact, as compared to the case of no conformal contact when the RH is low (Figure 10a). This makes the capillary force less sensitive to the irregular shape of the particle or the surface roughness of the particle and contact surface.
It was reported earlier that the contact radius is a key factor that influences the adhesion force [13,15]. In the present study, the adhesion forces were mainly composed of van der Waals and capillary forces. It is seen from Equations (1) and (3) that an increase in contact radius leads to an increase in the adhesion force. However, according to the adhesion force curves in Figure 9, it is observed that the adhesion force is almost the same for two coal dust particles whose diameters differ largely. The reason for this may be that the local contact radius between coal dust particles and fused silica glass is affected by the irregular shape and rough surface that in turn affects the magnitude of the adhesion force. This observation is consistent with the findings of Moutinho et al. [9].

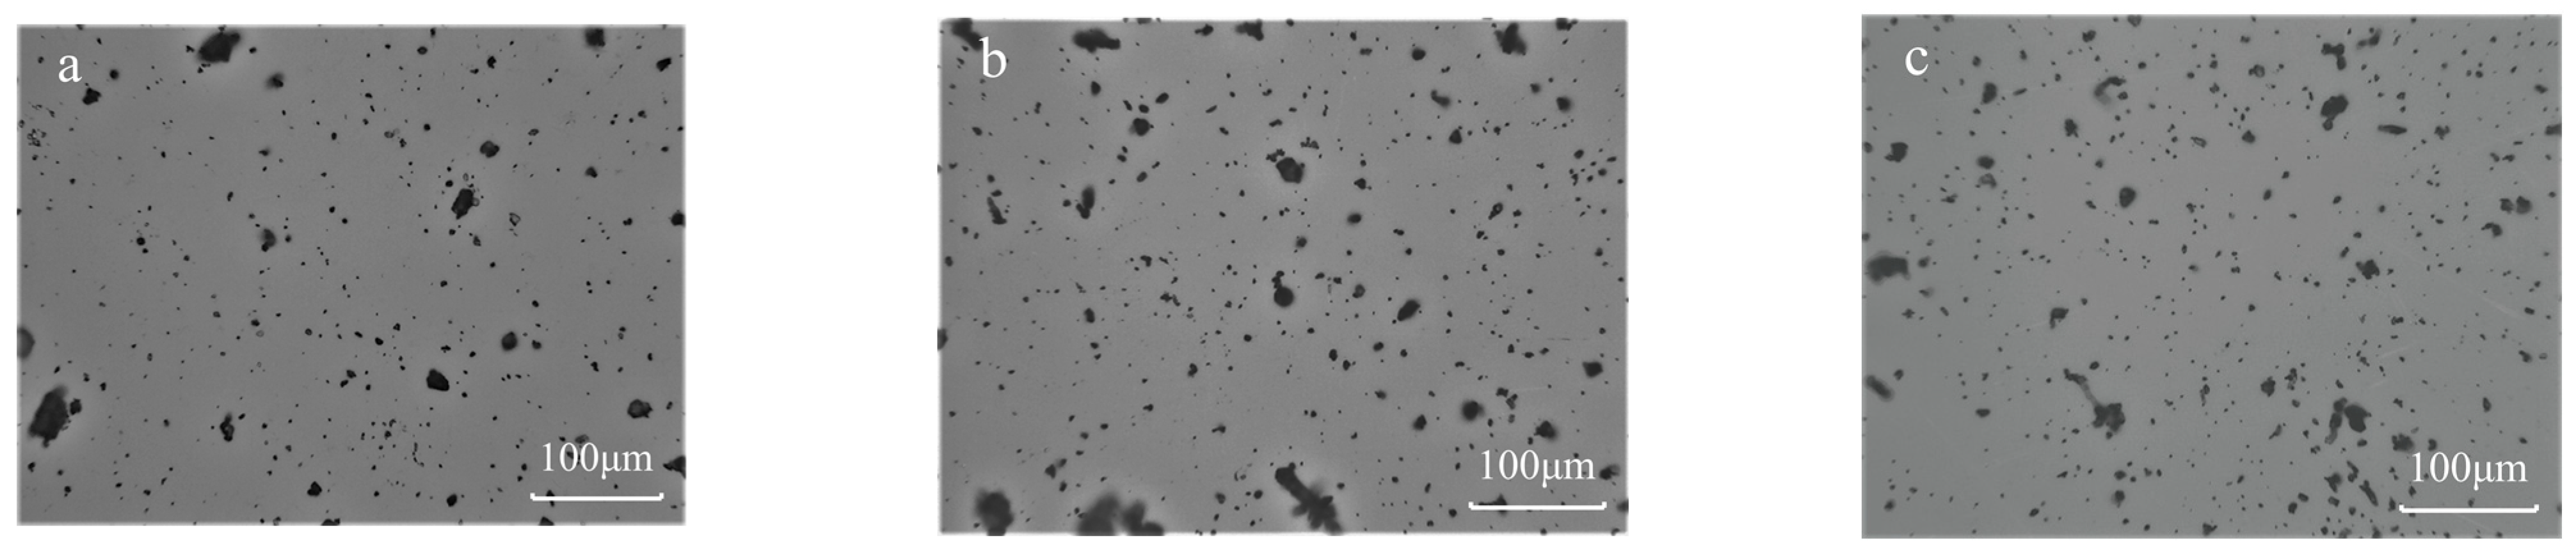
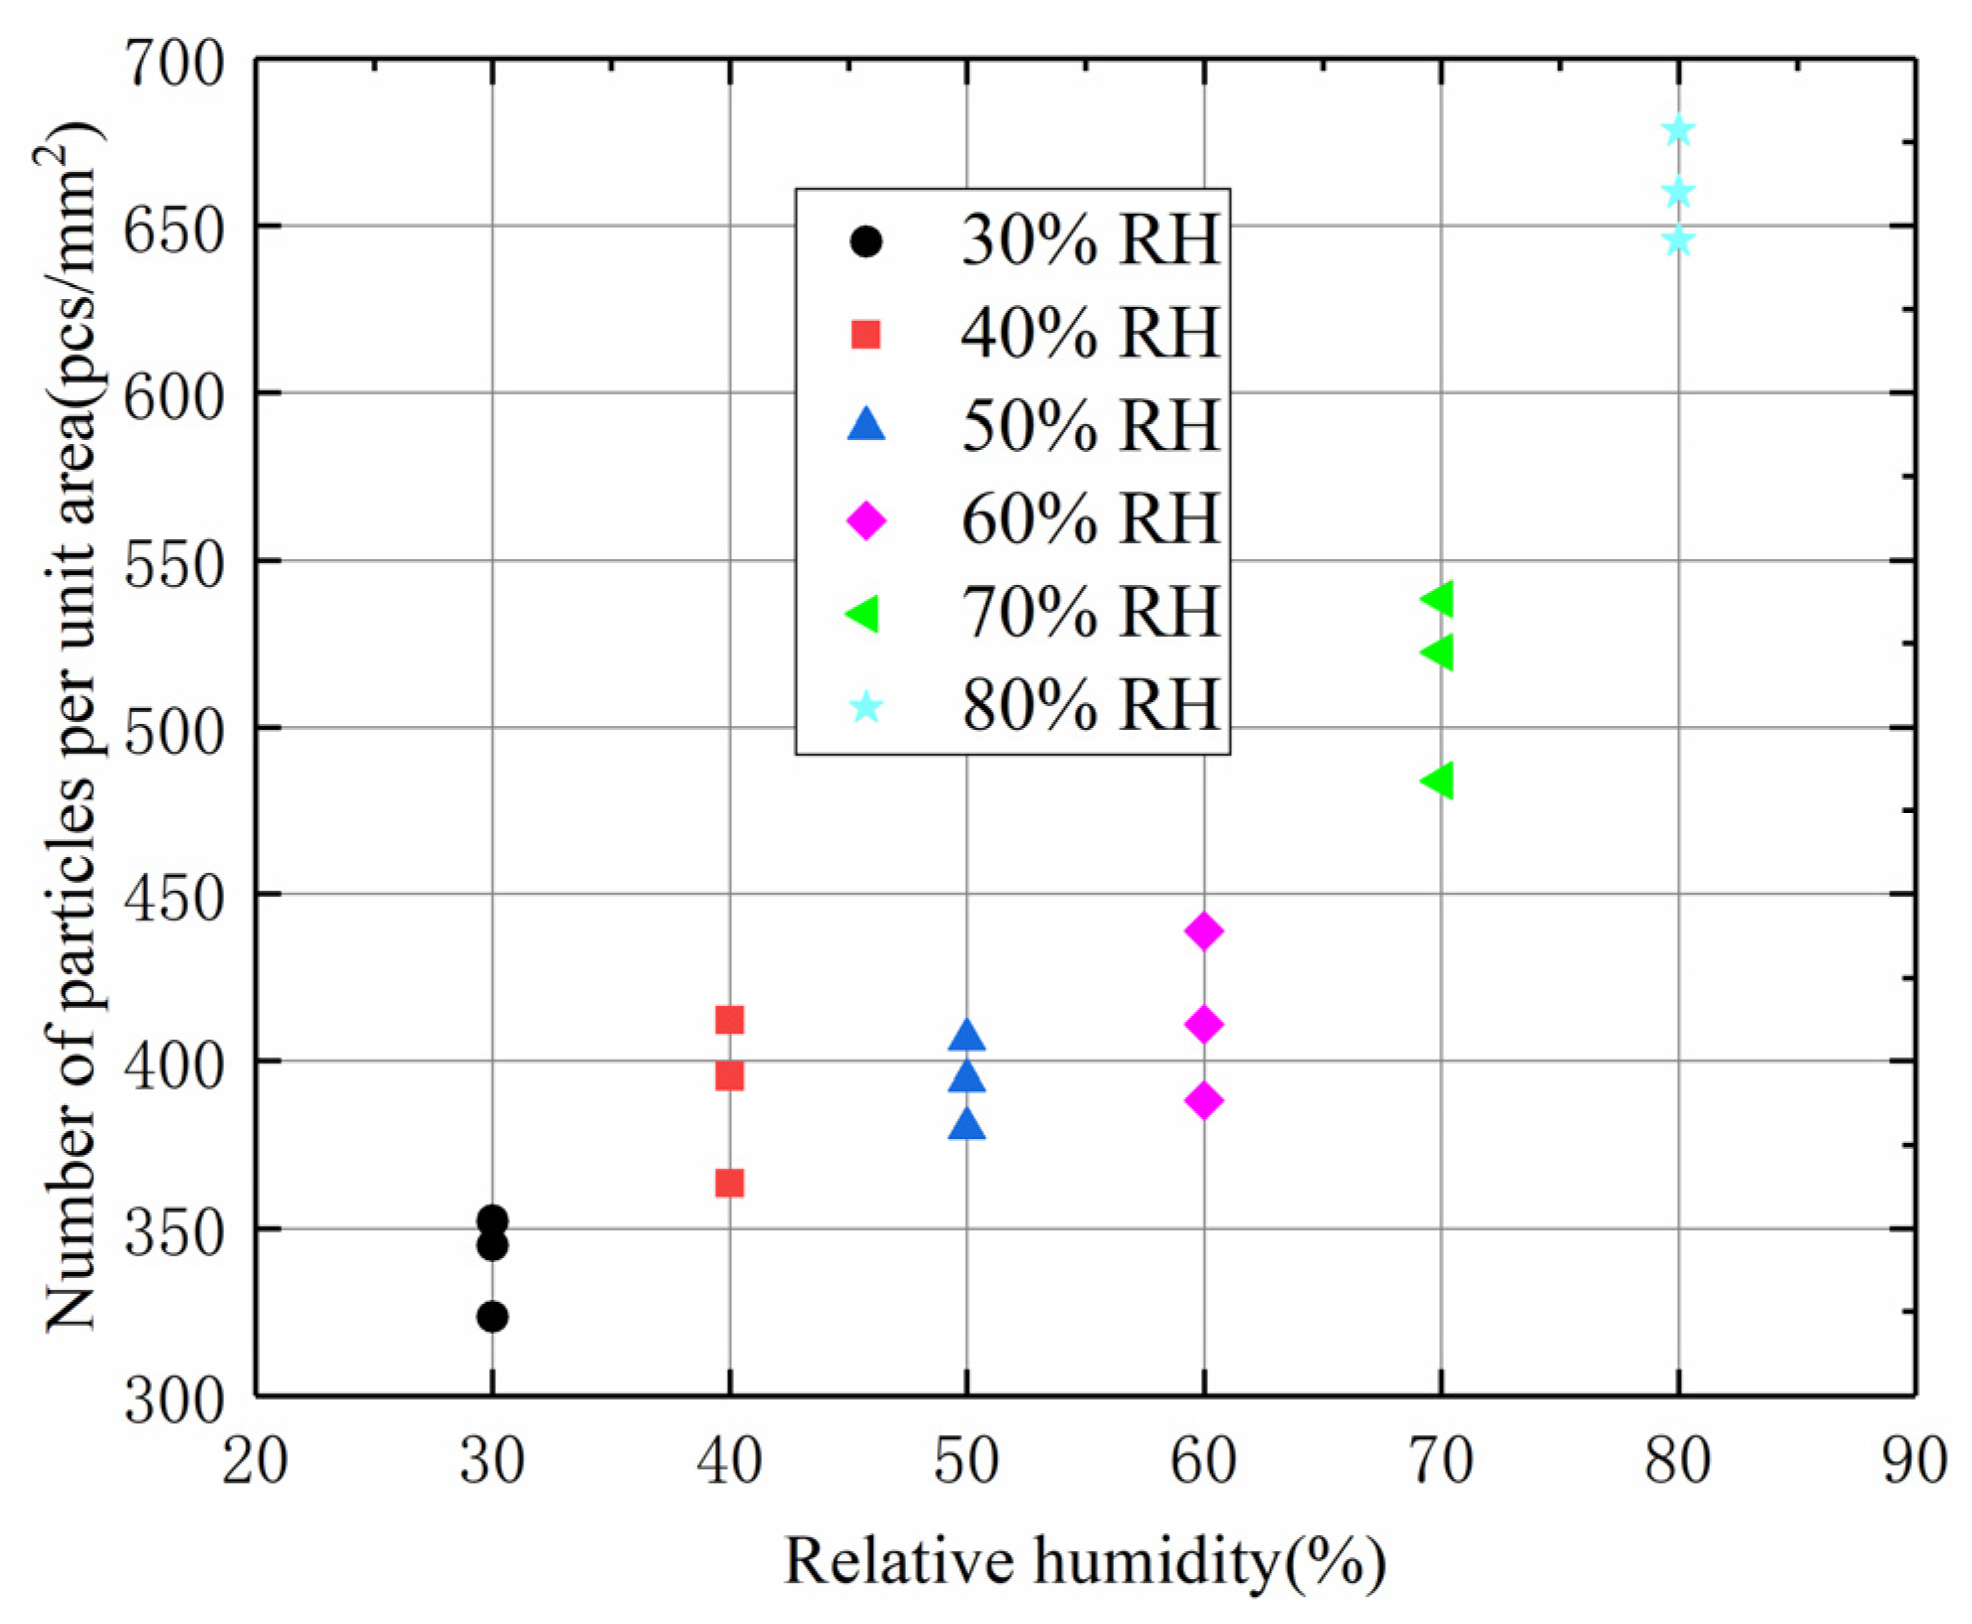
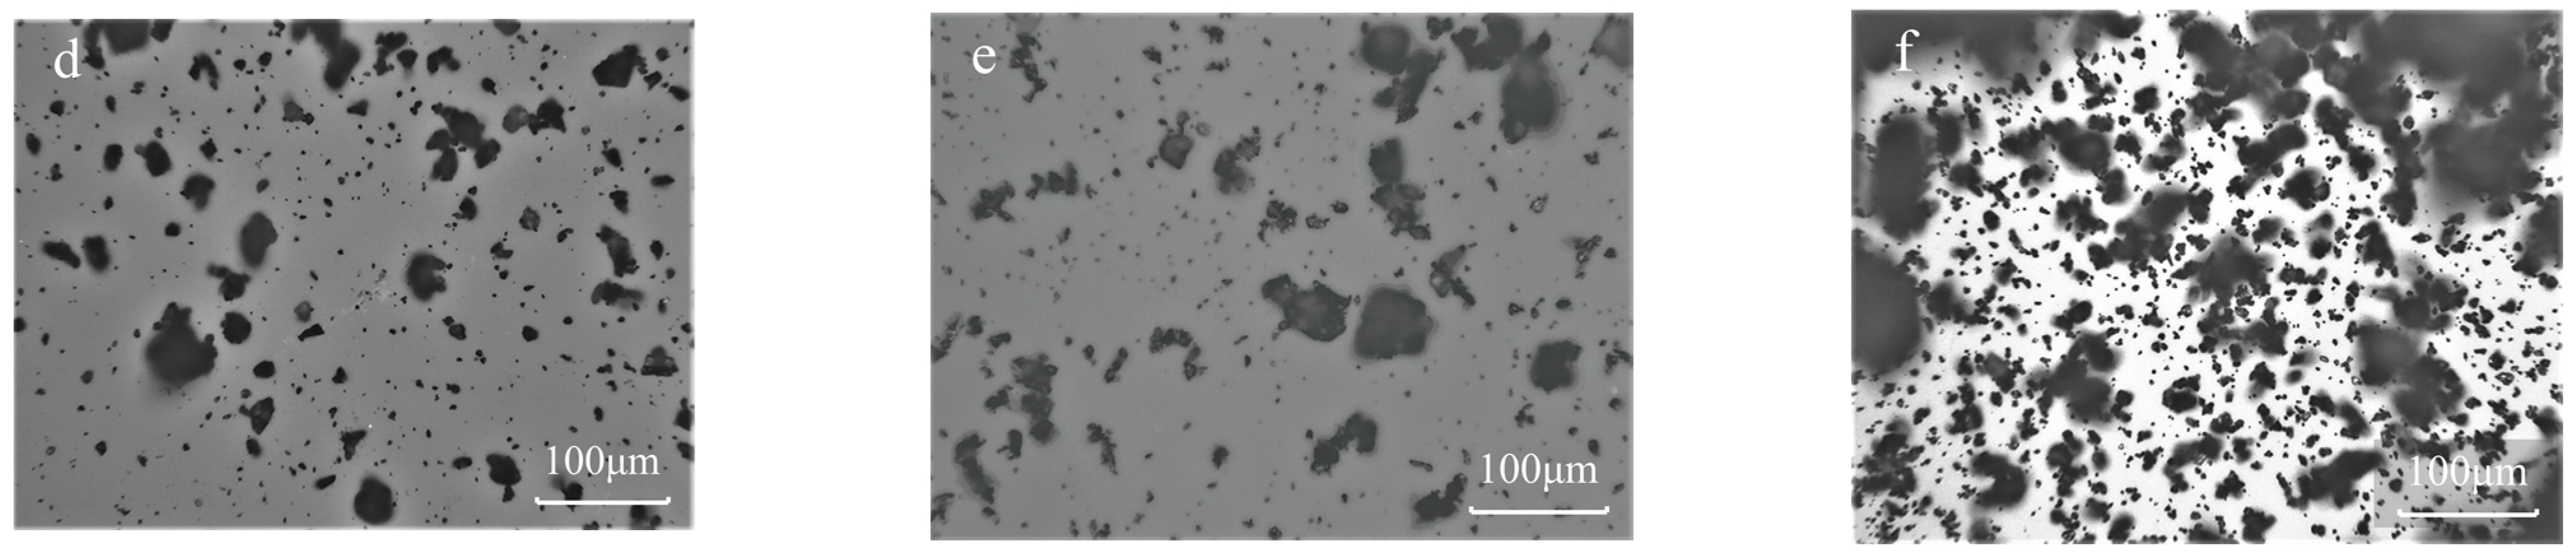
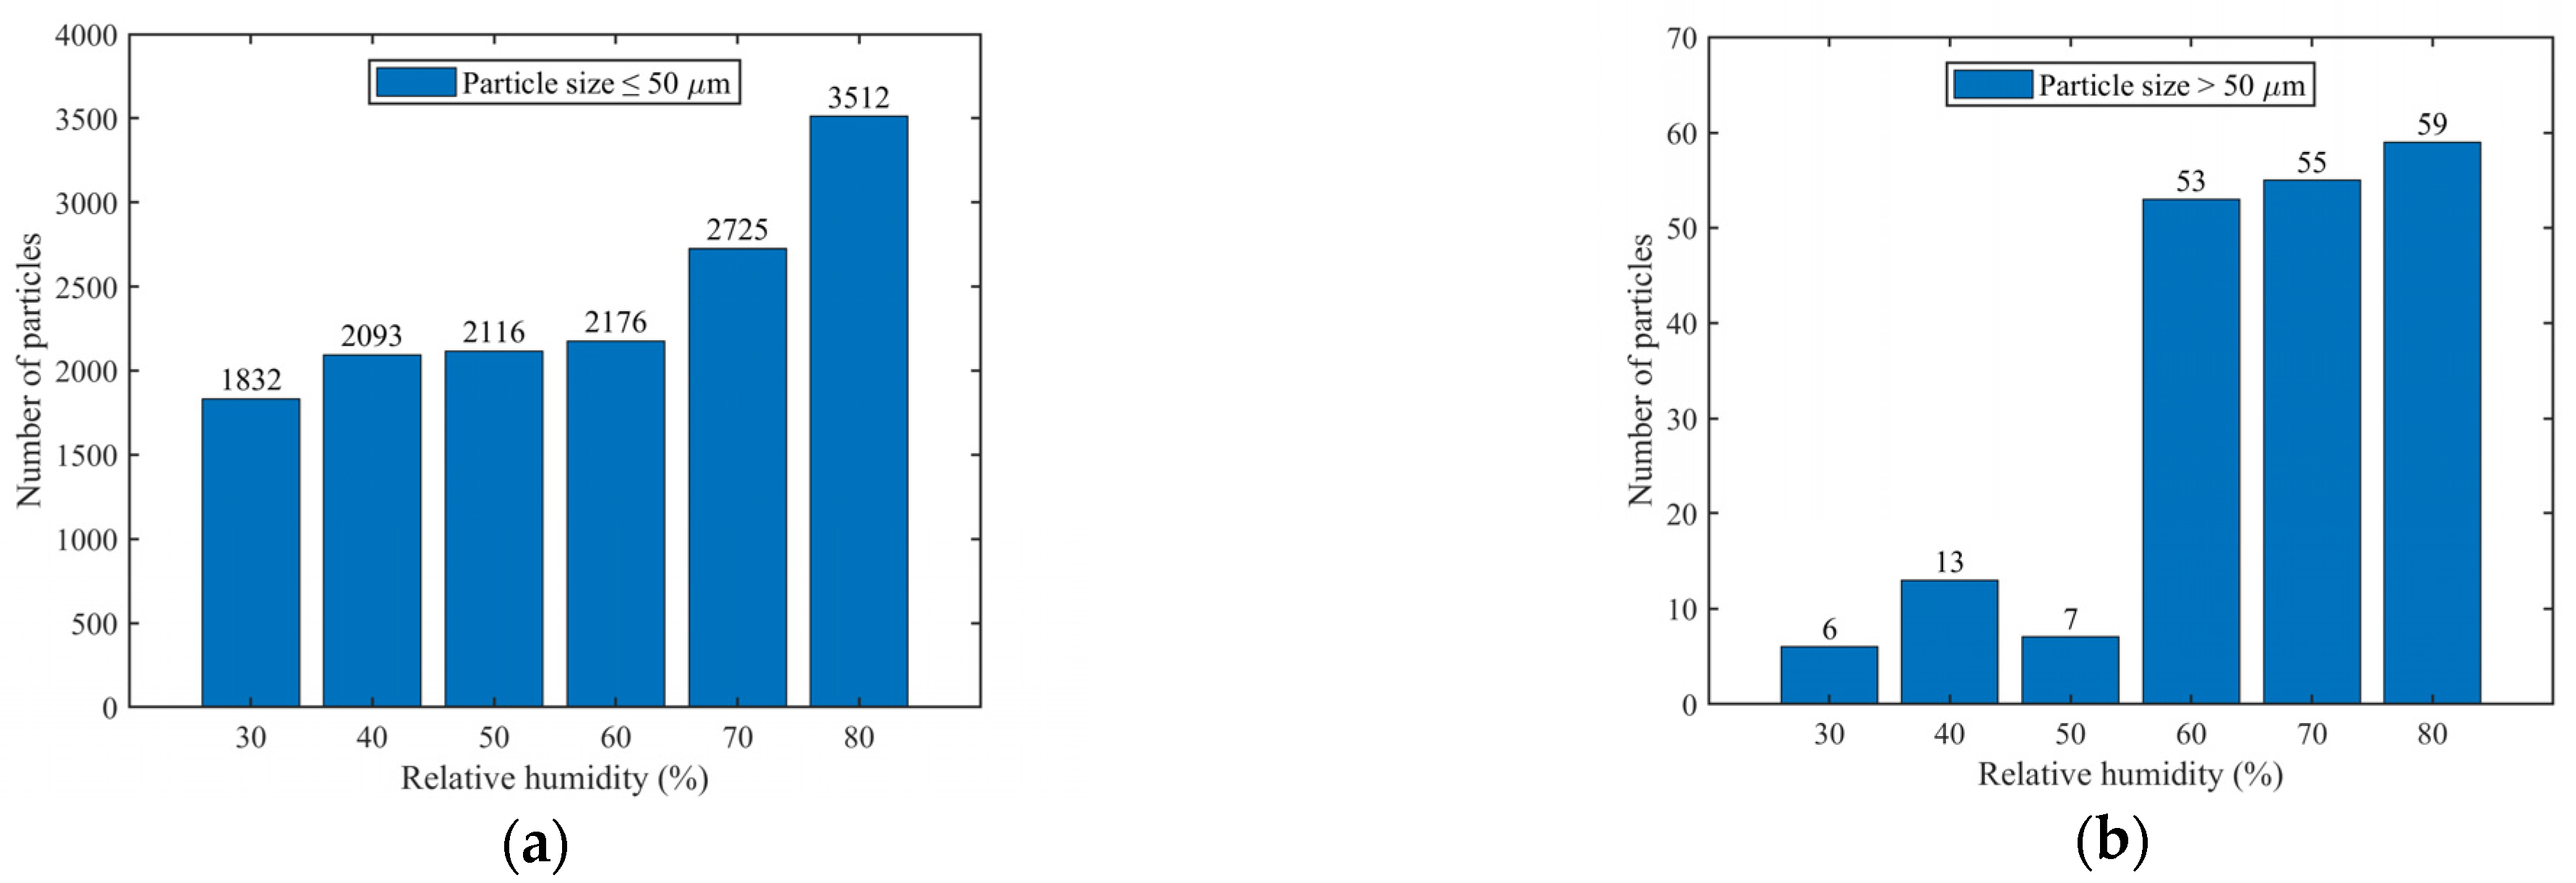
4.3. Effect of RH on the Number of Particles and Particle Size Distribution of Coal Dust Adhesion

Based on the study of the adhesion force between individual coal dust particles and fused silica, the adhesion of bulk coal dust to the surface of fused silica was investigated. A coal dust adhesion test was conducted using the experimental platform shown in Figure 4, and the status of the coal dust adhered to the surface of fused silica glass was observed using an optical microscope. Figure 11a–f show the optical microscope images of coal dust adhered to the surface of fused silica samples at different RH levels of 30%, 40%, 50%, 60%, 70%, and 80%, respectively, with the concentration of coal dust in the range of 20–100 mg/m3. It is observed that the density of coal dust adhering to the fused silica sample gradually increased with the increase in RH. Comparing Figure 11d–f with Figure 11a–c, it is inferred that larger-sized coal dust particles adhered to the surface of the fused silica glass more easily at higher RH. The total amount of coal dust that adhered to the fused silica surface and the number of large-sized particles reached a maximum when the humidity was 80%.
The optical images were analyzed using OLYCIA m3 image processing software to obtain the data on the number of adhered particles and the size distribution on the surface of fused silica at different RH values. The variation in the number of adhered particles per square millimeter with the increase in RH is shown in Figure 12. It is observed that the amount of adhered coal dust increases with increasing RH. As discussed above, the adhesion force increases with RH (Figure 9), and this consequently leads to an increase in the number of particles on the fused silica surface (Figure 12). The trend in the variation in adhesion force with RH for a single dust particle (Figure 9) is similar to the number of adhesions for a large number of particles (Figure 12).
The particle size distribution of coal dust attached to the fused silica glass surface under different humidity conditions is shown in Figure 13. Figure 13a,b illustrate the relationship between RH and the quantity of coal dust particles of sizes smaller than 50 μ m (referred to as small particle size) and larger than 50 μ m (referred to as large particle size), respectively. It is clearly seen that the number of small-sized coal dust particles adhering to the fused silica surface is much larger than that of large-sized particles at all levels of humidity. Figure 13b also indicates a significant increase in the quantity of large-sized particles at a RH greater than 60%. The number of large-sized particles adhering to the fused silica surface at RHs of 60%, 70%, and 80% was approximately 10 times higher as compared to that at RHs of 30%, 40%, and 50%. These findings suggest that increased RH promotes an increase in the quantity of large-sized coal dust particles adhering to the fused silica surface. This is attributed to the enhanced attractive forces between the coal dust particles and fused silica in environments of high humidity.
Figure 14 shows a schematic of the forces acting on coal dust when it adheres to fused silica glass. The adherence of coal dust to the surface of the sample depends on the relationship between the magnitudes of the gravitational and frictional forces. The frictional force ( F f ) between coal dust and fused silica is given below:
F f = μ × F a d
where μ denotes the friction factor and Fad represents the total adhesion force. Based on the above discussion, the adhesion force is expressed as the sum of the van der Waals and capillary forces, as given below:
F a d = F v d w + F c
According to Equations (1) and (2), the van der Waals and capillary forces are directly proportional to the particle size R; hence, the total adhesion force depends on R. However, gravitational force is proportional to the cube of the particle radius (R3). As the size of the coal dust particles increases, the increase in gravitational force is much faster than that of the adhesion force; therefore, it is more difficult for large-sized particles to adhere to the surface. This explains why the number of small-sized particles adhering to the surface is in larger proportion.
As shown in Figure 9, the adhesion between coal dust particles and fused silica increases with humidity. It is seen from Equation (6) that an increase in adhesion leads to an increase in the frictional force between the particles and fused silica glass, which further leads to the increased adhesion of large-sized particles. This explains the reason for the significant increase in the adherence of large-sized coal dust particles when the RH exceeds 60%.

5. Conclusions

To reduce the amount of coal dust adhering to camera lenses, the adhesion behavior of underground coal dust with fused silica was studied. The experiments were conducted from microscopic and statistical points of view using AFM and a home-made adhesion experimental platform, respectively. The effects of RH, roughness of particles, and particle size on the adhesion behavior were discussed. The following conclusions were drawn:
(1)
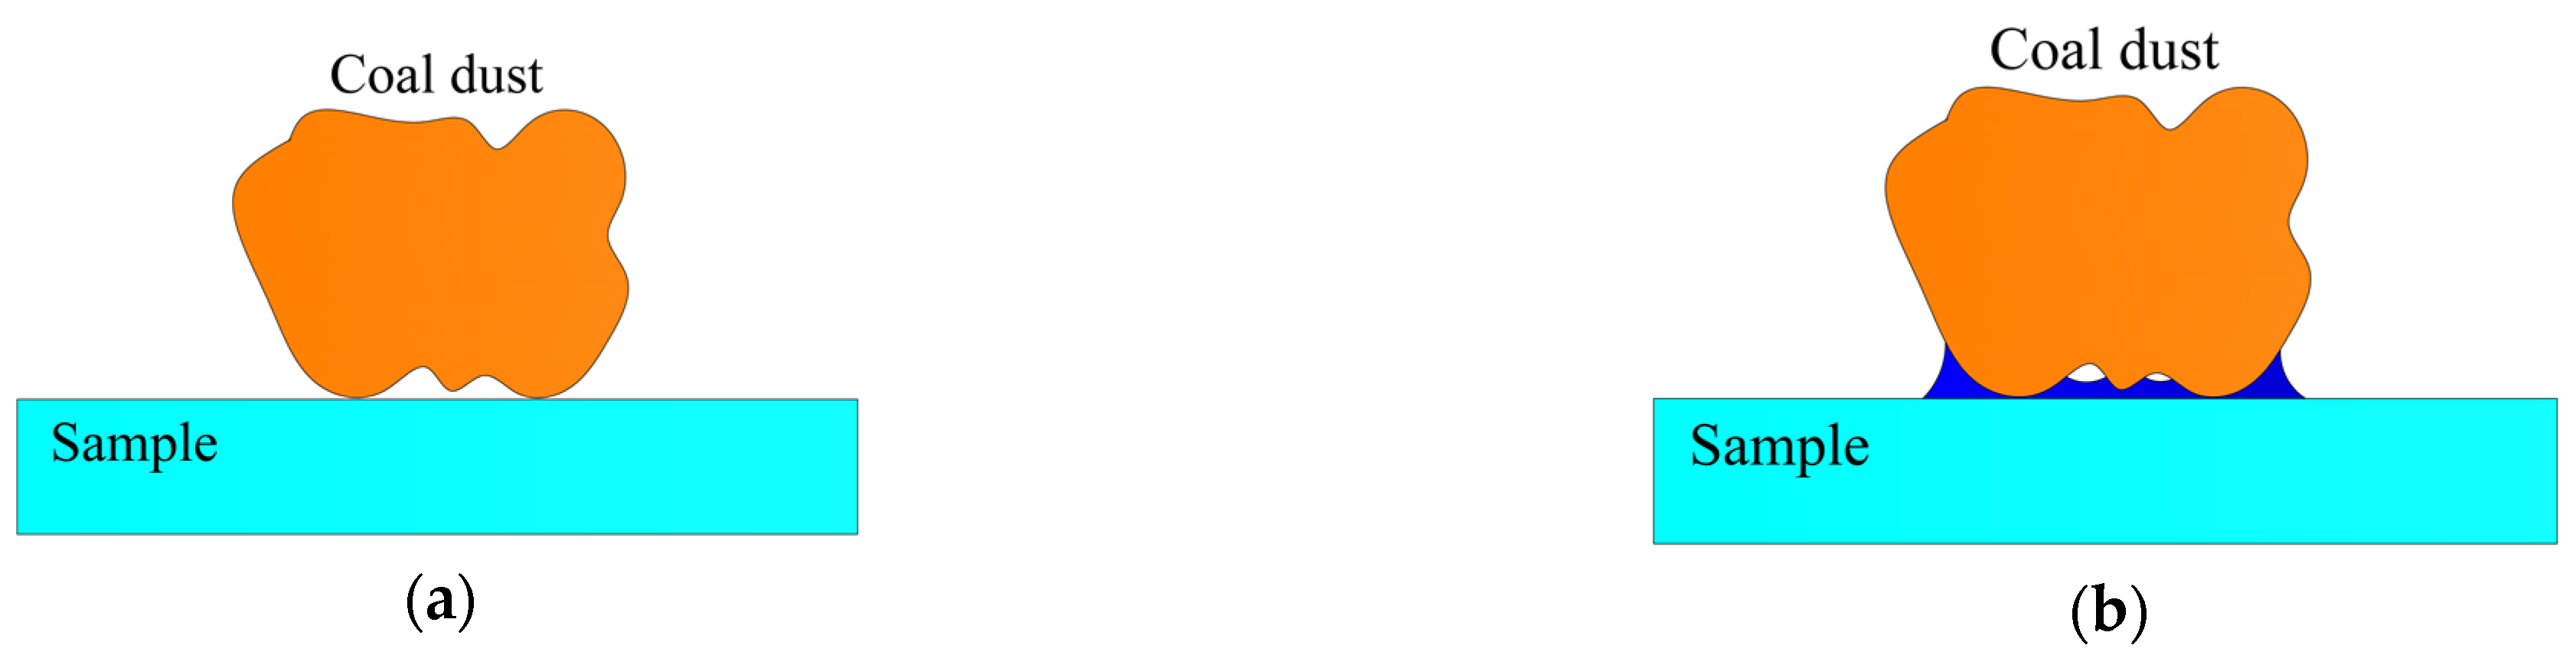
The adhesion forces in this study consisted mainly of van der Waals and capillary forces. The adhesion force increased with increasing RH; adhesion was dominated by van der Waals forces at a lower RH and capillary forces at a higher RH. The amount of coal dust adhering to the fused silica surface increased with RH due to the increase in adhesion force.
(2)
As the size of the coal dust particles increases, the increase in gravitational force is much faster than that of the adhesion force, which made the particles with larger size less prone to adhering. Therefore, the coal dust adhering to the surface of fused silica was dominated by small-sized (lesser than 50 μm) particles.
(3)
The proportion of large-sized (larger than 50 μm) particles adhering to the surface increased with the increase in RH. This is due to the increase in the adhesion force with RH, which leads to an increase in the frictional force between the particles and fused silica glass, allowing the particles with larger size to adhere.
(4)
Due to the irregular shape and rough surface of the coal dust, the actual contact area between the coal dust and the fused silica is greatly reduced, resulting in the theoretical values of the van der Waals forces and capillary forces being much larger than the experimental values.
Based on the above conclusions, humidity was found to be the key factor affecting coal dust adhesion. As the underground coal mine environment tends to be highly humid, methods to mitigate the adhesion of coal dust to glass surfaces may be explored from the perspective of the interaction between coal dust, glass, and water. This will be the focal point of our study in the future.

Author Contributions

Conceptualization, S.Z.; Methodology, S.Z., Y.Y. and H.S.; Investigation, S.Z. and Y.Y.; Writing—original draft, S.Z. and Y.Y.; Writing—review & editing, S.Z., Y.Y. and H.S.; Supervision, S.Z.; Project administration, S.Z.; Funding acquisition, S.Z. All authors have read and agreed to the published version of the manuscript.

Funding

This research was funded by National Natural Science Foundation of China (grant number 51905535) and the Fundamental Research Funds for the Central Universities grant number 2023ZKPYJD01.

Data Availability Statement

Data are contained within the article.

Conflicts of Interest

The authors declare no conflict of interest.

References

  1. Dávila-Pulido, G.I.; González-Ibarra, A.A.; Garza-García, M. A brief review on coal reserves, production and possible non-power uses: The case of Mexico. Heliyon 2023, 9, e16043. [Google Scholar] [CrossRef] [PubMed]
  2. Wang, X.P.; Zhang, Z.M.; Guo, Z.H.; Su, C.; Sun, L.H. Energy structure transformation in the context of carbon neutralization: Evolutionary game analysis based on inclusive development of coal and clean energy. J. Clean. Prod. 2023, 398, 136626. [Google Scholar] [CrossRef]
  3. Kang, H.; Gao, F.; Xu, G.; Ren, H. Mechanical behaviors of coal measures and ground control technologies for China’s deep coal mines-A review. J. Rock Mech. Geotech. Eng. 2023, 15, 37–65. [Google Scholar] [CrossRef]
  4. Wang, G.; Xu, Y.; Ren, H. Intelligent and ecological coal mining as well as clean utilization technology in China: Review and prospects. Int. J. Min. Sci. Technol. 2019, 29, 161–169. [Google Scholar] [CrossRef]
  5. Qian, J.; Liu, Z.; Lin, S.; Liu, H.; Ali, M.; Kim, W. Re-explosion hazard potential of solid residues and gaseous products of coal dust explosion. Adv. Powder Technol. 2023, 34, 104129. [Google Scholar] [CrossRef]
  6. Ji, Y.; Ren, T.; Wynne, P.; Wan, Z.; Ma, Z.; Wang, Z. A comparative study of dust control practices in Chinese and Australian longwall coal mines. Int. J. Min. Sci. Technol. 2016, 26, 199–208. [Google Scholar] [CrossRef]
  7. Gao, M.; Li, H.; Zhao, Y.; Liu, Y.; Zhou, W.; Li, L.; Xie, J.; Deng, J. Mechanism of micro-wetting of highly hydrophobic coal dust in underground mining and new wetting agent development. Int. J. Min. Sci. Technol. 2023, 33, 31–46. [Google Scholar] [CrossRef]
  8. Xi, Z.; Xia, T.; Shen, L.; Suo, L. Synthesis of cardanol grafted hydrophilic polymers and its mechanism of coal dust inhibition. Fuel 2023, 345, 128112. [Google Scholar] [CrossRef]
  9. Moutinho, H.; Jiang, C.-S.; To, B.; Perkins, C.; Muller, M.; Al-Jassim, M.; Simpson, L. Adhesion mechanisms on solar glass: Effects of relative humidity, surface roughness, and particle shape and size. Sol. Energy Mater. Sol. Cells 2017, 172, 145–153. [Google Scholar] [CrossRef]
  10. Quan, Y.; Zhang, L. Experimental investigation of the anti-dust effect of transparent hydrophobic coatings applied for solar cell covering glass. Sol. Energy Mater. Sol. Cells 2017, 160, 382–389. [Google Scholar] [CrossRef]
  11. Ermis, E.; Farnish, R.J.; Berry, R.J.; Bradley, M.S.A. Centrifugal tester versus a novel design to measure particle adhesion strength and investigation of effect of physical characteristics (size, shape, density) of food particles on food surfaces. J. Food Eng. 2011, 104, 518–524. [Google Scholar] [CrossRef]
  12. Petean PG, C.; Aguiar, M.L. Determining the adhesion force between particles and rough surfaces. Powder Technol. 2015, 274, 67–76. [Google Scholar] [CrossRef]
  13. Ma, W.B.; Qi, C.L.; Liu, Q.; Ding, Y.H.; Zhu, W. Adhesion force measurements between deep-sea soil particles metals by in situ AFM. Appl. Clay Sci. 2017, 148, 118–122. [Google Scholar] [CrossRef]
  14. Ma, W.; Li, J.; Cai, Q.; Zhu, W.; Yang, C.; Guo, S. Influence of surface roughness on the adhesion force between the titanium plate and deep-sea sediment. Mar. Georesour. Geotechnol. 2021, 39, 1516–1524. [Google Scholar] [CrossRef]
  15. Sun, Q.; Peng, W.; Hai, X.; Yu, S. Adhesion study between micron-scale graphite particles and rough walls using the finite element method. Adv. Powder Technol. 2021, 32, 1951–1962. [Google Scholar] [CrossRef]
  16. Tan, C.L.C.; Gao, S.; Wee, B.S.; Asa-Awuku, A.; Thio, B.J.R. Adhesion of Dust Particles to Common Indoor Surfaces in an Air-Conditioned Environment. Aerosol Sci. Technol. 2014, 48, 541–551. [Google Scholar] [CrossRef]
  17. Bowling, R.A. A theoretical review of partical adhesion. In Particles on Surfaces 1; Springer: Boston, MA, USA, 1988. [Google Scholar]
  18. Rimai, D.S.; DeMejo, L.P. Physical Interactions Affecting the Adhesion of Dry Particles. Annu. Rev. Mater. Sci. 1996, 26, 21–41. [Google Scholar] [CrossRef]
  19. Walton, O.R. Review of Adhesion Fundamentals for Micron-Scale Particles. KONA Powder Part. J. 2008, 26, 129–141. [Google Scholar] [CrossRef]
  20. Gao, T.; Ye, J.; Zhang, K.; Liu, X.; Zhang, Y.; Liu, K. Role of capillary adhesion in the friction peak during the tacky transition. Friction 2022, 10, 1208–1216. [Google Scholar] [CrossRef]
  21. Isaifan, R.J.; Johnson, D.; Ackermann, L.; Figgis, B.; Ayoub, M. Evaluation of the adhesion forces between dust particles and photovoltaic module surfaces. Sol. Energy Mater. Sol. Cells 2019, 191, 413–421. [Google Scholar] [CrossRef]
  22. Cleaver, J.A.S.; Tyrrell, J.W.G. The Influence of Relative Humidity on Particle Adhesion-a Review of Previous Work and the Anomalous Behavior of Soda-lime Glass. KONA Powder Part. J. 2004, 22, 9–22. [Google Scholar] [CrossRef]
  23. Fukunishi, A.; Mori, Y. Adhesion force between particles and substrate in a humid atmosphere studied by atomic force microscopy. Adv. Powder Technol. Int. J. Soc. Powder Technol. Jpn. 2006, 17, 567–580. [Google Scholar] [CrossRef]
  24. Jones, R.; Pollock, H.M.; Cleaver, J.A.; Hodges, C.S. Adhesion Forces between Glass and Silicon Surfaces in Air Studied by AFM: Effects of Relative Humidity, Particle Size, Roughness, and Surface Treatment. Langmuir 2002, 18, 8045–8055. [Google Scholar] [CrossRef]
  25. Xiao, X.; Qian, L. Investigation of Humidity-Dependent Capillary Force. Langmuir 2000, 16, 8153–8158. [Google Scholar] [CrossRef]
  26. Chau, A.; Régnier, S.; Delchambre, A.; Lambert, P. Theoretical and experimental study of the influence of AFM tip geometry and orientation on capillary force. J. Adhes. Sci. Technol. 2010, 24, 2499–2510. [Google Scholar] [CrossRef]
  27. Xia, W.; Ni, C.; Xie, G. The influence of surface roughness on wettability of natural/gold-coated ultra-low ash coal particles. Powder Technol. 2016, 288, 286–290. [Google Scholar] [CrossRef]
  28. Johnson, K.L.; Kendall, K.; Roberts, A.D. Surface Energy and the Contact of Elastic Solids. Proc. R. Soc. Lond. A Math. Phys. Sci. 1971, 324, 301–313. [Google Scholar]
  29. Derjaguin, B.V.; Muller, V.M.; Toporov, Y.P. Effect of contact deformations on the adhesion of particles. J. Colloid Interface Sci. 1975, 53, 314–326. [Google Scholar] [CrossRef]
  30. Heim, L.-O.; Blum, J.; Preuss, M.; Butt, H.-J. Adhesion and Friction Forces between Spherical Micrometer-Sized Particles. Phys. Rev. Lett. 1999, 83, 3328–3331. [Google Scholar] [CrossRef]
  31. Popov, V.L.; Li, Q.; Lyashenko, I.A.; Pohrt, R. Adhesion and friction in hard and soft contacts: Theory and experiment. Friction 2021, 9, 1688–1706. [Google Scholar] [CrossRef]
  32. Rimai, D.S.; Demejo, L.P.; Bowen, R.C. Mechanics of particle adhesion. J. Adhes. Sci. Technol. 1994, 8, 1333–1355. [Google Scholar] [CrossRef]
  33. Wang, Z.; Liu, X. Model for an elastic-plastic spherical contact with the DMT adhesion. J. Adhes. Sci. Technol. 2023, 1–12. [Google Scholar] [CrossRef]
  34. Winterton, R.H.S. Van der Waals forces. Contemp. Phys. 1970, 11, 559–574. [Google Scholar] [CrossRef]
  35. Rabinovich, Y.I.; Adler, J.J.; Esayanur, M.S.; Ata, A.; Singh, R.K.; Moudgil, B.M. Capillary forces between surfaces with nanoscale roughness. Adv. Colloid Interface Sci. 2002, 96, 213–230. [Google Scholar] [CrossRef] [PubMed]
  36. Bergström, L. Hamaker constants of inorganic materials. Adv. Colloid Interface Sci. 1997, 70, 125–169. [Google Scholar] [CrossRef]
  37. Brambilla, S.; Speckart, S.; Brown, M.J. Adhesion and aerodynamic forces for the resuspension of non-spherical particles in outdoor environments. J. Aerosol Sci. 2017, 112, 52–67. [Google Scholar] [CrossRef]
  38. Wang, J.; Qian, J.; Gao, H. Effects of Capillary Condensation in Adhesion between Rough Surfaces. Langmuir 2009, 25, 11727–11731. [Google Scholar] [CrossRef] [PubMed]
Figure 1. Schematic of liquid bridge between a particle and flat surface.
Processes 12 00735 g001
Figure 2. SEM images of modified probes ((a) Tip1 probe, (b) Tip2 probe).
Processes 12 00735 g002
Figure 3. Setup of in situ AFM humidity device.
Processes 12 00735 g003
Figure 4. Schematic of coal dust adhesion experimental platform.
Processes 12 00735 g004
Figure 5. Schematic of nine positions of image capture.
Processes 12 00735 g005
Figure 6. Adhesion measurement process and force curves. (a) Schematic of the adhesion measurement process. (b) Typical adhesion force–displacement curve.
Processes 12 00735 g006
Figure 7. Adhesion forces of Tip1 probe on fused silica glass surface at different humidities. (a) RH20%, (b) RH40%, (c) RH60%, and (d) RH80%.
Processes 12 00735 g007aProcesses 12 00735 g007b
Figure 8. Histogram of adhesion distribution for Tip1 probe on fused silica glass surface. (a) RH20%, (b) RH40%, (c) RH60%, and (d) RH80%.
Processes 12 00735 g008
Figure 9. Adhesion force between coal dust particles of different sizes and surface of fused silica glass at different humidities.
Processes 12 00735 g009
Figure 10. Evolution of liquid bridge in the interface with increasing RH. (a) Low humidity. (b) High humidity.
Processes 12 00735 g010
Figure 11. Optical microscope images of coal dust adhesion to the surface of fused silica sample for different humidities at coal dust concentration of 20–100 mg/m3. (a) RH30%, (b) RH40%, (c) RH50%, (d) RH60%, (e) RH70%, and (f) RH80%.
Processes 12 00735 g011aProcesses 12 00735 g011b
Figure 12. Number of coal dust particles adhering to the surface of fused silica at different values of RH.
Processes 12 00735 g012
Figure 13. Distribution of adhered coal dust on the surface of fused silica samples at different humidities. (a) Particle size less than 50 μm. (b) Particle size greater than 50 μm.
Processes 12 00735 g013
Figure 14. Schematic of forces acting on coal dust particles.
Processes 12 00735 g014
Table 1. Element content of coal dust on Tip1 and Tip2.
CaseElement Content (At%)
COSiAlS
Tip164.0229.373.682.750.18
Tip265.2028.403.902.220.28
Table 2. Theoretical values of van der Waals forces for Tip1 and Tip2.
CaseForce (nN)
Tip1 (11.39 μm)Tip2 (44.36 μm)
Dry air16256331
Humid air203790
Table 3. Theoretical values of capillary forces.
RH (%)Force (nN)
Tip1 (11.39 μm)Tip2 (44.36 μm)
6011934649
7017936982
8023189026
Disclaimer/Publisher’s Note: The statements, opinions and data contained in all publications are solely those of the individual author(s) and contributor(s) and not of MDPI and/or the editor(s). MDPI and/or the editor(s) disclaim responsibility for any injury to people or property resulting from any ideas, methods, instructions or products referred to in the content.

